Embed Size (px)
Citation preview
Cedar Woods Properties Limited
2015 Annual ReportABN 47 009 259 081

2
About Cedar Woods
Cedar Woods Properties Limited is an Australian property development company. The company was established in 1987 and has been listed on the Australian Securities Exchange since 1994, trading under the security code ‘CWP’. Its market capitalisation is approximately $400m.
The company’s principal interests are in urban land subdivision and built form development for residential, commercial and retail purposes. Its portfolio of assets is located in Western Australia, Victoria and Queensland. The board and management of Cedar Woods have extensive experience in the property industry, with particular expertise in adding value to land holdings through the achievement of government and local authority approvals and the planning, design and delivery process.
Cedar Woods has consistently generated profits and dividends for shareholders, whilst achieving excellence in product delivery, as recognised by several national awards and many state awards, including the categories “Best Residential Estate” and “Environmental Excellence” and most recently, “Best High Density Development”. In the investor relations arena, the company is a past winner of three ARA silver awards for its Annual Report.
Cedar Woods’ projects are sensitively developed with consideration for environmental and community interests and built to a high quality that is renowned in the marketplace. Through the rapid expansion of its built form development portfolio, Cedar Woods has earned a reputation of delivering high quality apartments for both the owner-occupier and investor market.
The company has a strong focus on shareholder value and its record in delivering quality developments to the market has produced a strong earnings stream, providing consistently high returns to shareholders.
Downloadable contentCedar Woods Properties has taken the opportunity to publish the Corporate Governance statement on its website rather than include in the annual report. A copy of the 2015 Corporate Governance statement can be downloaded from the investor relations section of the website. www.cedarwoods.com.au
Other information that is available in the investor relations section is listed below.
• Board Committee Charters
• Risk Management Policy and Internal Compliance and Control System
• Investor Communications Policy
• Continuous Disclosure Policy
• Performance Evaluation Policy
• Privacy Policy
• Primary Objectives and Company Code of Conduct
• Securities Trading Policy
• Diversity Policy
Sustainability Reports are available on our website in the Shareholder Reports section.
CEDAR WOODS PROPERTIES LIMITED

Tabl
e of
Con
tent
s
2015 ANNUAL REPORT
3
Table of Contents
Cedar Woods’ Charter ....................................................................................................................................................... 5
Our Business Model .......................................................................................................................................................... 7
Financial and Operating Review ......................................................................................................................................... 8
Project Pipeline as at 30 June 2015 ................................................................................................................................. 14
Environmental and Social Governance ............................................................................................................................. 16
Directors’ Report ............................................................................................................................................................. 20
Directors’ Report: Chair of the Human Resources and Remuneration Committee’s Letter to Shareholders ...................... 24
Directors’ Report: Remuneration Report .......................................................................................................................... 26
Auditor’s Independence Declaration ................................................................................................................................. 42
Financial Statements .................................................................................................................................................... 44
Consolidated Statement of Profit or Loss and Other Comprehensive Income .................................................................. 45
Consolidated Balance Sheet ............................................................................................................................................ 46
Consolidated Statement of Changes in Equity ................................................................................................................. 47
Consolidated Cash Flow Statement ................................................................................................................................. 48
Notes to the Financial Statements ............................................................................................................................. 49
Section A: How the Numbers are Calculated ............................................................................................................ 50
A1. Profit or Loss Information ........................................................................................................................................ 51
A2. Financial Assets and Financial Liabilities .................................................................................................................. 53
A3. Non-Financial Assets and Liabilities ........................................................................................................................ 58
A4. Equity ..................................................................................................................................................................... 64
A5. Cash Flow Information ............................................................................................................................................ 66
Section B: Financial Risks ........................................................................................................................................... 67
B1. Significant Estimates and Judgements .................................................................................................................... 68
B2. Financial Risk Management .................................................................................................................................... 69
B3. Capital Management Objectives and Gearing ........................................................................................................ 74
Section C: Group Structure ......................................................................................................................................... 76
C1. Interests in Other Entities ........................................................................................................................................ 77
Section D: Unrecognised Items .................................................................................................................................. 80
D1. Contingent Liabilities ............................................................................................................................................... 81
D2. Commitments ......................................................................................................................................................... 82
D3. Events Occurring After the Reporting Period ........................................................................................................... 83
Section E: Other Information ....................................................................................................................................... 84
E1. Related Party Transactions ..................................................................................................................................... 85
E2. Remuneration of Auditors ....................................................................................................................................... 86
E3. Employee Share Scheme ........................................................................................................................................ 87
E4. Summary of Accounting Policies ............................................................................................................................. 88
E5. Segment Information .............................................................................................................................................. 96
E6. Parent Entity Financial Information .......................................................................................................................... 97
Section F: Declaration and Independent Auditor’s Report ....................................................................................... 98
F1. Directors’ Declaration ............................................................................................................................................. 99
F2. Independent Auditor’s Report to the Members of Cedar Woods Properties Limited .............................................. 100
Section G: Shareholders’ Information ...................................................................................................................... 102
G1. Investors Summary ............................................................................................................................................... 103
G2. Five Year Financial Performance ............................................................................................................................ 106
Corporate Directory ....................................................................................................................................................... 107
4

2015
Ann
ual R
epor
t
5
2015 ANNUAL REPORT
Cedar Woods’ Charter
We are Cedar Woods Properties, an ASX 300 company with a proud history of creating communities across Australia through high-quality property development.
Our purpose is to create long-term value for our shareholders through the disciplined acquisition, development and marketing of properties that meet the needs of our customers.
A significant part of our business involves creating vibrant residential communities, typically in capital city growth corridors, with supporting retail and commercial developments. We are also active in the redevelopment of major infill sites where we deliver medium and high density residential dwellings.
We are guided by four key values. They act as critical drivers of Cedar Woods’ culture.
Integrity
• Do what is right and do what we say we will do.
• Uphold honesty, truthfulness and sincerity whilst remaining fair and ethical with all stakeholders.
Performance
• Meet or exceed the expectations of stakeholders, communities, customers and suppliers.
• Maintain a strong financial position to allow us to be competitive and engage in opportunities when they arise.
Innovation
• Strive to create and deliver new products to develop and grow as a business.
• Foster a culture that encourages learning, new ideas and rewards creativity.
People and Environment
• Make positive contributions to communities in which we operate.
• Attract, develop and retain the best talent for our business, challenging our people, demonstrating a can do attitude and fostering a collaborative and mutually supportive environment.
Our strategy is to grow and develop our national project portfolio, diversified by geography, product type and price point, so that it continues to hold broad customer appeal and performs well in a range of market conditions.
Our customers are influenced by interest rates, the economic outlook and Government policies. Demand in the metropolitan and regional markets in which we operate is uneven and fluctuates in response to these factors.
Against this backdrop, we manage our portfolio with the aim of delivering consistent annual growth in profits and dividends.
2015 ANNUAL REPORT

6

Our
Bus
ines
s M
odel
7
2015 ANNUAL REPORT
Our Business Model
To grow and develop a national portfolio, diversified by geography, product type and price point, so that it continues to hold broad customer appeal and performs well in a range of market conditions:
Property Acquisitions
Disciplined approach to acquisitions
Identify projects that meet closely defines criteria
Assess prospects in line with corporate strategy and financial targets
Structure contracts to minimise risks and optimise exposure (including JVs)
Positioning projects to meet demand
Generate pre-sales to underwrite stages of projects
Ongoing monitoring of sales conditions and buyer groups
Efficient settlement management
Research, design, planning and delivery
Designs to meet agreed project vision
Achieve required approvals
Ongoing market research and assessment of designs to meet financial and non-financial objectives
Manage construction within annual budget, cost and timeframe
Development Marketing & Sales

Fina
ncia
l and
Ope
ratin
g R
evie
w
CEDAR WOODS PROPERTIES LIMITED
8
Financial and Operating Review
On behalf of the Board, we are pleased to present the financial and operating review of Cedar Woods Properties Limited to shareholders.
The following summarises the results of operations during the year and the financial position of the consolidated entity at 30 June 2015:
a) 2015 Financial Highlights
• Record net profit of $42,585,000, up 6 per cent;
• full year dividends of 28 cents per share, up 2 per cent;
• strong result from the Masters store sale process;
• earnings per share of 54.3 cents, down 0.1 per cent;
• low level of bank debt;
• strong interest cover;
• $135,000,000, three year corporate bank facility extended to November 2017.
b) Growth in Net Profit After Tax (NPAT) and Dividends Paid
Cedar Woods has a track record of growth over the past five years with Net Profit after Tax growing from $17.2m in FY10 to $42.6m in FY15 and dividends declared growing from 13 cents to 28 cents per share.
FY10
45
40
35
30
25
20
15
10
5
0
30
25
20
15
10
5
0FY12 FY14FY11
NPAT and Dividends paid for the past 6 years
$ M
illio
ns
Cen
ts
Net Profit After Tax Dividends Paid
FY13 FY15

Fina
ncia
l and
Ope
ratin
g R
evie
w
9
2015 ANNUAL REPORT
c) 2015 Financial Results Summary
Year ended 30 June 2015$’000
2014$’000 % Change
Revenue 178,637 214,465 (16.7%)
Proceeds from Masters store sale 36,000 - -
Total revenue and proceeds from property sales 214,637 214,465 -
Net profit after tax 42,585 40,313 5.6%
Total assets 383,330 409,948 (6.5%)
Net bank debt 27,909 32,602 (14.4%)
Shareholders’ equity 285,605 261,601 9.2%
d) Key Performance Indicators
Year ended 30 June 2015 2014 % Change
Basic earnings per share ¢ 54.3 54.4 (0.1)
Dividends per share – fully franked ¢ 28.0 27.5 1.8
Return on equity % 14.9 15.4 (0.5)
Return on capital % 19.5 19.1 0.4
Total shareholder return (1 year) % (24.3) 46.6 (70.9)
Net bank debt to equity – 30 June % 9.8 12.5 (2.7)
Interest cover x 9.9 10.4 (4.8)
Net asset backing per share – historical cost $ 3.62 3.34 8.4
Shares on issue – end of year ’000 78,892 78,336 0.7
Stock market capitalisation at 30 June $’000 414,970 572,639 (27.5)
Share price at 30 June $ 5.26 7.31 (28.0)
e) Financial Year Overview
Against the backdrop of a weakening resource economy in Western Australia and a burgeoning property market in the eastern states, the company continued to make steady progress in the 2015 financial year. In the first half, the company celebrated 20 years as a listed company with corporate events held in Melbourne, Brisbane and Perth to mark this significant anniversary. The company also achieved completion of its second commercial development at the Williams Landing Town Centre in Melbourne, with the opening of the Williams Landing Shopping Centre in December 2014.
In the second half, following its election victory, the newly elected Queensland Government announced that it would conduct a call in (review) of the Brisbane City Council’s development approval of the company’s Upper Kedron project in Brisbane. This generated significant media interest and investor uncertainty, however in July 2015 the Queensland Government handed down its decision clearing the way for the company to commence development of this project in the 2016 financial year. At the end of the half, the company completed the sale of the Masters Home Improvement Store at Williams Landing as part of the company’s strategy to recycle capital on completed and mature developments at the Williams Landing Town Centre.
During the year, significant progress was made with stages developed across the company’s property portfolio of active projects. In addition, plans and approvals were progressed for a number of developments anticipated to commence in future years, with important planning milestones achieved at Mangles Bay and Ariella (WA), Jackson Green and St Albans (VIC), and more recently Upper Kedron (QLD). Further details of achievements in the property portfolio follow in the next section.
The year closed with a record full year net profit of $42.6m, being the fifth consecutive year of record profit and earnings, allowing the Board to declare a record full year dividend of 28.0 cents per share.
As a result, earnings per share for FY2015 was 54.3 cents, a small decrease of 0.1 per cent on the previous year, reflecting the dilution brought about by the equity raising late in the last financial year.
Return on equity of 14.9 per cent and return on capital of 19.5 per cent were well above the company’s benchmarks of 12 per cent and 14 per cent respectively.
The 1 year total shareholder return was -24.3%. Despite the record profit, the company’s share price was impacted by the call in of the Upper Kedron project (concluded after the end of the financial year) and the negative market sentiment towards WA exposed companies.

Fina
ncia
l and
Ope
ratin
g R
evie
w
CEDAR WOODS PROPERTIES LIMITED
10
f) Operational Review of Developments
Dwelling sector indicators across the nation point to sustained demand for housing supply spurred by low interest rates, with the HIA economics group forecasting annual dwelling starts will increase by 18% in FY2015. Although this will be the peak year in the cycle, solid demand is forecast to continue with FY2016 expected to be the second highest year on record. The strong inbound migration and a shortage of supply continue to provide the underlying fundamentals to support demand for residential property.
In Victoria demand remains strong for well located property close to transport infrastructure and other amenities, with investor activity remaining high. Solid price gains have been experienced in the Melbourne market in the last twelve months.
In WA, ongoing population growth and relatively low unemployment continue to underpin demand, and while activity has weakened, prices have held up over the last 12 months.
In Queensland, State Treasury is forecasting economic growth in FY2015 and FY2016 faster than every other state in Australia, with dwelling investment forecast to continue to grow at a robust rate. Queensland is at an earlier phase in the housing cycle than the other states and an uptick in prices in Sydney and Melbourne is expected to cause increased demand for property in Brisbane as investors chase higher yields and owner-occupiers seek greater affordability.
i. Western Australia
Activity levels moderated from the strong conditions experienced in the previous year at the company’s Western Australian land estates, although pricing levels were maintained.
The last lots sold out at the Carine Rise project, a co-development between LandCorp, Cedar Woods and the St Ives Group. The project is transforming the former TAFE site in Perth’s middle northern suburb of Carine, into a multi-use precinct incorporating residential aged care, a retirement village, residential lots, townhouses and apartments.
Also in the first half the company sold the last remaining lots at its Port Mandurah canal project in Mandurah bringing to a close a project that had delivered profits to the company over a 20 year period. The company continued to release lots from the final island of its other canal estate, Mariners Cove and completed the sale of the boat pen marina facility in the second half.
At The Rivergums Baldivis, strong activity levels continued in stages close to the Baldivis Secondary College. Similarly good levels of activity were recorded at Emerald Park in Wellard with all but a few available titled lots selling out during the year, with the company starting development of the final 122 lot stage 6 which will contribute to profit in FY2016.
At the Elements project at South Hedland in the Pilbara region, only 15 of the 139 lots developed remain for sale, with the company having achieved the sale and settlement of the bulk of the lots in this estate in 2014.
The company has invested, along with a private syndicate, in the Batavia Marina Apartments, on the waterfront in Geraldton in the State’s mid-west. The project comprises 50 luxury apartments and four retail tenancies, with the building completed in 2013. The rate of sales has continued at an unsatisfactory pace, reflecting the downturn in property in resource-exposed regional towns in WA. Consequently, the company has impaired the carrying value of its investment by $6.4m during the year, ($2.5m impairment recognised in the first half and $3.9m in the second half), writing it down to $1.0m at 30 June 2015. Sales and marketing programs are focused on improving the outcome of this project.
Approval milestones were achieved at two projects in the portfolio that are expected to contribute significantly to the company’s future prospects. In September 2014, the Western Australian Planning Commission initiated a Metropolitan Region Scheme Amendment to rezone the Mangles Bay Marina development in Rockingham from various reservations to an Urban Zone. An Urban Zoning was similarly initiated over CWP’s landholding in Anstey Road, Forrestdale in November 2014.
Shortly after the end of the financial year the company purchased 19 and 21 Baldivis Rd, Baldivis, comprising 50.74 hectares, for $26.25m plus GST, scheduled to settle on 31 August 2015. The land, zoned ‘Urban’ under the Metropolitan Region Scheme and ‘Development’ under the City of Rockingham Scheme, adjoins the existing 68 hectare landholding owned by Cedar Woods to the south. The combined landholdings comprise 119 hectares and are immediately west of the Kwinana Freeway. Fully developed, the additional land is expected to produce approximately 700 lots and the combined land holding will have a total lot yield of approximately 1500 lots.

Fina
ncia
l and
Ope
ratin
g R
evie
w
11
2015 ANNUAL REPORT
ii. Victoria
The company’s projects in Victoria again performed well during the year, with good sales and settlement results. The Botanica Apartments in Footscray, comprising 101 apartments, was sold out and construction commenced. Several other apartment and townhouse stages at the Banbury Village development in Footscray were also progressed with strong sales, construction progress and settlements.
The successful Realm Camberwell development was completed with final stages settling early in the year. The project has received considerable industry recognition for its innovative and contemporary design outcomes.
Several residential stages were completed at Williams Landing and strong presales have been recorded for stages to be delivered in FY2016. Considerable price growth was also achieved at Williams Landing.
Good progress was achieved at the company’s new housing developments, St A. in St Albans and Jackson Green in Clayton South. Demolition was completed at both projects and site remediation works undertaken. At Jackson Green a planning permit has been issued for the first stage of housing and the project’s marketing centre was completed. At St A. various planning approvals were achieved and the plans for stage one lodged with Council for approval. The State Government announced progress with major infrastructure projects that will benefit both Jackson Green and St A. Level train line crossings will be removed at both sites and new stations are proposed to be delivered.
Due to the strong market for quality assets, the company sold the Williams Landing Masters Home Improvement store and achieved a record yield of 6%. The company completed the construction of the Williams Landing Shopping Centre and has progressively been leasing the balance of the retail and office tenancies. Good demand has been evident for office space in the development and the office component is around 90% leased. Several other residential and commercial developments are being planned and designed which will contribute to profits in future years.
iii. Queensland
In May 2014 the company made its first investment in Queensland with the purchase of 227 hectares of land at Upper Kedron, 12 kms west of Brisbane’s CBD. Planning approval for the first 480 lots was granted for the site in July 2015 and it will be the closest large scale housing estate to the Brisbane CBD. The project is expected to be developed over a 10 year period. The estate is close to existing amenity including schools, shopping centres, the Ferny Grove railway station and The Gap ‘park and ride’ bus facility. Cedar Woods plans to deliver a high-quality development at Upper Kedron, now branded, ‘Ellendale’, to attract a mix of buyer segments, with particular focus on second and third home buyers. Construction of the first stage is expected to commence in early 2016. Brisbane Council is expected to commence the update of its planning scheme to enable the balance of the proposed plan to be considered.
g) Corporate Objectives, Strategy and Risks
Cedar Woods’ Corporate Plan guides management’s activities and provides a five year outlook for the company, projecting earnings and other key performance indicators.
Cedar Woods’ primary objective is to create value for shareholders as it aims to deliver consistent year on year growth in net profit and earnings per share and put the company in the top half of all listed industrial companies based on financial performance. This year, the company reported full year net profit growth of 6 per cent and dividend growth of 2 per cent.
The Corporate Plan sets out a number of key action items and strategies focused on achieving delivery of earnings growth and addressing key risk factors. These key actions are implemented as performance targets by senior executives, sales managers and other employees.
In addition, twice each year our Audit and Risk Management Committee assesses risk factors that may affect the company including specific risks affecting individual projects and more general risks affecting our business sector.
The overarching strategic objective is to grow and develop our national project portfolio, diversified by geography, product type and price point, so that it continues to hold broad customer appeal and performs well in a range of market conditions.
The company’s strategies, as set out in the Corporate Plan and shown in our business model on page 7 are:
i. Acquisition of properties
In the last year the company completed the settlement of the land at Clayton South in Melbourne and made the second instalment payment on the land at Upper Kedron in Brisbane.
After the end of the financial year the company purchased 51 hectares of land at North Baldivis, adjacent to the company’s existing land holding purchased in 2011. Fully developed, the additional land is expected to produce approximately 700 residential lots and the combined land holding will have a total lot yield of approximately 1500 lots.

Fina
ncia
l and
Ope
ratin
g R
evie
w
CEDAR WOODS PROPERTIES LIMITED
12
The focus on the project pipeline guides management’s activities by ensuring there is sufficient diversity of product to meet the company’s ongoing earnings objectives in the years ahead and influences the company’s acquisition strategy.
A summary of the project pipeline may be found at the end of this Financial and Operating Review on page 14.
Cedar Woods’ core competency is in property development and the company continues to achieve industry-leading design, delivery and marketing of projects to maximise returns.
ii. Development
The company has a strategically located and diverse residential portfolio in urban and regional growth areas in Victoria, WA and Queensland, offering a wide spectrum of dwelling product and price points to consumers. The company’s offerings include small affordable housing lots at its residential estates through to high-end luxury apartments at boutique waterfront developments.
Cedar Woods utilises joint ventures and co-development arrangements to diversify the company’s revenue streams and efficiently manage its capital. This year, the company sold the final release of lots at the Carine Rise project, an important co-development with LandCorp and has progressed development by Cedar Woods Wellard Limited, which generates ongoing revenue by way of management and selling fees.
Cedar Woods will build a limited number of commercial and retail property assets at Williams Landing and at other estates, where the development of those buildings is consistent with the estate’s master plan objectives. The long term ownership of those assets will be balanced against the company’s capital management objectives and acquisition opportunities. Developments may be sold once they have achieved the amenity objectives and their valuations have matured, with disposals likely to become a regular component of the company’s future revenue stream. During the second half the company completed the sale of the Masters Home Improvement Store pursuant to that strategy.
ii. Marketing and sales
The company continually assesses the markets in which it operates in order to ensure it has a wide offering of product to meet customer demand. Achieving sufficient pre-sales underwrites each development and is an important performance indicator for management. The company successfully launched a new project at Ariella (Brabham) in Perth’s north eastern corridor during the year and progressed approvals for a number of other projects across its portfolio that will contribute in future years.
h) Risks
The general risks to company performance include those relevant to the property market, including government policy in relation to immigration and support for the housing industry generally, the environmental policy framework, monetary policy set by the Reserve Bank of Australia, the strength of the labour market and consumer confidence.
The company is also exposed to the property cycles in the markets in which it operates, i.e. Western Australia (regional and metropolitan), Victoria (metropolitan) and Queensland (metropolitan). The fluctuations in demand in these markets represent a risk to achieving the company’s financial objectives. The company aims to mitigate this risk by operating in diverse geographical markets and offering a wide range of products and price points to various consumer segments.
Whilst house and land prices fluctuate, underlying demand will be driven by population growth and changing demographics. In the past, the company has achieved its profit objective by managing both prices and volumes through the property cycle.
Individual projects are exposed to a number of risks including those related to obtaining the necessary approvals for development, construction risks and delays, pricing risks and competition. The recent call in of the Upper Kedron project by the Queensland Government provides an example of such risks, with the company’s program for that project delayed by approximately six months. The company aims to balance its portfolio at any time in favour of mature projects where the project risks are generally diminished.
i) Capital Management
The company reviewed its credit facilities during the year, maintaining the corporate bank facility limit at $135m, and extending the tenure by a further year to November 2017. In addition, a $23m bank facility was drawn to facilitate the development of the Williams Landing Shopping Centre and this is expected to be refinanced with an investment facility in FY2016. The year concluded with a low net debt to equity of 9.8 per cent at year end, temporarily below the company’s target debt to equity range of 20-75 per cent. Interest cover was at a favourable 9.9 times.
The dividend policy, which is to distribute approximately 50 per cent of the annual net profit, was maintained. The company reintroduced the dividend reinvestment plan and bonus share plan during the year after feedback from shareholders at the AGM.

Rep
ort
to S
hare
hold
ers
13
2015 ANNUAL REPORT
j) Sustainability Reporting and Corporate Governance Report
These reports are available as separate downloadable documents on our website www.cedarwoods.com.au under the Corporate Governance and Shareholder reports pages.
k) People
Cedar Woods remains committed to an inclusive workplace that embraces and promotes diversity. The diversity policy sets out a framework for the company’s diversity-related initiatives, strategies and programs. Commentary is provided in the Corporate Governance Statement on the company’s website.
During the year the company introduced new staff induction and retention initiatives, including a wellbeing program.
l) Board Matters
The board is conscious of its duty to ensure the company meets its performance objectives. During the year the board and its committees reviewed their respective charters and performance to ensure they were properly discharging their responsibilities. The charters were updated during the year as required and are published on the company’s website.
During the year the company has reviewed its corporate governance framework and practices and has implemented a number of key changes:
• a review of the company’s Board committees that has resulted in the company achieving a majority of independent directors on all Board committees,
• a review of the remuneration framework for the key management personnel, including improved linkage of the performance assessment to the company’s balanced scorecard,
• the introduction of a new equity based long term incentive plan,
• the introduction of a remuneration clawback policy.
Further details of these changes are contained in this Annual Report and the Corporate Governance Statement which is available on the company’s website and also on the ASX website.
m) Outlook
The Australian economy is forecast to continue its low growth phase next year as a sustained recovery in non-mining business investment is taking longer than expected. Strong levels of inbound migration and historically low interest rates are expected to continue to support the property market. The unemployment rate appears to have peaked nationally around 6%, although consumer confidence remains soft for the time being.
The medium-to-long term prospects of the residential property sector remain positive in the states in which the company operates. Victoria’s economy is expected to grow at a steady 2.5 per cent in FY2016, with population growth of 1.8 percent anticipated. The Queensland economy is expected to grow at 5.75 per cent in FY2016 with 1.75 per cent population growth. The Western Australian economy is forecast to grow at 2.0 per cent in FY2016 with population growth of 2.0 per cent. (State Treasury forecasts).
Cedar Woods enters FY2016 with low debt, a strong balance sheet and a diverse portfolio in major growth regions in three states. The company has $153m of presales in place and a number of new projects commencing. Assuming the current level of sales activity continues, the company expects to maintain profit momentum into FY2016. With ample funding and approvals in place, your board remains positive about the company’s outlook.
In FY2015, we have continued to actively engage with the investment and broking community to raise Cedar Woods’ profile and build awareness of the strength of the company’s portfolio, and note that there are five broking firms regularly issuing coverage of the company. We are pleased with the support of our existing shareholders and the investment fraternity.
We would like to thank our fellow directors and staff for their dedication and hard work in 2015. Thanks also go to our shareholders for their ongoing support of Cedar Woods in 2015 and in the years ahead.
William Hames Paul Sadleir Chairman Managing Director

Pro
ject
Pip
elin
e
CEDAR WOODS PROPERTIES LIMITED
14
Project Pipeline as at 30 June 2015
PROJECT NAMECORRIDOR / LOCATION
PROJECT TYPELOTS / UNITS
PROJECTLOTS / UNITS
REMAIN
PROJECT LIFE
FY16 FY17 FY18 FY19 FY20
(As of 1/7/15)
WESTERN AUSTRALIA - PERTH
Waterline - Halls Head South Lots 9 9
Emerald Park -Wellard South West Residential Land 665 148
Mariners Cove - Mandurah South Canal 970 62
The Brook at Byford South East Residential Land 405 293
Byford on the Scarp South East Residential Land 324 308
Piara Central - Piara Waters South East Residential Land 540 389
The Rivergums - Baldivis South West Residential Land 1416 493
Harrisdale Green - Harrisdale South East Residential / Mixed Use 427 262
Ariella - Brabham North East Residential Land 480 480
Mangles Bay Marina - Rockingham South Marina / Tourist TBC TBC
North Baldivis South West Residential Land 1580 1580
Bushmead - Hazelmere East Residential Land 868 868
Pinjarra South Residential Land 920 920
WESTERN AUSTRALIA - REGIONAL
Batavia Marina - Geraldton Mid-West Apartments 54 29
Elements - South Hedland Pilbara Residential Land 136 16
Western Edge - South Hedland Pilbara Residential Land 600 600
VICTORIA - MELBOURNE
Clara - Williams Landing West Residential Land 40 40
Banbury Village - Footscray West Apartments & Housing 430 122
Carlingford - Lalor North Residential Land 649 162
Jackson Green - Clayton South South East Apartments & Houses 300 300
St A - St Albans North West Housing 250 250
Williams Landing West Residential Land & Housing 2385 972
Williams Landing Town Centre West Retail / Mixed Use / Residential 600 600
QUEENSLAND - BRISBANE
Ellendale - Upper Kedron North West Residential TBC TBC
This chart provides a 5 year outlook, but some projects will run for a longer period.
Project yields are indicative and subject to change.

Pro
ject
Pip
elin
e
15
2015 ANNUAL REPORT
PROJECT NAMECORRIDOR / LOCATION
PROJECT TYPELOTS / UNITS
PROJECTLOTS / UNITS
REMAIN
PROJECT LIFE
FY16 FY17 FY18 FY19 FY20
(As of 1/7/15)
WESTERN AUSTRALIA - PERTH
Waterline - Halls Head South Lots 9 9
Emerald Park -Wellard South West Residential Land 665 148
Mariners Cove - Mandurah South Canal 970 62
The Brook at Byford South East Residential Land 405 293
Byford on the Scarp South East Residential Land 324 308
Piara Central - Piara Waters South East Residential Land 540 389
The Rivergums - Baldivis South West Residential Land 1416 493
Harrisdale Green - Harrisdale South East Residential / Mixed Use 427 262
Ariella - Brabham North East Residential Land 480 480
Mangles Bay Marina - Rockingham South Marina / Tourist TBC TBC
North Baldivis South West Residential Land 1580 1580
Bushmead - Hazelmere East Residential Land 868 868
Pinjarra South Residential Land 920 920
WESTERN AUSTRALIA - REGIONAL
Batavia Marina - Geraldton Mid-West Apartments 54 29
Elements - South Hedland Pilbara Residential Land 136 16
Western Edge - South Hedland Pilbara Residential Land 600 600
VICTORIA - MELBOURNE
Clara - Williams Landing West Residential Land 40 40
Banbury Village - Footscray West Apartments & Housing 430 122
Carlingford - Lalor North Residential Land 649 162
Jackson Green - Clayton South South East Apartments & Houses 300 300
St A - St Albans North West Housing 250 250
Williams Landing West Residential Land & Housing 2385 972
Williams Landing Town Centre West Retail / Mixed Use / Residential 600 600
QUEENSLAND - BRISBANE
Ellendale - Upper Kedron North West Residential TBC TBC
This chart provides a 5 year outlook, but some projects will run for a longer period.
Project yields are indicative and subject to change.
Planning & Design Development & Sales Leasing, Development & Sales

Env
ironm
enta
l and
Soc
ial G
over
nanc
e
CEDAR WOODS PROPERTIES LIMITED
16
Environmental and Social Governance
ESG Reporting
Cedar Woods seeks to integrate sustainability best practice into all levels of decision making and project outcomes. To achieve this, leadership is provided at senior executive level to ensure that sustainability management and performance is integrated into the company’s culture, processes and stakeholder relationships. This helps us manage the non-financial impacts and performance of our projects.
This section summarises our sustainability performance for the past financial year. It provides updates and progress against targets and outcomes identified in the balanced scorecard reporting and allows us to communicate our achievements to our business, industry and stakeholder partners. It should be read in conjunction with Cedar Woods’ annual Sustainability Report.
Cedar Woods is proud of its achievements in 2015, which includes winning the inaugural ‘Russell Perry Award for Urban Development Excellence’ and ‘Affordable Housing Excellence’, both at the Elements project in South Hedland.
Sustainability Objective:
To integrate sustainability best practice into all levels of decision making and project outcomes.
Environment and Climate Change - enhance and rehabilitate environmental assets, remediate contamination as an integral part of project delivery and promote renewable energy and reduced energy consumption.
FY2015 Highlights and Achievements
• Cedar Woods continues to build on its track record of being the ‘environmentally responsible developer’. All projects have continued to be subject to thorough site analysis and surveys at the outset to determine biodiversity objectives. This informs what locally State and Commonwealth approvals are required and opportunities for retention and management of biodiversity to improve project outcomes.
• Bushmead has been recognised by the State government as delivering an improved environmental outcome, based on Cedar Woods gifting two-thirds of the site for conservation management and the remediation of site contamination. Commonwealth environmental approval is now being sought.
• Cedar Woods’ Sustainability Checklist and Sustainable Living Guide template continues to be rolled out and has now been launched at Ariella, encouraging new home builders to make smart choices to address escalating energy costs, water scarcity and other impacts of climate change.
• The Rivergums ‘Urban Retreat’ Demonstration Home continued to showcase enhanced thermal performance through frame construction as well as providing an example of the design principles promoted in the Sustainability Checklist and Living Guide.
• Elements, South Hedland is designed to complement the natural environment. By adapting solar orientation, shading and cross ventilation measures, the Elements delivers low-energy urban design and architecture in the harsh Pilbara climate.
Optimising Land Use - delivering the best use of land by optimising land use mix and product yield in the context of high quality urban places that deliver quality of life.
FY2015 Highlights and Achievements
• By the nature of our business, a key outcome of our project delivery is to assist with residential and commercial land supply in line with the Perth, Melbourne and Brisbane strategic planning frameworks.
• Perth based projects continue to be characterised by the acquisition of government priority green fields projects in urban corridors, with the recent acquisition of an additional 50.7ha in Baldivis. Our Melbourne office has continued its trend of acquiring strategic urban renewal projects along activity corridors associated with good public transport with further progress at Williams Landing Town Centre, Banbury Village, Jackson Green and St Albans. Planning and development of Upper Kedron will also continue in line with the regional planning for south-east Queensland.
• The Elements project has supported the growth and revitalisation of the South Hedland regional centre through the provision of suitable residential land and lifestyle opportunities. This will continue with Western Edge, also in South Hedland, where planning continues.
Env
ironm
enta
l and
Soc
ial G
over
nanc
e
17
2015 ANNUAL REPORT
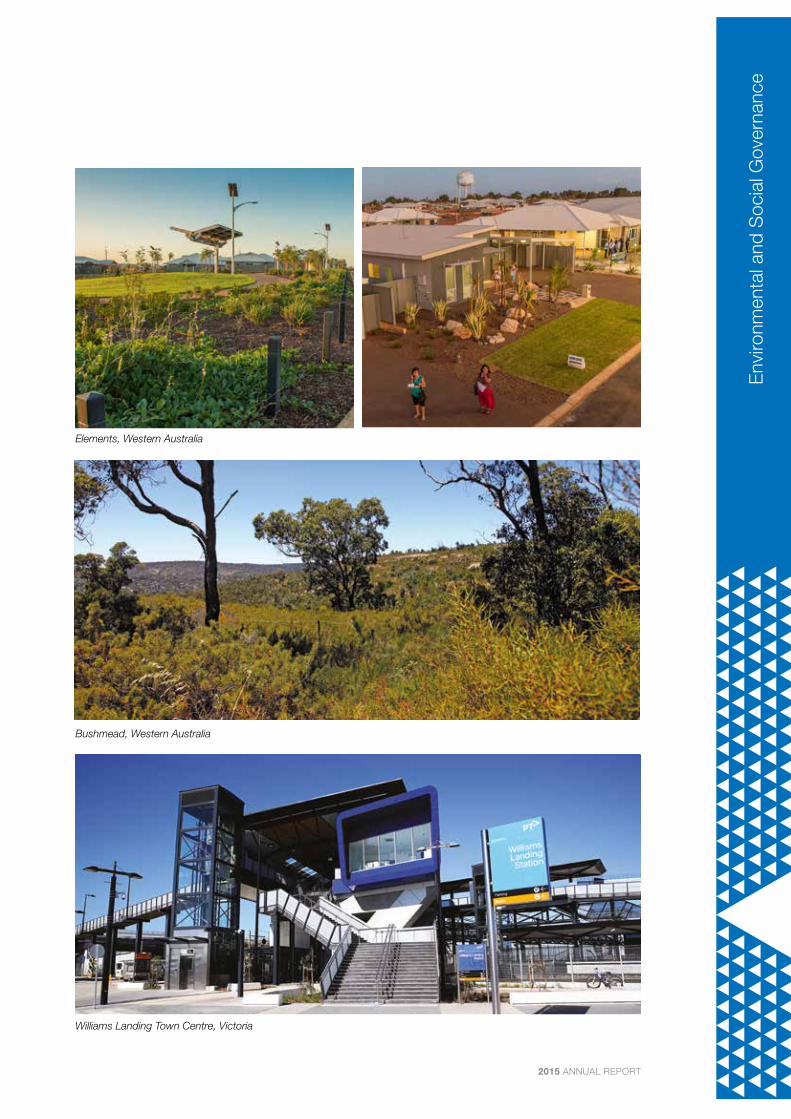
Elements, Western Australia
Bushmead, Western Australia
Williams Landing Town Centre, Victoria

Env
ironm
enta
l and
Soc
ial G
over
nanc
e
CEDAR WOODS PROPERTIES LIMITED
18
Housing Diversity - promoting equality of access to housing for all sectors of the community.
FY2015 Highlights and Achievements
• The Elements project saw the successful delivery of affordable housing solutions through partnerships with indigenous communities, Aboriginal Corporations, not-for-profit organisations and government agencies. It also set out to deliver price normalisation in the characteristic over-heated market conditions. The success of these initiatives is reflected in Cedar Woods winning the 2015 UDIA (WA) ‘Affordable Development Excellence’ Award at Elements.
Heritage - recognising indigenous and cultural heritage.
FY2015 Highlights and Achievements
• Cedar Woods has continued to respect Indigenous and European cultural heritage at all of its project sites. Ethnographic and architectural research is undertaken for all projects to ensure that indigenous and European heritage is identified and managed appropriately.
Stakeholder Engagement - maintaining Cedar Woods position as a competent and trustworthy company and joint venture partner and a contributor to industry.
FY2015 Highlights and Achievements
• Engagement with our government stakeholders is guided by targeted relationship engagement and communication plans which are developed for each project and updated annually.
• The corporate strategy is to grow the joint venture portfolio and to respond to existing joint venture partners LandCorp (Mangles Bay, Carine Rise and Western Edge), Department of Lands (Elements) and Department of Housing (Harrisdale) with professionalism, transparency and quality outcomes. Carine Rise and Elements are now complete.
• Cedar Woods has maintained its membership with key industry associations, including the Urban Development Institute of Australia, Property Council Australia and Housing Institute Australia. Company staff participate on many industry committees.
• Project operations with industry consultants and contractors involve day to day communications and attendance at project and operational meetings. Consultant and contractor performance assessments are carried out bi-annually.
• Cedar Woods continues to acknowledge the importance of adopting a proactive approach to community engagement which often provides opportunities to mitigate and address community concerns. Active engagement strategies were undertaken for planning at Bushmead and The Rivergums with the advancement of new planning approvals.
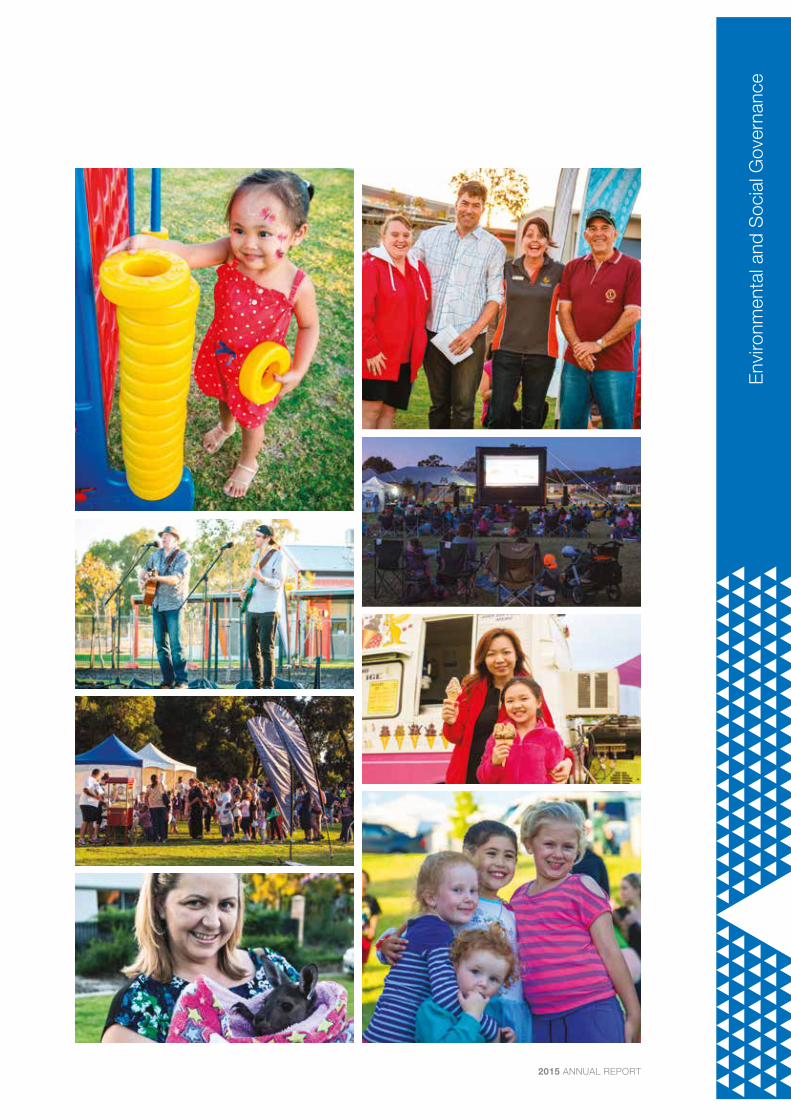
Community Investment, Development and Integration - creating vibrant communities by investing in their wellbeing, nurturing a strong ‘sense of community’ and maximising social connectivity.
FY2015 Highlights and Achievements
• Cedar Woods continued its sponsorship of the Perth International Arts Festival. Not only did it allow us to invest in the cultural wellbeing of the Perth community generally, it also provided valuable opportunity to share the enriching experience of the various performances with investors, key stakeholders and amongst staff.
• In late 2014, Cedar Woods launched its Neighbourhood Cinema program at The Brook at Byford / Byford on the Scarp, Piara Central, Harrisdale Green and at The Rivergums. Families enjoyed sitting in our award winning parks with friends and neighbours to enjoy an outdoor movie together with other family attractions. The events were well attended and community feedback was very positive.
• Cedar Woods is committed to creating vibrant sustainable urban communities. Part of this vision includes the support of new emerging and existing community groups. At the project level, Cedar Woods has continued its Community Grants program at Byford on the Scarp, The Brook at Byford, Piara Central, Harrisdale Green, The Rivergums and Williams Landing. An additional $70,000 was grants were awarded in FY 15. The total contribution to date has benefitted over 80 community groups which provide local services.
• Other local sponsorship for project based communities events amounted to approximately $45,000, primarily at Elements and Mariners Cove.
Occupational Health & Safety - providing a safe working environment for staff and stakeholders.
FY2015 Highlights and Achievements
• Cedar Woods has prepared itself for the introduction of the Model Work Health and Safety Act as it is enacted across Australia states to harmonise Health and Safety law.
• The company has been working closely with its consultants to develop a comprehensive Work Health and Safety (WHS) system that will ensure compliance with the new WHS Act.
• The new WHS system will be implemented throughout Cedar Wood’s operations.
• Through leadership and commitment Cedar Woods aims to ensure no person will suffer a serious preventable work related injury or illness as a result of its activities.
Env
ironm
enta
l and
Soc
ial G
over
nanc
e
19
2015 ANNUAL REPORT

Dire
ctor
’s R
epor
t
CEDAR WOODS PROPERTIES LIMITED
20
Directors’ Report
Your directors present their report on the consolidated entity consisting of Cedar Woods Properties Limited (‘the company’) and the entities it controlled (together ‘the consolidated entity’ or ‘group’) at the end of, or during, the year ended 30 June 2015.
a) Directors
The following persons were directors of Cedar Woods Properties Limited during the whole of the financial year and up to the date of this report, except where stated:
William George Hames (Chairman)
Robert Stanley Brown (Deputy Chairman)
Ronald Packer
Stephen Thomas Pearce
Paul Stephen Sadleir (Managing Director)
Timothy Robert Brown (Alternate for R S Brown)
The qualifications, experience and other details of the directors in office at the date of this report appear on page 21 of this report.
b) Principal activities
The principal continuing activities of the consolidated entity in the course of the year ended 30 June 2015 were that of property developer and investor and no significant change in the nature of those activities took place during the year.
c) Dividends
Dividends paid to members during the financial year were as follows:
2015$’000
2014$’000
Final fully franked ordinary dividend for the year ended 30 June 2014 of 15.5 cents (2013 - 15.0 cents) per fully paid share, paid on 31 October 2014 (2013 – 30 October 2013) 12,142 10,668
Interim fully franked ordinary dividend for the year ended 30 June 2015 of 12 cents (2014 – 12.0 cents) per fully paid share, paid on 30 April 2015 (2014 – 30 April 2014) 9,248 8,709
21,390 19,377
Since the end of the financial year the directors have recommended the payment of a final fully franked ordinary dividend of $12,622,669 (16.0 cents per share) to be paid on 30 October 2015 out of retained earnings at 30 June 2015.
d) Financial and operating review
Information on the operations and financial position of the group and its business strategies and prospects is set out in the financial and operating review, commencing on page 8 of this annual report.
e) Business strategies and prospects for future financial years
The consolidated entity will continue property development operations in Western Australia, Victoria and Queensland.
Subject to market conditions continuing at current levels, the group anticipates that it will maintain profit momentum into FY2016, underpinned by a significant bank of presales already in place at the date of this report.

Dire
ctor
’s R
epor
t
21
2015 ANNUAL REPORT
f) Significant changes in the state of affairs
There were no significant changes in the state of affairs of the consolidated entity during the year.
g) Matters subsequent to the end of the financial year
On 4 August 2015 Cedar Woods announced the purchase of 50.74 hectares of land in Baldivis for $26.25m + GST. Coupled with the existing land holding in that area, the total area will comprise 119 hectares and is expected to yield a total 1500 lots. Development is expected to commence in 2016.
Other than the above, no matters or circumstances have arisen since 30 June 2015 that have significantly affected or may significantly affect:
a. the consolidated entity’s operations in future financial years; or
b. the results of those operations in future financial years; or
c. the consolidated entity’s state of affairs in future financial years.
h) Likely developments and expected results of operations
Beyond the comments at items (d) and (e), further information on likely developments in the operations of the consolidated entity and the expected results of operations have not been included in this report because the directors believe it would be likely to result in unreasonable prejudice to the consolidated entity.
i) Environmental regulation
To the best of the directors’ knowledge, the group complies with the requirements of environmental legislation in respect of its developments, and obtains the planning approvals required prior to clearing or development of land under the laws of the relevant states. There have been no instances of non-compliance during the year and up to the date of this report.
j) Information on directors
Mr William G Hames, B Arch (Hons) MCU (Harvard) LFRAIA, MPIA, FAPI (Econ)
• Chairman of the Board of directors, non-executive director
• Member of the Nominations Committee until 31 May 2015
Mr Hames is a co-founder of Cedar Woods Properties Limited. He is an architect and town planner by profession, and received a Masters Degree in City Planning and Urban Design from the Harvard Graduate School of Design, at Harvard University in Boston. He worked in the US property development market before returning to Australia in 1975 and establishing Hames Sharley Australia, an architectural and town planning consulting company. Mr Hames brings substantial property experience to the Board upon which he has served as a director for twenty-five years.
Other current listed company directorships and former listed company directorships in the last three years:
None.
Mr Robert S Brown, MAICD, AIFS
• Deputy Chairman of the Board of directors, non-executive director
• Member of the Audit and Risk Management Committee
• Member of the Human Resources and Remuneration Committee
• Member of the Nominations Committee
Mr Brown is Executive Chairman of Westland Group Holdings Pty Ltd, with responsibilities in mining, agribusiness, biotechnology and venture capital. He is a past president of the Federation of Building Societies of WA and has participated in and chaired various Western Australian government advisory committees related to the housing industry. Mr Brown brings to the Board his diversified experience as a director of these companies and other listed entities and has served as a director of Cedar Woods Properties Limited for twenty-seven years.
Other current listed company directorships and former listed company directorships in the last three years:
Luiri Gold Limited.
Dire
ctor
’s R
epor
t
CEDAR WOODS PROPERTIES LIMITED
22
Mr Ronald Packer, BCom (UWA), FAICD, Solicitor Supreme Court of England & Wales
• Non-executive director
• Chairman of the Audit and Risk Management Committee
• Chairman of the Human Resources and Remuneration Committee
• Chairman of the Nominations Committee
Mr Packer is an independent director who brings to the Board a wide range of property experience in the public and private arena. He is the former Managing Director of PA Property Management Limited, the responsible entity for the PA Property Trust and is currently the Chairman of Terrace Properties and Investments Pty Ltd. Mr Packer has served as a director for nine years and chairs all of the Board’s committees.
Other current listed company directorships and former listed company directorships in the last three years:
None.
Mr Stephen T Pearce, BBus (ACC), Grad Dip (Admin), FCA, AGIA, MAICD
• Non-executive director
• Member of the Audit and Risk Management Committee
• Member of the Human resources and Remuneration Committee from 1 June 2015
• Member of the Nominations Committee from 1 June 2015
Mr Pearce is an independent director with almost 30 years’ senior executive and directorship experience at publicly-listed companies in the resources, oil and gas, energy and utilities sectors and has significant expertise across all areas of finance and capital markets. He is currently the Chief Financial Officer of Fortescue Metals Group Ltd. Mr Pearce previously held the position of Managing Director and CEO of Southern Cross Electrical Engineering Limited and, before that, was Chief Financial Officer of Alinta Limited. He is currently non-executive Chairman of the Lions Eye Institute and was previously a member of the Salvation Army’s Business and Industry Committee. Mr Pearce has served as a director for the past year.
Other current listed company directorships and former listed company directorships in the last three years:
None.
Mr Paul S Sadleir, BE, MBA, AAPI, FAICD
• Managing Director, executive director
Mr Sadleir has extensive experience in the property sector including strategic planning, portfolio management, acquisition analysis, equity and finance raising and investor relations management. Mr Sadleir holds Masters of Business Administration and Bachelor of Engineering degrees from the University of Western Australia. Prior to joining Cedar Woods, he was manager of the Bunnings Warehouse Property Trust and previously held roles with Wesfarmers Limited, Western Power and Barrack Mines. He is currently a Board member of the Brightwater Care Group, one of the largest providers of residential aged care in Western Australia, a Division Councillor at the WA Division of the Australian Institute of Company Directors and a Senate member of Murdoch University. Mr Sadleir has served as a director for twelve years.
Other current listed company directorships and former listed company directorships in the last three years:
None.
Mr Timothy R Brown, BA, LLB, M. Fin, Post Graduate Diploma (Phil)
• Alternate director for Mr Robert S Brown
Mr Brown is a director of Westland Group Holdings Pty Ltd, with responsibilities in mining, agribusiness, biotechnology and venture capital. His qualifications include a Bachelor of Laws from Notre Dame Australia and a Masters of Finance from Curtin University. Mr Brown was admitted to the Supreme Court of Western Australia as a barrister and solicitor in 2004.
Other current listed company directorships and former listed company directorships in the last three years:
None.
Company Secretary
The Company Secretary is Mr Paul S Freedman, BSc, CA, GAICD. Mr Freedman was appointed to the position in 1998. He is a member of the Institute of Chartered Accountants in Australia and is a member of the Australian Institute of Company Directors. He brings to the company a background of twenty years in financial management in the property industry, preceded by employment in senior roles with major accountancy firms.

Dire
ctor
’s R
epor
t
23
2015 ANNUAL REPORT
k) Shares issued on the exercise of options
No share options were in existence during the year and none have been issued up to the date of this report.
l) Directors’ interests in shares
Directors’ relevant interests in shares of Cedar Woods Properties Limited at the date of this report, as defined by sections 608 and 609 of the Corporations Act 2001, are as follows:
Director Interest in ordinary shares
William G Hames 9,952,636
Robert S Brown* 7,982,584
Ronald Packer 167,859
Stephen T Pearce 15,000
Paul S Sadleir 1,045,445
Timothy R Brown* 4,639,980
*R S Brown and T R Brown have a shared interest in 4,639,980 shares.
m) Committees of the Board
As at the date of this report Cedar Woods Properties Limited had the following committees of the Board:
Audit and Risk Management Committee
Human Resources and Remuneration Committee Nominations Committee
R Packer (Chairman) R Packer (Chairman) R Packer (Chairman)
R S Brown R S Brown R S Brown
S T Pearce S T Pearce S T Pearce
n) Meetings of directors
The following table sets out the numbers of meetings of the company’s directors (including meetings of committees of directors) held during the year ended 30 June 2015, and the numbers of meetings attended by each director:
Board Meetings Meetings of Committees
Audit and Risk Management
Human Resources and Remuneration
Nominations
Number of meetings held: 7 4 4 3
W G Hames 6 * * 3
R S Brown 7 4 4 3
R Packer 7 4 4 3
S T Pearce 5 4 † †
P S Sadleir 7 * * *
T Brown (alternate director) - - - -
* Not a member of this committee.
† S T Pearce was appointed to the Human Resources & Remuneration Committee and the Nominations Committee on 1 June 2015. He was not a member of these committees when the meetings were held in the year.
W G Hames was a member of the Nominations Committee until 1 June 2015.

CEDAR WOODS PROPERTIES LIMITED
24
Directors’ Report: Chairman of the Human Resources and Remuneration Committee’s Letter to Shareholders
Dear Shareholders,
I am pleased to provide an introductory overview and summary of the key highlights in relation to remuneration matters for FY2015. As outlined in the Financial & Operating review, Cedar Woods had another successful year in which we reported a record profit and solid progress across the various areas within the company’s operations, as described in our “balanced scorecard” in section r) of this report. The balanced scorecard provides the company’s FY2015 objectives and performance against targets as assessed by the Board.
At last year’s Annual General Meeting (AGM) in November, we received a significant vote against our remuneration report. Following the AGM, the company consulted with shareholders and proxy advisory groups regarding the concerns raised about Cedar Woods’ remuneration program, noting the need for greater transparency and enhanced structures around the short and long term incentive arrangements for executives. The Board engaged Ernst & Young (EY) to provide advice on remuneration matters and has considered these concerns and through a review process is implementing changes as outlined in the table below.
During FY2014 we introduced the more comprehensive “balanced scorecard” form of reporting and we have made a number of other changes, some of which were introduced during FY2015 and others which were introduced on 1 July 2015, as arrangements for FY2015 were already in place prior to the feedback received at the November AGM.
Review of the executive remuneration framework
The company engaged EY to provide advice on Cedar Woods’ executive remuneration framework with the objective of improving the link between shareholder returns and executive remuneration as well as a closer alignment of remuneration with the Corporate strategy. Aspects of the new executive remuneration framework will apply from 1 July 2015 including transitioning to a greater emphasis on variable pay with the introduction of a new long-term incentive program (as outlined below).
Fixed remuneration The company identified where adjustments were appropriate, based on market benchmarking information. For FY2015 the Managing Director’s (MD’s) fixed remuneration remained unchanged and other executives’ fixed remuneration increased by approximately 5%, reflecting sustained high performance of the individual, increased role responsibilities and alignment with market remuneration levels in both listed and non-listed property companies.
Short-term incentives (“STIs”)
To ensure the STI’s were appropriately aligned to the Corporate plan, the company continued with its balanced scorecard of measures for determining the STI awards for FY2015.
Long-term incentives (“LTIs”)
Consistent with the intention stated in the FY2014 Remuneration Report, the former LTI plan has been reviewed and will be replaced by a new LTI plan effective from 1 July 2015.
The new LTI plan has two vesting conditions a) a 3 year service condition and b) two performance conditions measured over a 3 year period: 50 percent of the LTI grant will be tested against a relative total shareholder return (“TSR”) hurdle (measured against the S&P / ASX Small Industrials Index) and 50 per cent against earnings per share (“EPS”) growth compared with the Corporate plan targets.
The relative TSR performance condition was chosen as it offers a relevant indicator of measuring changes in shareholder value by comparing the company’s return to shareholders against the returns of companies of a similar size and investment profile.
The EPS performance condition was chosen as it is a primary determinant of shareholder value in a listed company context.
Dire
ctor
s’ R
epor
t: L
ette
r to
Sha
reho
lder
s
25
2015 ANNUAL REPORT
Dire
ctor
s’ R
epor
t: L
ette
r to
Sha
reho
lder
s
NED fees The maximum aggregate NED remuneration for FY2015 was $750,000, as approved by shareholders at the company’s FY2014 AGM. Chair and NED fees were increased by 2.5% effective 1 July 2014 to maintain market competitiveness. Total NED fees paid for FY2015 were $469,450.
Clawback policy The company implemented an incentive clawback policy for executives and other staff that applies for FY2015 onwards. Under the policy, the Board may at its absolute discretion claw back vested and unvested incentives in the case where an “inappropriate benefit” has arisen, as may be the case in a material mis-statement of financial results.
Further details on the executive remuneration arrangements and the remuneration outcomes for FY2015 are set out in this Remuneration Report. I look forward to answering any questions you may have at our Annual General Meeting in November.
Yours faithfully,
Ronald Packer Chairman of the Human Resources and Remuneration Committee

Dire
ctor
s’ R
epor
t: R
emun
erat
ion
Rep
ort
CEDAR WOODS PROPERTIES LIMITED
26
Directors’ Report: Remuneration Report.
The directors present Cedar Woods Properties Limited’s FY2015 Remuneration Report which sets out remuneration information for the directors and other key management personnel (“KMP”) for the year ended 30 June 2015.
The information provided in this remuneration report has been audited as required by section 308(3C) of the Corporations Act 2001.
The Remuneration Report is presented under the following sections: Page
o) Introduction 26
p) Remuneration governance 27
q) Executive remuneration policy and framework 28
r) Executive remuneration outcomes for FY2015 (including link to performance) 33
s) Executive contracts 37
t) Non-Executive Director fee arrangements 38
u) Additional statutory disclosures 39
o) Introduction
The Remuneration Report details the remuneration arrangements for KMP who are defined as those persons having authority and responsibility for planning, directing and controlling the major activities of the company, directly or indirectly.
The table below outlines the KMP of the company during the financial year ended 30 June 2015. Unless otherwise indicated, the individuals were KMP for the entire financial year. For the purposes of this report, the term “executive” includes the executive directors and senior executives of the company.
KMP Position Term as KMP
Non-Executive Directors (“NEDs”)
W G Hames Non-Executive Chair Full year
R S Brown Non-Executive Deputy Chair Full year
R Packer Independent Non-Executive Director Full year
S T Pearce Independent Non-Executive Director Full year
Executive Directors
P S Sadleir Managing Director (“MD”) Full year
Senior Executives
N Blackburne Victorian and Queensland State Manager Full year
P Freedman Chief Financial Officer (“CFO”) and Company Secretary Full year
S Duplock Western Australian State Manager (ceased employment with the company on 14 August 2014)
Part year
After the end of the financial year, the company appointed Ben Rosser as the Western Australian State Manager, commencing from 20 July 2015. There were no other changes to KMP after the reporting date and before the date the financial report was authorised for issue.

Dire
ctor
s’ R
epor
t: R
emun
erat
ion
Rep
ort
27
2015 ANNUAL REPORT
p) Remuneration governance
Role of the Human Resources and Remuneration Committee
The Human Resources and Remuneration Committee is a committee of the Board. It is responsible for making recommendations to the Board on:
• the over-arching executive remuneration framework,
• NED fees,
• operation of incentive plans and key performance hurdles for the executive team, and
• remuneration levels of the MD and other executives.
The Human Resources and Remuneration Committee’s objective is to ensure remuneration policies and structures are fair and competitive and aligned with the long-term interests of the company. The Human Resources and Remuneration Committee periodically obtains independent remuneration information to ensure NED fees and executive remuneration packages are appropriate and in line with the market - see section Use of remuneration advisors below.
The Corporate Governance Statement provides further information on the role of this Human Resource and Remuneration Committee, and may be found on the company’s website under the Investor Relations link.
Use of remuneration advisors
In FY2015 the Human Resources and Remuneration Committee appointed EY as its external remuneration advisor to assist with the review of the overall executive remuneration framework. In FY2014 remuneration consultants were not engaged.
EY’s terms of engagement include specific measures designed to protect its independence. The Human Resources and Remuneration Committee recognises that, to effectively perform its role, it is necessary for EY to interact with members of Cedar Woods’ management. However, to ensure EY remains independent, members of Cedar Woods’ management are precluded from requesting services that would be considered to be a ‘remuneration recommendation’ as defined by the Corporations Amendment (improving Account ability on Director and Executive Remuneration) Act 2011.
During the year ended 30 June 2015, EY provided the Human Resources and Remuneration Committee with:
• guidance in the review and design of the executive remuneration framework; and
• assistance in drafting of remuneration report disclosures.
No remuneration recommendations were provided by EY or any other advisor during the reporting period.
Clawback of remuneration
For FY2015 and subsequent years, vested and unvested STI’s & LTI’s are subject to potential clawback based on the Board’s judgment.
The Board may exercise its judgment in relation to STI or LTI outcomes:
STI at the end of the financial year when assessing performance against scorecard objectives to determine the STI payments, when determining if there are any matters impacting the initial performance assessment.
LTI at any time prior to, or at, the final vesting date of the performance rights and will take account of factors such as any material misstatements of financial results or individual instances of non-compliance with Cedar Woods’ policies.
The clawback policy also provides that the Board can recover an STI or LTI award previously paid to an employee.
Remuneration Report approval at FY2014 Annual General Meeting (“AGM”)
At the company’s FY2014 AGM, 75.7 per cent of eligible votes cast were in favour of the Remuneration Report for the FY2014. The company received no questions at the AGM when the resolution concerning the Remuneration Report was considered by shareholders. The company received one general question at the AGM from a shareholder enquiring as to the progress the company had made in relation to its remuneration policies and the Chairman advised shareholders of the process that the Board was undertaking, which have now resulted in the new remuneration structures set out in this year’s remuneration report.

Dire
ctor
s’ R
epor
t: R
emun
erat
ion
Rep
ort
CEDAR WOODS PROPERTIES LIMITED
28
q) Executive remuneration policy and framework
The information contained within this section outlines the details pertaining to the executive remuneration policy and framework for FY2015. As noted, following a review of the executive remuneration program, changes have been initiated to apply from 1 July 2015. Where relevant, these changes have been highlighted.
i. Principles and strategy
Company objective
To create long-term value for shareholders through the disciplined acquisition, development and marketing of properties
Remuneration strategy linkages to company objective
The Board of directors ensures our approach to executive reward satisfies the following key criteria for good reward governance practices:
• Competitiveness and reasonableness
• Acceptability to shareholders
• Alignment of executive remuneration to company performance
• Transparency of the link between performance and reward
Attract, motivate and retain high performing individuals:
• The remuneration offering rewards capability and experience
• Reflects competitive reward for contribution to growth in shareholder wealth
The framework is aligned to shareholders’ interests by having:
• STIs linked to current year performance and subject to clawback
• From 1 July 2015 - LTIs linked to both long term external (relative total shareholder return (“TSR”)) and internal (earnings per share (“EPS”) growth) performance. Unvested LTIs also subject to clawback
Component Vehicle Purpose Link to performance
Tota
l rem
uner
atio
n (“
TR
”)
Fixed remuneration
Comprises base salary, superannuation and non-monetary benefits
To provide competitive fixed remuneration set with reference to role, market and skills and experience of individuals
Group and individual performance are considered during the annual remuneration review processNo guaranteed fixed remuneration increases included in executives’ contracts
STIs Paid in cash Rewards executives for their contribution to achievement of Group and business unit outcomes
Linked to the Corporate Plan and achievement of personal objectives established at the start of the year
LTIs Superseded scheme: paid in cash at the end of the 3 year periodFrom 1 July 2015 – new equity based LTI grants awarded in Performance Rights
Rewards executives for their contribution to the creation of shareholder value over the longer term
Financial and non-financial performance measures over one year with requirement for executive to remain with the company for minimum of three yearsFrom 1 July 2015 - Vesting of new grants is dependent on TSR performance relative to S&P / ASX Small Industrials Index and annual compound growth rate in EPS, both over a three year period

Dire
ctor
s’ R
epor
t: R
emun
erat
ion
Rep
ort
29
2015 ANNUAL REPORT
Performance related outcomes are determined each year following the audit of the annual results. Outcomes may be adjusted up or down in line with over and under achievement against the target performance levels, at the discretion of the Board (based on a recommendation from the Human Resources and Remuneration Committee).
The Human Resources and Remuneration Committee also considers issues of succession planning, career development and staff retention.
ii. Approach to setting remuneration
In FY2015, the executive remuneration framework consisted of fixed remuneration and short and long-term incentives as outlined below.
The company aims to reward executives with a level and mix of remuneration appropriate to their position, responsibilities and performance within the organisation and aligned with market practice.
The company’s approach is generally to position Total Remuneration between the median and upper quartile of our direct industry peers, both listed and unlisted, and other Australian listed companies of a similar size and complexity. Based on performance and experience, individuals have the potential to move from median to upper quartile over a period of time.
Remuneration levels are reviewed annually through a process that considers market data, insights into remuneration trends, the performance of the company and the individual, and the broader economic environment.
The “at risk” components (STI’s and LTI’s) ensure a proportion of remuneration varies with performance of both the individual and the company. The recent review of executive remuneration has identified a need for a greater weighting of “at risk” components within the total remuneration opportunity (remuneration mix) particularly for the MD and a need for an equity based LTI plan. The Board intends transitioning to the new remuneration mix over the next three financial years, noting some variations may occur during this time due to influencing factors such as changing market conditions. In making this transition, the Board wishes to keep total remuneration increases at modest levels, with the majority of increases directed into LTI’s.
The graph below illustrates the current (FY2015) and anticipated remuneration mix by FY2018.
Managing Director - remuneration mix
Current 63% 35% 2%
By FY18 50% 25% 25%
State Managers - remuneration mix
Current 69% 19% 12%
By FY18 67% 20% 13%
CFO and Company Secretary – remuneration mix
Current 78% 15% 8%
By FY18 75% 15% 10%
Fixed remuneration Max STI opportunity Max LTI opportunity

Dire
ctor
s’ R
epor
t: R
emun
erat
ion
Rep
ort
CEDAR WOODS PROPERTIES LIMITED
30
iii. Details of incentive plans
Short-term incentives (STI)
Who participates? Executives
How is the STI delivered? Cash
What is the STI opportunity? Each executive has a target STI opportunity depending on the accountabilities of the role and impact on organisational performance. The company seeks to deliver steady annual growth and accordingly the maximum STI opportunity is the target opportunity. The maximum STI opportunity for KMP’s is detailed in section r) Executive remuneration outcomes.
What are the performance conditions for FY2015?
Actual STI payments to each executive depend on the extent to which specific targets set at the beginning of the financial year are met with regard to both company and individual performance criteria.
The weightings that applied in FY2015 to components of the company’s business model are set out in the table below:
Weighting (%)
MDState
Manager VIC & QLD
CFO and Company Secretary
Business development 15% 15% 15%
Developments 20% 20% 0%
Sales and customer experience 20% 20% 5%
Financial performance and risk management
15% 15% 40%
People and culture 15% 20% 20%
Shareholder engagement and satisfaction
10% 5% 20%
Sustainability 5% 5% 0%
Refer to section r) Executive remuneration outcomes for further details of performance outcomes for FY2015, and STI awards to KMP.
How is performance assessed?
On an annual basis, after consideration of performance against set balanced scorecard objectives, the Chairman and Chair of the Human Resource and Remuneration Committee recommends to the Board the amount of STI to be paid to the MD.
For senior executives, the Human Resource and Remuneration Committee will seek recommendations from the MD before making its determination.
The Human Resources and Remuneration Committee has the discretion to determine STI outcomes in the light of personal and company performance.
What happens if an Executive leaves Cedar Woods?
Executives who leave prior to the end of the financial year generally forego their entitlement. The Human Resources and Remuneration Committee has discretion in this regard.
Long-term incentives (LTI)
FY2015 LTI plan
The company operated a long term incentive plan, which first commenced in FY2012 with the final grants made in FY2015. The incentive was designed as a cash bonus opportunity that vests three years after award, based on company and individual performance criteria assessed in the first year and ongoing employment with the company for the remaining two years. The FY2015 LTI awards were based on the same criteria used for FY2015 STI awards, with KMP amounts detailed in section r) Executive remuneration outcomes.
If the employee left the company before the vesting date no bonus was paid, although the Board may waive this restriction at its discretion, for example when an employee retires. If an employee was made redundant after the award but before the vesting date then the bonus would be paid out.
In FY2015 a total of $447,000 was awarded under the incentive plan for participants, which will vest on 1 July 2017. The total awarded under the plan in previous years which has yet to vest is $315,750.

Dire
ctor
s’ R
epor
t: R
emun
erat
ion
Rep
ort
31
2015 ANNUAL REPORT
New LTI plan effective 1 July 2015
The company has introduced a new LTI plan, effective 1 July 2015. Key features of the new LTI plan are as follows:
Why have a new LTI plan? To encourage a greater alignment of the interests of executives and shareholders, focus on sustainable long term growth and attract and retain key executives.
Who participates? Executives and key staff. NEDs are not eligible to participate in the LTI plan.
What LTI’s are available? Each executive has a maximum LTI opportunity depending on the accountabilities of the role and impact on organisational performance. It is intended for annual grants to be made under the plan and over time for these to become a larger proportion of total remuneration, so as to keep total remuneration in check.The maximum LTI for each KMP is detailed in section r) Executive remuneration outcomes.
How is the LTI delivered? Awards under the LTI plan are made in the form of performance rights, which provide, when vested, one share at nil cost (provided the specified performance hurdle is met). No dividends are paid on unvested LTI awards.
How are the number of rights determined for each LTI grant?
The number of performance rights allocated for each executive is calculated by reference to the maximum LTI opportunity outlined in the prior section.Allocations are made based on a face value approach using the Volume Weighted Average Price of Cedar Woods’ shares over the first five trading days of the 2016 financial year. This fixes the maximum number of shares and the actual number will vest in accordance with the performance conditions set out below.
When does the LTI vest? The Board will determine the outcomes at the end of the three year performance period (1 July 2015 to 30 June 2018), with vesting, if any, occurring once results are released and within a trading window.
What happens if an Executive leaves Cedar Woods?
If cessation of employment occurs, the following treatment will apply in respect of unvested Shares:
• If the Participant ceases employment with Cedar Woods on resignation or on termination for cause, unvested Rights will normally be forfeited.
• If the Participant ceases employment in other circumstances (for example, due to illness, total or permanent disablement, retirement, redundancy or other circumstances determined by the Board), unvested Shares will stay ‘on foot’ and may vest at the end of the original performance period to the extent performance conditions are met. The Board may determine in its discretion that the number of Rights available to vest will be reduced pro-rata for time at the date employment ceases.
The Board will retain discretion to allow for accelerated vesting (pro-rated for performance and/or time) in special circumstances (as opposed to allowing unvested Shares to remain ‘on foot’ on cessation of employment).
What happens in the event of change of control
Unless the Board determines otherwise, a pro-rata number of the participant’s unvested awards will vest based on the proportion of the performance period that has passed at the time of the change of control. Vesting will also be subject to the achievement of pro-rata performance conditions at the time of the change of control.
Do participants receive dividends on LTI grants?
Not prior to any vesting.
Is performance retested if performance hurdles are not exceeded?
No, there are no further retests of the performance conditions.
Do clawback provisions apply to LTI’s?
The company has in place an incentive claw back policy for executives and other staff. Under the policy, the Board may at its absolute discretion claw back vested and unvested incentives in the case of an “inappropriate benefit” arising.

Dire
ctor
s’ R
epor
t: R
emun
erat
ion
Rep
ort
CEDAR WOODS PROPERTIES LIMITED
32
How is performance assessed and rewarded against these hurdles?
The awards are subject to two equally weighted performance conditions which operate independently, so that awards can be made under either or both categories.
Relative TSR hurdle (50%): The relative TSR hurdle provides a comparison of external performance. The ASX Small Industrials Index is comprised of the companies included in the S&P/ASX 300 (excluding companies in the S&P/ASX 100) who have a Global Industry Classification Standard (GICS) classification other than Energy or Metals & Mining, with Cedar Woods ranked approximately 100th of 155 companies in this index at present. TSR (Total Shareholder Return) measures changes to share price and dividends paid to show the total return and is widely used in the investment community.
Executives will only derive value from this component of the LTI if the company’s TSR performance is greater than the Index. Maximum vesting of the TSR hurdle at or above 15% of the Index recognises significant out-performance of the company over 3 years.
The vesting schedule is as follows:
Relative TSR performance outcome Percentage of TSR-tested rights vesting
< Index Nil
At the Index 50%
> Index and up to 15% above the Index Pro-rata between 50% and 100%
> = 15% above the Index 100%
EPS compound annual growth rate (50%): EPS is a method of calculating the performance of an organisation, capturing information regarding an organisation’s earnings in proportion to the total number of shares issued by the organisation. The EPS calculation is:
EPS = Statutory net profit after tax
Weighted number of shares on issue
Where:
Statutory net profit after tax: as reported by a company at the most recent financial-year end preceding the calculation date.
Weighted number of shares on issue: The weighted number of shares on issue for the financial year.
The relevant inputs when setting the EPS target range are generally:• The earnings and EPS targets contained in the Corporate plan, particularly with
reference to the most recent internal five year forecasts;
• The level of stretch associated with those business plan targets;
• Any earnings guidance that has been provided to the market;
• Shareholder and analyst (individual and consensus) expectations.
The vesting schedule for this component of the LTI is as follows:
EPS compound annual growth rate Percentage of EPS-tested rights vesting
< 5% Nil
5% 50%
Between 5% - 10% Pro-rata between 50% and 100%
> = 10% 100%

Dire
ctor
s’ R
epor
t: R
emun
erat
ion
Rep
ort
33
2015 ANNUAL REPORT
r) Executive remuneration outcomes for FY2015 (including link to performance)
Performance against STI balanced scorecard objectives
The table below outlines FY2015 STI objectives and performance against targets as assessed by the Board. This performance measurement framework will continue for FY2016, as it provides a close alignment to the company’s overriding objective of providing long term value to shareholders and links to our business model as described on page 7:
Objective Measures OutcomesPerformance assessment
Business development
To build and replenish the portfolio by acquiring quality assets
Undertake due diligence investigations for new acquisitions consistent with approved checklist and reporting measures in a thorough and disciplined manner
Heated acquisitions environment caused us to be selective on the sites we pursued. Detailed assessment of over 20 properties in each of VIC and QLD and 18 properties in WA. Submitted offers on numerous sites in each state.
Achieved
Acquire 1-2 new complementary projects each year, consistent with the corporate growth strategy
No new projects acquired during the year. Settled on new acquisition at Clayton South in Victoria
Not achieved
Pursue joint venture opportunities
Respond to existing joint venture partners with professionalism, transparency and quality outcomes
Existing joint ventures (or development agreements) in WA with LandCorp (Mangles Bay, Carine Rise & Western Edge), Dept. Lands (Elements) and Dept. of Housing (Harrisdale). Carine Rise and Elements successfully completed
Achieved
Seek new joint venture opportunities to add to project diversity and corporate reputation
No new joint venture projects during the year but discussions underway on several opportunities
Not achieved
Residential and commercial building
Establish alliances with builders to add value, product diversity and profitability
Builder alliances operating across most projects, adding diversity, sales and innovation. New initiatives under consideration
Achieved
Developments
Maximise value, minimize risk with project delivery on time and on budget.
Timely approvals achieved Approvals generally received in line with programs but with delays on some projects.
Upper Kedron project approval received ahead of program but subsequently called in by the QLD government. This has since been granted partial approval in July 2015.
Achieved
Enhanced value of sites Approvals generally received in line with highest and best use applications.
Successful rezoning at Bushmead. Upper Kedron lot yield approved in August 2015. Federal Environmental approvals achieved at Mangles Bay (WA) and Upper Kedron (QLD)
Achieved
Monthly reporting of actual vs budget development costs and program.
Delivery risk mitigated through appropriate contractual arrangements
Projects generally delivered within budget, with some delays
Achieved

Dire
ctor
s’ R
epor
t: R
emun
erat
ion
Rep
ort
CEDAR WOODS PROPERTIES LIMITED
34
Objective Measures OutcomesPerformance assessment
Developments (continued)
Create quality communities which embrace innovation and sustainable development
Compliance with Corporate Sustainability Policy
Innovation and quality in projects
Good environmental initiatives achieved across the projects
Environmental (Enviro) Accreditation at Carine (WA)
Recipient of the Water Corporation “Waterwise Development Accreditation’’
Achieved
Achieved
Sales and customer experience
Position projects to meet market and customer demand
Settlements Settlements achieved to meet company forecast
Achieved
Sales Budgeted sales not achieved Not achieved
Enquiry & conversion rates Satisfactory Achieved
Budget expenditure Expenditure within budget Achieved
Pricing Pricing generally at budget levels Achieved
Customer satisfaction Increased buyer referrals and recent buyer survey results demonstrate improved sale service
Achieved
Financial performance and risk management
Continued growth in a risk controlled manner
Growth in NPAT and EPS NPAT up 6% and EPS down 0.1%, below EPS growth target
Not achieved
Satisfactory ROE and ROC ROE 14.9%, ROC 19.5% both above company benchmarks
Achieved
Conservative gearing (debt/equity) Gearing 10%, below target range but conservative
Achieved
Capital management Maintained capital availability on satisfactory terms
Achieved
Risk management framework in place
Risks identified and mitigated Achieved
People and culture
Attract, motivate and retain staff
Be a preferred employer Quality staff were attracted to the business
Achieved
Progressive HR policies & initiatives were reviewed and introduced: - New induction procedures and
exit interviews - Wellbeing program and staff
benefits - New careers section on website
Achieved
Succession planning & leadership training
Selected staff undertook courses, on the job training and attended industry events
Achieved
Staff productivity Key targets achieved, costs minimised, low absenteeism, performance management undertaken
Partially achieved
Staff development Numerous group training programs undertaken including consumer law, public speaking. Systems improved to achieve better collaboration and performance management
Achieved

Dire
ctor
s’ R
epor
t: R
emun
erat
ion
Rep
ort
35
2015 ANNUAL REPORT
Objective Measures OutcomesPerformance assessment
Shareholder engagement and satisfaction
Shareholders support the company
Participation in share issues Recommenced dividend reinvestment plan and bonus share plan
Achieved
Company investor relations program Positive feedback including from survey of institutional investors
Achieved
Total shareholder return (TSR) TSR for 1, 3 and 5 years shown on page 36, unsatisfactory for 1 year, satisfactory for 3 and 5 years
Partially achieved
Support for board resolutions Board resolutions supported by shareholders at 2014 AGM
Achieved
Proxy advisors support board resolutions
Two of three proxy advisor firms did not support 2014 remuneration report resolution but all other resolutions supported
Not achieved
Sustainability
Environment; Optimising land use; Housing Diversity; Heritage; OH&S compliance
Enhance and rehabilitate environmental assets and remediate contamination as an integral part of project delivery
Environmental assessment and statutory compliance across all projects. EnviroDevelopment accreditation at Carine Rise.
Achieved
Promoting total water cycle management and water use and energy efficiency
Urban water management strategies and plans prepared for all projects, energy initiatives implemented
Achieved
Delivering the best use of land by optimising land use mix and product yield in the context of high quality urban places that deliver quality of life
All projects addressing statutory land use and density yield targets
Achieved
Promoting equality of access to housing for all sectors of the community
Housing diversity targets met for each project. Specific affordable housing strategies implemented at Elements, Carine Rise and Harrisdale
Achieved
Recognising indigenous and cultural heritage
Heritage assessments undertaken for all projects. Heritage vales protected through project themes
Achieved
Providing a safe working environment for staff and stakeholders
Policy compliance. OH&S system enhancements to be completed
Partially achieved
The following table outlines the proportion of maximum STI earned and forfeited in relation to FY2015 and the maximum STI that was available.
Proportion of maximum STI earned in FY2015
Proportion of maximum STI forfeited in FY2015
MDState Manager
VIC & QLD
CFO and Company Secretary
MDState Manager
VIC & QLD
CFO and Company Secretary
Total % 86% 87% 89% 14% 13% 11%
Total $ $387,000 $95,700 $57,850 $63,000 $14,300 $7,150
Max STI opportunity $450,000 $110,000 $65,000

Dire
ctor
s’ R
epor
t: R
emun
erat
ion
Rep
ort
CEDAR WOODS PROPERTIES LIMITED
36
Performance against LTI objectives
For the LTI scheme in place in FY2015, LTI awards were based on company and individual performance criteria assessed in the first year and are subject to ongoing employment with the company for the remaining two years.
The following table outlines the proportion of maximum LTI earned and forfeited in relation to FY2015 and the maximum LTI that was available. The LTI outcomes in FY2015 were based on the same criteria used for FY2015 STI awards. From 1 July 2015 a new equity based LTI scheme has been introduced, as described on page 31.
Proportion of maximum LTI earned in FY2015
Proportion of maximum LTI forfeited in FY2015
MDState Manager
VIC & QLD
CFO and Company Secretary
MDState Manager
VIC & QLD
CFO and Company Secretary
Total % 86% 87% 89% 14% 13% 11%
Total $ $21,500 $60,900 $35,600 $3,500 9,100 $4,400
Max LTI opportunity $25,000 $70,000 $40,000
The LTI awards earned vest on 1 July 2017 subject to the service period condition.
Performance of shareholder return metrics
In FY2015, the company delivered a record profit of $42.6 million, an increase of 6 per cent. This was the fifth consecutive record profit for the company.
The returns to shareholders of Cedar Woods Properties Limited over the last 1, 3 and 5 years are detailed in the table below:
Returns to shareholders over 1, 3 and 5 years (%) 1 year 3 years 5 years
EPS growth (0.1) 0.7 13.4
Share price growth (28.0) 13.9 16.5
Dividend growth (paid dividend) 1.8 6.1 18.0
CWP TSR (change in share price and dividends) (23.5) 21.5 26.0
S&P Small Industrials Index (XSIAI) 7.1 12.2 9.7
The total shareholder return in FY2015 was -23.5 per cent which compared unfavourably with the S&P Small Industrials Index total return of 7.1 per cent over the same period. However, the returns over 3 and 5 years compare favourably to the returns of the S&P Small Industrials Index. Management is focussed on delivering consistent earnings per share and dividend growth. The company’s share price is subject to market factors that are beyond the company’s control.
The measures of the company’s financial performance over the last five years as required by the Corporations Act 2001 are shown in the table below. However, these are not necessarily consistent with the measures used in determining the variable amounts of remuneration awarded to KMP, the basis for which is outlined above. As a consequence, there may not always be a direct correlation between the statutory key performance measures and the variable remuneration awarded.
2015 2014 2013 2012 2011
Profit for the year ($’000) 42,585 40,313 36,337 34,250 28,060
Basic earnings per share (cents) 54.3 54.4 49.9 53.2 45.8
Dividends per share (cents) 28.0 27.5 26.0 25.0 23.0
Increase (decrease) in share price (%) (28.0) 41.4 45.2 (11.0) 63.3

Dire
ctor
s’ R
epor
t: R
emun
erat
ion
Rep
ort
37
2015 ANNUAL REPORT
Executive remuneration for the years ended 30 June 2015 and 30 June 2014
Details of the remuneration of each executive of Cedar Woods Properties Limited is set out below.
Short-term benefitsPost
EmploymentLong-term benefits
NameFinancial
year
Cash salary and fees
$
Cash bonus
$
Non-monetary benefits
$
Super-annuation
$
Cash bonus
$
Long- service leave
$
Termination Benefit
$Total
$
Perfor- mance related
%
Executive director
P S Sadleir 2015 765,393 387,000 7,990 33,699 21,500 13,338 - 1,228,920 33%
2014 772,270 427,500 7,268 23,730 - 24,128 - 1,254,896 34%
Senior executives
N Blackburne 2015 381,217 95,700 7,972 18,783 60,900 9,362 - 573,934 27%
2014 362,225 100,000 12,754 17,775 40,000 14,437 - 547,191 26%
P Freedman 2015 330,000 57,850 1,112 35,000 35,600 11,432 - 470,994 20%
2014 320,000 57,000 1,236 25,000 23,750 9,511 - 436,497 19%
S Duplock 2015 33,353 - 1,085 5,833 - - 124,500 164,771 -
2014 305,000 42,000 1,732 25,000 - - - 373,732 11%
Total 2015 1,509,963 540,550 18,159 93,315 118,000 34,133 124,500 2,438,619
2014 1,759,495 626,500 22,990 91,505 63,750 48,076 - 2,612,316
s) Executives contracts
Remuneration arrangements for executives are formalised in employment agreements. The following outlines the details of these agreements.
Details of renegotiated executive service contract for the Managing Director
The Managing Director, Mr Sadleir is employed under an ongoing contract.
Mr Sadleir’s total remuneration package for FY2015 was as follows:
• Fixed remuneration of $800,000 per annum
• Maximum STI opportunity is 35% of total remuneration
• Maximum LTI opportunity of 2% of total remuneration.
Service agreements
Remuneration and other terms of employment for the executives are formalised in employment agreements. The agreements for the executives provide for performance related cash bonuses and other benefits. The agreements are reviewed annually by the Human Resources and Remuneration Committee for each KMP and details are as follows:
Contract termNotice required to terminate contract
Termination benefit*
Executive director P S Sadleir
No fixed term 12 months See below**
Other senior executives No fixed term Up to 3 months Up to 3 months base salary
* For treatment of STI and LTI awards upon cessation of employment please refer to incentive plan section.
** As well as allowing for participation (subject to shareholder approval) in the LTI Plan, Mr Sadleir’s contract has been varied such that on termination by the Company on ordinary notice or if he resigns following a material variation/ diminution in his role, responsibilities or status he will be entitled to be paid the maximum amount permitted under section 200G of the Corporations Act. Taking into account Mr. Sadleir’s period of service, the maximum payment under the Act would be the average annual base salary that Mr. Sadleir received from the company and related bodies corporate during the previous 3 years.

Dire
ctor
s’ R
epor
t: R
emun
erat
ion
Rep
ort
CEDAR WOODS PROPERTIES LIMITED
38
t) Non-Executive Director fee arrangements
Determination of fees and maximum aggregate NED fee pool
On appointment to the Board, all NEDs enter into a service agreement with the company in the form of a letter of appointment. The letter details the terms, including fees, relevant to the office of the NED. Fees and payments to NEDs reflect the demands which are made on, and the responsibilities of the NEDs.
NEDs’ receive an additional fee for chairing committees (no additional fees are paid for committee membership). No additional fees are paid for memberships of directors on subsidiary Boards. NEDs’ fees and payments are reviewed from time to time by the Board, taking into account comparable roles and market data. NEDs do not receive performance based remuneration.
Remuneration of NEDs is determined by the Board, after receiving recommendations from the Human Resources and Remuneration Committee, within the maximum aggregate amount approved by the shareholders from time to time (currently set at $750,000). The total of NED fees paid in FY2015 was $469,450 .The Board will not seek any increase for the NED maximum aggregate fee pool at the FY2015 AGM.
Fee policy
NEDs’ annual fees were last reviewed from FY2015 (effective date: 1 July 2014).
The annual fees (inclusive of superannuation) for FY2014 and FY2015 are set out in the table below:
FY2015 $
FY2014 $
Chair 151,700 148,000
Deputy Chair 116,850 114,000
Other NEDs 82,000 80,000
Committee Chair 12,300 12,000
Committee member Nil Nil
The table below outlines fees paid to NEDs for FY2015 and FY2014 in accordance with statutory rules and applicable accounting standards.
NED remuneration for the years ended 30 June 2015 and 30 June 2014
Short-term benefits Post employment
Name Financial year
Board and committee fees
$Superannuation
$Total
$
W G Hames 2015 138,538 13,162 151,700
2014 135,469 12,531 148,000
R S Brown 2015 106,712 10,138 116,850
2014 104,348 9,652 114,000
R Packer 2015 85,201 33,698 118,900
2014 82,270 33,730 116,000
S T Pearce* 2015 74,885 7,115 82,000
2014 9,312 861 10,173
Total 2015 405,336 64,113 469,450
2014 331,399 56,774 388,173

Dire
ctor
s’ R
epor
t: R
emun
erat
ion
Rep
ort
39
2015 ANNUAL REPORT
u) Additional statutory disclosures
Equity instrument disclosures relating to KMP
The numbers of ordinary shares in the company held during the financial year by each director and other KMP of Cedar Woods Properties Limited, including their personally-related parties, are set out below. There were no shares granted during the period as remuneration.
2015
Number of shares at the
start of the yearOther changes during the year
Number of shares at the
end of the year
NEDs
W G Hames† 9,905,406 177,153 10,082,559
RS Brown* 7,973,135 12,449 7,985,584
R Packer 166,782 1,077 167,859
S T Pearce 15,000 0 15,000
T S Brown (alternate for R S Brown)* 4,639,980 0 4,639,980
Executive Directors
P S Sadleir 1,049,529 0 1,049,529
Senior executives
P Freedman 103,619 2,293 105,912
N J Blackburne 17 18,286 18,303
S A Duplock 0 0 0
2014
Number of shares at the
start of the yearOther changes during the year
Number of shares at the
end of the year
NEDs
W G Hames† 9,708,448 196,958 9,905,406
R S Brown* 7,951,808 21,327 7,973,135
R Packer 160,586 6,196 166,782
S T Pearce - 15,000 15,000
T S Brown (alternate for R S Brown)* 4,639,980 - 4,639,980
Executive Directors
P S Sadleir 1,077,087 (27,558) 1,049,529
Senior executives
P Freedman 146,245 (42,626) 103,619
N J Blackburne 118,770 (118,753) 17
S A Duplock 5,576 (5,576) 0
† Includes 2,014,439 (2014 – 2,014,439) shares over which W G Hames has voting rights and a first right of refusal to purchase.
* Interest of T R Brown relates to shares also shown under R S Brown.
The interests shown above comply with AASB124 Related Party Disclosures and differ to those shown at item l) of the directors’ report which comply with the requirements of sections 608 and 609 of the Corporations Act 2001. The table above includes the shares held by related parties of the KMP.

Dire
ctor
s’ R
epor
t: R
emun
erat
ion
Rep
ort
CEDAR WOODS PROPERTIES LIMITED
40
Other transactions with key management personnel
The consolidated entity uses a number of firms for architectural, urban design and planning services, creative design services and settlement services. Accordingly the company has a high level of knowledge regarding commercial rates for these services.
Where entities related to directors are able to fulfil the requisite criteria to provide the services at competitive rates, they may be engaged by the company to perform the services. Should entities connected with the directors be engaged, the directors declare their interests in those dealings and take no part in decisions relating to them.
During the year planning, architectural and consulting services were provided by Hames Sharley Architects of which Mr W G Hames is a principal. The transactions were performed on normal commercial terms and conditions and fees paid were consistent with market rates.
During the year creative design services were provided by Axiom Design, an entity associated with the family of Mr W G Hames. Mr Hames has no beneficial interest in Axiom Design. The services were performed on normal commercial terms and conditions. The level of services increased during the year due to additional shareholder reporting and increased corporate marketing activities.
Property settlement charges were paid to Westland Settlement Services Pty Ltd, a company associated with the family of Mr R S Brown. The charges were based on normal commercial terms and conditions. At the estates that Westland Settlement Services was engaged, the number of lots that settled in FY2015 was double that of the previous year and as a result the value of transactions with Westland Settlement Services Pty Ltd increased.
Cedar Woods has for many years been a member of the Australian Institute of Company Directors (AICD). During the year Mr P S Sadleir became a council member of AICD WA. The annual subscription paid was performed on normal commercial terms and conditions.
In 2014 and 2015 payments were made for sponsorship of the Warren Jones Foundation Inc. of which Mr R Packer is a trustee with no beneficial interest. The transactions were performed on normal commercial terms and conditions.
Aggregate amounts of each of the above types of other transactions with key management personnel of Cedar Woods Properties Limited or their related entities:
2015 $
2014$
Amounts recognised as expense
Creative design services 59,585 34,178
Settlement fees 131,440 66,835
Donations 0 2,500
Subscriptions 10,000 0
Sponsorships 7,650 7,650
208,675 111,163
Amounts recognised as inventory
Architectural fees 59,749 187,903
Total amounts recognised in year 268,424 299,066
Aggregate amounts of assets at balance date relating to the above types of other transactions with directors of Cedar Woods Properties Limited or their related entities:
Investment property 59,749 187,903
59,749 187,903
There are no aggregate amounts payable to directors of Cedar Woods Properties Limited, or their related entities, at balance date relating to the above types of other transactions.
v) Independent audit of remuneration report
The remuneration report has been audited by PricewaterhouseCoopers (PwC). See page 101 of this annual report for PwC’s report on the remuneration report.

Dire
ctor
s’ R
epor
t (c
ontin
ued)
41
2015 ANNUAL REPORT
Directors’ Report (continued)
w) Retirement, election and continuation in office of directors
Mr William Hames retires by rotation at the forthcoming Annual General Meeting and being eligible, will offer himself for re-election.
x) Insurance of officers
During the financial year, Cedar Woods Properties Limited paid a premium in respect of directors’ and officers’ liabilities that indemnifies certain officers of the company and its controlled entities. The officers of the company covered by the insurance policy include the directors, W G Hames, R S Brown, R Packer, S T Pearce, P S Sadleir and the Company Secretary, P S Freedman. The liabilities insured include costs and expenses that may be incurred in defending civil or criminal proceedings that may be brought against the officers in their capacity as officers of the company and its controlled entities. The directors have not included more specific details of the nature of the liabilities covered or the amount of the premium paid in respect of the policy, as such disclosure is prohibited under the terms of the contract.
y) Non-audit services
The group may decide to employ the auditor on assignments additional to their statutory audit duties where the auditor’s expertise and experience with the company and/or group are important.
Details of the amounts paid or payable to the auditor for audit and non-audit services provided during the year are set out in note E2 in the other information section of this report.
The Board of directors has considered the position and, in accordance with the advice received from the Audit and Risk Management Committee, is satisfied that the provision of the non-audit services is compatible with the general standard of independence for auditors imposed by the Corporations Act 2001. The directors are satisfied that the provision of non-audit services by the auditor did not compromise the auditor independence requirements of the Corporations Act 2001 for the following reasons:
• All non-audit services have been reviewed by the Audit and Risk Management Committee to ensure they do not impact the impartiality and objectivity of the auditor
• None of the services undermine the general principles relating to auditor independence as set out in APES 110 Code of Ethics for Professional Accountants.
z) Auditor’s independence declaration
A copy of the auditor’s independence declaration as required under section 307C of the Corporations Act 2001 forms part of this directors’ report and is set out on page 42.
aa) Rounding of amounts
The company is of a kind referred to in Class Order 98/0100, issued by the Australian Securities and Investments Commission, relating to the ‘rounding off’ of amounts in the directors’ report. Amounts in the directors’ report have been rounded off in accordance with that class order to the nearest thousand dollars, or in certain cases, to the nearest dollar.
The directors reporting including the remuneration report is signed in accordance with a resolution of the directors of Cedar Woods Properties Ltd.
P S Sadleir Managing Director
25 August 2015

Aud
itor’s
Inde
pend
ence
Dec
lara
tion
42
CEDAR WOODS PROPERTIES LIMITED
42
PricewaterhouseCoopers, ABN 52 780 433 757 Brookfield Place, 125 St Georges Terrace, PERTH WA 6000, GPO Box D198, PERTH WA 6840 T: +61 8 9238 3000, F: +61 8 9238 3999, www.pwc.com.au Liability limited by a scheme approved under Professional Standards Legislation.
Auditor’s Independence Declaration
As lead auditor for the audit of Cedar Woods Properties Limited for the year ended 30 June 2015, I declare that to the best of my knowledge and belief, there have been:
a) no contraventions of the auditor independence requirements of the Corporations Act 2001 in relation to the audit; and
b) no contraventions of any applicable code of professional conduct in relation to the audit.
This declaration is in respect of Cedar Woods Properties Limited and the entities it controlled during the period.
Douglas Craig Partner PricewaterhouseCoopers
Perth 25 August 2015
Auditor’s Independence Declaration

43

Fina
ncia
l Sta
tem
ents
CEDAR WOODS PROPERTIES LIMITED
44
Financial Statements
Consolidated Statement of Profit or Loss and Other Comprehensive Income .................................................................... 45
Consolidated Balance Sheet .............................................................................................................................................. 46
Consolidated Statement of Changes in Equity ................................................................................................................... 47
Consolidated Cash Flow Statement ................................................................................................................................... 48
These financial statements are consolidated financial statements for the group consisting of Cedar Woods Properties Limited and its subsidiaries. A list of major subsidiaries is included in note C1(a).
The financial statements are presented in the Australian currency.
Cedar Woods Properties Limited is a company limited by shares, incorporated and domiciled in Australia.
Its registered office and principal place of business is:
Ground Floor, 50 Colin Street WEST PERTH WA 6005.
The financial statements were authorised for issue by the directors on 25 August 2015. The directors have the power to amend and reissue the financial statements.

Fina
ncia
l Sta
tem
ents
45
2015 ANNUAL REPORT
Consolidated Statement of Profit or Loss and Other Comprehensive IncomeFor the Year Ended 30 June 2015
Consolidated
Note2015$’000
2014$’000
Revenue from operations
Sale of land and buildings 170,359 195,631
Services 2,830 15,908
Rent from properties 4,018 1,295
Interest revenue 1,430 1,631
178,637 214,465
Gain on sale of investment property A1(a) 19,969 -
Other Income 60 166
Expenses
Cost of sales of land and buildings (99,438) (121,473)
Cost of providing services (949) (11,167)
Other expenses from ordinary activities:
Project operating costs (17,583) (13,258)
Occupancy (739) (581)
Administration (13,442) (13,312)
Other A1(b) (6,368) 359
Finance costs A1(b) (3,397) (606)
Share of net profit (loss) of joint ventures accounted for using the equity method C1(d)i 1,073 973
Profit before income tax 57,823 55,566
Income tax expense A1(c) (15,238) (15,253)
Profit for the year A4(c) & A1(d) 42,585 40,313
Total comprehensive income for the year 42,585 40,313
Total comprehensive income attributable to members of Cedar Woods Properties Limited 42,585 40,313
Earnings per share for profit attributable to the ordinary equity holders of the company:
Basic and diluted earnings per share A1(d) 54.3 cents 54.4 cents
The above consolidated statement of profit or loss and other comprehensive income should be read in conjunction with the accompanying notes.

Fina
ncia
l Sta
tem
ents
CEDAR WOODS PROPERTIES LIMITED
46
Consolidated Balance SheetAs at 30 June 2015
Consolidated
Note2015$’000
2014$’000
ASSETS
Current assets
Cash and cash equivalents A2(a) 1,886 8,796
Trade and other receivables A2(b) 9,475 10,057
Inventories A3(a) 59,181 80,895
Deferred development costs A3(b) 6,495 134
Total current assets 77,037 99,882
Non-current assets
Receivables A2(b) 3,069 4,618
Inventories A3(a) 251,109 249,698
Deferred development costs A3(b) 5,868 8,854
Investments accounted for using the equity method A3(c) 3,975 2,902
Available-for-sale financial assets A2(c) 1,029 7,397
Property, plant and equipment A3(d) 2,479 1,668
Investment properties A3(e) 37,982 34,929
Lease incentives A3(e) 782 -
Total non-current assets 306,293 310,066
Total assets 383,330 409,948
LIABILITIES
Current liabilities
Trade and other payables A2(d) 16,063 26,306
Borrowings A2(f) 22,481 -
Other financial liabilities A2(g) - 34,316
Derivative financial instruments A2(e) - 644
Current tax liabilities 8,679 5,998
Provisions A3(g) 8,365 6,810
Total current liabilities 55,588 74,074
Non-current liabilities
Borrowings A2(f) 7,313 41,398
Other financial liabilities A2(g) 32,106 30,241
Deferred tax liabilities A3(f) 2,236 2,185
Provisions A3(g) 414 449
Derivative financial instruments A2(e) 68 -
Total non-current liabilities 42,137 74,273
Total liabilities 97,725 148,347
Net assets 285,605 261,601
EQUITY
Contributed equity A4(a) 119,525 116,716
Reserves A4(b) 186 309
Retained profits A4(c) 165,894 144,576
Total equity 285,605 261,601
The above consolidated balance sheet should be read in conjunction with the accompanying notes.

Fina
ncia
l Sta
tem
ents
47
2015 ANNUAL REPORT
Consolidated Statement of Changes in EquityFor the Year Ended 30 June 2015
Consolidated Note
Contributed equity$’000
Reserves$’000
Retained profits$’000
Total$’000
Balance at 1 July 2013 83,795 496 123,453 207,744
Profit for the year - - 40,313 40,313
Total comprehensive income for the year - - 40,313 40,313
Transactions with owners in their capacity as owners:
Contributions of equity, net of transaction costs and tax A4(a) 32,921 - - 32,921
Transfers from reserves to retained profits - (187) 187 -
Dividends provided for or paid B3(b) - - (19,377) (19,377)
32,921 (187) (19,190) 13,544
Balance at 30 June 2014 116,716 309 144,576 261,601
Balance at 1 July 2014 116,716 309 144,576 261,601
Profit for the year - - 42,585 42,585
Total comprehensive income for the year - - 42,585 42,585
Transactions with owners in their capacity as owners:
Contributions of equity, net of transaction costs and tax A4(a) 2,809 - - 2,809
Transfers from reserves to retained profits - (123) 123 -
Dividends provided for or paid B3(b) - - (21,390) (21,390)
2,809 (123) (21,267) (18,581)
Balance at 30 June 2015 119,525 186 165,894 285,605
The above consolidated statement of changes in equity should be read in conjunction with the accompanying notes.

Fina
ncia
l Sta
tem
ents
Fina
ncia
l Sta
tem
ents
CEDAR WOODS PROPERTIES LIMITED
48
Consolidated Cash Flow StatementFor the Year Ended 30 June 2015
Consolidated
Note2015$’000
2014$’000
Cash flows from operating activities
Receipts from customers (incl. GST) 194,015 231,610
Payments to suppliers and employees (incl. GST) (46,777) (52,179)
Payments for land and development (120,620) (158,149)
Interest received 595 589
Borrowing costs paid (6,163) (5,400)
Income taxes paid (12,502) (18,265)
Net cash inflows (outflows) from operating activities A5(a) 8,548 (1,794)
Cash flows from investing activities
Proceeds from sale of investment properties 36,000 -
Proceeds from sale of property, plant and equipment - 3
Repayments of loan by Cedar Woods Wellard Limited 2,796 6,000
Advance of loan to BCM Apartment Trust (7,005) (1,855)
Payments for investment properties (15,938) (9,781)
Payments for property, plant and equipment (1,130) (699)
Net cash inflows (outflows) from investing activities 14,723 (6,332)
Cash flows from financing activities
Proceeds from borrowings 22,481 600
Repayment of borrowings (34,082) -
Proceeds from share placement - 25,030
Proceeds from share purchase plan - 5,036
Payment of share issue expenses (15) (822)
Dividends paid B3(b) (18,565) (15,939)
Net cash (outflows) inflows from financing activities (30,181) 13,905
Net (decrease) increase in cash and cash equivalents (6,910) 5,779
Cash and cash equivalents at the beginning of the year 8,796 3,017
Cash and cash equivalents at the end of the year A2(a) 1,886 8,796
The above consolidated cash flow statement should be read in conjunction with the accompanying notes.

Not
es t
o th
e Fi
nanc
ial S
tate
men
ts
49
2015 ANNUAL REPORT
Notes to the Financial StatementsThese are the consolidated financial statements of Cedar Woods Properties Limited and its subsidiaries. A list of major subsidiaries is included in note C1.
The Financial statements are presented in the Australian currency.
The notes are set out in the following main sections:
A How the numbers are calculated:
Provides a breakdown of those individual line items in the financial statements that the directors consider most relevant in the context of the operations of the group, or where there have been significant changes that required specific explanations; the section further explains what accounting policies have been applied to determine these line items and how the amounts were affected by significant estimates and judgements made in calculating the final numbers.
B Financial risks:
Discusses the group’s exposure to various financial risks, explains how these affect the group’s financial position and performance and what the group does to manage these risks.
C Group structure:
Explains significant aspects of the group structure and how changes have affected the financial position and performance of the group.
D Unrecognised items:
Provides information about items that are not recognised in the financial statements, but could potentially have a significant impact on the group’s financial position and performance.
E Other information:
Information that is not immediately related to individual line items in the financial statements, such as related party transactions, share based payments and a full list of the accounting policies applied by the entity.
F Declaration and independent auditor’s report
Contains the director’s declaration and the independent report.

A –
How
the
Num
bers
are
Cal
cula
ted
CEDAR WOODS PROPERTIES LIMITED
50
Section A: How the Numbers are Calculated
This section provides a breakdown of those individual line items in the financial statements that the directors consider most relevant in the context of the operations of the group, or where there have been significant changes that required specific explanations, what accounting policies have been applied to determine these line items and how the amounts were affected by significant estimates and judgements made in calculating the final numbers.
A1. Profit or loss Information ................................................................................................................................... 51
a) Gain on sale of investment property ..................................................................................................................... 51
b) Expense items ..................................................................................................................................................... 52
c) Income tax ........................................................................................................................................................... 52
d) Earnings per share ............................................................................................................................................... 52
A2. Financial assets and financial liabilities ............................................................................................................ 53
a) Cash and cash equivalents .................................................................................................................................. 54
b) Trade and other receivables ................................................................................................................................. 54
c) Available-for-sale financial assets ......................................................................................................................... 55
d) Trade and other payables ..................................................................................................................................... 55
e) Derivative financial instruments ............................................................................................................................ 56
f) Borrowings .......................................................................................................................................................... 56
g) Other financial liabilities ........................................................................................................................................ 57
A3. Non-Financial assets and liabilities .................................................................................................................. 58
a) Inventories ........................................................................................................................................................... 59
b) Deferred development costs ................................................................................................................................ 59
c) Investments accounted for using the equity method ............................................................................................ 59
d) Property, plant and equipment ............................................................................................................................. 59
e) Investment properties .......................................................................................................................................... 60
f) Deferred tax ......................................................................................................................................................... 61
g) Provisions ............................................................................................................................................................ 63
A4. Equity ................................................................................................................................................................. 64
a) Movement in ordinary share capital ...................................................................................................................... 64
b) Reserves .............................................................................................................................................................. 65
c) Retained profits .................................................................................................................................................... 65
A5. Cash flow information ........................................................................................................................................ 66
a) Reconciliation of profit after income tax to net cash outflows from operating activities .......................................... 66

A1
– H
ow t
he N
umbe
rs a
re C
alcu
late
d
A1. Profit or Loss Information
a) Gain on sale of investment property
Consolidated
Notes2015$’000
2014$’000
Gain on sale of investment property
Proceeds from sale of investment property 36,000 -
Carrying value of investment property disposed (16,031) -
Net gain on disposal of investment property 19,969 -
b) Expense items
Profit before income tax expense includes the following specific expenses:
Consolidated
Notes2015$’000
2014$’000
Finance costs
Interest and finance charges 5,822 5,458
Calculated using effective interest method 2,592 1,330
Unrealised financial instrument gains (577) (920)
Less: amount capitalised i. (4,440) (5,262)
Finance costs expensed 3,397 606
i. Capitalised borrowing costs
Where qualifying assets have been financed by the entity’s corporate facility, the capitalisation rate used to determine the amount of borrowing costs to be capitalised is the weighted average interest rate applicable to the entity’s corporate facility during the year, in this case 5.10% (2014 – 6.09%) per annum. Where qualifying assets are financed by specific facilities, the applicable borrowing costs of those facilities are capitalised.
Consolidated
2015$’000
2014$’000
Net loss on disposal of property, plant and equipment 18 43
Rental expense relating to operating leases
Minimum lease payments 803 664
Other provisions
Provision for customer rebates 3,671 2,450
Superannuation funds – defined contribution 778 704
Depreciation of property, plant and equipment 301 282
Depreciation of investment property 1,015 314
Employee benefits expense 9,774 9,697
Other - write down of assets / (reversal of provision)
Available for sale financial assets 6,368 676
Reversal of provision for impairment of loan to Cedar Woods Wellard Limited - (1,035)
6,368 (359)
51
2015 ANNUAL REPORT
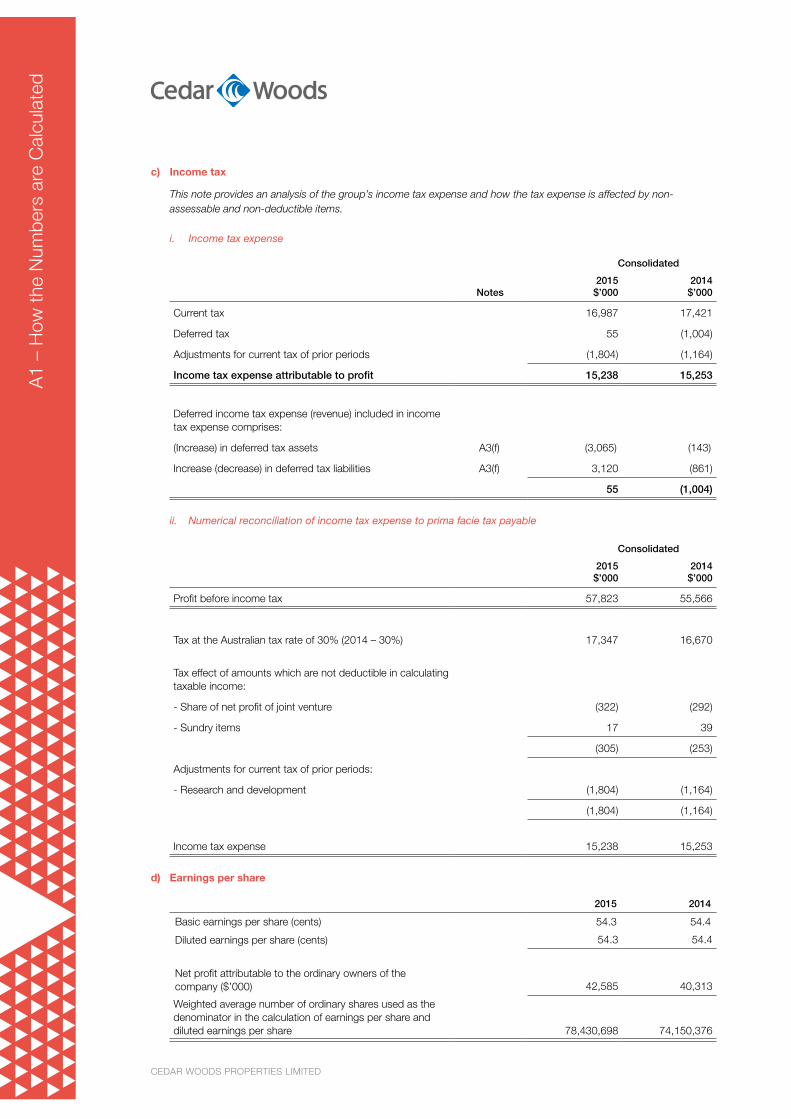
c) Income tax
This note provides an analysis of the group’s income tax expense and how the tax expense is affected by non-assessable and non-deductible items.
i. Income tax expense
Consolidated
Notes2015$’000
2014$’000
Current tax 16,987 17,421
Deferred tax 55 (1,004)
Adjustments for current tax of prior periods (1,804) (1,164)
Income tax expense attributable to profit 15,238 15,253
Deferred income tax expense (revenue) included in income tax expense comprises:
(Increase) in deferred tax assets A3(f) (3,065) (143)
Increase (decrease) in deferred tax liabilities A3(f) 3,120 (861)
55 (1,004)
ii. Numerical reconciliation of income tax expense to prima facie tax payable
Consolidated
2015$’000
2014$’000
Profit before income tax 57,823 55,566
Tax at the Australian tax rate of 30% (2014 – 30%) 17,347 16,670
Tax effect of amounts which are not deductible in calculating taxable income:
- Share of net profit of joint venture (322) (292)
- Sundry items 17 39
(305) (253)
Adjustments for current tax of prior periods:
- Research and development (1,804) (1,164)
(1,804) (1,164)
Income tax expense 15,238 15,253
d) Earnings per share
2015 2014
Basic earnings per share (cents) 54.3 54.4
Diluted earnings per share (cents) 54.3 54.4
Net profit attributable to the ordinary owners of the company ($’000) 42,585 40,313
Weighted average number of ordinary shares used as thedenominator in the calculation of earnings per share and diluted earnings per share 78,430,698 74,150,376
A1
– H
ow t
he N
umbe
rs a
re C
alcu
late
d
CEDAR WOODS PROPERTIES LIMITED
52

A2
– H
ow t
he N
umbe
rs a
re C
alcu
late
d
A2. Financial Assets and Financial LiabilitiesThis note provides information about the group’s financial instruments, including:
i. Specific information about each type of financial instrument
ii. Accounting policies
iii. Information about determining the fair value of the instruments, including judgements and estimation uncertainty involved
The group holds the following financial instruments:
Financial Assets NotesAvailable
for sale
Financial assets at
amortised cost Total
2015 $’000 $’000 $’000
Cash and cash equivalents A2(a) - 1,886 1,886
Trade and other receivables* A2(b) - 10,796 10,796
Available-for-sale financial assets A2(c) 1,029 - 1,029
Total 1,029 12,682 13,711
2014
Cash and cash equivalents A2(a) - 8,796 8,796
Trade and other receivables* A2(b) - 12,425 12,425
Available-for-sale financial assets A2(c) 7,397 - 7,397
Total 7,397 21,221 28,618
* Excluding prepayments
Financial Liabilities NotesDerivatives used
for hedgingLiabilities at
amortised cost Total
2015 $’000 $’000 $’000
Trade and other payables A2(d) - 16,063 16,063
Borrowings A2(f) - 29,794 29,794
Derivative financial instruments A2(e) 68 - 68
Other financial liabilities A2(g) - 32,106 32,106
Total 68 77,963 78,031
2014
Trade and other payables A2(d) - 26,306 26,306
Borrowings A2(f) - 41,398 41,398
Derivative financial instruments A2(e) 644 - 644
Other financial liabilities A2(g) - 64,557 64,557
Total 644 132,261 132,905
53
2015 ANNUAL REPORT

A2
– H
ow t
he N
umbe
rs a
re C
alcu
late
d
a) Cash and cash equivalents
Consolidated
2015$’000
2014$’000
Cash at bank and in hand 1,886 8,796
1,886 8,796
The above figure reconciles to the amount of cash shown in the statement of cash flows at the end of the year.
Cash at bank includes cash held in day to day bank transaction accounts and deposit accounts earning interest from 0 to 2.0% (2014: 0 – 2.8%) per annum depending on the balances.
The Group’s exposure to interest rate risk is discussed in section B2. Financial risk management. The maximum exposure to credit risk at the reporting date is the carrying amount of each class of cash and cash equivalents mentioned above.
b) Trade and other receivables
Consolidated
Notes2015$’000
2014$’000
Current
Trade receivables i & ii 982 7,759
Other receivables i & ii 122 48
Loan to BCM Apartment Trust (Secured) v 6,623 -
Prepayments 1,748 2,250
9,475 10,057
Non-Current
Loans – employee share scheme (discontinued) E3 29 34
Loan to BCM Apartment Trust (Unsecured) iv - 1,974
Loans to BCM Apartment Trust (Secured) v 3,040 -
Loan to Cedar Woods Wellard Limited ii - 2,610
3,069 4,618
i. Classification as trade and other receivables
Trade receivables are amounts due from customers for goods sold or services performed in the ordinary course of business. Loans and other receivables are non-derivative financial assets with fixed or determinable payments and are not quoted in an active market. If collection of the amounts is expected in one year or less they are classified as current assets. If not, they are presented as non-current assets. Trade receivables are generally due for settlement within 30 days and therefore are all classified as current. The group’s impairment and other accounting policies for trade and other receivables are outlined in note E4(k).
ii. Current trade and other receivables
Current trade and other receivables include interest and non-interest bearing receivables (see B2. Financial risk management). Trade receivables are initially recorded at fair value and subsequently carried at amortised cost. There are no past due or impaired trade receivables at 30 June 2015 (2014 – $nil).
The fair values of non-current receivables of the group approximate the carrying values.
Other non-current receivables and loans under the discontinued employee share scheme are non-interest bearing. None of these are impaired, or past due but not impaired.
CEDAR WOODS PROPERTIES LIMITED
54

A2
– H
ow t
he N
umbe
rs a
re C
alcu
late
d
iii. Loan to Cedar Woods Wellard Limited
A mezzanine loan facility has been provided to the joint venture entity, Cedar Woods Wellard Limited. During the year ended 30 June 2015 the mezzanine loan facility was repaid in full to Cedar Woods Properties Limited and the facility term expired on 1 July 2015.
iv. Mezzanine loan to BCM Apartment Trust
During the year ended 30 June 2014, an unsecured mezzanine finance facility was provided by Cedar Woods Properties Limited to BCM Apartment Trust, with an interest rate of 22.5% per annum.
v. Secured loan to BCM Apartment Trust
In the year ended 30 June 2015, new finance facilities were provided by Cedar Woods Properties Limited to BCM Apartment Trust, secured over apartments in the Batavia Coast Marina Apartments development. The interest rate on these facilities is BBSY plus 4.5% per annum. These facilities enabled BCM Apartment Trust to pay out its external finance facility provided by Westpac Bank, pay out the mezzanine finance facility and have access to working capital.
c) Available-for-sale financial assets
Consolidated
2015$’000
2014$’000
Unlisted securities
Special unit in unit trust – at fair value 1,029 7,397
1,029 7,397
i. Unlisted securities
Refer to B2. Financial risk management for further information about the methods used and assumptions applied in determining fair value of unlisted securities. For the purposes of the Batavia Coast Marina Apartments project in Geraldton, WA, the consolidated entity acquired 100 ordinary units for $1 each and 1 special unit (class B) for $6,000,000 in the BCM Apartment Trust (BCM), on 30 March 2012. The ordinary units are disclosed as an interest in joint venture in note A3(c) and the 1 special unit (class B) is disclosed as an available-for-sale financial asset above. The special unit (class B) has been assessed for impairment and a write down of $6,368,000 (2014: $676,000) recorded.
ii. Non-current assets pledged as security
Refer to note A2(f) for information on non-current assets pledged as security by the parent entity or its controlled entities.
d) Trade and other payables
Consolidated
2015$’000
2014$’000
Trade payables 6,275 11,992
Accruals 6,226 11,731
GST payable 3,560 2,381
Other payables 2 202
16,063 26,306
Trade payables are unsecured and are usually paid within 30 days of recognition. The carrying amounts of trade and other payables are assumed to be the same as their fair values due to their short-term nature.
55
2015 ANNUAL REPORT

A2
– H
ow t
he N
umbe
rs a
re C
alcu
late
d
e) Derivative financial instruments
Consolidated
2015$’000
2014$’000
Current liabilities
Interest rate swap contracts - 644
Non-current liabilities
Interest rate swap contracts 68 -
68 644
i. Instruments used by the group
The group is party to derivative financial instruments in the normal course of business in order to manage exposure to fluctuations in interest rates in accordance with the group’s financial risk management policies.
Interest rate swap contracts
The bank loans currently bear an average variable interest rate of 3.72% per annum (2014 – 4.44% per annum). It is the group’s policy to protect part of the loans from exposure to fluctuations in interest rates. Accordingly the consolidated entity has entered into interest rate swap contracts under which part of the consolidated entity’s projected borrowings are protected for the period from 1 July 2015 to 28 June 2019.
The swaps effectively fix interest rates applicable to bank bills issued with a duration of 1 month (BBSY Bid) at certain levels between 2.49% - 2.50% per annum (2014 – 5.5% - 6.0% per annum). Swaps currently in place cover approximately 66% (2014 – 72%) of the variable loans outstanding at balance date, with terms expiring in 2019. The group is not applying hedge accounting to these derivatives. The gain or loss from re-measuring the derivative financial instruments at fair value is recognised in profit or loss.
f) Borrowings
Consolidated
2015$’000
2014$’000
Current
Bank loan – secured (Williams Landing Shopping Centre facility) 22,481 -
22,481 -
Non-Current
Bank loans – secured (Corporate facilities) 7,600 41,687
Facility fees capitalised (amortised over the period of facility) (702) (1,285)
Amortisation of facility fees 415 996
7,313 41,398
The fair value of non-current borrowings equals their carrying amount.
i. Security for borrowings
All of the consolidated entity’s assets are pledged as security for the group’s finance facilities.
Bank loans of $3,800,000 provided by ANZ Bank (2014 - $20,843,601) and $3,800,000 provided by Commonwealth Bank trading as Bankwest (2014 - $20,843,601) are secured by first registered mortgages over some of the consolidated entity’s land holdings, and first registered charges, guarantees and indemnities provided by Cedar Woods Properties Limited and applicable subsidiary entities. Cedar Woods Properties Limited has provided first registered charges over its assets and undertakings in relation to the corporate loan facility (see below).
The Williams Landing Shopping Centre facility disclosed in current borrowings is secured by a first registered mortgage over the Williams Landing Shopping Centre disclosed in investment properties at A3(e).
CEDAR WOODS PROPERTIES LIMITED
56
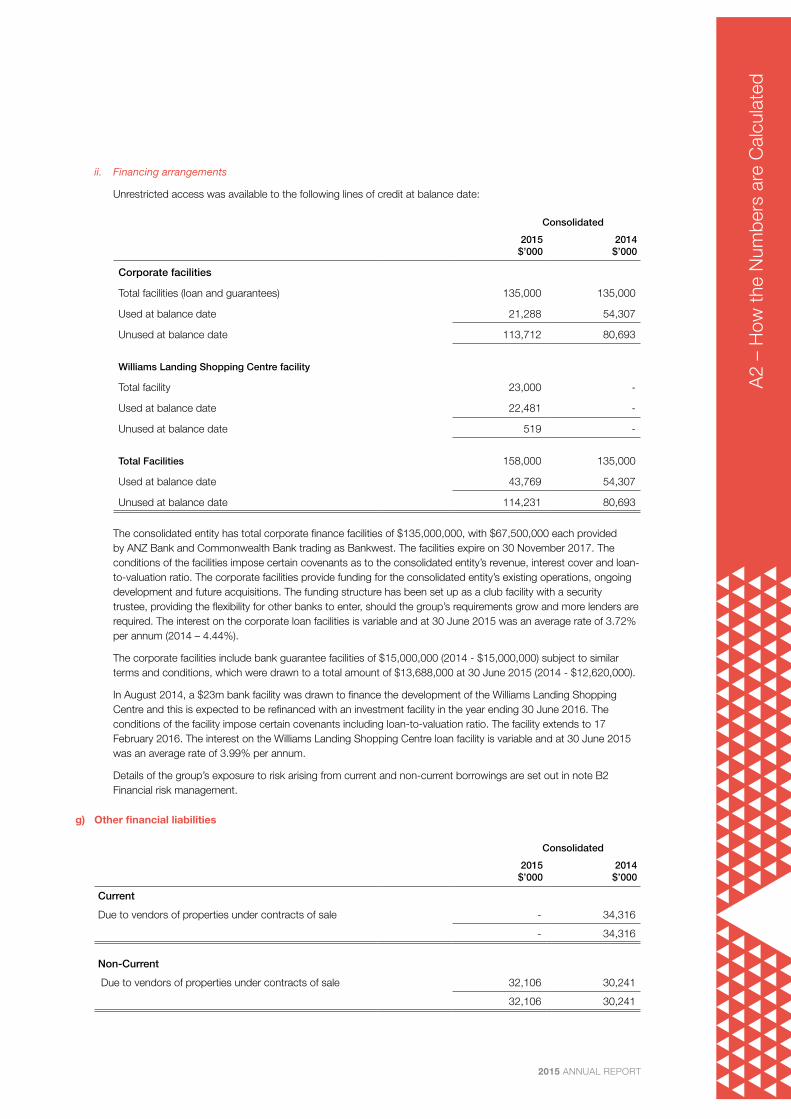
A2
– H
ow t
he N
umbe
rs a
re C
alcu
late
d
ii. Financing arrangements
Unrestricted access was available to the following lines of credit at balance date:
Consolidated
2015$’000
2014$’000
Corporate facilities
Total facilities (loan and guarantees) 135,000 135,000
Used at balance date 21,288 54,307
Unused at balance date 113,712 80,693
Williams Landing Shopping Centre facility
Total facility 23,000 -
Used at balance date 22,481 -
Unused at balance date 519 -
Total Facilities 158,000 135,000
Used at balance date 43,769 54,307
Unused at balance date 114,231 80,693
The consolidated entity has total corporate finance facilities of $135,000,000, with $67,500,000 each provided by ANZ Bank and Commonwealth Bank trading as Bankwest. The facilities expire on 30 November 2017. The conditions of the facilities impose certain covenants as to the consolidated entity’s revenue, interest cover and loan-to-valuation ratio. The corporate facilities provide funding for the consolidated entity’s existing operations, ongoing development and future acquisitions. The funding structure has been set up as a club facility with a security trustee, providing the flexibility for other banks to enter, should the group’s requirements grow and more lenders are required. The interest on the corporate loan facilities is variable and at 30 June 2015 was an average rate of 3.72% per annum (2014 – 4.44%).
The corporate facilities include bank guarantee facilities of $15,000,000 (2014 - $15,000,000) subject to similar terms and conditions, which were drawn to a total amount of $13,688,000 at 30 June 2015 (2014 - $12,620,000).
In August 2014, a $23m bank facility was drawn to finance the development of the Williams Landing Shopping Centre and this is expected to be refinanced with an investment facility in the year ending 30 June 2016. The conditions of the facility impose certain covenants including loan-to-valuation ratio. The facility extends to 17 February 2016. The interest on the Williams Landing Shopping Centre loan facility is variable and at 30 June 2015 was an average rate of 3.99% per annum.
Details of the group’s exposure to risk arising from current and non-current borrowings are set out in note B2 Financial risk management.
g) Other financial liabilities
Consolidated
2015$’000
2014$’000
Current
Due to vendors of properties under contracts of sale - 34,316
- 34,316
Non-Current
Due to vendors of properties under contracts of sale 32,106 30,241
32,106 30,241
57
2015 ANNUAL REPORT

A3
– H
ow t
he N
umbe
rs a
re C
alcu
late
d
A3. Non-Financial Assets and Liabilities
a) Inventories
Consolidated
Notes2015$’000
2014$’000
Total Inventory
Current inventory i & ii 59,181 80,895
Non-current inventory i & ii 251,109 249,698
Aggregate carrying amount 310,290 330,593
Consolidated
2015$’000
2014$’000
Current
Property held for resale
- land at cost 16,031 23,570
- at valuation 30 June 1992 178 327
- capitalised development costs 42,972 56,998
59,181 80,895
The 1992 valuations were independent valuations which were based on current market values at that time.
Consolidated
2015$’000
2014$’000
Non-Current
Property held for resale
- land at cost 203,787 200,370
- at valuation 30 June 1992 151 226
- capitalised development costs 42,054 44,069
- at net realisable value 5,117 5,033
251,109 249,698
The 1992 valuations were independent valuations which were based on current market values at that time.
i. Current assets pledged as security
Refer to note A2(f) for information on current assets pledged as security by the parent entity or its controlled entities.
ii. Accounting for inventory
Refer to note E4(g) for the recognition and classification of inventory.
CEDAR WOODS PROPERTIES LIMITED
58

A3
– H
ow t
he N
umbe
rs a
re C
alcu
late
d
b) Deferred development costs
Consolidated
2015$’000
2014$’000
Current
Deferred development costs 6,495 134
6,495 134
Non-Current
Deferred development costs 5,868 8,854
5,868 8,854
c) Investments accounted for using the equity method
Consolidated
2015$’000
2014$’000
Unlisted securities
Shares in joint ventures 3,975 2,902
i. Cedar Woods Wellard Limited
The consolidated entity owns a 32.5% (2014: 32.5%) interest in Cedar Woods Wellard Limited, a property development company incorporated in Australia. See note C1(b).
ii. BCM Apartment Trust
The consolidated entity owns 100 ordinary units for $1 each (a 50% interest in the ordinary units) in the BCM Apartment Trust. The consolidated entity’s interests in the ordinary units do not entitle it to a share of the revenue, profit/loss and net assets of BCM. Refer to note A2(c) for details.
The consolidated entity also owns 10 ordinary shares for $1 each (a 50% interest) in Champion Bay Nominees Pty Ltd, the trustee of BCM.
d) Property, plant and equipment
Consolidated
2015$’000
2014$’000
Plant and Equipment at Cost
At start of the year 3,486 2,850
Additions 1,130 699
Assets disposed (30) (63)
At end of the year 4,586 3,486
Accumulated depreciation on Plant and Equipment
At start of the year 1,818 1,551
Charge for year 301 282
Assets disposed (12) (15)
At end of the year 2,107 1,818
Net book value 2,479 1,668
Non-current assets pledged as security
Refer to note A2(f) for information on non-current assets pledged as security by the parent entity or its controlled entities.
59
2015 ANNUAL REPORT

A3
– H
ow t
he N
umbe
rs a
re C
alcu
late
d
e) Investment properties
Consolidated
Notes2015$’000
2014$’000
Non-current assets – at cost
Opening balance at the start of the year 34,929 11,301
Capitalised expenditure 15,143 9,781
Transfer from inventory 4,956 14,161
Depreciation (1,015) (314)
Investment properties disposed A1(a) (16,031) -
Closing balance at the end of the year 37,982 34,929
Represented by:
Property under construction i - 18,405
Completed investment property 37,982 16,524
Closing balance at the end of the year 37,982 34,929
i. Investments properties under construction
For investment properties that were under construction at 30 June 2014; depreciation had not yet commenced.
ii. Amounts recognised in profit or loss for investment properties
Consolidated
2015$’000
2014$’000
Rental income 3,700 769
Direct operating expenses from property that generated rental income (740) (17)
Net gain on disposal of investment property 19,969 -
iii. Fair value of investment property
The fair value of the Williams Landing Shopping Centre which makes up completed investment property at 30 June 2015 is $52.3m exclusive of GST, based on an independent valuation. This includes land surrounding the shopping centre for future development which is on the same title.
iv. Leasing arrangements
Investment properties are leased to tenants under long term operating leases. Minimum lease payments under non-cancellable leases are receivable as follows:
Consolidated
2015$’000
2014$’000
Within one year 2,867 2,171
Later than one year but not later than 5 years 11,835 9,356
Later than 5 years 32,972 44,501
47,674 56,028
CEDAR WOODS PROPERTIES LIMITED
60

A3
– H
ow t
he N
umbe
rs a
re C
alcu
late
d
v. Leasing incentives
Consolidated
2015$’000
2014$’000
Lease incentives 830 -
Amortisation of lease incentives (48) -
782 -
vi. Non-current assets pledged as security
Refer to note A2(f) for information on non-current assets pledged as security by the parent entity or its controlled entities.
f) Deferred tax
i. Assets
Consolidated
Notes2015$’000
2014$’000
The balance comprises temporary differences attributable to:
Inventory 2,501 507
Provision for customer rebates 2,117 1,774
Available for sale financial assets at fair value 1,549 -
Provision for employee benefits 834 772
7,001 3,053
Other
Share issue expenses 210 314
Borrowing Costs 35 640
Derivative financial instruments 20 193
Other 33 30
Sub-total other 298 1,177
Total deferred tax assets 7,299 4,230
Set-off of deferred tax assets pursuant to set-off provisions (7,299) (4,230)
Net deferred tax assets - -
Deferred tax assets at the start of the year 4,230 3,840
Increase in deferred tax assets credited to income tax expense A1(c) 3,065 143
Increase in deferred tax assets credited to equity A4(a) 4 247
Deferred tax assets at the end of the year 7,299 4,230
Deferred tax assets expected to be recovered within 12 months 3,801 2,984
Deferred tax assets expected to be recovered after more than 12 months 3,498 1,246
7,299 4,230
61
2015 ANNUAL REPORT

A3
– H
ow t
he N
umbe
rs a
re C
alcu
late
d
MovementsInventory
$’000
Provision for customer
rebates $’000
Available for sale
financial assets at fair value
$’000
Provision for employee
benefits $’000
Other $’000
Total $’000
At 1 July 2013 - 1,755 - 644 1,441 3,840
(Charged) / credited
- to profit or loss 507 19 - 128 (511) 143
- directly to equity - - - - 247 247
At 30 June 2014 507 1,774 - 772 1,177 4,230
(Charged) / credited
- to profit or loss 1,994 343 1,549 62 (883) 3,065
- directly to equity - - - - 4 4
At 30 June 2015 2,501 2,117 1,549 834 298 7,299
ii. Liabilities
Consolidated
Notes2015$’000
2014$’000
The balance comprises temporary differences attributable to:
Amounts recognised in profit or loss
Inventory 5,087 3,075
Deferred development costs 3,706 2,694
Prepayments 411 115
9,204 5,884
Other
Lease incentives 235 -
Revaluation reserve 81 137
Available for sale financial assets at fair value - 361
Other 15 33
Sub-total other 331 531
Total deferred tax liabilities 9,535 6,415
Set off of deferred tax assets pursuant to set-off provisions (7,299) (4,230)
Net deferred tax liabilities 2,236 2,185
Deferred tax liabilities at the start of the year 6,415 7,276
Increase (decrease) in deferred tax liabilities debited (credited) to income tax expense A1(c) 3,120 (861)
Deferred tax liabilities at the end of the year 9,535 6,415
Deferred tax liabilities expected to be settled within 12 months 3,908 1,509
Deferred tax liabilities expected to be settled after more than 12 months 5,627 4,906
9,535 6,415
CEDAR WOODS PROPERTIES LIMITED
62

A3
– H
ow t
he N
umbe
rs a
re C
alcu
late
d
MovementsInventory
$’000
Deferred development
costs $’000
Prepayments $’000
Other $’000
Total $’000
At 1 July 2013 2,933 3,209 328 806 7,276
Charged / (credited)
- to profit or loss 142 (515) (213) (275) (861)
At 30 June 2014 3,075 2,694 115 531 6,415
Charged / (credited)
- to profit or loss 2,012 1,012 296 (200) 3,120
At 30 June 2015 5,087 3,706 411 331 9,535
g) Provisions
Consolidated
Notes2015$’000
2014$’000
Current
Employee benefits 1,305 893
Dividends 3 3
Customer rebates i 7,057 5,914
8,365 6,810
Consolidated
2015$’000
2014$’000
Non-current
Employee benefits 414 449
414 449
i. Movements in customer rebate provisions
Consolidated
2015$’000
2014$’000
Carrying amount at start of year 5,914 5,851
Charged to profit or loss 3,671 2,450
Payments (2,528) (2,387)
Carrying amount at end of year 7,057 5,914
Customers are generally entitled to customer rebates within 12 months of balance date, however in some instances claims and payments may not be made within 12 months of balance date.
63
2015 ANNUAL REPORT
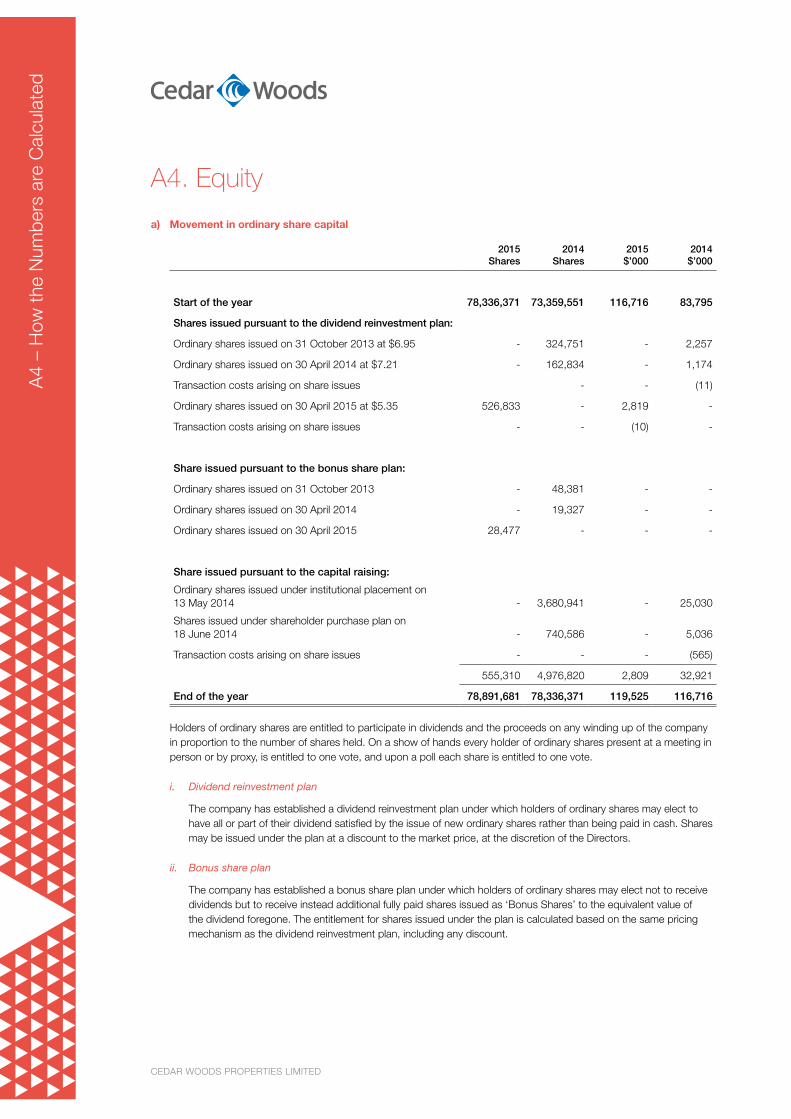
A4
– H
ow t
he N
umbe
rs a
re C
alcu
late
d
A4. Equity
a) Movement in ordinary share capital
2015Shares
2014Shares
2015$’000
2014$’000
Start of the year 78,336,371 73,359,551 116,716 83,795
Shares issued pursuant to the dividend reinvestment plan:
Ordinary shares issued on 31 October 2013 at $6.95 - 324,751 - 2,257
Ordinary shares issued on 30 April 2014 at $7.21 - 162,834 - 1,174
Transaction costs arising on share issues - - (11)
Ordinary shares issued on 30 April 2015 at $5.35 526,833 - 2,819 -
Transaction costs arising on share issues - - (10) -
Share issued pursuant to the bonus share plan:
Ordinary shares issued on 31 October 2013 - 48,381 - -
Ordinary shares issued on 30 April 2014 - 19,327 - -
Ordinary shares issued on 30 April 2015 28,477 - - -
Share issued pursuant to the capital raising:
Ordinary shares issued under institutional placement on 13 May 2014 - 3,680,941 - 25,030
Shares issued under shareholder purchase plan on 18 June 2014 - 740,586 - 5,036
Transaction costs arising on share issues - - - (565)
555,310 4,976,820 2,809 32,921
End of the year 78,891,681 78,336,371 119,525 116,716
Holders of ordinary shares are entitled to participate in dividends and the proceeds on any winding up of the company in proportion to the number of shares held. On a show of hands every holder of ordinary shares present at a meeting in person or by proxy, is entitled to one vote, and upon a poll each share is entitled to one vote.
i. Dividend reinvestment plan
The company has established a dividend reinvestment plan under which holders of ordinary shares may elect to have all or part of their dividend satisfied by the issue of new ordinary shares rather than being paid in cash. Shares may be issued under the plan at a discount to the market price, at the discretion of the Directors.
ii. Bonus share plan
The company has established a bonus share plan under which holders of ordinary shares may elect not to receive dividends but to receive instead additional fully paid shares issued as ‘Bonus Shares’ to the equivalent value of the dividend foregone. The entitlement for shares issued under the plan is calculated based on the same pricing mechanism as the dividend reinvestment plan, including any discount.
CEDAR WOODS PROPERTIES LIMITED
64

A4
– H
ow t
he N
umbe
rs a
re C
alcu
late
d
65
2015 ANNUAL REPORT
b) Reserves
The following table shows the composition and movement in reserves during the year. A description of the nature and purpose of reserves is provided below the table.
Consolidated
Notes2015$’000
2014$’000
Composition
a) Asset revaluation reserve (pre 1992) 186 309
186 309
Movements
a) Asset revaluation reserve
Balance at the beginning of the year 309 496
Transfer to retained profits A4(c) (123) (187)
Balance at the end of the year 186 309
The asset revaluation reserve was used until 1992 to record increments and decrements on the revaluation of non-current assets. Refer to note E4(g).
c) Retained profits
Consolidated
Notes2015$’000
2014$’000
Retained profits at the start of the year 144,576 123,453
Net profit attributable to members of Cedar Woods Properties Limited 42,585 40,313
Transfers from reserves A4(b) 123 187
Dividends provided for or paid B3(b) (21,390) (19,377)
Retained profits at the end of the year 165,894 144,576

A5
– H
ow t
he N
umbe
rs a
re C
alcu
late
d
CEDAR WOODS PROPERTIES LIMITED
66
A5. Cash Flow Information
a) Reconciliation of profit after income tax to net cash inflows (outflows) from operating activities
Consolidated
2015$’000
2014$’000
Profit after income tax 42,585 40,313
Depreciation 1,316 596
Amortisation of lease incentives 48 -
Loss on sale of non-current assets 18 43
Gain on sale of investment properties (19,969) -
Reversal of provision for impairment of loan to Cedar Woods Wellard Limited - (1,035)
Fair value gain on derivative financial instrument (577) (920)
Accrued interest on receivables (870) (1,060)
Share of profit in equity accounted investment (1,073) (973)
Changes in operating assets and liabilities
Increase in provisions for employee benefits 377 255
Increase in provisions 1,143 64
Decrease (increase) in inventories 20,303 (79,720)
Transfer from inventories to investment properties (4,956) (14,162)
(Increase) decrease in other deferred development costs (3,375) 5,461
Decrease in available-for-sale financial assets 6,368 676
(Increase) in deferred tax assets (3,069) (143)
Increase (decrease) in current income tax payable 2,681 (2,008)
Increase (decrease) in deferred tax liability 3,120 (861)
(Increase) decrease in capitalised borrowing costs (2) 19
Decrease (increase) in debtors 7,434 (6,648)
(Decrease) increase in creditors (10,503) 5,355
(Decrease) increase in other financial liabilities (32,451) 52,954
Net cash inflows (outflows) from operating activities 8,548 (1,794)

B –
Fin
anci
al R
isks
67
2015 ANNUAL REPORT
Section B: Financial Risks
This section of the notes discusses the group’s exposure to various risks and shows how these could affect the group’s financial position and performance.
B1. Significant estimates and judgements .......................................................................................................... 68
a) Significant estimates and judgements ................................................................................................................. 68
B2. Financial risk management ............................................................................................................................. 69
a) Market risk ...........................................................................................................................................................69
b) Credit risk ........................................................................................................................................................... 71
c) Liquidity risk ........................................................................................................................................................ 71
d) Fair value measurement ...................................................................................................................................... 72
B3. Capital management objectives and gearing ............................................................................................... 74
a) Capital management objectives and gearing ....................................................................................................... 74
b) Dividends ............................................................................................................................................................ 75

B1
– Fi
nanc
ial R
isks
CEDAR WOODS PROPERTIES LIMITED
68
B1. Significant Estimates and JudgementsThe preparation of financial statements requires the use of accounting estimates which, by definition, will seldom equal the actual results. Management also needs to exercise judgement in applying the group’s accounting policies.
This note provides an overview of the areas that involved a higher degree of judgement or complexity and of items which are more likely to be materially adjusted due to estimates and judgements turning out to be wrong. Detailed information about each of these estimates and judgements is presented below.
a) Significant estimates and judgements
Estimates and judgements are continually evaluated and are based on historical experience and other factors, including expectations of future events that may have a financial impact on the entity. The judgements that have a significant risk of causing a material adjustment to the carrying amounts or presentation of assets and liabilities within the next financial year are discussed below.
i. Inventory - classification
Judgement is exercised with respect to estimating the classification of inventory between current and non-current assets. Inventory is classified as current only when sales are expected to result in realisation of cash within the next twelve months, based on management’s sales forecasts.
ii. Inventory - valuation
The recoverable amount of inventory is estimated based on an assessment of net realisable value including future development costs. This requires judgement as to the future cash flows likely to be generated from the properties included in inventory, including in some cases, judgement regarding the likelihood and timing of obtaining development approvals. If the approvals are not received when anticipated the recoverable amount of inventory may be substantially impaired. Refer also to note E4(g).
iii. Estimated fair value of available for sale financial assets
The fair value of financial instruments that are not traded in an active market is determined using valuation techniques. The group uses its judgement to consider a variety of scenarios and make assumptions that are mainly based on market conditions existing at the end of each reporting period. These include sales rates, sales prices and future contracts.
There were no critical judgements other than those involving estimates referred to above, that management made in applying the group’s accounting policies.

B2
– Fi
nanc
ial R
isks
69
2015 ANNUAL REPORT
B2. Financial Risk ManagementThis note explains the group’s exposure to financial risks and how these risks could affect the group’s future financial performance. Current year profit and loss information has been included where relevant to add further context.
The group’s activities expose it to a variety of financial risks:
Risk Exposure arising from Measurement Management
Market risk – interest rate risk
Long term borrowings at variable rates
Cash flow forecasting
Sensitivity analysisInterest rate swaps
Credit risk
Cash and cash equivalents, trade and other receivables, available-for-sale financial
assets and derivative financial instruments
Ageing analysis
Credit ratings
Management of deposits
Ongoing checks by management
Contractual arrangements
Liquidity riskBorrowings
and other liabilitiesForecast and
actual cash flowsFlexibility in
funding arrangements
Financial risk management is considered part of the overall risk management program overseen by the Audit and Risk Management committee. Further detail on the types of risks to which the group is exposed and the way the group manages these risks is set out below.
The group holds the following financial instruments:
2015$’000
2014$’000
Financial assets
Cash and cash equivalents 1,886 8,796
Trade and other receivables 12,544 14,675
Available-for-sale financial assets 1,029 7,397
15,459 30,868
Financial liabilities
Trade and other payables 16,063 26,306
Other financial liabilities 32,106 64,557
Borrowings 29,794 41,398
Derivative financial instruments 68 644
78,031 132,905
a) Market risk
i. Price risk
The consolidated entity has no foreign exchange exposure and minimal exposure to price risk on equity securities.
The fair value of the available-for-sale financial assets is determined using valuation techniques, considering a variety of scenarios and making assumptions that are based on market conditions, including sales prices and sales rates. An increase or decrease in sales prices of 10% has a +/- $1,000,000 impact on net profit after tax.
ii. Cash flow and fair value interest rate risk
As the consolidated entity does not have a significant portfolio of interest-bearing assets, the income and operating cash inflows are not materially exposed to changes in market interest rates.
The group issued a loan to Cedar Woods Wellard Limited that bears an interest rate of 16% (2014 – 16%). At 30 June 2015 this loan has been fully repaid and the facility expired on 1 July 2015. The group has issued loans to the

B2
– Fi
nanc
ial R
isks
CEDAR WOODS PROPERTIES LIMITED
70
BCM Apartment Trust that bears an interest rate of BBSY plus 4.5%. Loans issued at fixed rates or at a fixed range of rates expose the group to fair value interest rate risk.
Interest rate risk arises from exposures to long term borrowings, where those borrowings are issued at variable interest rates. Borrowings issued at variable interest rates expose the group to cash flow interest rate risk. The consolidated entity reviews the potential impact of variable interest rate changes and considers various interest rate management products in the context of prevailing monetary policy of the Reserve Bank and economic conditions. Accordingly the consolidated entity has entered into interest rate swap contracts under which a significant part of the consolidated entity’s projected borrowings are protected for the period from 1 July 2015 to 28 June 2019.
There is an indirect exposure to interest rate changes caused by the impact of these changes upon the property market. The group addresses this risk by virtue of managing its pricing, product offer and planned development programs.
iii. Instruments used by the group
Interest rate swap contracts effectively fix interest rates applicable to bank bills issued with a duration of 1 month (BBSY Bid) at certain levels between 2.49% - 2.495% (2014 – 5.5% - 6.0%) per annum. Swaps currently in place cover 66% (2014 - 72%) of the variable loan outstanding at balance date, with terms expiring in 2019.
The consolidated entity’s policy is to limit a significant proportion of its borrowings to a maximum fixed rate using interest rate swaps or caps to achieve this when necessary. The swaps described above covered 66% of the bank loan at balance sheet date because the balance of the loan was $30,081,000 (2014 - $41,687,000), being at the lower end of the company’s available facilities.
The consolidated entity’s exposure to interest rate risk and the effective weighted average interest rate for receivables and borrowings is set out below.
2015 2014
Interest bearing
- variable $’000
Non- interest bearing
$’000Total
$’000
Interest bearing
- variable $’000
Non- interest bearing
$’000Total
$’000
Receivables
Other receivables - 2,852 2,852 - 10,057 10,057
Employee share loans - 29 29 - 34 34
Loan to BCM Apartment Trust 9,663 - 9,663 1,974 - 1,974
Loan to joint venture - - - 2,610 - 2,610
9,663 2,881 12,544 4,584 10,091 14,675
The weighted average interest rate at year end is 6.59% (2014: 18.8%)
2015 2014
Interest bearing
- fixed$’000
Interest bearing
- variable$’000
Total$’000
Interest bearing
- fixed$’000
Interest bearing
- variable$’000
Total$’000
Interest bearing liabilities
Bank loans - 30,081 30,081 - 41,687 41,687
Other financial liabilities 32,106 - 32,106 64,557 - 64,557
32,106 30,081 62,187 64,557 41,687 106,244
The weighted average interest rate at year end is 3.72% (2014: 4.44%)
An analysis by maturity is provided in B2(c) below.
iv. Summarised interest rate sensitivity analysis
The potential impact of a change in bank interest rates of + / -1% is not significant to the group’s net profit and equity.
The potential impact on financials assets is not significant. Refer to comments above for further information on the impact of changes in interest rates upon the group.

B2
– Fi
nanc
ial R
isks
71
2015 ANNUAL REPORT
b) Credit risk
The consolidated entity has minimal exposure to credit risk from customers as title to lots or units in the consolidated entity’s developments does not generally pass to customers until funds are received.
Policies and procedures are in place to manage credit risk including management of deposits and review of the financial capacity of customers. Ongoing checks are performed by management to ensure that settlement terms detailed in individual contracts are adhered to. For land under option the consolidated entity secures its rights by way of encumbrances on the underlying land titles. The maximum exposure to credit risk at the reporting date is the carrying amount of the financial assets as summarised above.
Derivative counterparties and cash deposits are placed with high credit quality financial institutions, such as major trading banks.
Credit risk may arise in relation to bank guarantees given to certain parties. These guarantees are supported by contractual arrangements that bind the counterparty, providing security against inappropriate presentation of the bank guarantees.
For the purposes of the Batavia Coast Marina Apartments project in Geraldton, WA the consolidated entity acquired 100 ordinary units for $1 each and 1 special unit (class B) for $6,000,000 in BCM Apartment Trust (BCM) on 30 March 2012. The ordinary units are disclosed as an interest in joint venture in note A3(c) and the 1 special unit (class B) is disclosed as an available-for-sale financial asset in note A2(c). Under the BCM trust deed the 1 special unit (class B) entitles the consolidated entity to a fixed return upon the repurchase of the 1 special unit (class B) at cost. The fixed return is preferential to any return being received by the other ordinary unit holder and the consolidated entity is represented on the board of the trustee company. The maximum exposure to credit risk at the reporting date is the carrying amount of the available-for-sale financial asset.
In relation to the loans to BCM Apartment Trust, loans are secured by way of registered first mortgages over property held by the BCM Apartment Trust. The majority of the loans take priority over payment of any return to the special units (class A, class B and class C).
c) Liquidity risk
Prudent liquidity risk management implies maintaining sufficient cash and available credit facilities to manage the consolidated entity’s financial commitments. The group manages liquidity risk by continuously monitoring forecast and actual cash flows and matching the maturity profiles of financial assets and liabilities. Due to the dynamic nature of the underlying businesses, the group aims at maintaining flexibility in funding by keeping committed credit lines available.
At 30 June 2015 the group had undrawn committed facilities of $113,712,000 (2014 - $80,690,000) and cash of $1,886,000 (2014 - $8,796,000) to cover short term funding requirements. Refer to A2(f) ii for details.
i. Maturities of financial liabilities
The tables below analyse the group’s financial liabilities into relevant maturity groupings based on the remaining period at the reporting date to the contractual maturity date. The amounts disclosed in the table for non-interest bearing liabilities are the contractual undiscounted cash flows. For variable interest rate liabilities the cash flows have been estimated using interest rates applicable at the reporting date.
Group – at 30 June 2015
Less than 1 year$’000
Between 1 and 2 years
$’000
Between 2 and 5 years
$’000
Total contractual cash flows
$’000
Carrying amount
$’000
Non-derivatives
Non-interest bearing 16,063 - - 16,063 16,063
Fixed rate - - 39,000 39,000 32,106
Variable rate 23,145 - 8,453 31,598 29,794
Derivatives - - 68 68 68
Total 39,208 - 47,521 86,729 78,031

B2
– Fi
nanc
ial R
isks
CEDAR WOODS PROPERTIES LIMITED
72
Group – at 30 June 2014
Less than 1 year$’000
Between 1 and 2 years
$’000
Between 2 and 5 years
$’000
Total contractual cash flows
$’000
Carrying amount
$’000
Non-derivatives
Non-interest bearing 26,306 - - 26,306 26,306
Fixed rate 35,042 - 39,000 74,042 64,557
Variable rate - - 47,213 47,213 41,398
Derivatives 644 - - 644 644
Total 61,992 - 86,213 148,205 132,905
d) Fair value measurement
This note provides information on the judgements and estimates made by the group in determining the fair values of the financial instruments.
i. Fair value hierarchy
To provide an indication about the reliability of the inputs used in determining fair value, the group classifies its financial instruments into three levels prescribed under the accounting standards. An explanation of each level follows underneath the table.
The following table presents the group’s financial assets and financial liabilities measured and recognised at fair value at 30 June 2015 and 30 June 2014:
As at 30 June 2015 NotesLevel 1
$’000Level 2
$’000Level 3
$’000Total
$’000
Assets
Available-for-sale financial assets A2(c) - - 1,029 1,029
Total assets - - 1,029 1,029
Liabilities
Derivatives used for hedging A2(e) - 68 - 68
Total liabilities - 68 - 68
As at 30 June 2014 NotesLevel 1
$’000Level 2
$’000Level 3
$’000Total
$’000
Assets
Available-for-sale financial assets A2(c) - - 7,397 7,397
Total assets - - 7,397 7,397
Liabilities
Derivatives used for hedging A2(e) - 644 - 644
Total liabilities - 644 - 644
ii. Valuation techniques used to determine fair values
Level 1 – The fair value of financial instruments traded in active markets (such as publicly traded derivatives) is based on quoted (unadjusted) market prices at the end of the reporting period. The quoted market price used for the financial assets held by the group is the current bid price. These instruments are included in level 1.
Level 2 – The fair value of financial instruments that are not traded in an active market (such as derivatives provided by trading banks) is determined using market valuations provided by those banks at reporting date. These instruments are included in level 2.
Level 3 – If one or more of the significant inputs is not based on observable market data, the instruments is included in level 3. This is the case for unlisted equity securities (classified as available-for-sale financial assets in the balance sheet). The unlisted equity securities provide a fixed return and the fair value of the securities is determined based on management’s estimate of the period over which the return will be received and the performance of the issuer entity.

B2
– Fi
nanc
ial R
isks
73
2015 ANNUAL REPORT
iii. Fair value measurements using significant unobservable inputs (level 3)
The following table presents the changes in level 3 instruments for the year ended 30 June 2015:
Available For sale
$’000Total
$’000
Opening balance 30 June 2014 7,397 7,397
Write down of assets in the profit or loss - unrealised (6,368) (6,368)
Closing balance 30 June 2015 1,029 1,029
The reduction in fair value of the equity securities in the table above reflects the reduced return expected to be received and the extended period over which the return is now expected to be received. Refer to note A2(c) for details.

B3
– Fi
nanc
ial R
isks
CEDAR WOODS PROPERTIES LIMITED
74
B3. Capital Management Objectives and Gearing
a) Capital management objectives and gearing
The consolidated entity’s objectives when managing capital are to safeguard its ability to continue as a going concern, so that it can continue to provide returns for shareholders and benefits for other stakeholders and to maintain an optimal capital structure to reduce the cost of capital.
In order to maintain or adjust the capital structure, the group will consider a range of alternatives which may include:
• raising or reducing borrowings
• adjusting the dividend policy
• issue of new securities
• return of capital to shareholders
• sale of assets.
Gearing is a measure used to monitor the levels of debt used in the business to fund operations. The gearing ratio is calculated as interest bearing bank debt net of cash and cash equivalents divided by shareholders’ equity. Gearing is managed by reference to a guideline which sets the desirable upper and lower limits for the gearing ratio. The group’s gearing is then addressed by utilising capital management initiatives as discussed above.
The gearing ratios were as follows:
Note2015 $’000
2014 $’000
Total interest bearing bank debt A2(f) 30,081 41,687
Less: cash and cash equivalents A2(a) (1,886) (8,796)
Net debt 28,195 32,891
Shareholders’ equity 285,605 261,601
Gearing ratio 9.9% 12.6%
The group’s guideline is to target gearing generally within the range of 20-75% although periods where the gearing is outside of this range are acceptable, depending upon the timetable for acquisition payments and the construction and settlement of developments.
i. Loan Covenants
Under the terms of the major borrowing facilities, the group has complied with covenants throughout the reporting period. Key covenants include requirements in relation to a maximum loan to valuation ratio and a minimum interest cover ratio.

B3
– Fi
nanc
ial R
isks
75
2015 ANNUAL REPORT
b) Dividends
i. Ordinary shares
Consolidated
2015 $’000
2014 $’000
Fully franked based on tax paid at 30%
Final dividend for the year ended 30 June 2014 of 15.5 cents (2013 – 15.0 cents) per fully paid share
- Paid in cash 12,138 8,407
- Satisfied by shares under the dividend reinvestment plan - 2,258
- Applied to the employee share loans 3 3
Interim dividend for the year ended 30 June 2015 of 12.0 cents (2014 – 12.0 cents) per fully paid share
- Paid in cash 6,427 7,532
- Satisfied by shares under the dividend reinvestment plan 2,819 1,174
- Applied to the employee share loans 3 3
Total 21,390 19,377
ii. Dividends not recognised at the year end
In addition to the above dividends, since year end the directors have recommended the payment of a final dividend of 16.0 cents per fully paid ordinary share (2014 – 15.5 cents), fully franked based on the tax paid at 30%. The aggregate amount of the proposed dividend expected to be paid on 30 October 2015 out of retained profits at 30 June 2015, but not recognised as a liability at year end is below:
Consolidated
2015 $’000
2014 $’000
Dividends not recognised at year end 12,623 12,142
iii. Franked Dividends
The franked portions of the final dividend proposed at 30 June 2015 will be franked from existing franking credits or from franking credits arising from the payment of income tax in the next financial year.
Consolidated
2015 $’000
2014 $’000
Franking credits available for the subsequent financial yearon a tax-paid basis of 30% (2014 – 30%) 64,443 57,458
The above amounts represent the franking accounts at the end of the financial year, adjusted for:
(a) Franking credits that will arise from the payment of the current tax liability;
(b) Franking debits that will arise from the payment of dividends recognised as a liability at the reporting date;
(c) Franking credits that will arise from the receipt of dividends recognised as receivables at the reporting date.
The impact on the franking account of the dividend recommended by the directors since year end, but not recognised as a liability at year end, will be a reduction in the franking account of $5,410,000 (2014 - $5,204,000).

C –
Gro
up S
truc
ture
CEDAR WOODS PROPERTIES LIMITED
76
Section C: Group Structure
This section provides information which will help users understand how the group structure affects the financial position and performance of the group as a whole.
C1. Interests in Other Entities ............................................................................................................................... 77
a) Subsidiaries ........................................................................................................................................................ 77
b) Interests in joint ventures ..................................................................................................................................... 78
c) Commitments and contingent liabilities in respect of the joint ventures ................................................................ 78
d) Summarised financial information for joint ventures ............................................................................................. 79

C1
– G
roup
Str
uctu
re
77
2015 ANNUAL REPORT
C1. Interests in Other Entities
a) Subsidiaries
The group’s subsidiaries at 30 June 2015 are set out below. Unless otherwise stated, they have share capital consisting solely of ordinary shares that are held directly by the group and the proportion of ownership interest held equals the voting rights held by the group. The subsidiaries are incorporated or established in Australia.
The consolidated financial statements incorporate the assets, liabilities and results in accordance with the accounting policy described in note E4(b).
Company Equity Holding
2015 2014
Cedar Woods Properties Harrisdale Pty Ltd 100% 100%
Cedar Woods Properties Investments Pty Ltd 100% 100%
Cedar Woods Properties Management Pty Ltd 100% 100%
Cedar Woods Property Sales Pty Ltd 100% 100%
Cranford Pty Ltd 100% 100%
Daleford Property Pty Ltd 100% 100%
Dunland Property Pty Ltd 100% 100%
Esplanade (Mandurah) Pty Ltd 100% 100%
Eucalypt Property Pty Ltd 100% 100%
Flametree Property Pty Ltd 100% 100%
Galaway Holdings Pty Ltd 100% 100%
Gaythorne Pty Ltd 100% 100%
Geographe Property Pty Ltd 100% 100%
Huntsman Property Pty Ltd 100% 100%
Jarrah Property Pty Ltd 100% 100%
Kayea Property Pty Ltd 100% 100%
Lonnegal Property Pty Ltd 100% 100%
Osprey Property Pty Ltd 100% 100%
Silhouette Property Pty Ltd 100% 100%
Terra Property Pty Ltd 100% 100%
Upside Property Pty Ltd 100% 100%
Vintage Property Pty Ltd 100% 100%
Williams Landing Home Improvement Pty Ltd 100% 100%
Williams Landing Home Improvement Trust 100% 100%
Williams Landing Shopping Centre Pty Ltd 100% 100%
Williams Landing Shopping Centre Trust 100% 100%
Williams Landing Town Centre Pty Ltd 100% 100%
Woodbrooke Property Pty Ltd 100% 100%
Yonder Property Pty Ltd 100% 100%
Zamia Property Pty Ltd 100% 100%

C1
– G
roup
Str
uctu
re
CEDAR WOODS PROPERTIES LIMITED
78
b) Interests in joint arrangements
Set out below are the joint ventures of the group as at 30 June 2015. The principal place of business and country of incorporation (or origin) is Australia for all entities.
Name of entity% of ownership
interestNature of
relationshipMeasurement
method Carrying amount
2015%
2014%
2015$’000
2014$’000
Carine Joint Venture 50 50 Joint OperationShare of assets, liabilities, income
and expenses(38) 1,554
Cedar Woods Wellard Limited 32.5 32.5 Joint Venture Equity method 3,975 2,902
BCM Apartment Trust 50 50 Joint Venture Equity method - -
The carrying amount represents the amount attributable to the group.
Carine Joint Venture (CJV) is a joint venture with an aged care and retirement living provider, to develop a mixed use precinct including an aged care facility, retirement living and residential housing development on State land in Carine, Western Australia. The consolidated entity has a 50% participating interest in the CJV and is entitled to 50% of its revenue and assets. The consolidated entity’s interest in the assets employed in the CJV are included in the balance sheet in accordance with the accounting policy described in note E4(b).
Cedar Woods Wellard Limited is developing the Emerald Park residential estate at Wellard, WA.
BCM Apartment Trust, owns the Batavia Coast Marina Apartments project in Geraldton. The consolidated entity owns 100 ordinary units for $1 each (a 50% interest in the ordinary units) in the BCM Apartment Trust, which owns the Batavia Coast Marina Apartments project in Geraldton. The consolidated entity’s interest in the ordinary units does not entitle it to a share of the revenue, profit/loss or net assets of BCM. Refer to note A2(c) for details.
The consolidated entity also owns 10 ordinary shares for $1 each (a 50% interest) in Champion Bay Nominees Pty Ltd, the trustee of BCM.
c) Commitments and contingent liabilities in respect of the joint ventures
Carine Joint Venture has no commitments for expenditure or contingent liabilities at 30 June 2015 (2014: nil).
Cedar Woods Wellard Limited has no commitment for expenditure at 30 June 2015 (2014: nil) and provided $27,667 (2014: $102,766) bank guarantees to various local authorities supporting development and maintenance commitments.
BCM Apartment Trust has no commitments for expenditure or contingent liabilities at 30 June 2015 (2014: nil).

C1
– G
roup
Str
uctu
re
79
2015 ANNUAL REPORT
d) Summarised financial information for joint ventures
The following table provides summarised financial information for those joint ventures that are material to the group. The information disclosed reflects the amounts presented in the financial statements of the relevant joint ventures and not Cedar Woods Properties Limited’s share of those amounts.
Cedar Woods Wellard Limited2015$’000
2014$’000
Current assets
Cash 2,183 3,316
Other current assets 8,617 6,093
Total current assets 10,800 9,409
Total non-current assets 5,502 10,351
Total assets 16,302 19,760
Total current liabilities 2,086 1,871
Non-current liabilities - 6,975
Total liabilities 2,086 8,846
Net assets 14,216 10,914
Group’s share in % 32.5% 32.5%
Group’s share in $ 4,620 3,547
i. Movements in carrying amounts – Cedar Woods Wellard Limited
2015$’000
2014$’000
At start of the year 2,902 1,929
Share of profit after income tax 1,073 973
At end of the year 3,975 2,902
Share of profit before income tax 1,533 369
Income tax benefit / (expense) (460) 604
Share of profit after income tax 1,073 973
Share of joint venture’s revenue, assets, liabilities and contingent liabilities
Revenue 4,748 6,099
Assets 5,298 6,422
Liabilities (678) (2,875)
Contingent liabilities (bank guarantees) (9) (33)
The consolidated entity owns a 32.5% (2014 – 32.5%) interest in Cedar Woods Wellard Limited, a property development company incorporated in Australia.
The directors have determined that they do not control Cedar Woods Wellard Limited as no one investor can direct the activities without the co-operation of the others.

D –
Unr
ecog
nise
d Ite
ms
CEDAR WOODS PROPERTIES LIMITED
80
Section D: Unrecognised Items
This section of the notes provides information about items that are not recognised in the financial statements as they do not satisfy the recognition criteria.
D1. Contingent liabilities ...................................................................................................................................... 81
D2. Commitments ................................................................................................................................................. 82
D3. Events occurring after the reporting period ................................................................................................ 83

D1
– U
nrec
ogni
sed
Item
s
81
2015 ANNUAL REPORT
D1. Contingent LiabilitiesAt 30 June 2015 the group had contingent liabilities in respect of:
a) Bank guarantees
At 30 June 2015 bank guarantees totalling $13,688,000 (2014 - $12,620,000) had been provided to various state and local authorities supporting development and maintenance commitments.

D2
– U
nrec
ogni
sed
Item
s
CEDAR WOODS PROPERTIES LIMITED
82
D2. Commitments
b) Non-cancellable operating leases
Commitments for minimum lease payments in relation to non-cancellable operating leases contracted for at the reporting date but not recognised as liabilities are payable as follows:
Consolidated
2015 $’000
2014 $’000
Within 1 year 711 692
Later than 1 year but not later than 5 years 2,167 1,151
2,878 1,843
The group leases various offices under non-cancellable operating leases expiring within 5 years. The leases have varying terms, escalation clauses and renewal rights. On renewal, the terms of the leases are renegotiated.
c) Capital commitments
At 30 June 2015 the consolidated entity had commitments under civil works, building construction and landscaping construction for development of its projects in the ordinary course of business. The total amount contracted for work yet to be completed for civil works was $11,331,000 (2014 - $12,079,000), for building construction was $22,982,000 (2014 - $26,810,000) and for landscaping construction was $987,000 (2014 - $2,342,000). This work will be substantially completed in the next 12 months.

D3
– U
nrec
ogni
sed
Item
s
83
2015 ANNUAL REPORT
D3. Events occurring after the reporting periodIn August 2015 Cedar Woods purchased land at 19 and 21 Baldivis Road, Baldivis comprising 50.74 hectares. The purchase price is $26.25m plus GST and is scheduled to settle on 31 August 2015. The land adjoins the existing 68 hectares of land owned by Cedar Woods. Development of the combined landholding is expected to commence in calendar year 2016.

E –
Oth
er In
form
atio
n
E –
Oth
er In
form
atio
n
CEDAR WOODS PROPERTIES LIMITED
84
Section E: Other Information
Section E contains information that is not immediately related to individual line items in the financial statements, such as related party transactions, share based payments and a full list of the accounting policies applied by the entity.
E1. Related party transactions ............................................................................................................................ 85
E2. Remuneration of auditors .............................................................................................................................. 86
E3. Employee share scheme ................................................................................................................................ 87
E4. Summary of accounting policies ................................................................................................................... 88
E5. Segment information ...................................................................................................................................... 96
E6. Parent entity financial information ................................................................................................................ 97

E1
– O
ther
Info
rmat
ion
85
2015 ANNUAL REPORT
E1. Related Party Transactions
a) Key management personnel compensation
Additional disclosures relating to key management personnel are set out in the Directors’ Report.
Consolidated
2015$
2014$
Short-term employee benefits 2,474,008 2,740,384
Post-employment benefits 157,429 148,279
Long-term employee benefits 152,133 111,826
Termination benefit 124,500 -
2,908,070 3,000,489
b) Group
The group consists of Cedar Woods Properties Limited and its controlled entities. A list of these entities and the ownership interests held by the parent entity are set out in note C1.
c) Parent entity
The parent entity within the group is Cedar Woods Properties Limited.
d) Transactions with other related parties
Cedar Woods Properties Management Pty Ltd and Cedar Woods Property Sales derived management and selling fees totalling $1,361,275 (2014 - $1,749,173) from Cedar Woods Wellard Limited.
e) Terms and conditions
Management and selling fees are derived according to management agreements in place between the parties. These are based on normal terms and conditions, at market rates at the time of entering into the agreements.
f) Guarantees
Cedar Woods Properties Limited has provided a performance guarantee in respect of the bank facility provided to Cedar Woods Wellard Limited (CWWL), a joint venture entity owned 32.5% (2014 – 32.5%) by the group. The guarantee has been given in relation to performance undertakings given by CWWL. No amount (2014 – nil) was advanced in relation to this guarantee during the year as part of an interest bearing loan to CWWL, with interest charged at 16% (2014 – 16%-17%). This guarantee has subsequently been removed post year end.
g) Outstanding balances arising from sales / purchases of goods and services
The following balances are outstanding at the end of the reporting period in relation to transactions with related parties:
2015$
2014$
Current receivables (sales of goods and services)
Cedar Woods Wellard Limited - 2,060
- 2,060
h) Loans to related parties
Loan to Cedar Woods Wellard Limited2015
$2014
$
Beginning of the year 2,610,154 7,668,823
Loan repayments received (2,796,146) (6,000,000)
Interest charged 185,992 941,331
End of year - 2,610,154

E2
– O
ther
Info
rmat
ion
CEDAR WOODS PROPERTIES LIMITED
86
E2. Remuneration of AuditorsDuring the year the following fees were paid or payable to the auditor of the parent entity:
PricewaterhouseCoopers – Australian firm2015
$2014
$
Assurance services
- Audit and review of the financial statements of the parent entity, controlled entities and co-development projects 239,007 176,929
Non-audit services
- Research and development advice 266,649 259,209
- Other taxation advice and reviews 29,325 63,900
Total fees for non-audit services 295,974 323,109
534,981 500,038
The statutory audit requirements for the group vary from year to year and can have an impact on the level of audit fees. Audit Fees in FY2015 include $24,250 in relation to the FY2014 audit that were subsequently billed in FY2015.
The consolidated entity may decide to engage the auditor on assignments additional to their statutory audit duties where the auditor’s expertise and experience with the consolidated entity is important. These assignments relate to accounting advice, tax advice and reviews, research and development advice and other advice. All non-audit services are reviewed and approved by the Audit and Risk Management Committee to ensure they do not adversely impact the independence and objectivity of the auditor.
The majority of non-audit services fees in FY2015 and FY2014 relate to research and development (R&D) tax incentive work. There were two R&D assignments in FY2015 (for the FY2013 and FY2014 tax years), hence the associated cost was higher than the previous year when there was only one year’s R&D assignment.
Fees for non-audit services are lower in FY2015 than FY2014 and aside from the R&D work, the extent of other non-audit services provided is lower in FY2015 than in FY2014. The auditor has provided an independence declaration and the committee is satisfied that the work performed on non-audit services is conducted by a team separate from the audit team and does not impact the independence of the auditor.
The work on R&D (and any other non-audit assignments of significant scale) will be performed by a different firm to the auditor in future years, with the objective that the value of non-audit services provided by the audit firm does not exceed the value of the audit services.

E3
– O
ther
Info
rmat
ion
87
2015 ANNUAL REPORT
E3. Employee Share SchemeThe employee share plan has been discontinued. Under the plan, certain employees were granted shares funded by interest free loans from the company and repaid by dividends. At 30 June 2015, $29,000 (2014 - $34,000) remained outstanding from employees in relation to loans granted in financial years prior to 2010. No amounts were due from former employees.

E4
– O
ther
Info
rmat
ion
CEDAR WOODS PROPERTIES LIMITED
88
E4. Summary of Accounting PoliciesThe principal accounting policies adopted in the preparation of these consolidated financial statements are set out below. These policies have been consistently applied to all the years presented, unless otherwise stated. The financial statements are for the consolidated entity consisting of Cedar Woods Properties Limited and its subsidiaries.
a) Basis of preparation
These general purpose financial statements have been prepared in accordance with Australian Accounting Standards and Interpretations issued by the Australian Accounting Standards Board and the Corporations Act 2001. Cedar Woods Properties Limited is a for-profit entity for the purpose of preparing the financial statements.
i. Compliance with International Financial Reporting Standards (IFRS).
The financial statements of the Cedar Woods Properties Limited group also comply with IFRS as issued by the International Accounting Standards Board (IASB).
ii. Historical cost convention
These financial statements have been prepared under the historical cost convention, as modified by the revaluation of available-for-sale financial assets and derivative financial instruments.
iii. Critical accounting estimates
The preparation of financial statements requires the use of certain critical accounting estimates. It also requires management to exercise its judgement in the process of applying the group’s accounting policies. The areas involving a higher degree of judgement or complexity, or where assumptions and estimates are significant to the financial statements, are disclosed in B1.
iv. Functional and presentation currency
The consolidated financial statements are presented in Australian dollars, which is the functional and presentation currency of Cedar Woods Properties Limited.
b) Principles of consolidation
i. Subsidiaries
The consolidated financial statements incorporate the assets and liabilities of all entities controlled by Cedar Woods Properties Limited (parent) as at 30 June 2015 and the results of all subsidiaries for the year then ended. Cedar Woods Properties Limited and its subsidiaries together are referred to in these financial statements as the consolidated entity or the group.
Subsidiaries are those entities over which the parent has the power to govern the financial and operating policies, generally accompanying a shareholding of one-half or more of the voting rights.
The acquisition method of accounting is used to account for business combinations by the group. Subsidiaries are fully consolidated from the date on which control is transferred to the parent. They are de-consolidated from the date that control ceases.
All inter-company balances and transactions between companies within the consolidated entity are eliminated upon consolidation.
ii. Joint arrangements
Joint arrangements – Under AASB 11 Joint Arrangements, investments in joint arrangements are classified as either joint operations or joint ventures. The classification depends on the contractual rights and obligations of each investor, rather than the legal structure of the joint arrangement. The consolidated entity has both joint operations and joint ventures.
Joint operations - The consolidated entity recognises its direct right to assets, liabilities, revenues and expenses of joint operations, which have been incorporated in the financial statements under the appropriate headings.
Joint ventures – Interest in joint ventures are accounted for using the equity method (see below), after initially being recognised at cost in the consolidated balance sheet. Details of the joint ventures are set out in note C1(b).

E4
– O
ther
Info
rmat
ion
89
2015 ANNUAL REPORT
iii. Equity method
Under the equity method of accounting, the investments are initially recognised at cost and adjusted thereafter to recognise the group’s share of the post-acquisition profits or losses of the investee in profit or loss, and the group’s share of movements in other comprehensive income.
c) Revenue recognition
Revenue is measured at the fair value of the consideration received or receivable and is recognised net of discounts and taxes paid. The following specific recognition criteria must also be met before revenue is recognised:
i. Sale of land and buildings
Revenue arising from the sale of land and buildings held for resale is recognised at settlement.
ii. Interest
Interest income is recognised using the effective interest method. When a receivable is impaired, the group reduces the carrying amount to its recoverable amount, being the estimated future cash flow discounted at the original effective interest rate of the instrument, and continues unwinding the discount as interest income. Interest income on impaired loans is recognised using the original effective interest rate.
iii. Dividends
Dividends are recognised as revenue when the right to receive payment is established.
iv. Lease income
Income from operating leases is recognised on a straight line basis over the period of each lease.
v. Commissions and fees
Commission and fee income is recognised when the right to receive the income has been earned in accordance with contractual arrangements.
d) Income tax
The income tax expense or revenue for the period is the tax payable on the current period’s taxable income based on the income tax rate in Australia adjusted by changes in deferred tax assets and liabilities attributable to temporary differences and to unused tax losses, if any.
The current income tax charge is calculated on the basis of the tax laws enacted or substantially enacted at the end of the reporting period.
Deferred income tax is provided in full, using the liability method, on temporary differences arising between the tax bases of assets and liabilities and their carrying amounts in the consolidated financial statements. Deferred income tax is determined using the tax rates expected to apply when the assets are recovered or liabilities are settled, based on those tax rates which are enacted or substantively enacted.
Deferred tax assets are recognised for deductible temporary differences and unused tax losses only if it is probable that future taxable amounts will be available to utilise those temporary differences and losses.
Deferred tax assets and liabilities are offset when there is a legally enforceable right to offset current tax assets and liabilities and when the deferred tax balances relate to the same taxation authority.
Cedar Woods Properties Limited and its wholly owned Australian controlled entities have implemented the tax consolidation legislation. As a consequence, these entities are taxed as a single entity and the deferred tax assets and liabilities of these entities are set off in the consolidated financial statements.
Current and deferred tax is recognised in profit and loss, except to the extent that it relates to items recognised in other comprehensive income or directly in equity. In this case, the tax is also recognised in other comprehensive income or directly in equity respectively.

E4
– O
ther
Info
rmat
ion
CEDAR WOODS PROPERTIES LIMITED
90
e) Earnings per share
i. Basic earnings per share
Basic earnings per share is determined by dividing the profit attributable to owners of Cedar Woods Properties Limited by the weighted average number of ordinary shares outstanding during the financial year, adjusted for any bonus elements in ordinary shares issued during the year.
ii. Diluted earnings per share
Diluted earnings per share adjusts the earnings used in the determination of basic earnings per share to take account of any effect on borrowing costs associated with the issue of dilutive potential ordinary shares. The weighted average number of ordinary shares is adjusted to reflect the conversion of all dilutive potential ordinary shares.
f) Cash and cash equivalents
For cash flow statement presentation purposes, cash and cash equivalents includes cash on hand, and deposits at call which are readily convertible to cash on hand and are subject to an insignificant risk of changes in value. Bank overdrafts are shown within borrowings in current liabilities on the balance sheet.
g) Inventories and options over land
i. Property held for development and resale
Since 1 July 1992, property purchased for development and sale is valued at the lower of cost and net realisable value. Cost includes acquisition and subsequent development costs, and applicable borrowing costs incurred during development. Net realisable value is the estimated selling price in the ordinary course of business less the estimated costs of completion and the estimated costs necessary to make the sale. All property held for development and sale is regarded as inventory and is classified as such in the balance sheet. Property is classified as current inventory only when sales are expected to result in realisation of cash within the next twelve months, based on management’s sales forecasts. Borrowing costs incurred prior to active development and after development is completed, are expensed as incurred.
Prior to 1 July 1992 the consolidated entity’s land assets were classified on acquisition as non-current investments and initially recorded at cost with regular independent valuations being undertaken. Increments or decrements were reflected in the balance sheet and also recognised in equity. The balance of this land is stated at 1992 valuation, which is its deemed cost. The amount remaining in the Asset Revaluation Reserve represents the balance of the net revaluation increment for land revalued prior to 1 July 1992 which is now classified as inventory and which is still held by the consolidated entity. When revalued assets are sold, it is policy to transfer any amounts included in reserves in respect of those assets to retained earnings.
The acquisition of land is recognised when an unconditional purchase contract exists.
When property is sold, the cost of the land and attributable development costs, including borrowing costs, is expensed through cost of sales.
h) Deferred development costs
Development costs incurred by the group for the development of land not held as an asset by the group are recorded as deferred development costs in the balance sheet. They are included in current assets, except for those which are not expected to be reimbursed within 12 months of the reporting period, which are classified as non-current assets. In instances when the deferred development costs are reimbursed by the land owner, they are expensed in the profit or loss.

E4
– O
ther
Info
rmat
ion
91
2015 ANNUAL REPORT
i) Assets classified as held for sale
Non-current assets are classified as held for sale if their carrying amount will be recovered principally through a sale transaction rather than through continuing use and a sale is considered highly probable. They are measured at the lower of carrying amount and fair value, less costs to sell.
An impairment loss is recognised for any initial or subsequent write-down of the asset (or disposal) to fair value less costs to sell. A gain is recognised for any subsequent increase in fair value less costs to sell of an asset (or disposal), but not in excess of any cumulative impairment loss previously recognised. A gain or loss not previously recognised by the date of the sale of the non-current asset (or disposal) is recognised at the date of derecognition.
Non-current assets are not depreciated or amortised while they are classified as held for sale. Non-current assets classified as held for sale are presented separately from the other assets in the balance sheet.
j) Business combinations
The acquisition method of accounting is used to account for all business combinations. Cost is measured as the fair value of the assets given, or liabilities undertaken at the date of acquisition. Acquisition related costs are expensed as incurred.
Where settlement of any part of cash consideration is deferred, the amounts payable in the future are discounted to their present values at the date of acquisition. The discount rate used is the incremental borrowing rate applied by the consolidated entity’s financiers for a similar borrowing under comparable terms and conditions.
k) Impairment of assets
Assets are tested for impairment whenever events or changes in circumstances indicate that the carrying amount may not be recoverable. An impairment loss is recognised for the amount by which the asset’s carrying amount exceeds its recoverable amount. The recoverable amount of an asset is the higher of its fair value less costs of disposal and value in use. For the purposes of assessing impairment, assets are grouped at the lowest level for which there are separately identifiable cash generating units, which is generally the project level. Assets that suffered an impairment are reviewed for possible reversal of the impairment at the end of each reporting period.
l) Property, plant and equipment
Property, plant and equipment is substantially made up of furniture, fittings and equipment and is stated at historical cost less depreciation. Depreciation is calculated on a straight line or diminishing value basis to write off the net cost of each item of property, plant and equipment, including leased equipment, over its expected useful life to the consolidated entity. The expected useful lives of items of property, plant and equipment and the depreciation methods used are:
• Plant and equipment – 3 to 15 years (straight line and diminishing value methods)
The assets’ residual values and useful lives are reviewed for impairment and adjusted if appropriate, at each reporting date.
Gains and losses on disposals are determined by comparing proceeds with carrying amount. These are included in the profit or loss.
m) Investments and other financial assets
The group classifies its financial assets in the following categories: financial assets at fair value through profit or loss, loans and receivables and available for sale financial assets. The classification depends on the purpose for which investments were acquired. Management determines the classification of its investments at initial recognition.
i. Financial assets at fair value through profit or loss
Financial assets at fair value through profit or loss are financial assets held for trading. A financial asset is classified in this category if acquired principally for the purpose of selling in the short term. Derivatives are classified as held for trading unless they are designed as hedges. Assets in this category are classified as current assets if they are expected to be settled within 12 months, otherwise they are classified as non-current.
ii. Loans and receivables
Loans and receivables are non-derivative financial assets with fixed or determinable payments that are not quoted in an active market. They are included in non-current assets, except for those with maturities less than 12 months after the reporting period which are classified as current assets. Loans and receivables are included in receivables in the balance sheet. Loans and receivables are carried at amortised cost using the effective interest method.

E4
– O
ther
Info
rmat
ion
CEDAR WOODS PROPERTIES LIMITED
92
iii. Available-for sale financial assets
Available-for-sale financial assets, comprising marketable equity securities and other securities, are non-derivatives that are either designated in this category or not classified in any of the other categories. They are included in non-current assets as management does not intend to sell them within 12 months. Available-for-sale financial assets are carried at fair value. Changes in the fair value not arising from impairment or interest are recognised in other comprehensive income.
The group assesses at the end of each reporting period whether there is objective evidence that a financial asset is impaired. If there is evidence of impairment, the loss is measured as the difference between the asset’s carrying amount and the present value of estimated future cash flows, excluding future credit losses that have not been incurred. In the case of loans and receivables, the cash flows are discounted at the financial asset’s original effective interest rate. The loss is recognised in profit or loss.
n) Investment property
i. Investment property
Investment property, principally comprising retail property, is held for long term rental yields and is not occupied by the consolidated entity. Investment property includes properties under construction for future use as investment property and is stated at historical cost less depreciation. Depreciation is calculated on a straight line basis to write off the net cost of each investment over its expected useful life to the consolidated entity. The expected useful life of investment property buildings is 40 years.
When the company elects to dispose of investment property, it is presented as assets classified as held for sale in the balance sheet where it meets the relevant criteria. Net gains or losses on sale are disclosed in the profit or loss.
ii. Lease incentives
Lease incentives provided under an operating lease by the Group as lessor are recognised on a straight line basis against rental income over the lease period.
o) Employee benefits
i. Short term obligations
Liabilities for wages and salaries, bonuses and annual leave expected to be settled within 12 months of the reporting date are recognised in other payables in respect of employees’ services up to the reporting date and are measured at the amounts expected to be paid when the liabilities are settled. All other short-term employee benefit obligations are presented as payables.
ii. Other long term employee benefit obligations
The liability for long service leave which is not expected to be settled within 12 months after the end of the period in which the employees render the related service is recognised in the provision for employee benefits and measured as the present value of expected future payments to be made in respect of services provided by employees up to the reporting date. Consideration is given to expected future wage and salary levels, experience of employee departures and periods of service. Expected future payments are discounted using market yields at the reporting date on national corporate bonds with terms to maturity that match, as closely as possible, the estimated future cash flows.
iii. Bonus plans
The group recognises a liability and expense for bonuses earned during the financial year where contractually obliged or where past practice has created a constructive obligation.
iv. Superannuation
Contributions by the consolidated entity to employees’ superannuation funds are charged to the profit or loss when they are payable. The consolidated entity does not operate any defined benefit superannuation funds.
E4
– O
ther
Info
rmat
ion
93
2015 ANNUAL REPORT
p) Trade and other payables
These amounts represent liabilities for goods and services provided to the consolidated entity prior to the end of the financial year and which are unpaid. These amounts are unsecured and are usually paid within 30 to 60 days of recognition.
q) Leases
Leases of property, plant and equipment in which a significant portion of the risks and rewards of ownership are not transferred to the consolidated entity as lessee are classified as operating leases. Operating lease payments are charged to the profit or loss in the periods in which they are incurred as this represents the pattern of benefit derived from the leased assets.
Lease income from operating leases where the group is a lessor is recognised in income on a straight line basis over the lease term. The respective leased assets are included in the balance sheet as investment properties.
r) Borrowings and borrowing costs
Borrowings are initially recognised at fair value, net of transaction costs incurred. Borrowings are subsequently measured at amortised cost. Any difference between the proceeds (net of transaction costs) and the redemption amount is recognised in profit or loss over the period of the borrowings using the effective interest method.
Fees paid on the establishment of loan facilities are recognised as transaction costs of the loan to the extent that it is probable that some or all of the facility will be drawn down. In this case the fee is deferred until the commencement of the facility when draw down occurs.
Borrowings are removed from the balance sheet when the obligation specified in the contract is discharged, cancelled or expired. Borrowings are classified as current liabilities unless the group has an unconditional right to defer settlement of the liability for at least 12 months after the end of the reporting period.
Borrowing costs are recognised as expenses in the period in which they are incurred, except where they are included in the costs of qualifying assets during the period when the asset is being prepared for its intended use or sale.
s) Provisions for customer rebates
Provision is made for the estimated liability arising from obligations in existence at balance date to customers for the provision of landscaping and fencing rebates and other incentives, to which customers are generally entitled within 12 months of balance date.
t) Dividends
Provision is made for the amount of any dividend declared, being appropriately authorised and no longer at the discretion of the entity, on or before the end of the financial year but not distributed at balance date.
u) Maintenance
Routine operating maintenance and repairs are charged as expenses as incurred.
v) Contributed equity
Ordinary shares are classified as equity. Incremental costs directly attributable to the issue of new shares are shown in equity as a deduction, net of tax, from the proceeds.
w) Segment reporting
Management has determined the operating segment based on the reports reviewed by the Managing Director that are used to make strategic decisions. The Managing Director has been identified as the chief operating decision maker.
x) Trade and other receivables
Trade receivables are recognised initially at fair value and subsequently measured at amortised cost using the effective interest method, less provision for impairment. Trade receivables are generally due for settlement within one year.
Collectability of trade receivables is reviewed regularly. Receivables that are uncollectable are written off by reducing the carrying amount directly. Receivables include prepayments and loans made under the discontinued employee share scheme.

E4
– O
ther
Info
rmat
ion
CEDAR WOODS PROPERTIES LIMITED
94
y) Derivatives
Derivatives are initially recognised at fair value on the date a derivative contract is entered into and are subsequently remeasured to their fair value at each reporting date. Changes to fair value are taken to profit or loss and are included in other income or expenses.
z) Goods and services tax (GST)
Revenues, expenses and assets are recognised net of the amount of associated GST, unless the GST incurred is not recoverable from the taxation authority. In this case it is recognised as part of the cost of the asset or as part of the expense.
Receivables and payables are stated inclusive of the amount of GST receivable or payable. The net amount of GST recoverable from, or payable to, the taxation authority is included with other receivables or payables in the balance sheet.
Cash flows are presented on a gross basis. The GST components of cash flows arising from investing or financing activities which are recoverable from, or payable to, taxation authorities, are presented as operating cash flows.
aa) New accounting standards and interpretations
The group has applied the following standards and amendments for the first time for the annual reporting period commencing 1 July 2014:
AASB 119 Employee Benefits (September 2011) and AASB 2011-10 Amendments to Australian Accounting Standards arising from AASB 119 (September 2011); and
AASB 2014-1 Amendments to Australian Accounting Standards
The adoption of AASB 119 explained and summarised below. The other standards only affected the disclosures in the notes to the financial statements.
i. Employee benefits
The adoption of the revised AASB 119 Employee Benefits changed the accounting for the group’s annual leave obligations. Where the entity does not expect all annual leave to be taken within 12 months of the respective service being provided, annual leave obligations are now classified as long-term employee benefits in their entirety. This changes the measurement of these obligations, as the entire obligation is now measured on a discounted basis and no longer split into short term and long term portion. However, the impact of this change was immaterial since the majority of the leave is still expected to be taken within a short period after the end of the reporting period.
ii. New accounting standards not yet adopted
Certain new accounting standards and interpretations have been published that are not mandatory for 30 June 2015 reporting periods. The group’s assessment of the impact of these new standards and interpretations is set out below.
Title of Standard Nature of change ImpactMandatory application date / Date of adoption by group
AASB 9 Financial Instruments
AASB 9 Financial Instruments addresses the classification, measurement and derecognition of financial assets and financial liabilities and introduces new rules for hedge accounting. In December 2014, the AASB made further changes to the classification and measurement rules and also introduced a new impairment model. These latest amendments now complete the new financial instruments standard.
The application of the standard at the operative date is not expected to have a significant impact on the group’s accounting for financial assets and liabilities as the new requirements only affects the accounting for assets or liabilities that are designated at fair value through profit or loss and the group does not have any such liabilities.
Must be applied for financial years commencing on or after 1 January 2018.

E4
– O
ther
Info
rmat
ion
95
2015 ANNUAL REPORT
Title of Standard Nature of change ImpactMandatory application date / Date of adoption by group
AASB 15 Revenue from Contracts with Customers
The AASB has issued a new standard for the recognition of revenue. This will replace AASB 118 which covers contracts for goods and services and AASB 111 which covers construction contracts.
The new standard is based on the principle that revenue is recognised when control of a good or service transfers to a customer – so the notion of control replaces the existing notion of risks and rewards.
The standard permits a modified retrospective approach for the adoption. Under this approach entities will recognise transitional adjustments in retained earnings on the date of initial application (e.g. 1 July 2017), i.e. without restating the comparative period. They will only need to apply the new rules to contracts that are not completed as of the date of initial application.
Management is currently assessing the impact of the new rules.
At this stage, the group is not able to estimate the impact of the new rules on the group’s financial statements. The group will make more detailed assessments of the impact over the next twelve months.
Mandatory for financial years commencing on or after 1 January 2017.
Expected date of adoption by the group: 1 July 2017.
There are no other standards that are not yet effective and that are expected to have a material impact on the consolidated entity in the current or future reporting periods and on foreseeable future transactions.
bb) Rounding of amounts
The company is of a kind referred to in Class Order 98/0100, issued by the Australian Securities and Investments Commission, relating to the ‘rounding off’ of amounts in the financial statements.
Amounts in the financial statements have been rounded off in accordance with that Class Order to the nearest thousand dollars, or in certain cases, to the nearest dollar.

E5
– O
ther
Info
rmat
ion
CEDAR WOODS PROPERTIES LIMITED
96
E5. Segment InformationThe board has determined the operating segment based on the reports reviewed by the Managing Director that are used to make strategic decisions.
The board has considered the business from both a product and a geographic perspective and has determined that the group operates a single business in a single geographic area and hence has one reportable segment.
The group engages in property investment and development which takes place in Australia. The group has no separate business units or divisions.
The internal reporting provided to the Managing Director includes key performance information at a whole of group level. The Managing Director uses the internal information to make strategic decisions, based primarily upon the expected future outcome of those decisions on the group as a whole. Material decisions to allocate resources are generally made at a whole of group level.
The group sells products to the public and is not reliant upon any single customer for 10% or more of the group’s revenue.
All of the group’s assets are held within Australia.
The Managing Director assesses the performance of the operating segment based on the net profit after tax, earnings per share and net tangible assets per share.

E6
– O
ther
Info
rmat
ion
97
2015 ANNUAL REPORT
E6. Parent Entity Financial InformationThe financial information for the parent entity, Cedar Woods Properties Limited, has been prepared on the same basis as the consolidated financial statements, except as detailed in notes (i) and (ii) below.
The individual financial statements for the parent entity show the following aggregate amounts:
2015 $’000
2014 $’000
Balance sheet
Current assets 51,095 53,893
Total assets 315,404 306,261
Current liabilities (89,411) (63,154)
Total liabilities 97,212 (104,998)
Net assets 218,192 201,263
Shareholders’ equity
Issued capital 119,525 116,716
Retained earnings 98,667 84,547
218,192 201,263
Profit for the year 31,525 32,104
Total comprehensive income 31,525 32,104
i. Investments in subsidiaries and joint venture entities
Investments in subsidiaries and joint venture entities are accounted for at cost in the financial statements of Cedar Woods Properties Limited. Such investments include both investments in shares issued by the subsidiary and other parent entity interests that in substance form part of the parent entity’s investment in the subsidiary. These include investments in the form of interest free loans which have no fixed repayment terms and which have been provided to subsidiaries as an additional source of long term capital. Dividends received from joint ventures are recognised in the parent entity’s profit or loss, rather than being deducted from the carrying amount of these investments.
ii. Tax consolidation legislation
Cedar Woods Properties Limited and its wholly owned Australian controlled entities have implemented the tax consolidation legislation.
The head entity, Cedar Woods Properties Limited, and the controlled entities in the tax-consolidated group account for their own current and deferred tax amounts. These tax amounts are measured as if each entity in the tax-consolidated group continues to be a standalone taxpayer in its own right. In addition to its own current and deferred tax amounts, Cedar Woods Properties Limited also recognises the current tax liabilities (or assets) and the deferred tax assets arising from unused tax losses and unused tax credits assumed from controlled entities in the tax-consolidated group.
The entities have also entered into a tax funding agreement under which the 100% subsidiaries fully compensate the parent for any current tax payable assumed and are compensated by the parent for any current tax receivable and deferred tax assets relating to unused tax losses that are transferred to the parent under the tax consolidation legislation. The funding amounts are determined by reference to the amounts recognised in the 100% subsidiaries’ financial statements.
The amounts receivable/payable under the tax funding agreement are due upon receipt of the funding advice from the head entity when it is issued. The head entity may require payment of interim funding amounts to assist with its obligations to pay tax instalments.
Assets or liabilities arising under tax funding agreements with the tax consolidated entities are recognised as current amounts receivable from or payable to other entities in the group.

F –
Dec
lara
tion
and
Inde
pend
ent
Aud
itor’s
Rep
ort
CEDAR WOODS PROPERTIES LIMITED
98
Section F: Declaration and Independent Auditor’s Report
F1. Directors’ Declaration .................................................................................................................................... 99
F2. Independent Auditor’s Report to the Members of Cedar Woods Properties Limited ............................ 100

F1 –
Dec
lara
tion
and
Inde
pend
ent
Aud
itor’s
Rep
ort
99
2015 ANNUAL REPORT
F1. Directors’ DeclarationIn the directors’ opinion:
a) the financial statements that are set out in the financial statements section and notes on pages 44 to 97 are in accordance with the Corporations Act 2001, including:
i. complying with Accounting Standards, the Corporations Regulations 2001 and other mandatory professional reporting requirements; and
ii. giving a true and fair view of the consolidated entity’s financial position as at 30 June 2015 and of its performance for the financial year ended on that date; and
b) there are reasonable grounds to believe that the company will be able to pay its debts as and when they become due and payable.
Note E4(a) confirms that the financial statements also comply with International Financial Reporting Standards as issued by the International Accounting Standards Board.
The directors have been given the declarations by the Managing Director and Chief Financial Officer required by section 295A of the Corporations Act 2001.
This declaration is made in accordance with a resolution of the directors.
P S Sadleir Managing Director
Perth, Western Australia 25 August 2015

F2 –
Dec
lara
tion
and
Inde
pend
ent
Aud
itor’s
Rep
ort
CEDAR WOODS PROPERTIES LIMITED
100
PricewaterhouseCoopers, ABN 52 780 433 757 Brookfield Place, 125 St Georges Terrace, PERTH WA 6000, GPO Box D198, PERTH WA 6840 T: +61 8 9238 3000, F: +61 8 9238 3999, www.pwc.com.au Liability limited by a scheme approved under Professional Standards Legislation.
Independent auditor’s report to the members of Cedar Woods Properties Limited
Report on the financial report We have audited the accompanying financial report of Cedar Woods Properties Limited (the company), which comprises the consolidated balance sheet as at 30 June 2015, the consolidated statement of profit or loss and other comprehensive income, consolidated statement of changes in equity and consolidated cash flow statement for the year ended on that date, a summary of significant accounting policies, other explanatory notes and the directors’ declaration for Cedar Woods Properties Limited (the consolidated entity). The consolidated entity comprises the company and the entities it controlled at year’s end or from time to time during the financial year.
Directors’ responsibility for the financial report The directors of the company are responsible for the preparation of the financial report that gives a true and fair view in accordance with Australian Accounting Standards and the Corporations Act 2001 and for such internal control as the directors determine is necessary to enable the preparation of the financial report that is free from material misstatement, whether due to fraud or error. In Note E4, the directors also state, in accordance with Accounting Standard AASB 101 Presentation of Financial Statements, that the financial statements comply with International Financial Reporting Standards.
Auditor’s responsibility Our responsibility is to express an opinion on the financial report based on our audit. We conducted our audit in accordance with Australian Auditing Standards. Those standards require that we comply with relevant ethical requirements relating to audit engagements and plan and perform the audit to obtain reasonable assurance whether the financial report is free from material misstatement.
An audit involves performing procedures to obtain audit evidence about the amounts and disclosures in the financial report. The procedures selected depend on the auditor’s judgement, including the assessment of the risks of material misstatement of the financial report, whether due to fraud or error. In making those risk assessments, the auditor considers internal control relevant to the consolidated entity’s preparation and fair presentation of the financial report in order to design audit procedures that are appropriate in the circumstances, but not for the purpose of expressing an opinion on the effectiveness of the entity’s internal control. An audit also includes evaluating the appropriateness of accounting policies used and the reasonableness of accounting estimates made by the directors, as well as evaluating the overall presentation of the financial report.
We believe that the audit evidence we have obtained is sufficient and appropriate to provide a basis for our audit opinion.
Independence In conducting our audit, we have complied with the independence requirements of the Corporations Act 2001.
F2. Independent Auditor’s Report to the members of Cedar Woods Properties Limited

F2 –
Dec
lara
tion
and
Inde
pend
ent
Aud
itor’s
Rep
ort
101
2015 ANNUAL REPORT
2
Independent auditor’s report to the members of Cedar Woods Properties Limited (cont’d)
Auditor’s opinion In our opinion:
(a) the financial report of Cedar Woods Properties Limited is in accordance with the Corporations Act 2001, including:
(i) giving a true and fair view of the consolidated entity's financial position as at 30 June 2015 and of its performance for the year ended on that date; and
(ii) complying with Australian Accounting Standards (including the Australian Accounting Interpretations) and the Corporations Regulations 2001.
(b) the financial report and notes also comply with International Financial Reporting Standards as disclosed in Note E4.
Report on the Remuneration Report We have audited the remuneration report included in pages 20 to 33 of the directors’ report for the year ended 30 June 2015. The directors of the company are responsible for the preparation and presentation of the remuneration report in accordance with section 300A of the Corporations Act 2001. Our responsibility is to express an opinion on the remuneration report, based on our audit conducted in accordance with Australian Auditing Standards.
Auditor’s opinion In our opinion, the remuneration report of Cedar Woods Properties Limited for the year ended 30 June 2015 complies with section 300A of the Corporations Act 2001.
PricewaterhouseCoopers
Douglas Craig Perth Partner 25 August 2015

G –
Sha
reho
lder
s’ In
form
atio
n
CEDAR WOODS PROPERTIES LIMITED
102
Section G: Shareholders’ Information
This section provides information for shareholders on distributions and other shareholder benefits, the composition of the share register and past financial performance.
G1. Investors’ Summary ........................................................................................................................................ 103
a) Dividend and dividend policy .............................................................................................................................. 103
b) Shareholder discount scheme ............................................................................................................................ 103
c) Electronic payment of dividends ......................................................................................................................... 103
d) Dividend re-investment plan and Bonus share plan ............................................................................................ 103
e) Shareholders’ timetable ..................................................................................................................................... 103
f) Shareholder information ..................................................................................................................................... 104
G2. Five year financial performance .................................................................................................................... 106

G1
– S
hare
hold
ers’
Info
rmat
ion
103
2015 ANNUAL REPORT
G1. Investors’ Summary
a) Dividend and dividend policy
The dividend policy is to distribute approximately 50% of the full year net profit after tax. The final dividend for the 2015 financial year is 16 cents per share, fully franked. The dividend will be paid on 30 October 2015.
b) Shareholder discount scheme
The group operates a shareholder discount scheme which entitles shareholders to a 5% discount off the listed price of any residential lot, or 2.5% off the listed price of houses or apartments at the group’s developments. A summary of the main terms and conditions follows:
• Shareholders must hold a minimum number of 1,000 shares for at least 12 months before purchasing a lot or dwelling to qualify for the discount;
• There is no limit to the number of lots or dwellings which a shareholder may purchase under the scheme, subject to any statutory restrictions; and
• The shareholder discount scheme does not apply to lots or dwellings at joint venture projects.
The above is a summary of the main conditions and shareholders should apply to the company or visit the website for the full terms and conditions.
c) Electronic payment of dividends
The group continues to offer the electronic payment of dividends, which is now in use by the majority of our shareholders. Shareholders may nominate a bank, building society or credit union account for the payment of dividends by direct credit. Payments are electronically credited on the dividend payment date and confirmed by mailed advice. Shareholders wishing to take advantage of this facility for the first time should contact the Company’s Share Registrar, Computershare Investor Services Pty Ltd, by visiting www.computershare.com.au.
d) Dividend re-investment plan and Bonus share plan
The dividend re-investment plan and bonus share plan are operated from time to time as part of measures to manage the group’s capital. Shareholders can change their participation status in the plans by completing an election form in accordance with the rules of each plan. The dividend re-investment plan and bonus share plan are in operation for the final dividend for the 2015 financial year.
e) Shareholders’ timetable
Dividend announcement 26 August 2015
Share register closes for dividend (Record date) 2 October 2015
Final dividend payment date 30 October 2015
First quarter update October 2015
Annual General Meeting 9 November 2015
Half-year result announcement February 2016
Interim dividend payment date 29 April 2016
Third quarter update May 2016
Full year result and dividend announcement August 2016

G1
– S
hare
hold
ers’
Info
rmat
ion
CEDAR WOODS PROPERTIES LIMITED
104
f) Shareholder Information
The shareholder information set out below was applicable at 31 August 2015.
i) Distribution of ordinary shares
Number of holders
Number of shares
1 – 1,000 786 327,895
1,001 – 5,000 1,042 2,774,081
5,001 – 10,000 342 2,532,209
10,001 – 100,000 403 10,605,890
100,000 and over 57 62,651,606
2,630 78,891,681
There were 221 holders of less than a marketable parcel of shares.
ii) Twenty largest shareholders of ordinary shares as disclosed in the share register
Number of shares
Percentage of shares
JP Morgan Nominees Australia Limited 8,334,483 10.56
HSBC Custody Nominees (Australia) Limited 7,530,624 9.55
Hamsha Nominees Pty Ltd (The Nowra Projects Unit Fund A/C) 6,218,138 7.88
National Nominees Limited 5,880,355 7.45
Westland Group Holdings Pty Ltd 4,639,980 5.88
Zero Nominees Pty Ltd 4,150,921 5.26
Australian Foundation Investments Company Limited 3,859,186 4.89
Beach Corporation Pty Ltd 2,384,963 3.02
Australian Executor Trustees Limited (No 1 Account) 1,894,742 2.40
Citicorp Nominees Pty Ltd 1,846,715 2.34
Helen Kaye Poynton 1,677,095 2.13
BNP Paribas Noms Pty Ltd (DRP) 1,085,857 1.38
Mr Paul Sadleir 1,045,445 1.33
HSBC Custody Nominees (Australia) Limited (NT-Comnwlth Super Corp A/C) 967,984 1.23
AMP Life Limited 696,172 0.88
Leblon Holdings Pty Ltd (William Hames Super Fund A/C) 628,482 0.80
Croftwell Pty Ltd 525,209 0.67
Mr JH Tucker & Mrs KJ Tucker (Tucker Family Super Fund A/C) 460,002 0.58
Ramneg Pty Ltd (Lang Superannuation Fund) 442,977 0.56
Australian Executor Trustees Limited (No 2 Account) 430,863 0.55
54,700,193 69.34

G1
– S
hare
hold
ers’
Info
rmat
ion
105
2015 ANNUAL REPORT
iii) Substantial shareholders of ordinary shares
As disclosed in substantial shareholder notices lodged with the ASX at 31 August 2015.
Number of shares
Percentage of shares 1
William George Hames and related entities 9,314,668 12.90
Robert Stanley Brown and related entities 7,967,627 10.87
Westpac Banking Corporation 5,635,833 7.19
Westoz Funds Management Pty Ltd 4,493,661 6.13
1 Percentage of issued capital held as at the date notice provided.
iv) Voting rights
The voting rights attaching to each class of equity securities are set out below:
Ordinary shares
On a show of hands every member present in person or by proxy shall have one vote and upon a poll each share shall have one vote.
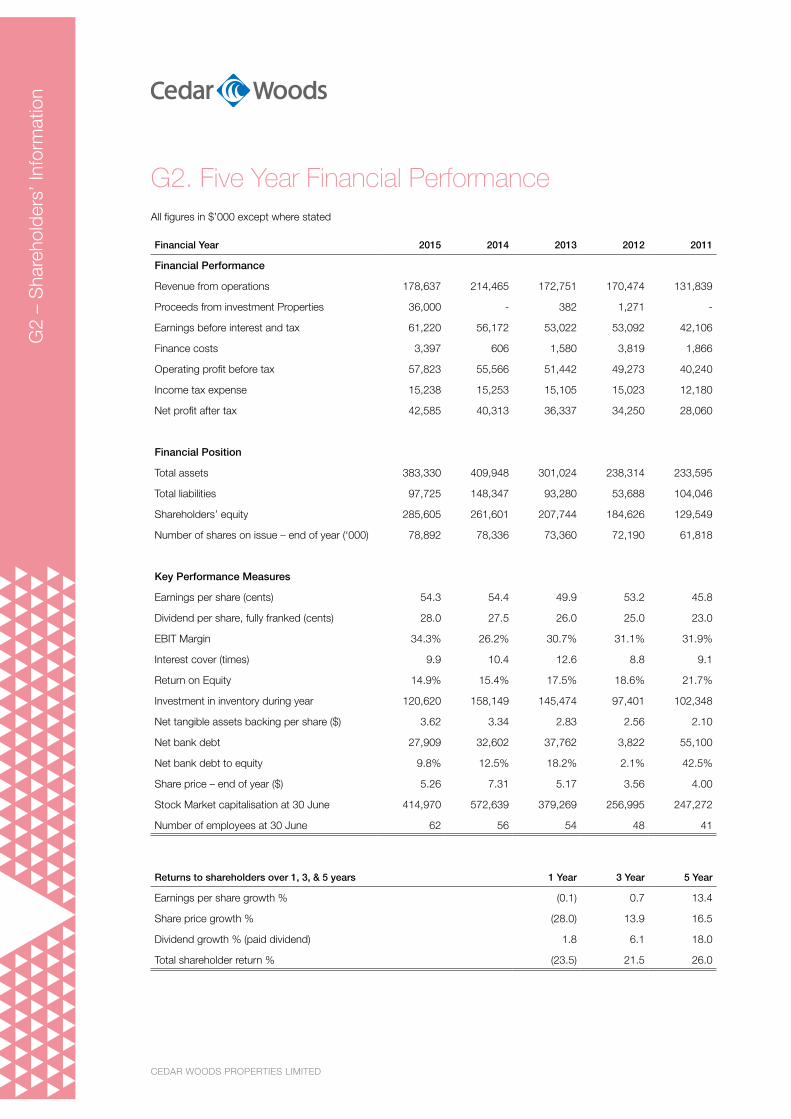
G2
– S
hare
hold
ers’
Info
rmat
ion
CEDAR WOODS PROPERTIES LIMITED
106
G2. Five Year Financial PerformanceAll figures in $’000 except where stated
Financial Year 2015 2014 2013 2012 2011
Financial Performance
Revenue from operations 178,637 214,465 172,751 170,474 131,839
Proceeds from investment Properties 36,000 - 382 1,271 -
Earnings before interest and tax 61,220 56,172 53,022 53,092 42,106
Finance costs 3,397 606 1,580 3,819 1,866
Operating profit before tax 57,823 55,566 51,442 49,273 40,240
Income tax expense 15,238 15,253 15,105 15,023 12,180
Net profit after tax 42,585 40,313 36,337 34,250 28,060
Financial Position
Total assets 383,330 409,948 301,024 238,314 233,595
Total liabilities 97,725 148,347 93,280 53,688 104,046
Shareholders’ equity 285,605 261,601 207,744 184,626 129,549
Number of shares on issue – end of year (‘000) 78,892 78,336 73,360 72,190 61,818
Key Performance Measures
Earnings per share (cents) 54.3 54.4 49.9 53.2 45.8
Dividend per share, fully franked (cents) 28.0 27.5 26.0 25.0 23.0
EBIT Margin 34.3% 26.2% 30.7% 31.1% 31.9%
Interest cover (times) 9.9 10.4 12.6 8.8 9.1
Return on Equity 14.9% 15.4% 17.5% 18.6% 21.7%
Investment in inventory during year 120,620 158,149 145,474 97,401 102,348
Net tangible assets backing per share ($) 3.62 3.34 2.83 2.56 2.10
Net bank debt 27,909 32,602 37,762 3,822 55,100
Net bank debt to equity 9.8% 12.5% 18.2% 2.1% 42.5%
Share price – end of year ($) 5.26 7.31 5.17 3.56 4.00
Stock Market capitalisation at 30 June 414,970 572,639 379,269 256,995 247,272
Number of employees at 30 June 62 56 54 48 41
Returns to shareholders over 1, 3, & 5 years 1 Year 3 Year 5 Year
Earnings per share growth % (0.1) 0.7 13.4
Share price growth % (28.0) 13.9 16.5
Dividend growth % (paid dividend) 1.8 6.1 18.0
Total shareholder return % (23.5) 21.5 26.0

107
2015 ANNUAL REPORT
Corporate Directory
A.B.N. 47 009 259 081
Directors
William George Hames, BArch (Hons) MCU (Harvard) LFRAIA, MPIA, FAPI (Econ) – Chairman
Robert Stanley Brown, MAICD, AIFS – Deputy Chairman
Ronald Packer, BCom (UWA), FAICD, Solicitor Supreme Court of England & Wales
Stephen Thomas Pearce, BBus(ACC), Grad Dip (Admin), FCA, AGIA, MAICD
Paul Stephen Sadleir, BE, MBA, AAPI, FAICD – Managing Director
Timothy Robert Brown, BA, LLB, M.Fin, Post Grad Dip (Phil) (Alternate for R S Brown)
Company Secretary
Paul Samuel Freedman, BSc, CA, GAICD
Registered office and principal place of business
Ground Floor, 50 Colin Street
WEST PERTH WA 6005
Postal address: P.O. Box 788 West Perth WA 6872
Phone: (08) 9480 1500
Fax: (08) 9480 1599
Email: [email protected]
Website: www.cedarwoods.com.au
Share registry
Computershare Investor Services Pty Ltd
Level 11, 172 St Georges Terrace
PERTH WA 6000
Auditor
PricewaterhouseCoopers
125 St Georges Terrace
PERTH WA 6000
Securities exchange listing
Cedar Woods Properties Limited shares are listed on the Australian Securities Exchange (ASX)
ASX code: CWP
Annual general meeting
Venue: Kings Park Function Centre, Fraser Avenue, West Perth WA 6005
Time: 10.00am
Date: Monday 9 November 2015