Embed Size (px)
Citation preview
103:1937-1953, 2010. First published Jan 27, 2010; doi:10.1152/jn.00795.2009 J NeurophysiolCecilia G. Diniz Behn and Victoria Booth
You might find this additional information useful...
77 articles, 24 of which you can access free at: This article cites http://jn.physiology.org/cgi/content/full/103/4/1937#BIBL
including high-resolution figures, can be found at: Updated information and services http://jn.physiology.org/cgi/content/full/103/4/1937
can be found at: Journal of Neurophysiologyabout Additional material and information http://www.the-aps.org/publications/jn
This information is current as of July 28, 2010 .
http://www.the-aps.org/.American Physiological Society. ISSN: 0022-3077, ESSN: 1522-1598. Visit our website at (monthly) by the American Physiological Society, 9650 Rockville Pike, Bethesda MD 20814-3991. Copyright © 2010 by the
publishes original articles on the function of the nervous system. It is published 12 times a yearJournal of Neurophysiology
on July 28, 2010 jn.physiology.org
Dow
nloaded from
Simulating Microinjection Experiments in a Novel Model of the RatSleep-Wake Regulatory Network
Cecilia G. Diniz Behn1 and Victoria Booth1,2
1Departments of Mathematics and 2Anesthesiology, University of Michigan, Ann Arbor, Michigan
Submitted 25 August 2009; accepted in final form 22 January 2010
Diniz Behn CG, Booth V. Simulating microinjection experiments ina novel model of the rat sleep-wake regulatory network. J Neuro-physiol 103: 1937–1953, 2010. First published January 27, 2010;doi:10.1152/jn.00795.2009. This study presents a novel mathematicalmodeling framework that is uniquely suited to investigating thestructure and dynamics of the sleep-wake regulatory network in thebrain stem and hypothalamus. It is based on a population firing ratemodel formalism that is modified to explicitly include concentrationlevels of neurotransmitters released to postsynaptic populations. Us-ing this framework, interactions among primary brain stem andhypothalamic neuronal nuclei involved in rat sleep-wake regulation aremodeled. The model network captures realistic rat polyphasic sleep-wakebehavior consisting of wake, rapid eye movement (REM) sleep, andnon-REM (NREM) sleep states. Network dynamics include a cyclicpattern of NREM sleep, REM sleep, and wake states that is disrupted bysimulated variability of neurotransmitter release and external noise to thenetwork. Explicit modeling of neurotransmitter concentrations allows forsimulations of microinjections of neurotransmitter agonists and antago-nists into a key wake-promoting population, the locus coeruleus (LC).Effects of these simulated microinjections on sleep-wake states aretracked and compared with experimental observations. Agonist/antago-nist pairs, which are presumed to have opposing effects on LC activity,do not generally induce opposing effects on sleep-wake patterning be-cause of multiple mechanisms for LC activation in the network. Also,different agents, which are presumed to have parallel effects on LCactivity, do not induce parallel effects on sleep-wake patterning becauseof differences in the state dependence or independence of agonist andantagonist action. These simulation results highlight the utility of formalmathematical modeling for constraining conceptual models of the sleep-wake regulatory network.
I N T R O D U C T I O N
Studies of the brain stem and hypothalamic neuronal popu-lations involved in the regulation of sleep and wake statessuggest that changes in neurotransmitter levels play an impor-tant role in the initiation and maintenance of sleep-wakebehavior (see Lydic and Baghdoyan 2005, 2008 for review).For example, wakefulness is characterized by the expression ofhigh levels of noradrenaline by the locus coeruleus (LC),serotonin by the dorsal raphe (DR), and acetylcholine bypontine nuclei including the laterodorsal tegmentum (LDT)and the pendunculopontine tegmentum (PPT) through the as-cending reticular activation pathway to thalamocortical re-gions. In contrast, sleep states are generally characterized by areduction in the levels of all these neurotransmitters in higherbrain regions with the exception of acetylcholine which returnsto waking levels during rapid eye movement (REM) sleep.
The regulation of the expression of these neurotransmittersresults from modulation of activity in the associated neuronalnuclei by network interactions. Although the LC and DR areaccepted components of the sleep-wake network, recent ana-tomical and physiological studies have identified new brainstem and hypothalamic populations that may be involved in thenetwork and have proposed different versions of networkarchitecture (Saper et al. 2005). Network components involvedin the regulation of REM sleep have been of particular interest.The classical conceptual model has been one of cholinergicregulation of REM sleep, proposed by McCarley and Hobson(1975), wherein reciprocal interactions between monoaminer-gic REM-off populations and cholinergic REM-on pontinepopulations govern transitions between non-REM (NREM)and REM sleep. More recent studies have implicated a role forGABA in the control of REM sleep (Brown et al. 2008; Dattaand Maclean 2007; Lu et al. 2004; Luppi et al. 2006; Mallicket al. 2001; Sapin et al. 2009). However, the exact architectureof the regulatory network has not been completely determined.
We propose a mathematical modeling framework that isuniquely suited for investigating the structure and dynamics of thesleep-wake regulatory network. This framework is based on anovel population firing rate model formalism in which we modifythe traditional firing rate model formalism to explicitly includeneurotransmitter concentration variables reflecting the release oftransmitter to postsynaptic targets. The dynamics of neurotrans-mitter concentrations follow saturating expression profiles consis-tent with experimental observations. Coupling between popula-tions occurs as a result of transmitter concentration levels inpostsynaptic populations. In this formalism, time scales charac-teristic of specific neurotransmitter expression in postsynaptictargets or of postsynaptic receptor activation can be explicitlydistinguished. More importantly, experimental studies have ma-nipulated the neurotransmitter environments in specific nucleithrough targeted microinjection of transmitter agonists and antag-onists to probe the regulatory network. Our modeling formalismallows direct simulation of this type of experimental protocol.
The specific network structure of brain stem and hypothalamicnuclei that we consider is based on known neural pathways andneurotransmitter effects. It includes the mutual inhibitory interac-tion between wake-promoting nuclei in the brain stem and sleep-promoting nuclei in the hypothalamus that forms the basis of theconceptual flip-flop model for sleep generation (Saper et al. 2001).It also contains reciprocal interactions between pontine REM-promoting nuclei and wake-promoting nuclei, whose activityceases during REM sleep, similar to the reciprocal interactionmodel for REM regulation (Massaquoi and McCarley 1992;McCarley and Hobson 1975). The network structure is similar tothat used in other mathematical models of the sleep-wake regu-
Address for reprint requests and other correspondence: V. Booth, Dept. ofMathematics, Univ. of Michigan, 2074 East Hall, 530 Church St., Ann Arbor,MI 48109 (E-mail: [email protected]).
J Neurophysiol 103: 1937–1953, 2010.First published January 27, 2010; doi:10.1152/jn.00795.2009.
19370022-3077/10 $8.00 Copyright © 2010 The American Physiological Societywww.jn.org
on July 28, 2010 jn.physiology.org
Dow
nloaded from
latory network (Diniz Behn et al. 2007; Phillips and Robinson2007; Tamakawa et al. 2006) and focuses on primary mecha-nisms. However, this structure is not comprehensive, and someneurotransmitters and neuropeptides involved in modulatingsleep-wake behavior, such as orexin/hypocretin and dopamine(Dzirasa et al. 2006; Nakamura et al. 2000; Peyron et al. 1998;Rye and Jankovic 2002; Thannickal et al. 2000), are not included.We analyze how this network structure can account for typical ratsleep-wake patterning and describe how specific components ofthe structure support interaction dynamics consistent with exper-imental observations.
To probe network structure and dynamics, we simulate micro-injections of neurotransmitter agonists and antagonists into oneneuronal nucleus, namely the LC, and analyze effects on sleep-wake patterning. We particularly study whether agonist/antagonistpairs, which are presumed to have opposing effects on LC activ-ity, generally induce opposing effects on sleep-wake patterning inthe network. Experimental results suggest that opposing effectsare obtained for some sleep-wake states, such as waking or REMsleep (Mallick et al. 2001), but trends are not as clear for all sleepstates, particularly because many studies report only on percenttime spent in specific states rather than on details of sleep micro-architecture. A focus of our simulations of these experiments is totrack effects on all states and analyze indirect effects of manipu-lations of just one population that are propagated through thenetwork to impact activation of other nuclei and resultant pattern-ing of all sleep-wake states. We also analyze if different agents,which are presumed to have parallel effects on activity of a givennucleus, induce parallel effects on network dynamics and sleep-wake patterning. For example, GABA agonists and cholinergicantagonists have both been shown to attenuate LC activity (Ennisand Shipley 1992; Osmanovic and Shefner 1990); however,experimental studies have suggested that each has a differenteffect on sleep states (Mallick et al. 2001). We analyze oursimulation results to determine specific actions of each agent andelucidate the differences in effects of parallel agents.
M E T H O D S
We first generally describe the formalism of our novel firing ratemodel and how microinjection of neurotransmitter agonists and an-tagonists can be simulated. We then describe the model of thesleep-wake regulatory network constructed with this formalism. Thecomplete equations and parameter values for the sleep-wake networkmodel are given in the APPENDIX.
Firing rate model formalism
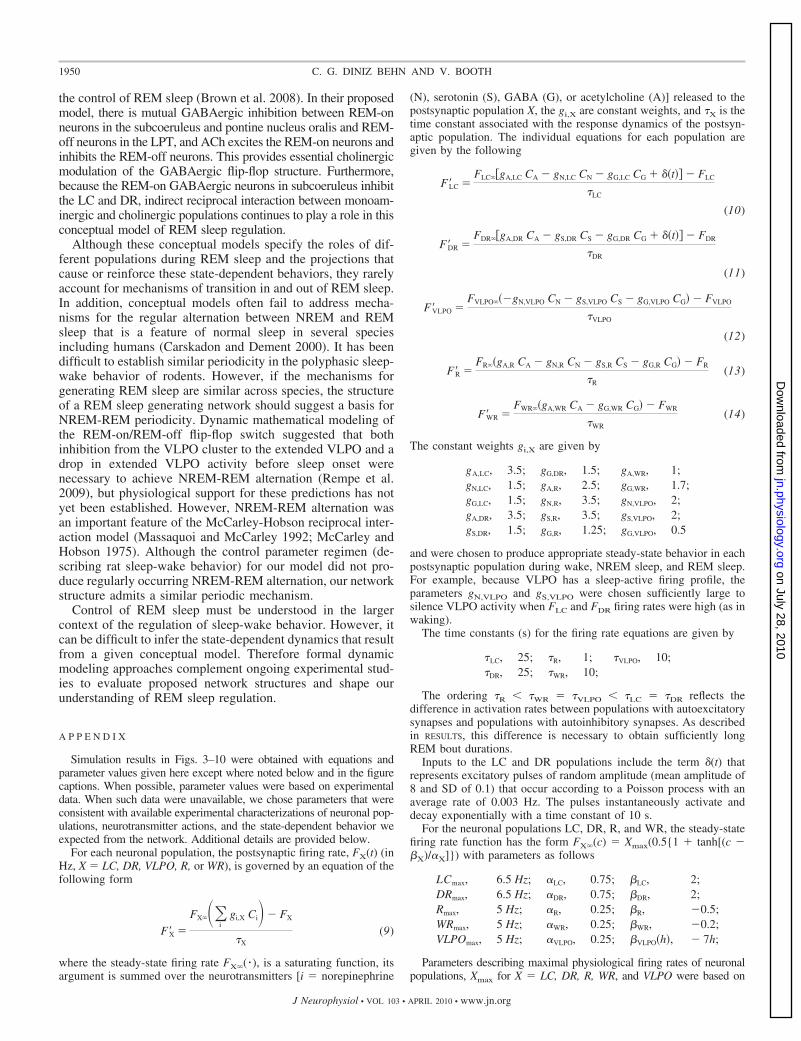
We propose a novel firing rate model formalism for the interactionof neuronal populations that explicitly includes neurotransmitter con-centrations released by presynaptic populations. The dynamics ofneurotransmitter concentrations drive the response of postsynapticpopulations (Fig. 1A).
Standard firing rate models provide a formalism for determining therelationships between activity of presynaptic populations, total syn-aptic input to a postsynaptic population, and the resulting postsynapticfiring rate (Deco et al. 2008; Wilson and Cowan 1972; see reviews inDayan and Abbott 2001; Deco et al. 2008; Ermentrout 1998). Typi-cally, the total synaptic input is determined by a weighted sum of thepresynaptic firing rates, and the firing rate of the postsynaptic popu-lation evolves to a nonlinear function of the total synaptic input withsome characteristic time constant. In our model, we retain this basicformalism but replace total synaptic input with a weighted sum of
neurotransmitter concentrations released by presynaptic populations,Ci(t), where the subscript i allows for multiple neurotransmitters. Inthis way, firing rate in a postsynaptic population X, FX(t), is modeledby the standard equation of the following form
F�X �
FX���i
gi,X Ci� � FX
�X
(1)
where the steady-state firing rate Fx�( � ) is a saturating function, thegi,X are constant weights, and �X is the time constant associated withthe response of the postsynaptic population. For the steady-state firingrate function, we use the standard sigmoidal function
FX��c� � Xmax �0.5�1 � tanh��c � �X�/�X���) (2)
characterized by parameters Xmax, �X, and �X (Fig. 1B). This functionalform ensures that sufficient release of inhibitory neurotransmitters si-lences the population and excessive release of excitatory neurotransmit-ters causes firing to saturate at a maximal rate, Xmax. Intrinsic populationproperties such as excitability of individual neurons and local connectiv-ity can be used to determine the parameters governing the slope of thesigmoid (�X) and the activation threshold (�X).
Neurotransmitter concentration, Ci(t), depends on the firing rate ofthe presynaptic population, generically referred to as FY(t). In ourformalism, Ci(t) evolves to a nonlinear function of FY(t) as describedby the following equation
C�i �Ci��FY� � Ci
�i
(3)
where steady-state neurotransmitter release, Ci�( � ), is a saturatingfunction and �i is the associated time constant. Because differentmicrodialysis techniques lead to differences in absolute reportedneurotransmitter concentrations, we normalize each neurotransmitterconcentration between 0 and 1. The functional form of Ci�( � ),Ci�(f) tanh(f/�i), prescribes the relationship between presynapticfiring rate and neurotransmitter release, and the shape of this functionwas chosen to be consistent with experimental data (Aston-Jones andBloom 1981; Lydic and Baghdoyan 1993) (Fig. 1C). In particular,neurotransmitter concentration increases monotonically with presyn-aptic firing rate and approaches a saturating level (normalized to 1) atmaximum firing rate. The time scale described by �i reflects the timedynamics associated with neurotransmitter release at the level of thepopulation rather than at an individual synapse. The temporal resolu-tion of current microdialysis techniques does not allow direct mea-surement of �i. However, recent results using voltammetric techniqueshave shown that the rate constants for release and clearance of evokeddopamine are on the order of seconds (Garris and Wightman 1994),and we chose values for �i to be consistent with this result.
In a network model, all coupling between populations is mediatedthrough neurotransmitter concentrations: Ci�( � ) describes how firingactivity in the presynaptic population results in production of neuro-transmitter, and FX�( � ) determines how neurotransmitter levels affectactivity in the postsynaptic population. By explicitly modeling thedynamics of each neurotransmitter, the formalism allows for distincttime scales associated with the release of each neurotransmitter orwith specific postsynaptic receptor dynamics. This contrasts withmany firing rate model formalisms in which the dynamics of inputsfrom all presynaptic sources are described by a single time constant(Dayan and Abbott 2001; Deco et al. 2008; Phillips and Robinson2007, 2008; Wilson and Cowan 1972). A more detailed comparison ofour formalism with other firing rate models is provided in theDISCUSSION.
Neurotransmitter release is correlated with, but not determined by,the firing rate of the presynaptic population, and variability of releasegrows with concentration level (Aston-Jones and Bloom 1981). This
1938 C. G. DINIZ BEHN AND V. BOOTH
J Neurophysiol • VOL 103 • APRIL 2010 • www.jn.org
on July 28, 2010 jn.physiology.org
Dow
nloaded from
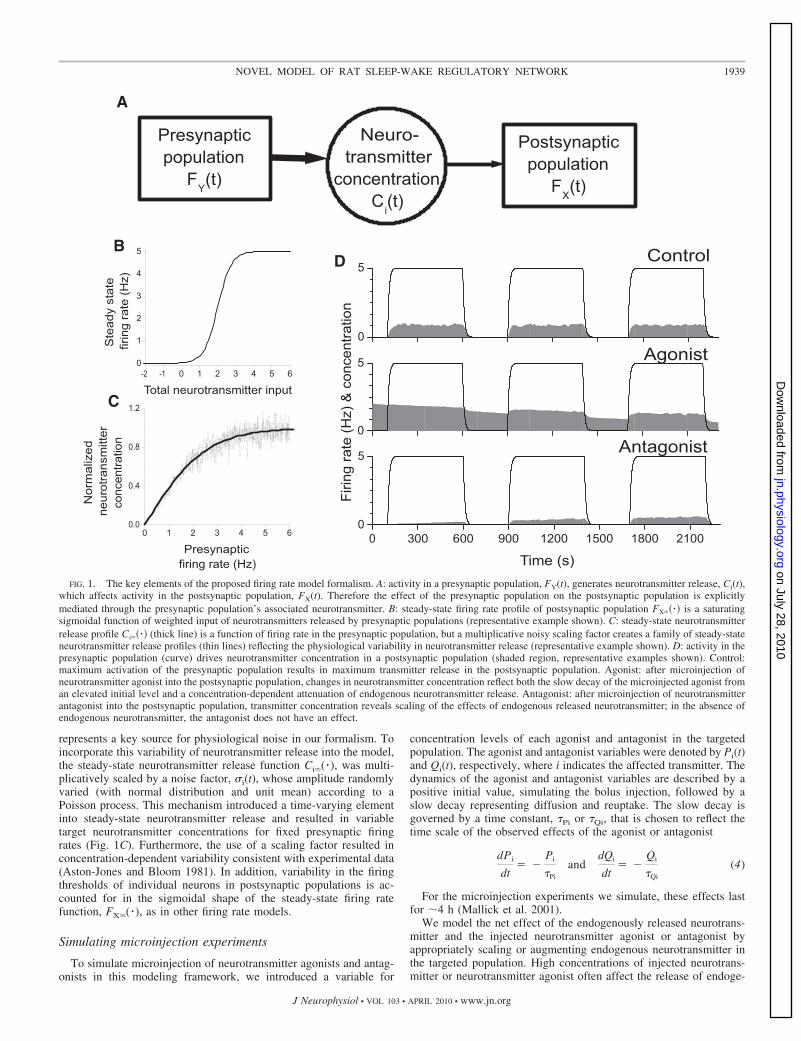
represents a key source for physiological noise in our formalism. Toincorporate this variability of neurotransmitter release into the model,the steady-state neurotransmitter release function Ci�( � ), was multi-plicatively scaled by a noise factor, �i(t), whose amplitude randomlyvaried (with normal distribution and unit mean) according to aPoisson process. This mechanism introduced a time-varying elementinto steady-state neurotransmitter release and resulted in variabletarget neurotransmitter concentrations for fixed presynaptic firingrates (Fig. 1C). Furthermore, the use of a scaling factor resulted inconcentration-dependent variability consistent with experimental data(Aston-Jones and Bloom 1981). In addition, variability in the firingthresholds of individual neurons in postsynaptic populations is ac-counted for in the sigmoidal shape of the steady-state firing ratefunction, FX�( � ), as in other firing rate models.
Simulating microinjection experiments
To simulate microinjection of neurotransmitter agonists and antag-onists in this modeling framework, we introduced a variable for
concentration levels of each agonist and antagonist in the targetedpopulation. The agonist and antagonist variables were denoted by Pi(t)and Qi(t), respectively, where i indicates the affected transmitter. Thedynamics of the agonist and antagonist variables are described by apositive initial value, simulating the bolus injection, followed by aslow decay representing diffusion and reuptake. The slow decay isgoverned by a time constant, �Pi or �Qi, that is chosen to reflect thetime scale of the observed effects of the agonist or antagonist
dPi
dt� �
Pi
�Pi
anddQi
dt� �
Qi
�Qi
(4)
For the microinjection experiments we simulate, these effects lastfor 4 h (Mallick et al. 2001).
We model the net effect of the endogenously released neurotrans-mitter and the injected neurotransmitter agonist or antagonist byappropriately scaling or augmenting endogenous neurotransmitter inthe targeted population. High concentrations of injected neurotrans-mitter or neurotransmitter agonist often affect the release of endoge-
Antagonist
Agonist
Control
0
5
0
5
0 300 600 900 1200 1500 1800 21000
5
Firin
g ra
te (H
z) &
con
cent
ratio
n
Time (s)
A
Neuro-transmitter
concentrationC
i(t)
Postsynapticpopulation
FX(t)
Presynapticpopulation
FY(t)
D
C
B
0 1 2 3 4 5 60.0
0.4
0.8
1.2
Nor
mal
ized
neur
otra
nsm
itter
conc
entra
tion
Presynapticfiring rate (Hz)
-2 -1 0 1 2 3 4 5 60
1
2
3
4
5
Ste
ady
stat
e fir
ing
rate
(Hz)
Total neurotransmitter input
FIG. 1. The key elements of the proposed firing rate model formalism. A: activity in a presynaptic population, FY(t), generates neurotransmitter release, Ci(t),which affects activity in the postsynaptic population, FX(t). Therefore the effect of the presynaptic population on the postsynaptic population is explicitlymediated through the presynaptic population’s associated neurotransmitter. B: steady-state firing rate profile of postsynaptic population FX�� �� is a saturatingsigmoidal function of weighted input of neurotransmitters released by presynaptic populations (representative example shown). C: steady-state neurotransmitterrelease profile Ci�� �� (thick line) is a function of firing rate in the presynaptic population, but a multiplicative noisy scaling factor creates a family of steady-stateneurotransmitter release profiles (thin lines) reflecting the physiological variability in neurotransmitter release (representative example shown). D: activity in thepresynaptic population (curve) drives neurotransmitter concentration in a postsynaptic population (shaded region, representative examples shown). Control:maximum activation of the presynaptic population results in maximum transmitter release in the postsynaptic population. Agonist: after microinjection ofneurotransmitter agonist into the postsynaptic population, changes in neurotransmitter concentration reflect both the slow decay of the microinjected agonist froman elevated initial level and a concentration-dependent attenuation of endogenous neurotransmitter release. Antagonist: after microinjection of neurotransmitterantagonist into the postsynaptic population, transmitter concentration reveals scaling of the effects of endogenous released neurotransmitter; in the absence ofendogenous neurotransmitter, the antagonist does not have an effect.
1939NOVEL MODEL OF RAT SLEEP-WAKE REGULATORY NETWORK
J Neurophysiol • VOL 103 • APRIL 2010 • www.jn.org
on July 28, 2010 jn.physiology.org
Dow
nloaded from

nous neurotransmitter (Kalsner 1990; Starke et al. 1989). To reflectthis interaction in agonist microinjection simulations, we replace thevariable for endogeneous neurotransmitter concentration as releasedby the presynaptic population, Ci(t), in the targeted population X withthe following expression
Ci(X)�t� � mi�t�Ci�t� � Pi�t� (5)
The scaling factor mi(t) reflects the effect of the agonist on trans-mitter release. It is set to 1 if Pi levels are low (less than a specifiedminimum value) but, for higher Pi levels, it increases from 0 to 1 asPi decreases from a maximum initial value (Fig. 1D, middle).
To capture the decrease in the effects of endogenous neurotrans-mitter caused by microinjection of an antagonist, we replace thevariable for endogeneous neurotransmitter concentration, Ci(t), in thetarget population X with a value scaled by the level of antagonist
Ci(X)�t� � �1 � Qi�t��Ci�t� (6)
As Qi decays to 0, transmitter concentration in the target popula-tion, Ci(X), regains the full level of transmitter released by thepresynaptic population, Ci(t) (Fig. 1D, bottom).
Applying the neurotransmitter model formalism to asleep-wake regulatory network
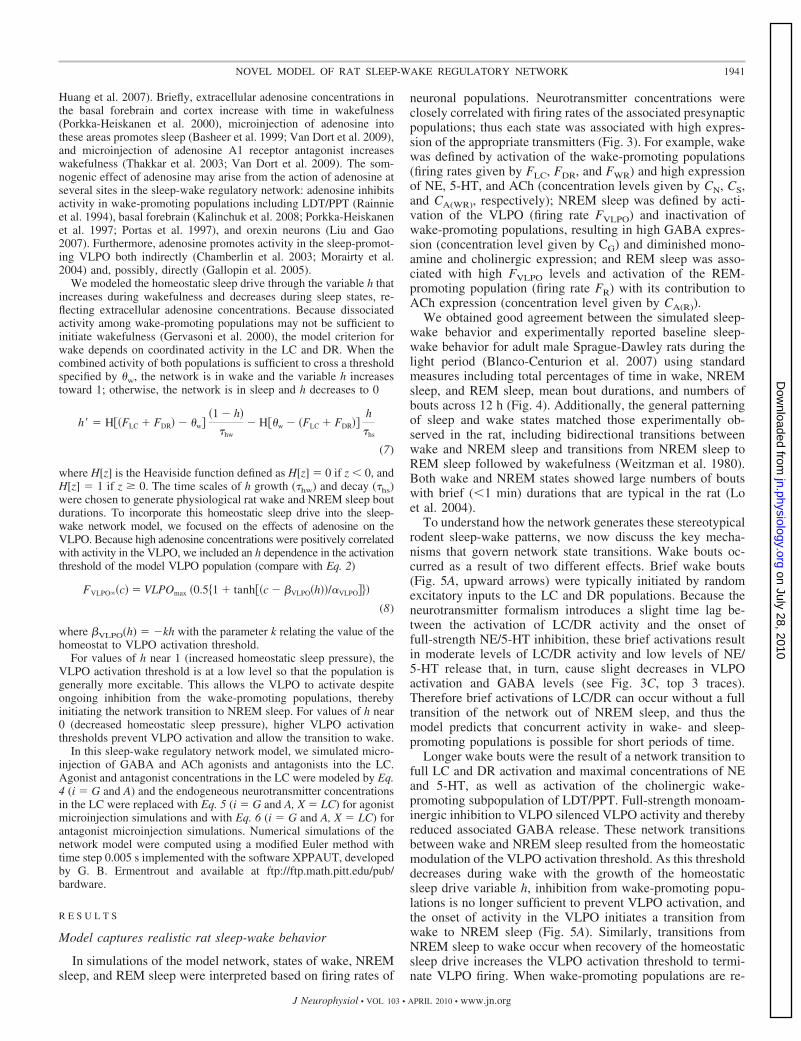
Using the firing rate model formalism described above, we con-structed a model of the rodent sleep-wake regulatory network (Fig. 2).This formalism is well suited to model neural regulation of sleep-wake behavior because specific patterns of spike timing in the con-stituent neuronal populations seem to be less important in supportingeach behavioral state compared with the overall profiles of populationactivity and resultant neurotransmitter release. The structure of thenetwork model was based on experimental characterization of therelevant anatomy and physiology (see Saper et al. 2005 for review).The network included wake-promoting, sleep-promoting, and REMsleep-promoting neuronal populations and their associated neurotrans-mitters (Table 1).
Firing rates of each population, FX(t) (in Hz, X LC, DR, VLPO,R, or WR) are governed by equations of the form given in Eq. 1 andthe concentrations of neurotransmitter released by each population,Ci(t) are described by equations of the form given in Eq. 3 [i N (NE)for Y LC; i S (5-HT) for Y DR; i G (GABA) for Y VLPO;i A(R) (ACh) for Y R; and i A(WR) (ACh) for Y WR]. Whenpossible, the parameter values in the model were based on experi-mental data (see APPENDIX for details).
The neurotransmitter-mediated coupling between populations in-cluded in the model network is based on established anatomy andphysiology. Briefly, the monoaminergic wake-promoting populations,LC and DR, inhibit both the sleep-promoting VLPO and the REM-active subpopulation of the LDT/PPT, but not the wake/REM activeLDT/PPT subpopulation (Thakkar et al. 1998). On the other hand, thesleep-promoting VLPO inhibits all wake-promoting and REM-pro-moting populations. The cholinergic REM- and wake/REM-activepopulations excite the LC and DR. These interactions are reflected inthe terms included in the argument, �igi,XCi, of the steady-state firingrate functions, FX�( � ), for each population.
Within this network structure, specific subcomponents reflect concep-tual models of the interaction of these populations that are current in theliterature. Specifically, mutual inhibition between the monoaminergicwake-promoting populations (LC and DR) and the GABAergic sleep-promoting population (VLPO) provides the basis for the conceptualsleep-wake flip-flop switch (Saper et al. 2001) that is thought to be thegenerative mechanism for production of and transitions between NREMsleep and wake. Additionally, reciprocal connectivity between monoam-inergic wake-promoting populations (LC and DR) and cholinergic REM-promoting populations (LDT/PPT) reflects the reciprocal interactionhypothesis of NREM-REM cycling (Massaquoi and McCarley 1992;McCarley and Hobson 1975). The LC, DR, and VLPO are modeled asself-inhibitory while self-excitatory projections are included in the cho-linergic REM- and wake-promoting subpopulations of the LDT/PPT.This self-excitation reflects the glutamatergic positive feedback projec-tion to the LDT/PPT via the pontine reticular formation (reviewed inDatta and Maclean 2007). In addition, random excitatory inputs to thewake-promoting populations (LC and DR) were included to simulateactivity of top-down excitatory projections from thalamocortical circuits(Arnsten and Goldman-Rakic 1984; Jodo et al. 1998).
Homeostatic sleep drive h
The concept of a homeostatic sleep drive was formalized with thedesignation of “Process S” in the two process model of sleep regula-tion (Borbely 1982; Borbely and Achermann 1999). Process S de-scribes a drive to sleep that increases during time awake and decreasesduring sleep. Although the biological substrate of homeostatic sleepdrive probably involves multiple mechanisms, the neuromodulatoradenosine is one important element (reviewed in Basheer et al. 2004;
5
t
FIG. 2. Schematic of the model sleep-wake regulatory network (summa-rized in Table 1) shows interactions between wake-, non–rapid eye movement(NREM)-, and REM-promoting neuronal populations (rectangles) mediatedthrough their associated neurotransmitters (circles). The homeostatic sleepdrive h (yellow triangle) represents adenosinergic modulation of baselineactivity in the sleep-promoting ventrolateral preoptic nucleus (VLPO). Inaddition, synaptic input from thalamocortical networks to locus coeruleus (LC)and dorsal raphe (DR) (teal arrows) are modeled with random excitatoryinputs.
TABLE 1. Summary of the wake-, sleep-, and REM-sleeppromoting neuronal populations and associated neurotransmittersincluded in the model network
Population Neurotransmitter
Wake-promoting Dorsal raphe (DR) Serotonin (5-HT)Locus coeruleus (LC) Noradrenaline (NE)Wake/REM active subpopulations
(WR) of laterodorsal tegmentalnucleus and pedunculopontinetegmental nucleus (LDT/PPT)
Acetylcholine (ACh)
Sleep-promoting Ventrolateral preoptic area(VLPO)
GABA
REM-promoting REM active subpopulation (R) ofLDT/PPT
Acetylcholine (ACh)
1940 C. G. DINIZ BEHN AND V. BOOTH
J Neurophysiol • VOL 103 • APRIL 2010 • www.jn.org
on July 28, 2010 jn.physiology.org
Dow
nloaded from
Huang et al. 2007). Briefly, extracellular adenosine concentrations inthe basal forebrain and cortex increase with time in wakefulness(Porkka-Heiskanen et al. 2000), microinjection of adenosine intothese areas promotes sleep (Basheer et al. 1999; Van Dort et al. 2009),and microinjection of adenosine A1 receptor antagonist increaseswakefulness (Thakkar et al. 2003; Van Dort et al. 2009). The som-nogenic effect of adenosine may arise from the action of adenosine atseveral sites in the sleep-wake regulatory network: adenosine inhibitsactivity in wake-promoting populations including LDT/PPT (Rainnieet al. 1994), basal forebrain (Kalinchuk et al. 2008; Porkka-Heiskanenet al. 1997; Portas et al. 1997), and orexin neurons (Liu and Gao2007). Furthermore, adenosine promotes activity in the sleep-promot-ing VLPO both indirectly (Chamberlin et al. 2003; Morairty et al.2004) and, possibly, directly (Gallopin et al. 2005).
We modeled the homeostatic sleep drive through the variable h thatincreases during wakefulness and decreases during sleep states, re-flecting extracellular adenosine concentrations. Because dissociatedactivity among wake-promoting populations may not be sufficient toinitiate wakefulness (Gervasoni et al. 2000), the model criterion forwake depends on coordinated activity in the LC and DR. When thecombined activity of both populations is sufficient to cross a thresholdspecified by w, the network is in wake and the variable h increasestoward 1; otherwise, the network is in sleep and h decreases to 0
h� � H��FLC � FDR� � w��1 � h�
�hw
� H�w � �FLC � FDR��h
�hs
(7)
where H[z] is the Heaviside function defined as H[z] 0 if z � 0, andH[z] 1 if z 0. The time scales of h growth (�hw) and decay (�hs)were chosen to generate physiological rat wake and NREM sleep boutdurations. To incorporate this homeostatic sleep drive into the sleep-wake network model, we focused on the effects of adenosine on theVLPO. Because high adenosine concentrations were positively correlatedwith activity in the VLPO, we included an h dependence in the activationthreshold of the model VLPO population (compare with Eq. 2)
FVLPO��c� � VLPOmax �0.5�1 � tanh��c � �VLPO�h��/�VLPO���
(8)
where �VLPO(h) �kh with the parameter k relating the value of thehomeostat to VLPO activation threshold.
For values of h near 1 (increased homeostatic sleep pressure), theVLPO activation threshold is at a low level so that the population isgenerally more excitable. This allows the VLPO to activate despiteongoing inhibition from the wake-promoting populations, therebyinitiating the network transition to NREM sleep. For values of h near0 (decreased homeostatic sleep pressure), higher VLPO activationthresholds prevent VLPO activation and allow the transition to wake.
In this sleep-wake regulatory network model, we simulated micro-injection of GABA and ACh agonists and antagonists into the LC.Agonist and antagonist concentrations in the LC were modeled by Eq.4 (i G and A) and the endogeneous neurotransmitter concentrationsin the LC were replaced with Eq. 5 (i G and A, X LC) for agonistmicroinjection simulations and with Eq. 6 (i G and A, X LC) forantagonist microinjection simulations. Numerical simulations of thenetwork model were computed using a modified Euler method withtime step 0.005 s implemented with the software XPPAUT, developedby G. B. Ermentrout and available at ftp://ftp.math.pitt.edu/pub/bardware.
R E S U L T S
Model captures realistic rat sleep-wake behavior
In simulations of the model network, states of wake, NREMsleep, and REM sleep were interpreted based on firing rates of
neuronal populations. Neurotransmitter concentrations wereclosely correlated with firing rates of the associated presynapticpopulations; thus each state was associated with high expres-sion of the appropriate transmitters (Fig. 3). For example, wakewas defined by activation of the wake-promoting populations(firing rates given by FLC, FDR, and FWR) and high expressionof NE, 5-HT, and ACh (concentration levels given by CN, CS,and CA(WR), respectively); NREM sleep was defined by acti-vation of the VLPO (firing rate FVLPO) and inactivation ofwake-promoting populations, resulting in high GABA expres-sion (concentration level given by CG) and diminished mono-amine and cholinergic expression; and REM sleep was asso-ciated with high FVLPO levels and activation of the REM-promoting population (firing rate FR) with its contribution toACh expression (concentration level given by CA(R)).
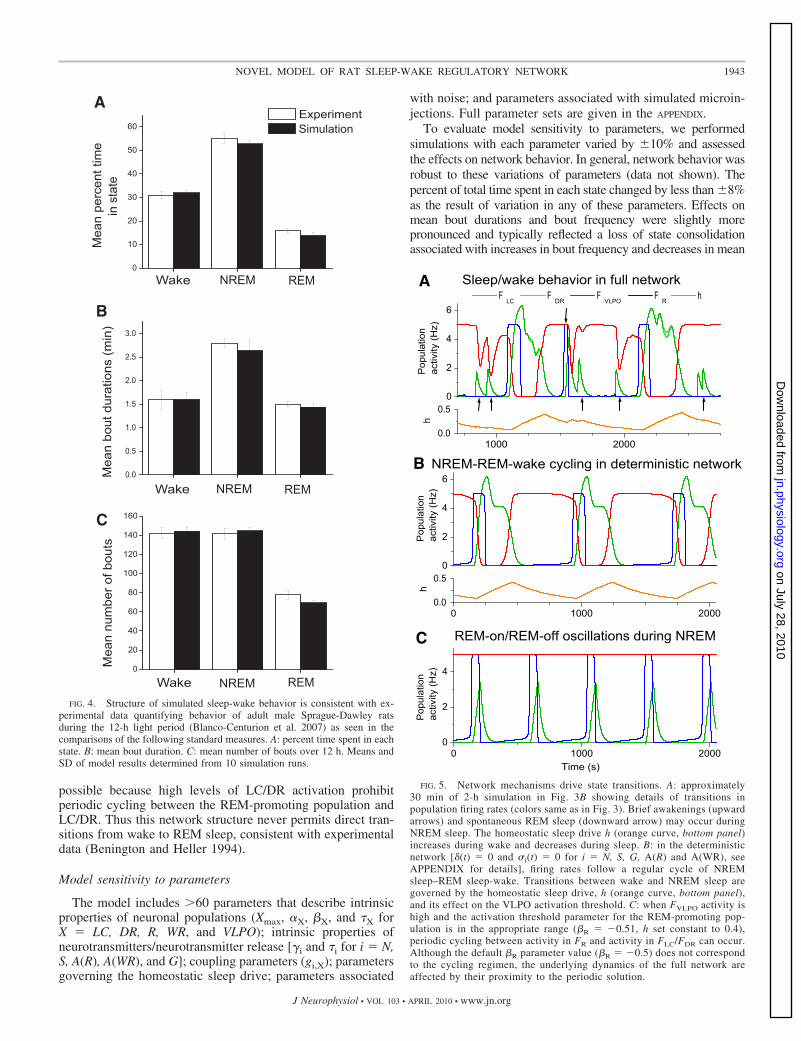
We obtained good agreement between the simulated sleep-wake behavior and experimentally reported baseline sleep-wake behavior for adult male Sprague-Dawley rats during thelight period (Blanco-Centurion et al. 2007) using standardmeasures including total percentages of time in wake, NREMsleep, and REM sleep, mean bout durations, and numbers ofbouts across 12 h (Fig. 4). Additionally, the general patterningof sleep and wake states matched those experimentally ob-served in the rat, including bidirectional transitions betweenwake and NREM sleep and transitions from NREM sleep toREM sleep followed by wakefulness (Weitzman et al. 1980).Both wake and NREM states showed large numbers of boutswith brief (�1 min) durations that are typical in the rat (Loet al. 2004).
To understand how the network generates these stereotypicalrodent sleep-wake patterns, we now discuss the key mecha-nisms that govern network state transitions. Wake bouts oc-curred as a result of two different effects. Brief wake bouts(Fig. 5A, upward arrows) were typically initiated by randomexcitatory inputs to the LC and DR populations. Because theneurotransmitter formalism introduces a slight time lag be-tween the activation of LC/DR activity and the onset offull-strength NE/5-HT inhibition, these brief activations resultin moderate levels of LC/DR activity and low levels of NE/5-HT release that, in turn, cause slight decreases in VLPOactivation and GABA levels (see Fig. 3C, top 3 traces).Therefore brief activations of LC/DR can occur without a fulltransition of the network out of NREM sleep, and thus themodel predicts that concurrent activity in wake- and sleep-promoting populations is possible for short periods of time.
Longer wake bouts were the result of a network transition tofull LC and DR activation and maximal concentrations of NEand 5-HT, as well as activation of the cholinergic wake-promoting subpopulation of LDT/PPT. Full-strength monoam-inergic inhibition to VLPO silenced VLPO activity and therebyreduced associated GABA release. These network transitionsbetween wake and NREM sleep resulted from the homeostaticmodulation of the VLPO activation threshold. As this thresholddecreases during wake with the growth of the homeostaticsleep drive variable h, inhibition from wake-promoting popu-lations is no longer sufficient to prevent VLPO activation, andthe onset of activity in the VLPO initiates a transition fromwake to NREM sleep (Fig. 5A). Similarly, transitions fromNREM sleep to wake occur when recovery of the homeostaticsleep drive increases the VLPO activation threshold to termi-nate VLPO firing. When wake-promoting populations are re-
1941NOVEL MODEL OF RAT SLEEP-WAKE REGULATORY NETWORK
J Neurophysiol • VOL 103 • APRIL 2010 • www.jn.org
on July 28, 2010 jn.physiology.org
Dow
nloaded from

leased from inhibition, the network transitions from NREMsleep to wake. This transition mechanism is consistent with thesleep-wake flip-flop conceptual model (Saper et al. 2001). Inour model, this transition usually involves activation of thecholinergic REM-on population; thus the transition sequence isNREM sleep to REM sleep to wake.
Two separate mechanisms may initiate a transition fromNREM sleep to REM sleep. One mechanism depends on thehomeostatically driven transition from NREM sleep to wake.We can understand the details of this transition by consideringnetwork behavior in the absence of noisy components. In thedeterministic network during the NREM state, activity in thesleep-promoting VLPO decreases as the homeostatic sleepdrive recovers. The attenuation of VLPO inhibition to theREM-promoting LDT/PPT populations allows them to activateand initiate REM sleep. The combination of reduced inhibitionfrom VLPO and increased excitation from LDT/PPT causeswake-promoting LC/DR to activate, thereby terminating theREM bout. This stereotypical and homeostatically driven pat-tern of NREM–REM-wake cycling corresponds to a stableperiodic solution of the deterministic network (Fig. 5B) and isgenerally preserved in the noisy system.
The reliable activation of the REM-promoting population atthe NREM sleep to wake transition is an inherent feature of thenetwork structure. Periodic cycling in activation of the REM-promoting population, and LC and DR, similar to REM-on/
REM-off oscillations in the reciprocal interaction model forREM sleep cycling (Massaquoi and McCarley 1992; McCarleyand Hobson 1975), can occur in the network, but is notobtained for our default parameter values. The existence of thiscycling pattern depends on the activation threshold of theREM-promoting population: cycling appears for low values ofthe threshold but not at higher values (Fig. 5C). While thedefault activation threshold does not permit this periodic cy-cling, the model trajectory is influenced by proximity to theperiodic solution during the network transition from NREMsleep to wake. Therefore the REM-promoting population acti-vates transiently despite ongoing inhibition as decreasingGABAergic inhibition from the VLPO is replaced by increas-ing monoaminergic inhibition from LC and DR.
The second mechanism for REM sleep initiation is related tonoise in the network. Variability of neurotransmitter releaseresults in varying levels of inhibition to and self-excitation bythe REM-promoting population. If, during the NREM state,higher ACh release from the LDT/PPT populations is com-bined with lower levels of GABAergic inhibition, the modeltrajectory can be transiently attracted to the periodic REM-on/REM-off cycle described above (Fig. 5A, downward arrow).The wake bout after these spontaneous REM bouts is typicallybrief, and, while VLPO activation may be slightly inhibited,the network rarely transitions out of NREM sleep. During thewake state, this mechanism for REM sleep initiation is not
C
B
A
Time (s)
FWR
CA(WR)
FR
CA(R)
FVLPO
CG
FDR
CS
FLC
CN
Pop
ulat
ion
Act
ivity
(Hz)
REM
NREM
Wake
0 1200 2400 3600 4800 6000 72000
6
0 1200 2400 3600 4800 6000 72000
6
FIG. 3. Network model simulates rat sleep-wake behavior.A: hypnogram summarizing 2 h of simulated rat sleep-wakebehavior (corresponding to data from the light period).B: state-dependent firing rates in wake-promoting populationsLC (FLC, light green) and DR (FDR, dark green), NREM-promoting population VLPO (FVLPO, red), REM- promotingpopulation (FR, blue), and wake/REM-promoting population(FWR, light blue) determine the sleep-wake state recorded in thehypnogram. C: neurotransmitter concentrations Ci [i N (NE),S (5-HT), G (GABA), A(R) (ACh expressed by REM-promot-ing population), and A(WR) (ACh expressed by wake/REM-promoting population)], shaded regions, track firing rates (inHz, curves) in each associated presynaptic neuronal population(colors same as in B, see APPENDIX for parameter values).
1942 C. G. DINIZ BEHN AND V. BOOTH
J Neurophysiol • VOL 103 • APRIL 2010 • www.jn.org
on July 28, 2010 jn.physiology.org
Dow
nloaded from
possible because high levels of LC/DR activation prohibitperiodic cycling between the REM-promoting population andLC/DR. Thus this network structure never permits direct tran-sitions from wake to REM sleep, consistent with experimentaldata (Benington and Heller 1994).
Model sensitivity to parameters
The model includes 60 parameters that describe intrinsicproperties of neuronal populations (Xmax, �X, �X, and �X forX LC, DR, R, WR, and VLPO); intrinsic properties ofneurotransmitters/neurotransmitter release [�i and �i for i N,S, A(R), A(WR), and G]; coupling parameters (gi,X); parametersgoverning the homeostatic sleep drive; parameters associated
with noise; and parameters associated with simulated microin-jections. Full parameter sets are given in the APPENDIX.
To evaluate model sensitivity to parameters, we performedsimulations with each parameter varied by �10% and assessedthe effects on network behavior. In general, network behavior wasrobust to these variations of parameters (data not shown). Thepercent of total time spent in each state changed by less than �8%as the result of variation in any of these parameters. Effects onmean bout durations and bout frequency were slightly morepronounced and typically reflected a loss of state consolidationassociated with increases in bout frequency and decreases in mean
C
B
A
hh
Pop
ulat
ion
activ
ity (H
z)P
opul
atio
nac
tivity
(Hz)
Pop
ulat
ion
activ
ity (H
z)
Time (s)
REM-on/REM-off oscillations during NREM
NREM-REM-wake cycling in deterministic network
Sleep/wake behavior in full network
0 1000 20000
2
4
0
2
4
6
0 1000 20000.0
0.5
0
2
4
6
1000 20000.0
0.5
FLC
FDR
FVLPO
FR
h
FIG. 5. Network mechanisms drive state transitions. A: approximately30 min of 2-h simulation in Fig. 3B showing details of transitions inpopulation firing rates (colors same as in Fig. 3). Brief awakenings (upwardarrows) and spontaneous REM sleep (downward arrow) may occur duringNREM sleep. The homeostatic sleep drive h (orange curve, bottom panel)increases during wake and decreases during sleep. B: in the deterministicnetwork [�(t) 0 and �i(t) 0 for i N, S, G, A(R) and A(WR), seeAPPENDIX for details], firing rates follow a regular cycle of NREMsleep–REM sleep-wake. Transitions between wake and NREM sleep aregoverned by the homeostatic sleep drive, h (orange curve, bottom panel),and its effect on the VLPO activation threshold. C: when FVLPO activity ishigh and the activation threshold parameter for the REM-promoting pop-ulation is in the appropriate range (�R �0.51, h set constant to 0.4),periodic cycling between activity in FR and activity in FLC/FDR can occur.Although the default �R parameter value (�R �0.5) does not correspondto the cycling regimen, the underlying dynamics of the full network areaffected by their proximity to the periodic solution.
C
B
A
REMNREMWake
Mea
n pe
rcen
t tim
ein
sta
te
REMNREMWake
Mea
n nu
mbe
r of b
outs
REMNREMWake
Mea
n bo
ut d
urat
ions
(min
)
0
20
40
60
80
100
120
140
160
0.0
0.5
1.0
1.5
2.0
2.5
3.0
0
10
20
30
40
50
60 Experiment Simulation
FIG. 4. Structure of simulated sleep-wake behavior is consistent with ex-perimental data quantifying behavior of adult male Sprague-Dawley ratsduring the 12-h light period (Blanco-Centurion et al. 2007) as seen in thecomparisons of the following standard measures. A: percent time spent in eachstate. B: mean bout duration. C: mean number of bouts over 12 h. Means andSD of model results determined from 10 simulation runs.
1943NOVEL MODEL OF RAT SLEEP-WAKE REGULATORY NETWORK
J Neurophysiol • VOL 103 • APRIL 2010 • www.jn.org
on July 28, 2010 jn.physiology.org
Dow
nloaded from

bout durations. Interestingly, increasing/decreasing a parameterdid not necessarily result in reciprocal effects: often, both varia-tions promoted fragmentation of behavioral states.
In addition to general parameter sensitivity, we investigatedthe importance of relative magnitudes among some sets ofparameters. These relative differences often reflected physio-logical features of neuronal populations or neurotransmitteractions. For example, the ordering �A(R) �A(WR) �G ��N �S reflects the faster action of ionotropic neurotransmit-ters ACh and GABA compared with the action of metabotropicNE and 5-HT (Destexhe et al. 1994). To determine the impor-tance of these relative orderings, we ran simulations in whichdifferences in intrinsic properties and differences in dynamicswere systematically eliminated from modeled populations andneurotransmitters, respectively. To equalize population param-eters, the slopes for the neuronal population steady-state func-tions were set to reflect fast (�X 0.25) or slow (�X 0.75)activation. To equalize parameters for time dynamics, the timeconstants for neuronal populations and neurotransmitter con-centration were set to fast (�X �i 10 s) or slow scales(�X �i 25 s).
When representative parameters were used to ascribe equalproperties to all populations and all neurotransmitters, thebalance of time spent in wake and sleep was affected moresubstantially compared with changes observed under �10%variations in parameters (data not shown). For example, whenall populations were given equal slow properties and charac-teristics (�X �i 25 s; �X 0.75; �i 4), the percent timein wakefulness more than doubled. Typically, equal propertiesfor populations and/or neurotransmitters caused an increase inpercent time in wake and decrease in percent time in NREMsleep. These changes were caused by differences in both boutfrequency and mean bout duration. Both increases and de-creases in the percent time in REM sleep were observed,although there was a consistent decrease in REM bout dura-tion, regardless of whether the parameters specified fast actionor slow action. These results indicate that maximal REM boutdurations are obtained in our network structure when parame-ters dictating dynamic properties of populations and transmit-ters differ in their relative magnitudes.
Simulation of GABA agonist/antagonist microinjectionin the LC
Simulated microinjection of GABA agonist and antagonistinto the LC had a robust effect on REM sleep by producingincreases and decreases, respectively, in total REM sleep andREM bout duration in the 4 h after microinjection (Fig. 6).These effects were consistent with microinjection experiments(Mallick et al. 2001). To determine the mechanism responsiblefor the changes in REM bout duration, we analyzed microin-jection simulations in the deterministic model (Fig. 7). In thecontrol case, REM bouts were terminated by the onset ofinhibition to the REM-promoting population from coordinatedactivity in LC and DR. In the presence of microinjected GABAagonist, LC is tonically inhibited. Therefore firing in the DRprecedes firing in the LC and lasts longer before triggering atransition to wake. The combined reduction in LC activity andLC/DR coordination results in a longer mean REM boutduration (Fig. 7B). Conversely, in the presence of a GABAantagonist, tonic inhibition to the LC is reduced. This allows
strong anticipatory firing in the LC, which precedes activity inthe DR and increases combined LC/DR inhibition, therebyaccelerating REM bout termination (Fig. 7C). Thus the LCactivation profile modulates changes in REM bout duration.With the addition of noise in the full system, this mechanismwas preserved.
*
***
* * *
C
B
A
Mea
n pe
rcen
t tim
ein
sta
te
Wake NREM REM
REMNREMWake
Mea
n nu
mbe
r of b
outs
REMNREMWake
Mea
n bo
ut d
urat
ions
(min
)
0
10
20
30
40
50
60
Control GABA agonist in LC GABA antagonist in LC
0
10
20
30
40
50
0.0
0.5
1.0
1.5
2.0
2.5
3.0
3.5
FIG. 6. Microinjection of GABA agonist/antagonist into LC alters thestructure of simulated sleep-wake behavior. All results are reported for the 4 hafter simulated microinjection. A: microinjection of the GABA agonist/antag-onist increase/decrease, respectively, the percent time in REM sleep. With theGABA agonist, there is also a tendency toward an increase in NREM sleep,which comes at the expense of time in wakefulness. B: increased/decreasedmean REM bout durations contribute to the effects on percent time in REMsleep. In addition, the GABA agonist-induced decrease in time spent inwakefulness is caused by a decrease in mean wake bout duration. C: micro-injection of GABA agonist also increases the number of REM bouts. [Initialcondition for GABA agonist simulation PG(0) 2.0 and for GABA antagonistsimulation QG(0) 1.0; see APPENDIX for details. Means and SD of modelresults determined from 10 simulation runs; *P � 0.01 in ANOVA withcontrol data.]
1944 C. G. DINIZ BEHN AND V. BOOTH
J Neurophysiol • VOL 103 • APRIL 2010 • www.jn.org
on July 28, 2010 jn.physiology.org
Dow
nloaded from
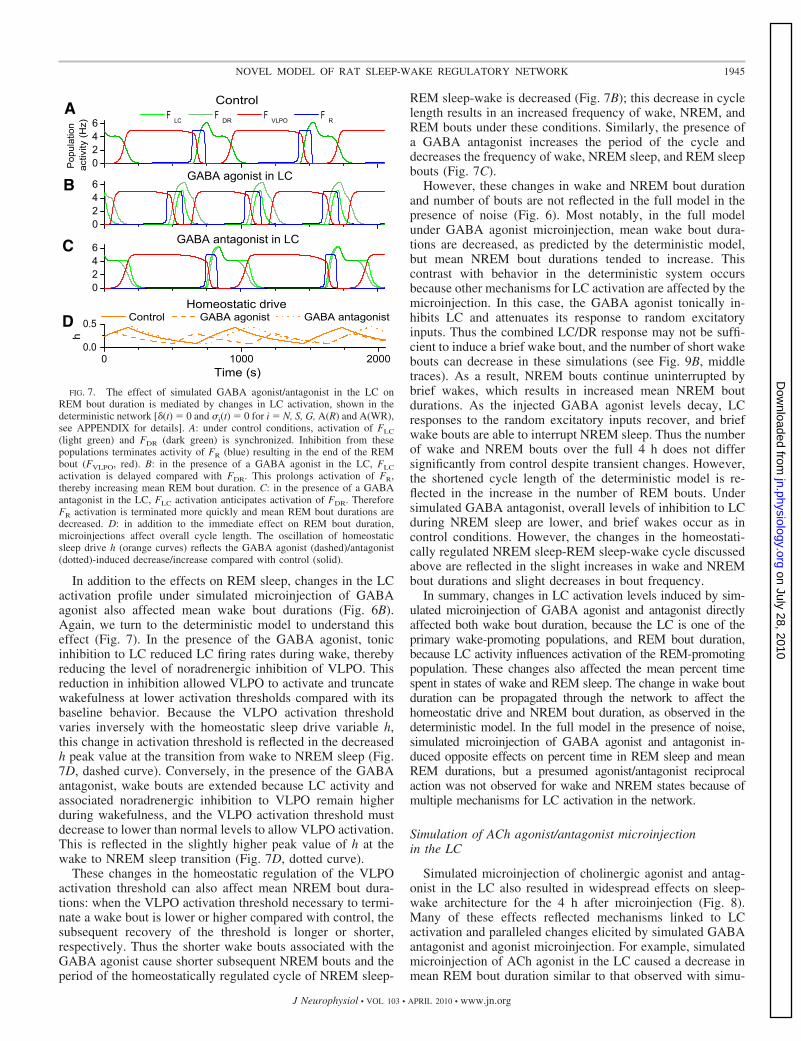
In addition to the effects on REM sleep, changes in the LCactivation profile under simulated microinjection of GABAagonist also affected mean wake bout durations (Fig. 6B).Again, we turn to the deterministic model to understand thiseffect (Fig. 7). In the presence of the GABA agonist, tonicinhibition to LC reduced LC firing rates during wake, therebyreducing the level of noradrenergic inhibition of VLPO. Thisreduction in inhibition allowed VLPO to activate and truncatewakefulness at lower activation thresholds compared with itsbaseline behavior. Because the VLPO activation thresholdvaries inversely with the homeostatic sleep drive variable h,this change in activation threshold is reflected in the decreasedh peak value at the transition from wake to NREM sleep (Fig.7D, dashed curve). Conversely, in the presence of the GABAantagonist, wake bouts are extended because LC activity andassociated noradrenergic inhibition to VLPO remain higherduring wakefulness, and the VLPO activation threshold mustdecrease to lower than normal levels to allow VLPO activation.This is reflected in the slightly higher peak value of h at thewake to NREM sleep transition (Fig. 7D, dotted curve).
These changes in the homeostatic regulation of the VLPOactivation threshold can also affect mean NREM bout dura-tions: when the VLPO activation threshold necessary to termi-nate a wake bout is lower or higher compared with control, thesubsequent recovery of the threshold is longer or shorter,respectively. Thus the shorter wake bouts associated with theGABA agonist cause shorter subsequent NREM bouts and theperiod of the homeostatically regulated cycle of NREM sleep-
REM sleep-wake is decreased (Fig. 7B); this decrease in cyclelength results in an increased frequency of wake, NREM, andREM bouts under these conditions. Similarly, the presence ofa GABA antagonist increases the period of the cycle anddecreases the frequency of wake, NREM sleep, and REM sleepbouts (Fig. 7C).
However, these changes in wake and NREM bout durationand number of bouts are not reflected in the full model in thepresence of noise (Fig. 6). Most notably, in the full modelunder GABA agonist microinjection, mean wake bout dura-tions are decreased, as predicted by the deterministic model,but mean NREM bout durations tended to increase. Thiscontrast with behavior in the deterministic system occursbecause other mechanisms for LC activation are affected by themicroinjection. In this case, the GABA agonist tonically in-hibits LC and attenuates its response to random excitatoryinputs. Thus the combined LC/DR response may not be suffi-cient to induce a brief wake bout, and the number of short wakebouts can decrease in these simulations (see Fig. 9B, middletraces). As a result, NREM bouts continue uninterrupted bybrief wakes, which results in increased mean NREM boutdurations. As the injected GABA agonist levels decay, LCresponses to the random excitatory inputs recover, and briefwake bouts are able to interrupt NREM sleep. Thus the numberof wake and NREM bouts over the full 4 h does not differsignificantly from control despite transient changes. However,the shortened cycle length of the deterministic model is re-flected in the increase in the number of REM bouts. Undersimulated GABA antagonist, overall levels of inhibition to LCduring NREM sleep are lower, and brief wakes occur as incontrol conditions. However, the changes in the homeostati-cally regulated NREM sleep-REM sleep-wake cycle discussedabove are reflected in the slight increases in wake and NREMbout durations and slight decreases in bout frequency.
In summary, changes in LC activation levels induced by sim-ulated microinjection of GABA agonist and antagonist directlyaffected both wake bout duration, because the LC is one of theprimary wake-promoting populations, and REM bout duration,because LC activity influences activation of the REM-promotingpopulation. These changes also affected the mean percent timespent in states of wake and REM sleep. The change in wake boutduration can be propagated through the network to affect thehomeostatic drive and NREM bout duration, as observed in thedeterministic model. In the full model in the presence of noise,simulated microinjection of GABA agonist and antagonist in-duced opposite effects on percent time in REM sleep and meanREM durations, but a presumed agonist/antagonist reciprocalaction was not observed for wake and NREM states because ofmultiple mechanisms for LC activation in the network.
Simulation of ACh agonist/antagonist microinjectionin the LC
Simulated microinjection of cholinergic agonist and antag-onist in the LC also resulted in widespread effects on sleep-wake architecture for the 4 h after microinjection (Fig. 8).Many of these effects reflected mechanisms linked to LCactivation and paralleled changes elicited by simulated GABAantagonist and agonist microinjection. For example, simulatedmicroinjection of ACh agonist in the LC caused a decrease inmean REM bout duration similar to that observed with simu-
D
C
B
A
0246
0246
0246
0 1000 20000.0
0.5
FLC
FDR
FVLPO
FR
Control GABA agonist GABA antagonist
h
Homeostatic drive
GABA antagonist in LC
GABA agonist in LC
Control
Pop
ulat
ion
activ
ity (H
z)
Time (s)FIG. 7. The effect of simulated GABA agonist/antagonist in the LC on
REM bout duration is mediated by changes in LC activation, shown in thedeterministic network [�(t) 0 and �i(t) 0 for i N, S, G, A(R) and A(WR),see APPENDIX for details]. A: under control conditions, activation of FLC
(light green) and FDR (dark green) is synchronized. Inhibition from thesepopulations terminates activity of FR (blue) resulting in the end of the REMbout (FVLPO, red). B: in the presence of a GABA agonist in the LC, FLC
activation is delayed compared with FDR. This prolongs activation of FR,thereby increasing mean REM bout duration. C: in the presence of a GABAantagonist in the LC, FLC activation anticipates activation of FDR. ThereforeFR activation is terminated more quickly and mean REM bout durations aredecreased. D: in addition to the immediate effect on REM bout duration,microinjections affect overall cycle length. The oscillation of homeostaticsleep drive h (orange curves) reflects the GABA agonist (dashed)/antagonist(dotted)-induced decrease/increase compared with control (solid).
1945NOVEL MODEL OF RAT SLEEP-WAKE REGULATORY NETWORK
J Neurophysiol • VOL 103 • APRIL 2010 • www.jn.org
on July 28, 2010 jn.physiology.org
Dow
nloaded from

lated microinjection of GABA antagonist, and these decreasescan be attributed to a similar mechanism: higher LC activityaccelerates LC activation at the REM sleep-wake transition,which truncates the REM bout and extends the wake bout. Thepropagated effects of a longer wake bout on the homeostatic sleepdrive and NREM bout duration led to an increase in NREM boutduration and a decrease in the number of NREM bouts.
Likewise, the changes to REM and wake bout durations causedby simulated ACh antagonist in the LC are similar to those ofsimulated GABA agonist microinjection. Specifically, meanREM bout duration is increased because reduced cholinergicexcitation to LC attenuates NE inhibition to the REM-promot-ing population, thus requiring higher levels of coordinatedLC/DR activity to terminate the REM bout. Mean wake boutduration is decreased because reduced LC activity levels re-duce NE inhibition to the VLPO and allow earlier VLPOactivation to truncate wake bouts.
Despite these similarities, ACh agonist/GABA antagonistand ACh antagonist/GABA agonist pairs may exert differenteffects across sleep-wake states because neurotransmitter ago-nists affect sleep-wake behavior in all states, whereas antago-nists act only when the appropriate state-dependent neurotrans-mitter is present. For example, the reduction in REM frequencycaused by the microinjected cholinergic agonist was not ob-served under microinjected GABA antagonist. In the presenceof ACh agonist, LC receives tonic excitatory input that pre-vents complete termination of its activity during the NREMstate and sustains its inhibitory input to the REM-promotingpopulation. This maintained inhibition suppressed both spon-taneous REM bouts and activation of the REM-promotingpopulation at the homeostatically regulated transitions out ofNREM sleep. Thus the number of REM bouts was very low forthe first hour of the simulation (Fig. 9A). As the level ofinjected ACh agonist decayed, the number of REM boutsrecovered to levels closer to control. In contrast, simulatedGABA antagonist microinjection did not significantly affectthe number of REM bouts.
This difference between tonic activity of an injected agonistand state-dependent activity of an injected antagonist is alsoevident in the simulated ACh antagonist microinjections. Sim-ulated ACh antagonist microinjections do not affect brief wakebouts because the random, excitatory inputs to LC are notpresumed to be cholinergically mediated. Therefore in contrastto simulated GABA agonist microinjections, brief wakes per-sist under simulated ACh antagonist conditions (Fig. 9B). Inthe figure, probability density functions for wake bout dura-tions show peaks at short durations (�1 min) for the controland simulated ACh antagonist microinjections, especially inthe second to fourth hours of the simulations (top and bottom).This peak is notably absent in the probability density functionsfor the first to third hours of the simulated GABA agonist(middle) but reappears in the fourth hour as the effect of thesimulated agonist dissipates and brief wakes resume. As aresult of the maintenance of brief wakes under simulated AChantagonist conditions, NREM bout durations in this conditionare not affected, even though, through the mechanisms of thedeterministic model, shorter wake bouts act to reduce NREMbout durations. The influence of shorter wake bouts in thedeterministic model on wake bout durations in the noisy modelis shown by the shift of the secondary lower peaks to shorterdurations in the simulated GABA agonist and ACh antagonistsimulations (middle and bottom) compared with the controlcase (top, vertical line indicates the mean wake bout durationin the deterministic model).
In summary, many of the effects of changes in LCactivation levels by simulated microinjection of ACh ago-nist and antagonist mirror those of simulated GABA antag-onist and agonist, respectively. Exceptions can be attributed
*
*
**
*
**
**
**
C
B
A
REM
REM
NREM
NREM
REMNREM
Wake
Wake
Wake
Mea
n pe
rcen
t tim
ein
sta
teM
ean
num
ber o
f bou
tsM
ean
bout
dur
atio
ns (m
in)
0
10
20
30
40
50
60
Control ACh agonist in LC ACh antagonist in LC
0
10
20
30
40
50
60
0.0
0.5
1.0
1.5
2.0
2.5
3.0
3.5
FIG. 8. Microinjection of ACh agonist/antagonist into LC alters the struc-ture of simulated sleep-wake behavior. All results are reported for the 4 h aftersimulated microinjection. A: microinjection of ACh agonist/antagonist de-creased/increased the percent time spent in REM sleep. Reciprocal changeswere observed in the percent time spent in wake. B: changes in mean wake andREM bout durations contributed to the changes in time spent in these states. Inaddition, mean NREM bout durations were increased in the presence of theACh agonist. C: in the presence of the ACh agonist, the number of NREM andREM bouts was decreased. [Initial condition for ACh agonist simulationPA(0) 0.8 and for ACh antagonist simulation QA(0) 0.55; see APPENDIXfor details. Means and SD of model results determined from 10 simulationruns; *P � 0.01 in ANOVA with control data.]
1946 C. G. DINIZ BEHN AND V. BOOTH
J Neurophysiol • VOL 103 • APRIL 2010 • www.jn.org
on July 28, 2010 jn.physiology.org
Dow
nloaded from

to the difference in the state dependence or independence ofaction of an injected agonist and antagonist. Specifically,sustained LC activity during NREM sleep under simulatedmicroinjection of ACh agonist caused a significant reductionin the number of REM bouts that did not occur with thesimulated GABA antagonist. Additionally, simulated AChantagonist did not affect the efficacy of the random, exci-tatory inputs to the LC to induce brief wakes, unlikesimulated GABA agonist.
Model prediction for modulation of REM frequencybut not duration
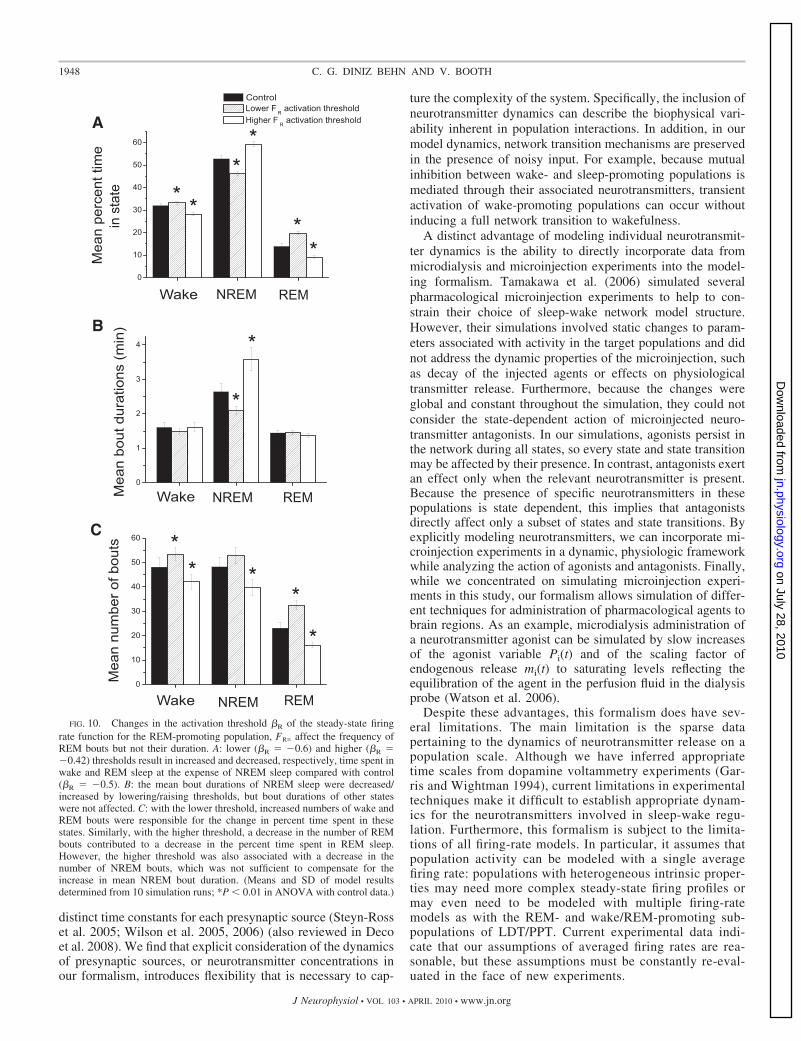
Despite the expected parallels between ACh agonist/GABAantagonist and ACh antagonist/GABA agonist pairs, simulationresults for cholinergic agonists/antagonists contrasted with exper-imental observations. One inconsistency was that experimentalmicroinjection of cholinergic agonists/antagonists into the LCsignificantly affected frequency of REM bouts with less influenceon REM bout duration (Mallick et al. 2001). The discrepanciesbetween these results and our simulations suggest that REM sleepcontrol may not be a direct result of LC activity and are furtheraddressed in the DISCUSSION. However, as a first step in revisingnetwork structure/interactions, we analyzed the network behaviorto identify mechanisms that affected the frequency of REM sleepwithout affecting mean REM bout duration.
The primary mechanism that satisfied these criteria wasmodulation of the activation threshold �R for the steady-statefiring rate function of the REM-promoting population, FR�( � ).Lower activation thresholds increased REM frequency andhigher activation thresholds decreased REM frequency withoutaltering mean REM bout duration (Fig. 10). Similar changeswere observed in the number of wake and NREM bouts causedby an overall change in cycle length. Although mean REM andwake bout durations were not affected, the altered frequency ofREM bouts resulted in changes to fragmentation of NREMsleep and associated changes in mean NREM bout durations.Increases or decreases in the frequency of NREM bouts did notcompensate for the changes in mean NREM bout durations asreflected by the altered total amounts of NREM sleep. Theseresults suggest that initiation of REM sleep results from directmodulation of activation in REM-promoting populations whilemaintenance of REM sleep can be governed by networkdynamics.
D I S C U S S I O N
In this study, we introduced a novel modeling framework forinvestigating the structure and dynamics of sleep-wake regu-lation. The model simulates realistic rat sleep-wake behaviorand the modulation of this behavior with microinjection ofGABAergic and cholinergic agonists/antagonists into one ofthe key wake-promoting populations. Furthermore, detailedanalysis of network dynamics provides insights into the mech-anisms underlying agonist/antagonist modulation of baselinebehavior.
Advantages and limitations of the modeling formalism
In our firing rate formalism, we allow for the time evolutionof both the postsynaptic response to total input and the totalinput in response to presynaptic population activity. Mostfiring rate models assume that one of these processes isinstantaneous; either setting firing rate equal to the steady-statefiring rate function (Deco et al. 2008; Phillips and Robinson2007, 2008; Steyn-Ross et al. 2005; Wilson et al. 2005, 2006)or setting total input as the weighted sum of all presynapticfiring rates (Wilson and Cowan 1972) (also reviewed in Er-mentrout 1998). Of those models that allow for time dynamicsof total input, some consolidate the dynamics of all presynapticsources under one time constant (Phillips and Robinson 2007,2008), whereas others, similar to our formalism, allow for
0 60 120 180 240 3000.00
0.02
0.04
0.00
0.02
0.04
0.00
0.02
0.04 ACh antagonist in LC GABA agonist in LC Control
4th hour
4th hour
4th hour
1st hour
1st hour
1st hour
Pro
babi
lity
Den
sity
Duration (s)
B Wake
REMA
Mea
n nu
mbe
r of b
outs
Hour of simulation time1 2 3 4
0
1
2
3
4
5
6
7
Control ACh agonist in LC GABA antagonist in LC
FIG. 9. ACh agonist/GABA antagonist and ACh antagonist/GABA agonistpairs show differences in their effects on sleep-wake behavior. Furthermore,the dynamics of microinjected agonist/antagonist decay alter their effects onsleep-wake behavior over time. A: simulated microinjection of ACh agonistinto the LC results in an initial decrease in REM frequency that is not observedwith microinjection of a GABA antagonist. This decrease is attenuated as theACh agonist decays over time. B: probability density functions describechanges in the distribution of wake bout durations over 4 h in controlconditions (top) and after simulated microinjection of GABA agonist (middle)and ACh antagonist (bottom) in the LC. Each trace denotes the probabilitydensity for 1 h of wake bout duration data with the progression from top tobottom corresponding to hours 1, 2, 3, and 4 after the simulated microinjection.In each panel, the top 3 traces have been vertically offset for clarity. Thevertical line in the control panel denotes the mean wake bout duration in thedeterministic model when noisy components are absent [�(t) 0 and �i(t) 0, APPENDIX for details], showing the influence of dynamics in the deter-ministic model on the noisy model. Under simulated GABA agonist (middle),the absence of a peak at short durations (�1 min) in probability densities in the1st to 3rd h reflects a suppression of brief wake bouts that does not occur withsimulated microinjection of ACh antagonist (bottom). (Model data same as inFigs. 6 and 8.)
1947NOVEL MODEL OF RAT SLEEP-WAKE REGULATORY NETWORK
J Neurophysiol • VOL 103 • APRIL 2010 • www.jn.org
on July 28, 2010 jn.physiology.org
Dow
nloaded from
distinct time constants for each presynaptic source (Steyn-Rosset al. 2005; Wilson et al. 2005, 2006) (also reviewed in Decoet al. 2008). We find that explicit consideration of the dynamicsof presynaptic sources, or neurotransmitter concentrations inour formalism, introduces flexibility that is necessary to cap-
ture the complexity of the system. Specifically, the inclusion ofneurotransmitter dynamics can describe the biophysical vari-ability inherent in population interactions. In addition, in ourmodel dynamics, network transition mechanisms are preservedin the presence of noisy input. For example, because mutualinhibition between wake- and sleep-promoting populations ismediated through their associated neurotransmitters, transientactivation of wake-promoting populations can occur withoutinducing a full network transition to wakefulness.
A distinct advantage of modeling individual neurotransmit-ter dynamics is the ability to directly incorporate data frommicrodialysis and microinjection experiments into the model-ing formalism. Tamakawa et al. (2006) simulated severalpharmacological microinjection experiments to help to con-strain their choice of sleep-wake network model structure.However, their simulations involved static changes to param-eters associated with activity in the target populations and didnot address the dynamic properties of the microinjection, suchas decay of the injected agents or effects on physiologicaltransmitter release. Furthermore, because the changes wereglobal and constant throughout the simulation, they could notconsider the state-dependent action of microinjected neuro-transmitter antagonists. In our simulations, agonists persist inthe network during all states, so every state and state transitionmay be affected by their presence. In contrast, antagonists exertan effect only when the relevant neurotransmitter is present.Because the presence of specific neurotransmitters in thesepopulations is state dependent, this implies that antagonistsdirectly affect only a subset of states and state transitions. Byexplicitly modeling neurotransmitters, we can incorporate mi-croinjection experiments in a dynamic, physiologic frameworkwhile analyzing the action of agonists and antagonists. Finally,while we concentrated on simulating microinjection experi-ments in this study, our formalism allows simulation of differ-ent techniques for administration of pharmacological agents tobrain regions. As an example, microdialysis administration ofa neurotransmitter agonist can be simulated by slow increasesof the agonist variable Pi(t) and of the scaling factor ofendogenous release mi(t) to saturating levels reflecting theequilibration of the agent in the perfusion fluid in the dialysisprobe (Watson et al. 2006).
Despite these advantages, this formalism does have sev-eral limitations. The main limitation is the sparse datapertaining to the dynamics of neurotransmitter release on apopulation scale. Although we have inferred appropriatetime scales from dopamine voltammetry experiments (Gar-ris and Wightman 1994), current limitations in experimentaltechniques make it difficult to establish appropriate dynam-ics for the neurotransmitters involved in sleep-wake regu-lation. Furthermore, this formalism is subject to the limita-tions of all firing-rate models. In particular, it assumes thatpopulation activity can be modeled with a single averagefiring rate: populations with heterogeneous intrinsic proper-ties may need more complex steady-state firing profiles ormay even need to be modeled with multiple firing-ratemodels as with the REM- and wake/REM-promoting sub-populations of LDT/PPT. Current experimental data indi-cate that our assumptions of averaged firing rates are rea-sonable, but these assumptions must be constantly re-eval-uated in the face of new experiments.
*
*
*
*
**
*
*
*
*
*
*
*
C
B
A
REMNREMWake
Mea
n pe
rcen
t tim
ein
sta
te
REMNREMWake
Mea
n nu
mbe
r of b
outs
REMNREMWake
Mea
n bo
ut d
urat
ions
(min
)
0
10
20
30
40
50
60
Control Lower F
R activation threshold
Higher FR activation threshold
0
10
20
30
40
50
60
0
1
2
3
4
FIG. 10. Changes in the activation threshold �R of the steady-state firingrate function for the REM-promoting population, FR� affect the frequency ofREM bouts but not their duration. A: lower (�R �0.6) and higher (�R �0.42) thresholds result in increased and decreased, respectively, time spent inwake and REM sleep at the expense of NREM sleep compared with control(�R �0.5). B: the mean bout durations of NREM sleep were decreased/increased by lowering/raising thresholds, but bout durations of other stateswere not affected. C: with the lower threshold, increased numbers of wake andREM bouts were responsible for the change in percent time spent in thesestates. Similarly, with the higher threshold, a decrease in the number of REMbouts contributed to a decrease in the percent time spent in REM sleep.However, the higher threshold was also associated with a decrease in thenumber of NREM bouts, which was not sufficient to compensate for theincrease in mean NREM bout duration. (Means and SD of model resultsdetermined from 10 simulation runs; *P � 0.01 in ANOVA with control data.)
1948 C. G. DINIZ BEHN AND V. BOOTH
J Neurophysiol • VOL 103 • APRIL 2010 • www.jn.org
on July 28, 2010 jn.physiology.org
Dow
nloaded from

Comparison with experimental results
Mallick et al. (2001) studied the effects of microinjection ofGABAergic and cholinergic agonists and antagonists into LCin Wistar rats. They found that microinjection of GABAincreased total REM sleep by increasing mean REM boutdurations, whereas microinjection of the GABA antagonistpicrotoxin had the opposite effect. They also noted that theGABA and picrotoxin microinjections increased and de-creased, respectively, time in active waking with compensatorychanges in slow wave sleep; changes in frequency or meanduration of these states were not reported.
Because of differences between our control dataset (Blanco-Centurion et al. 2007) and the control data reported by Mallickand colleagues, possibly because of the use of different rat strains,we could not quantitatively compare our results. However, wequalitatively compared the overall trends on sleep-wake pattern-ing observed in our simulations with the differences they identi-fied. Although our results regarding changes in REM sleep wereconsistent with data reported by Mallick and colleagues, oursimulations showed opposite effects on wake and NREM sleep.Because wake-promoting LC neurons are under tonicGABAergic inhibition (Kawahara et al. 1999), it is surpris-ing that increases in GABAergic inhibition increase wake-fulness. One possible explanation of this apparent contra-diction involves the mechanism for sleep homeostasis. Inour model, the variable h associated with sleep homeostasisincreases during wake and decreases during sleep withconstant rates such that the amount of change is dependenton the time spent in each state. However, if the rate ofincrease and decrease depended on factors such as LCactivity, the lower levels of activity caused by GABAmicroinjection may translate to an extension of wake bouts.In future work, a refined, dynamic sleep homeostat could beused to explore this potential mechanism.
Mallick et al. (2001) also found that microinjection of thecholinergic agonist carbachol in the LC increased total REMsleep by increasing the frequency of REM sleep and thatmicroinjection of the cholinergic antagonist scopolamine de-creased REM sleep by decreasing the frequency of REMinitiation. There were trends toward increased/decreased REMbout durations with carbachol and scopolamine, respectively,but these differences were not significant. They did not reportany changes to other behavioral states.
Our simulations of cholinergic agonist and antagonist mi-croinjections showed opposite effects on total REM sleep andprimarily attributed these changes to differences in mean boutduration, although simulated cholinergic agonist did affectmean number of REM bouts. Our results are consistent withexperiments in cats (Masserano and King 1982; Vanni-Mercieret al. 1989), suggesting that the role of cholinergic agonists/antagonists in the regulation of REM sleep may differ betweenspecies. Apparent species differences may also be caused bythe challenge of localizing microinjections in the small rodentbrain (Brown et al. 2006), or they may reflect a limitation in thecurrent model structure. Alternatively, the net effect of acholinergic agonist on LC population activity may not bepurely excitatory given the presence of local GABAergic cellswithin the LC (Iijima and Ohtomo 1988) and different musca-rinic cholinergic receptor subtypes on LC cells (Baghdoyan1997). In vitro studies have identified an excitatory effect of
activation of M2 muscarinic receptors in the LC (Egan andNorth 1985), but inhibitory actions of other receptor subtypeshave been indicated in nearby pontine structures (Egan andNorth 1986; Gerber et al. 1991). The discrepancies betweenmodel and experimental results suggest that variations in net-work structures for REM regulation should be considered, andthey highlight the utility of formal mathematical modeling forconstraining conceptual models.
Probing the mechanisms for REM sleep generation
Recent experimental evidence has challenged the cholin-ergic hypothesis for REM sleep regulation in rodents, andseveral competing conceptual models of REM sleep regulationhave been proposed. Because GABA is the neurotransmitterresponsible for the slowing and eventual cessation of activity inthe DR and LC that gates the production of REM sleep(Gervasoni et al. 1998; Nitz and Siegel 1997), these modelsfocus on the importance of recently identified REM-activeGABAergic populations (Brown et al. 2008; Lu et al. 2006;Luppi et al. 2006; Sapin et al. 2009) and attribute to thecholinergic system varying levels of involvement in REMsleep initiation and maintenance.
Several groups have suggested modifications of the recipro-cal interaction model in which LC/DR and LDT/PPT act onintermediate GABAergic populations that ultimately controldifferent aspects of REM sleep. In the cellular-molecular-network (CMN) model of REM sleep proposed by Datta andMacLean (2007), ACh from LDT/PPT promoted activity inpopulations involved in specific aspects of REM sleep, termedREM sleep-sign generators. Simultaneously, local GABAergicpopulations inhibited LC and DR to facilitate disinhibition ofthe REM sleep-sign generators. Hence, the roles of thesegenerators in governing specific REM sleep signs were recon-ciled with significant roles for LC/DR and LDT/PPT. Mallicket al. (2001) also invoked the presence of local GABAergicpopulations in LC and DR. They suggested that the counter-intuitive effects of microinjected cholinergic agonists/antago-nists in the LC on REM sleep were caused by local GABAergicmediation of standard cholinergic effects (Mallick et al. 2001).This hypothesis highlights the importance of consideringmechanistic differences between the effects of endogenous andexogenous neurotransmitter.
Other groups have rejected the cholinergic hypothesis alto-gether. Lu et al. (2006) proposed that control of REM sleep isachieved through a REM-on/REM-off flip-flop switch result-ing from reciprocal GABAergic inhibition between REM-onneurons in the sublaterodorsal nucleus (SLD) and precoeruleus(PC) and REM-off neurons in the ventrolateral part of theperiaqueductal gray matter (vlPAG) and lateral pontine teg-mentum (LPT). They noted that LC/DR and LDT/PPT mayhelp to modulate REM sleep, but they did not consider thesepopulations to play essential roles in the circuitry. Luppi andcolleagues have proposed that the vlPAG is the most importantstructure for REM control and that vlPAG contains bothREM-on and REM-off neurons (Luppi et al. 2006; Sapin et al.2009). Local interactions within the vlPAG, as well as inter-actions with other GABAergic and monoaminergic structures,govern transitions into REM sleep.
McCarley and colleagues suggested a conceptual model thatincorporates both cholinergic and GABAergic mechanisms in
1949NOVEL MODEL OF RAT SLEEP-WAKE REGULATORY NETWORK
J Neurophysiol • VOL 103 • APRIL 2010 • www.jn.org
on July 28, 2010 jn.physiology.org
Dow
nloaded from
the control of REM sleep (Brown et al. 2008). In their proposedmodel, there is mutual GABAergic inhibition between REM-onneurons in the subcoeruleus and pontine nucleus oralis and REM-off neurons in the LPT, and ACh excites the REM-on neurons andinhibits the REM-off neurons. This provides essential cholinergicmodulation of the GABAergic flip-flop structure. Furthermore,because the REM-on GABAergic neurons in subcoeruleus inhibitthe LC and DR, indirect reciprocal interaction between monoam-inergic and cholinergic populations continues to play a role in thisconceptual model of REM sleep regulation.
Although these conceptual models specify the roles of dif-ferent populations during REM sleep and the projections thatcause or reinforce these state-dependent behaviors, they rarelyaccount for mechanisms of transition in and out of REM sleep.In addition, conceptual models often fail to address mecha-nisms for the regular alternation between NREM and REMsleep that is a feature of normal sleep in several speciesincluding humans (Carskadon and Dement 2000). It has beendifficult to establish similar periodicity in the polyphasic sleep-wake behavior of rodents. However, if the mechanisms forgenerating REM sleep are similar across species, the structureof a REM sleep generating network should suggest a basis forNREM-REM periodicity. Dynamic mathematical modeling ofthe REM-on/REM-off flip-flop switch suggested that bothinhibition from the VLPO cluster to the extended VLPO and adrop in extended VLPO activity before sleep onset werenecessary to achieve NREM-REM alternation (Rempe et al.2009), but physiological support for these predictions has notyet been established. However, NREM-REM alternation wasan important feature of the McCarley-Hobson reciprocal inter-action model (Massaquoi and McCarley 1992; McCarley andHobson 1975). Although the control parameter regimen (de-scribing rat sleep-wake behavior) for our model did not pro-duce regularly occurring NREM-REM alternation, our networkstructure admits a similar periodic mechanism.
Control of REM sleep must be understood in the largercontext of the regulation of sleep-wake behavior. However, itcan be difficult to infer the state-dependent dynamics that resultfrom a given conceptual model. Therefore formal dynamicmodeling approaches complement ongoing experimental stud-ies to evaluate proposed network structures and shape ourunderstanding of REM sleep regulation.
A P P E N D I X
Simulation results in Figs. 3–10 were obtained with equations andparameter values given here except where noted below and in the figurecaptions. When possible, parameter values were based on experimentaldata. When such data were unavailable, we chose parameters that wereconsistent with available experimental characterizations of neuronal pop-ulations, neurotransmitter actions, and the state-dependent behavior weexpected from the network. Additional details are provided below.
For each neuronal population, the postsynaptic firing rate, FX(t) (inHz, X LC, DR, VLPO, R, or WR), is governed by an equation of thefollowing form
F�X �
FX���i
gi,X Ci� � FX
�X
(9)
where the steady-state firing rate FX�( � ), is a saturating function, itsargument is summed over the neurotransmitters [i norepinephrine
(N), serotonin (S), GABA (G), or acetylcholine (A)] released to thepostsynaptic population X, the gi,X are constant weights, and �X is thetime constant associated with the response dynamics of the postsyn-aptic population. The individual equations for each population aregiven by the following
F�LC �FLC��gA,LC CA � gN,LC CN � gG,LC CG � ��t�� � FLC
�LC
(10)
F�DR �FDR��gA,DR CA � gS,DR CS � gG,DR CG � ��t�� � FDR
�DR
(11)
F�VLPO �FVLPO���gN,VLPO CN � gS,VLPO CS � gG,VLPO CG� � FVLPO
�VLPO
(12)
F�R �FR��gA,R CA � gN,R CN � gS,R CS � gG,R CG� � FR
�R
(13)
F�WR �FWR��gA,WR CA � gG,WR CG� � FWR
�WR
(14)
The constant weights gi,X are given by
gA,LC, 3.5; gG,DR, 1.5; gA,WR, 1;gN,LC, 1.5; gA,R, 2.5; gG,WR, 1.7;gG,LC, 1.5; gN,R, 3.5; gN,VLPO, 2;gA,DR, 3.5; gS,R, 3.5; gS,VLPO, 2;gS,DR, 1.5; gG,R, 1.25; gG,VLPO, 0.5
and were chosen to produce appropriate steady-state behavior in eachpostsynaptic population during wake, NREM sleep, and REM sleep.For example, because VLPO has a sleep-active firing profile, theparameters gN,VLPO and gS,VLPO were chosen sufficiently large tosilence VLPO activity when FLC and FDR firing rates were high (as inwaking).
The time constants (s) for the firing rate equations are given by
�LC, 25; �R, 1; �VLPO, 10;�DR, 25; �WR, 10;
The ordering �R � �WR �VLPO � �LC �DR reflects thedifference in activation rates between populations with autoexcitatorysynapses and populations with autoinhibitory synapses. As describedin RESULTS, this difference is necessary to obtain sufficiently longREM bout durations.
Inputs to the LC and DR populations include the term �(t) thatrepresents excitatory pulses of random amplitude (mean amplitude of8 and SD of 0.1) that occur according to a Poisson process with anaverage rate of 0.003 Hz. The pulses instantaneously activate anddecay exponentially with a time constant of 10 s.
For the neuronal populations LC, DR, R, and WR, the steady-statefiring rate function has the form FX�(c) Xmax(0.5{1 � tanh[(c ��X)/�X]}) with parameters as follows
LCmax, 6.5 Hz; �LC, 0.75; �LC, 2;DRmax, 6.5 Hz; �DR, 0.75; �DR, 2;Rmax, 5 Hz; �R, 0.25; �R, �0.5;WRmax, 5 Hz; �WR, 0.25; �WR, �0.2;VLPOmax, 5 Hz; �VLPO, 0.25; �VLPO�h�, � 7h;
Parameters describing maximal physiological firing rates of neuronalpopulations, Xmax for X LC, DR, R, WR, and VLPO were based on
1950 C. G. DINIZ BEHN AND V. BOOTH
J Neurophysiol • VOL 103 • APRIL 2010 • www.jn.org
on July 28, 2010 jn.physiology.org
Dow
nloaded from
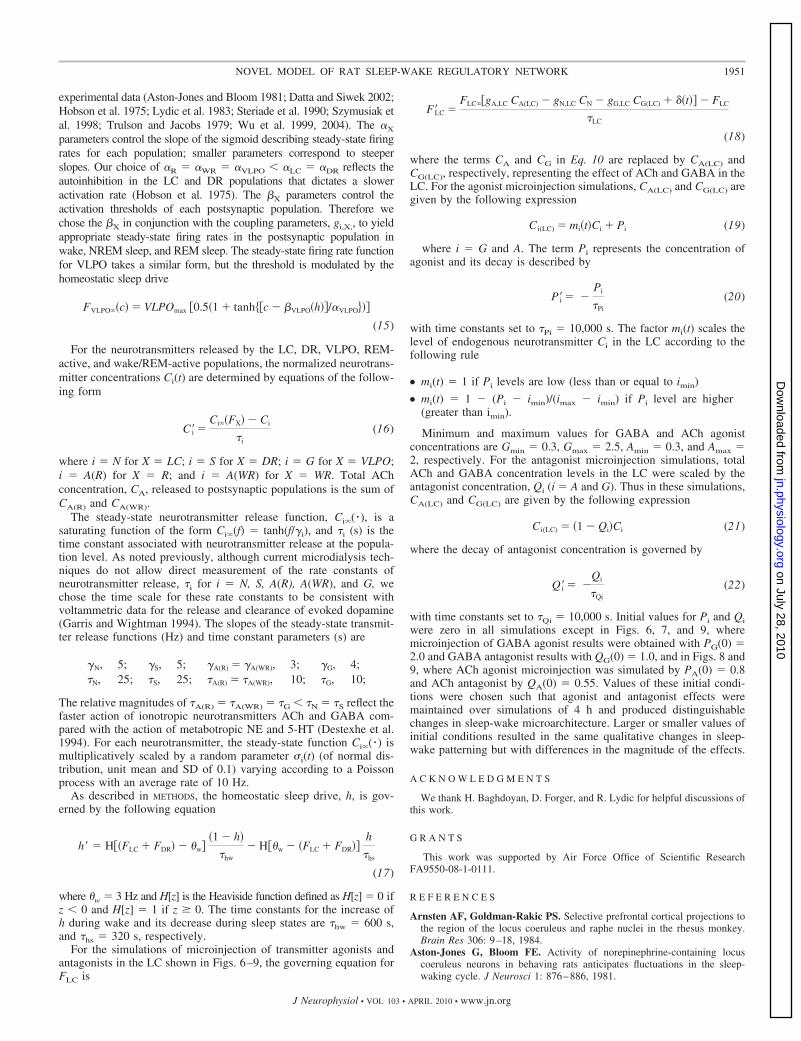
experimental data (Aston-Jones and Bloom 1981; Datta and Siwek 2002;Hobson et al. 1975; Lydic et al. 1983; Steriade et al. 1990; Szymusiak etal. 1998; Trulson and Jacobs 1979; Wu et al. 1999, 2004). The �X
parameters control the slope of the sigmoid describing steady-state firingrates for each population; smaller parameters correspond to steeperslopes. Our choice of �R �WR �VLPO � �LC �DR reflects theautoinhibition in the LC and DR populations that dictates a sloweractivation rate (Hobson et al. 1975). The �X parameters control theactivation thresholds of each postsynaptic population. Therefore wechose the �X in conjunction with the coupling parameters, gi,X,, to yieldappropriate steady-state firing rates in the postsynaptic population inwake, NREM sleep, and REM sleep. The steady-state firing rate functionfor VLPO takes a similar form, but the threshold is modulated by thehomeostatic sleep drive
FVLPO��c� � VLPOmax �0.5�1 � tanh��c � �VLPO�h��/�VLPO���
(15)
For the neurotransmitters released by the LC, DR, VLPO, REM-active, and wake/REM-active populations, the normalized neurotrans-mitter concentrations Ci(t) are determined by equations of the follow-ing form
C�i �Ci��FX� � Ci
�i
(16)
where i N for X LC; i S for X DR; i G for X VLPO;i A(R) for X R; and i A(WR) for X WR. Total AChconcentration, CA, released to postsynaptic populations is the sum ofCA(R) and CA(WR).
The steady-state neurotransmitter release function, Ci�( � ), is asaturating function of the form Ci�(f) tanh(f/�i), and �i (s) is thetime constant associated with neurotransmitter release at the popula-tion level. As noted previously, although current microdialysis tech-niques do not allow direct measurement of the rate constants ofneurotransmitter release, �i for i N, S, A(R), A(WR), and G, wechose the time scale for these rate constants to be consistent withvoltammetric data for the release and clearance of evoked dopamine(Garris and Wightman 1994). The slopes of the steady-state transmit-ter release functions (Hz) and time constant parameters (s) are
�N, 5; �S, 5; �A(R) � �A(WR), 3; �G, 4;�N, 25; �S, 25; �A(R) � �A(WR), 10; �G, 10;
The relative magnitudes of �A(R) �A(WR) �G � �N �S reflect thefaster action of ionotropic neurotransmitters ACh and GABA com-pared with the action of metabotropic NE and 5-HT (Destexhe et al.1994). For each neurotransmitter, the steady-state function Ci�( � ) ismultiplicatively scaled by a random parameter �i(t) (of normal dis-tribution, unit mean and SD of 0.1) varying according to a Poissonprocess with an average rate of 10 Hz.
As described in METHODS, the homeostatic sleep drive, h, is gov-erned by the following equation
h� � H��FLC � FDR� � w��1 � h�
�hw
� H�w � �FLC � FDR��h
�hs
(17)
where w 3 Hz and H[z] is the Heaviside function defined as H[z] 0 ifz � 0 and H[z] 1 if z 0. The time constants for the increase ofh during wake and its decrease during sleep states are �hw 600 s,and �hs 320 s, respectively.
For the simulations of microinjection of transmitter agonists andantagonists in the LC shown in Figs. 6–9, the governing equation forFLC is
F�LC �FLC��gA,LC CA(LC) � gN,LC CN � gG,LC CG(LC) � ��t�� � FLC
�LC
(18)
where the terms CA and CG in Eq. 10 are replaced by CA(LC) andCG(LC), respectively, representing the effect of ACh and GABA in theLC. For the agonist microinjection simulations, CA(LC) and CG(LC) aregiven by the following expression
Ci(LC) � mi�t�Ci � Pi (19)
where i G and A. The term Pi represents the concentration ofagonist and its decay is described by
P�i � �Pi
�Pi
(20)
with time constants set to �Pi 10,000 s. The factor mi(t) scales thelevel of endogenous neurotransmitter Ci in the LC according to thefollowing rule
● mi(t) 1 if Pi levels are low (less than or equal to imin)
● mi(t) 1 � (Pi � imin)/(imax � imin) if Pi level are higher(greater than imin).
Minimum and maximum values for GABA and ACh agonistconcentrations are Gmin 0.3, Gmax 2.5, Amin 0.3, and Amax 2, respectively. For the antagonist microinjection simulations, totalACh and GABA concentration levels in the LC were scaled by theantagonist concentration, Qi (i A and G). Thus in these simulations,CA(LC) and CG(LC) are given by the following expression
Ci(LC) � �1 � Qi�Ci (21)
where the decay of antagonist concentration is governed by
Q�i � �Qi
�Qi
(22)
with time constants set to �Qi 10,000 s. Initial values for Pi and Qi
were zero in all simulations except in Figs. 6, 7, and 9, wheremicroinjection of GABA agonist results were obtained with PG(0) 2.0 and GABA antagonist results with QG(0) 1.0, and in Figs. 8 and9, where ACh agonist microinjection was simulated by PA(0) 0.8and ACh antagonist by QA(0) 0.55. Values of these initial condi-tions were chosen such that agonist and antagonist effects weremaintained over simulations of 4 h and produced distinguishablechanges in sleep-wake microarchitecture. Larger or smaller values ofinitial conditions resulted in the same qualitative changes in sleep-wake patterning but with differences in the magnitude of the effects.
A C K N O W L E D G M E N T S
We thank H. Baghdoyan, D. Forger, and R. Lydic for helpful discussions ofthis work.
G R A N T S
This work was supported by Air Force Office of Scientific ResearchFA9550-08-1-0111.
R E F E R E N C E S
Arnsten AF, Goldman-Rakic PS. Selective prefrontal cortical projections tothe region of the locus coeruleus and raphe nuclei in the rhesus monkey.Brain Res 306: 9–18, 1984.
Aston-Jones G, Bloom FE. Activity of norepinephrine-containing locuscoeruleus neurons in behaving rats anticipates fluctuations in the sleep-waking cycle. J Neurosci 1: 876–886, 1981.
1951NOVEL MODEL OF RAT SLEEP-WAKE REGULATORY NETWORK
J Neurophysiol • VOL 103 • APRIL 2010 • www.jn.org
on July 28, 2010 jn.physiology.org
Dow
nloaded from

Baghdoyan HA. Location and quantification of muscarinic receptor subtypesin rat pons: implications for REM sleep generation. Am J Physiol 273:R896–R904, 1997.
Basheer R, Porkka-Heiskanen T, Stenberg D, McCarley RW. Adenosineand behavioral state control: adenosine increases c-Fos protein and AP1binding in basal forebrain of rats. Brain Res Mol Brain Res 73: 1–10, 1999.
Basheer R, Strecker RE, Thakkar MM, McCarley RW. Adenosine andsleep-wake regulation. Prog Neurobiol 73: 379–396, 2004.
Benington JH, Heller HC. Does the function of REM sleep concern non-REM sleep or waking? Prog Neurobiol 44: 433–449, 1994.
Blanco-Centurion C, Gerashchenko D, Shiromani PJ. Effects of saporin-induced lesions of three arousal populations on daily levels of sleep andwake. J Neurosci 27: 14041–14048, 2007.
Borbely AA. A two process model of sleep regulation. Hum Neurobiol 1:195–204, 1982.
Borbely AA, Achermann P. Sleep homeostasis and models of sleep regula-tion. J Biol Rhythms 14: 557–568, 1999.
Brown RE, McKenna JT, Winston S, Basheer R, Yanagawa Y, ThakkarMM, McCarley RW. Characterization of GABAergic neurons in rapid-eye-movement sleep controlling regions of the brainstem reticular formationin GAD67-green fluorescent protein knock-in mice. Eur J Neurosci 27:352–363, 2008.
Brown RE, Winston S, Basheer R, Thakkar MM, McCarley RW. Elec-trophysiological characterization of neurons in the dorsolateral pontinerapid-eye-movement sleep induction zone of the rat: intrinsic membraneproperties and responses to carbachol and orexins. Neuroscience 143:739–755, 2006.
Carskadon MA, Dement WC. Normal human sleep: an overview. In: Prin-ciples and Practice of Sleep Medicine, edited by Kryger M, Roth T, DementWC. New York: Saunders, 2000, p. 15–25.
Chamberlin NL, Arrigoni E, Chou TC, Scammell TE, Greene RW, SaperCB. Effects of adenosine on gabaergic synaptic inputs to identified ventro-lateral preoptic neurons. Neuroscience 119: 913–918, 2003.
Datta S, Maclean RR. Neurobiological mechanisms for the regulation ofmammalian sleep-wake behavior: reinterpretation of historical evidence andinclusion of contemporary cellular and molecular evidence. Neurosci Biobe-hav Rev 31: 775–824, 2007.
Datta S, Siwek DF. Single cell activity patterns of pedunculopontine tegmen-tum neurons across the sleep-wake cycle in the freely moving rats. J Neu-rosci Res 70: 611–621, 2002.
Dayan P, Abbott LF. Theoretical Neuroscience: Computational and Mathe-matical Modeling of Neural Systems. Cambridge, MA: MIT Press, 2001.
Deco G, Jirsa VK, Robinson PA, Breakspear M, Friston K. The dynamicbrain: from spiking neurons to neural masses and cortical fields. PLoSComput Biol 4: e1000092, 2008.
Destexhe A, Contreras D, Sejnowski TJ, Steriade M. Modeling the controlof reticular thalamic oscillations by neuromodulators. Neuroreport 5: 2217–2220, 1994.
Diniz Behn CG, Brown EN, Scammell TE, Kopell NJ. A mathematicalmodel of network dynamics governing mouse sleep-wake behavior. J Neu-rophysiol 97: 3828–3840, 2007.
Dzirasa K, Ribeiro S, Costa R, Santos LM, Lin SC, Grosmark A, Sotni-kova TD, Gainetdinov RR, Caron MG, Nicolelis MA. Dopaminergiccontrol of sleep-wake states. J Neurosci 26: 10577–10589, 2006.
Egan TM, North RA. Acetylcholine acts on m2-muscarinic receptors toexcite rat locus coeruleus neurones. Br J Pharmacol 85: 733–735, 1985.
Egan TM, North RA. Acetylcholine hyperpolarizes central neurones byacting on an M2 muscarinic receptor. Nature 319: 405–407, 1986.
Ennis M, Shipley MT. Tonic activation of locus coeruleus neurons bysystemic or intracoerulear microinjection of an irreversible acetylcholines-terase inhibitor: increased discharge rate and induction of C-fos. Exp Neurol118: 164–177, 1992.
Ermentrout GB. Neural networks as spatio-temporal pattern-forming sys-tems. Rep Prog Phys 61: 353–430, 1998.
Gallopin T, Luppi PH, Cauli B, Urade Y, Rossier J, Hayaishi O, LambolezB, Fort P. The endogenous somnogen adenosine excites a subset ofsleep-promoting neurons via A2A receptors in the ventrolateral preopticnucleus. Neuroscience 134: 1377–1390, 2005.
Garris PA, Wightman RM. Different kinetics govern dopaminergic trans-mission in the amygdala, prefrontal cortex, and striatum: an in vivo volta-mmetric study. J Neurosci 14: 442–450, 1994.
Gerber U, Stevens DR, McCarley RW, Greene RW. Muscarinic agonistsactivate an inwardly rectifying potassium conductance in medial pontine
reticular formation neurons of the rat in vitro. J Neurosci 11: 3861–3867,1991.
Gervasoni D, Darracq L, Fort P, Souliere F, Chouvet G, Luppi PH.Electrophysiological evidence that noradrenergic neurons of the rat locuscoeruleus are tonically inhibited by GABA during sleep. Eur J Neurosci 10:964–970, 1998.
Gervasoni D, Peyron C, Rampon C, Barbagli B, Chouvet G, Urbain N,Fort P, Luppi PH. Role and origin of the GABAergic innervation of dorsalraphe serotonergic neurons. J Neurosci 20: 4217–4225, 2000.
Hobson JA, McCarley RW, Wyzinski PW. Sleep cycle oscillation: recipro-cal discharge by two brainstem neuronal groups. Science 189: 55–58, 1975.
Huang ZL, Urade Y, Hayaishi O. Prostaglandins and adenosine in theregulation of sleep and wakefulness. Curr Opin Pharmacol 7: 33–38, 2007.
Iijima K, Ohtomo K. Immunocytochemical study using a GABA antiserumfor the demonstration of inhibitory neurons in the rat locus ceruleus. Am JAnat 181: 43–52, 1988.
Jodo E, Chiang C, Aston-Jones G. Potent excitatory influence of prefrontalcortex activity on noradrenergic locus coeruleus neurons. Neuroscience 83:63–79, 1998.
Kalinchuk AV, McCarley RW, Stenberg D, Porkka-Heiskanen T, BasheerR. The role of cholinergic basal forebrain neurons in adenosine-mediatedhomeostatic control of sleep: lessons from 192 IgG-saporin lesions. Neuro-science 157: 238–253, 2008.
Kalsner S. Heteroreceptors, autoreceptors and other terminal sites. In: Pre-synaptic Receptors and the Question of Autoregulation of NeurotransmitterRelease, edited by Kalsner S, Westfall TC. New York: New York Academyof Sciences, 1990, p. 1–6.
Kawahara Y, Kawahara H, Westerink BH. Tonic regulation of the activityof noradrenergic neurons in the locus coeruleus of the conscious rat studiedby dual-probe microdialysis. Brain Res 823: 42–48, 1999.
Liu ZW, Gao XB. Adenosine inhibits activity of hypocretin/orexin neurons bythe A1 receptor in the lateral hypothalamus: a possible sleep-promotingeffect. J Neurophysiol 97: 837–848, 2007.
Lo CC, Chou T, Penzel T, Scammell TE, Strecker RE, Stanley HE, IvanovP. Common scale-invariant patterns of sleep-wake transitions across mam-malian species. Proc Natl Acad Sci USA 101: 17545–17548, 2004.
Lu J, Devor M, Saper C. A pontine tegmental flip-flop switch for regulationof REM sleep. Soc Neurosci Abst 895.896, 2004.
Lu J, Sherman D, Devor M, Saper CB. A putative flip-flop switch for controlof REM sleep. Nature 441: 589–594, 2006.
Luppi PH, Gervasoni D, Verret L, Goutagny R, Peyron C, Salvert D,Leger L, Fort P. Paradoxical (REM) sleep genesis: the switch from anaminergic-cholinergic to a GABAergic-glutamatergic hypothesis. J PhysiolParis 100: 271–283, 2006.
Lydic R, Baghdoyan HA. Pedunculopontine stimulation alters respiration andincreases ACh release in the pontine reticular formation. Am J Physiol 264:R544–R554, 1993.
Lydic R, Baghdoyan HA. Sleep, anesthesiology, and the neurobiology ofarousal state control. Anesthesiology 103: 1268–1295, 2005.
Lydic R, Baghdoyan HA. Acetylcholine modulates sleep and wakefulness: asynaptic perspective. In: Neurochemistry of Sleep and Wakefulness, editedby Monti JM, Pandi-Perumal SR, Sinton CM. Cambridge, MA: CambridgeUniversity Press, 2008, p. 109–143.
Lydic R, McCarley RW, Hobson JA. The time-course of dorsal raphedischarge, PGO waves, and muscle tone averaged across multiple sleepcycles. Brain Res 274: 365–370, 1983.
Mallick BN, Kaur S, Saxena RN. Interactions between cholinergic andGABAergic neurotransmitters in and around the locus coeruleus for theinduction and maintenance of rapid eye movement sleep in rats. Neuro-science 104: 467–485, 2001.
Massaquoi SG, McCarley RW. Extension of the limit cycle reciprocalinteraction model of REM cycle control. An integrated sleep control model.J Sleep Res 1: 138–143, 1992.
Masserano JM, King C. Effects on sleep of acetylcholine perfusion of thelocus coeruleus of cats. Neuropharmacology 21: 1163–1167, 1982.
McCarley RW, Hobson JA. Neuronal excitability modulation over the sleepcycle: a structural and mathematical model. Science 189: 58–60, 1975.
Morairty S, Rainnie D, McCarley R, Greene R. Disinhibition of ventrolat-eral preoptic area sleep-active neurons by adenosine: a new mechanism forsleep promotion. Neuroscience 123: 451–457, 2004.
Nakamura T, Uramura K, Nambu T, Yada T, Goto K, Yanagisawa M,Sakurai T. Orexin-induced hyperlocomotion and stereotypy are mediatedby the dopaminergic system. Brain Res 873: 181–187, 2000.
1952 C. G. DINIZ BEHN AND V. BOOTH
J Neurophysiol • VOL 103 • APRIL 2010 • www.jn.org
on July 28, 2010 jn.physiology.org
Dow
nloaded from
Nitz D, Siegel J. GABA release in the dorsal raphe nucleus: role in the controlof REM sleep. Am J Physiol 273: R451–R455, 1997.
Osmanovic SS, Shefner SA. gamma-Aminobutyric acid responses in rat locuscoeruleus neurones in vitro: a current-clamp and voltage-clamp study.J Physiol 421: 151–170, 1990.
Peyron C, Tighe DK, van den Pol AN, de Lecea L, Heller HC, Sutcliffe JG,Kilduff TS. Neurons containing hypocretin (orexin) project to multipleneuronal systems. J Neurosci 18: 9996–10015, 1998.
Phillips AJ, Robinson PA. A quantitative model of sleep-wake dynamicsbased on the physiology of the brainstem ascending arousal system. J BiolRhythms 22: 167–179, 2007.
Phillips AJ, Robinson PA. Sleep deprivation in a quantitative physiologicallybased model of the ascending arousal system. J Theor Biol 255: 413–423,2008.
Porkka-Heiskanen T, Strecker RE, McCarley RW. Brain site-specificity ofextracellular adenosine concentration changes during sleep deprivation and spon-taneous sleep: an in vivo microdialysis study. Neuroscience 99: 507–517, 2000.
Porkka-Heiskanen T, Strecker RE, Thakkar M, Bjorkum AA, GreeneRW, McCarley RW. Adenosine: a mediator of the sleep-inducing effects ofprolonged wakefulness. Science 276: 1265–1268, 1997.
Portas CM, Thakkar M, Rainnie DG, Greene RW, McCarley RW. Role ofadenosine in behavioral state modulation: a microdialysis study in the freelymoving cat. Neuroscience 79: 225–235, 1997.
Rainnie DG, Grunze HC, McCarley RW, Greene RW. Adenosine inhibi-tion of mesopontine cholinergic neurons: implications for EEG arousal.Science 263: 689–692, 1994.
Rempe MJ, Best J, Terman D. A mathematical model of the sleep/wakecycle. J Math Biol doi:10.1007/s00285-009-0276-5.
Rye D, Jankovic J. Emerging views of dopamine in modulating sleep/wakestate from an unlikely source: PD. Neurology 58: 341–346, 2002.
Saper CB, Chou TC, Scammell TE. The sleep switch: hypothalamic controlof sleep and wakefulness. Trends Neurosci 24: 726–731, 2001.
Saper CB, Scammell TE, Lu J. Hypothalamic regulation of sleep andcircadian rhythms. Nature 437: 1257–1263, 2005.
Sapin E, Lapray D, Berod A, Goutagny R, Leger L, Ravassard P, ClementO, Hanriot L, Fort P, Luppi PH. Localization of the brainstem GABAergicneurons controlling paradoxical (REM) sleep. PLoS One 4: e4272, 2009.
Starke K, Gothert M, Kilbinger H. Modulation of neurotransmitter releaseby presynaptic autoreceptors. Physiol Rev 69: 864–989, 1989.
Steriade M, Datta S, Pare D, Oakson G, Curro Dossi RC. Neuronalactivities in brain-stem cholinergic nuclei related to tonic activation pro-cesses in thalamocortical systems. J Neurosci 10: 2541–2559, 1990.
Steyn-Ross DA, Steyn-Ross ML, Sleigh JW, Wilson MT, Gillies IP, WrightJJ. The sleep cycle modelled as a cortical phase transition. J Biol Phys 31:547–569, 2005.
Szymusiak R, Alam N, Steininger TL, McGinty D. Sleep-waking dischargepatterns of ventrolateral preoptic/anterior hypothalamic neurons in rats.Brain Res 803: 178–188, 1998.
Tamakawa Y, Karashima A, Koyama Y, Katayama N, Nakao M. A quartetneural system model orchestrating sleep and wakefulness mechanisms.J Neurophysiol 95: 2055–2069, 2006.
Thakkar MM, Strecker RE, McCarley RW. Behavioral state controlthrough differential serotonergic inhibition in the mesopontine cholinergicnuclei: a simultaneous unit recording and microdialysis study. J Neurosci18: 5490–5497, 1998.
Thakkar MM, Winston S, McCarley RW. A1 receptor and adenosinergichomeostatic regulation of sleep-wakefulness: effects of antisense to the A1receptor in the cholinergic basal forebrain. J Neurosci 23: 4278–4287,2003.
Thannickal TC, Moore RY, Nienhuis R, Ramanathan L, Gulyani S,Aldrich M, Cornford M, Siegel JM. Reduced number of hypocretinneurons in human narcolepsy. Neuron 27: 469–474, 2000.
Trulson ME, Jacobs BL. Raphe unit activity in freely moving cats: correla-tion with level of behavioral arousal. Brain Res 163: 135–150, 1979.
Van Dort CJ, Baghdoyan HA, Lydic R. Adenosine A(1) and A(2A) recep-tors in mouse prefrontal cortex modulate acetylcholine release and behav-ioral arousal. J Neurosci 29: 871–881, 2009.
Vanni-Mercier G, Sakai K, Lin JS, Jouvet M. Mapping of cholinoceptivebrainstem structures responsible for the generation of paradoxical sleep inthe cat. Arch Ital Biol 127: 133–164, 1989.
Watson CJ, Venton BJ, Kennedy RT. In vivo measurements of neurotrans-mitters by microdialysis sampling. Anal Chem 78: 1391–1399, 2006.
Weitzman ED, Czeisler CA, Zimmerman JC, Ronda J. The timing of REMsleep and its relation to spontaneous awakenings during temporal isolationin man. Sleep Res 9: 280, 1980.
Wilson HR, Cowan JD. Excitatory and inhibitory interactions in localizedpopulations of model neurons. Biophys J 12: 1–24, 1972.
Wilson MT, Steyn-Ross DA, Sleigh JW, Steyn-Ross ML, Wilcocks LC,Gillies IP. The K-complex and slow oscillation in terms of a mean-fieldcortical model. J Comput Neurosci 21: 243–257, 2006.
Wilson MT, Steyn-Ross ML, Steyn-Ross DA, Sleigh JW. Predictions andsimulations of cortical dynamics during natural sleep using a continuumapproach. Phys Rev E Stat Nonlin Soft Matter Phys 72: 051910, 2005.
Wu MF, Gulyani SA, Yau E, Mignot E, Phan B, Siegel JM. Locuscoeruleus neurons: cessation of activity during cataplexy. Neuroscience 91:1389–1399, 1999.
Wu MF, John J, Boehmer LN, Yau D, Nguyen GB, Siegel JM. Activity ofdorsal raphe cells across the sleep-waking cycle and during cataplexy innarcoleptic dogs. J Physiol 554: 202–215, 2004.
1953NOVEL MODEL OF RAT SLEEP-WAKE REGULATORY NETWORK
J Neurophysiol • VOL 103 • APRIL 2010 • www.jn.org
on July 28, 2010 jn.physiology.org
Dow
nloaded from