Embed Size (px)
Citation preview

CDP CDP 2016 Climate Change 2016 Information Request
JBS S/A
Module: Introduction
Page: Introduction
CC0.1
Introduction
Please give a general description and introduction to your organization. JBS SA is a food Company with 62 years of tradition and global leader in animal protein processing. Operating in more than 15 countries, the Company serves a base of more than 350,000 customers in over 150 countries through a diverse portfolio of products and brands. Headquartered in Brazil, JBS has approximately 230,000 employees – from factories to sales offices. The structure involves processing units of cattle, pigs, sheep, poultry, leather, and confinement of cattle and sheep. JBS is present in five continents with factories and offices in Brazil, United States, Australia, Canada, Italy, Argentina, Uruguay, Paraguay, Mexico, China, UK and others operating in the segments of beef, pork, lamb and chicken, production and marketing of leather, pet products, hygiene and cleanliness, cans, collagen, biodiesel, transportation and vegetables and are incorporated into its business management the search for modernization, quality of products and raw materials, as well as the establishment of better relationships with partners, customers, employees and society, the satisfaction of its shareholders and the commitment to social and environmental responsibility issues. The Company's main customers are retail chains, wholesale clubs and companies in the food service industry - restaurants, hotels, food service distributors and further processors. With an annual net income of BRL 162.9 billion, JBS is positioned as the largest animal protein Company in the world, with a strong presence in the most competitive production regions on earth. The Company divides its operations among JBS Mercosul, JBS Europa, JBS Foods and JBS USA – whose subdivisions are JBS USA Beef, JBS USA Pork, Pilgrim’s Pride and JBS Australia. More information can be found in the official JBS site (http://www.jbs.com.br) and in the JBS 2015 Annual and Sustainability Report (http://relatorioanual.jbs.com.br).
CC0.2
Reporting Year
Please state the start and end date of the year for which you are reporting data. The current reporting year is the latest/most recent 12-month period for which data is reported. Enter the dates of this year first.

We request data for more than one reporting period for some emission accounting questions. Please provide data for the three years prior to the current reporting year if you have not provided this information before, or if this is the first time you have answered a CDP information request. (This does not apply if you have been offered and selected the option of answering the shorter questionnaire). If you are going to provide additional years of data, please give the dates of those reporting periods here. Work backwards from the most recent reporting year. Please enter dates in following format: day(DD)/month(MM)/year(YYYY) (i.e. 31/01/2001).
Enter Periods that will be disclosed
Thu 01 Jan 2015 - Thu 31 Dec 2015
CC0.3
Country list configuration
Please select the countries for which you will be supplying data. If you are responding to the Electric Utilities module, this selection will be carried forward to assist you in completing your response.
Select country
Brazil
Australia
Argentina
Canada
China
United States of America
Mexico
Puerto Rico
Uruguay
Germany
Paraguay
Ireland
United Kingdom

Select country
France
Italy
CC0.4
Currency selection
Please select the currency in which you would like to submit your response. All financial information contained in the response should be in this currency. BRL(R$)
CC0.6
Modules
As part of the request for information on behalf of investors, electric utilities, companies with electric utility activities or assets, companies in the automobile or auto component manufacture sub-industries, companies in the oil and gas sub-industries, companies in the information technology and telecommunications sectors and companies in the food, beverage and tobacco industry group should complete supplementary questions in addition to the main questionnaire. If you are in these sector groupings (according to the Global Industry Classification Standard (GICS)), the corresponding sector modules will not appear below but will automatically appear in the navigation bar when you save this page. If you want to query your classification, please email [email protected]. If you have not been presented with a sector module that you consider would be appropriate for your company to answer, please select the module below. If you wish to view the questions first, please see https://www.cdp.net/en-US/Programmes/Pages/More-questionnaires.aspx.
Further Information
Module: Management
Page: CC1. Governance
CC1.1

Where is the highest level of direct responsibility for climate change within your organization?
Board or individual/sub-set of the Board or other committee appointed by the Board
CC1.1a
Please identify the position of the individual or name of the committee with this responsibility
(i) Sustainability Committee Board. (ii) Created in 2008, the Sustainability Committee was reformulated in 2013, following the governance restructure in the Company, to advise the Board of Directors regarding the risks and opportunities in sustainability initiatives. From this reformulation, the committee is composed by six members of the senior management (including Company’s CEO), which has contributed to the engagement of JBS with the issues related to the environment and climate change and chaired by the representative of the BNDES (Brazilian Development Bank) João Carlos Ferraz. In order to review the progress of the proposed actions the committee performs quarterly meetings and the results are reported to the Board. The Sustainability Committee Board is responsible for dealing with and connecting all subjects related to the topic of sustainability and climate change in the Company's business in a global perspective, such as: identification, evaluation and treatment of critical issues that result in risks and business impact; monitoring and implementation of policies, strategies and specific actions; and evaluation of proposals for investments in sustainability with positive impacts in the short, medium and long run. Moreover, the focuses of the committee are i) integrating the JBS sustainability culture and practices in the recent acquired companies and ii) create a sustainability framework at a global level to set guidelines regarding both the supply chain (cattle purchase programs and actions on the poultry chain) and processing products (internal environmental improvements and eco-efficiency). Besides, JBS also has a corporate team dedicated to the Sustainability issues, including climate change strategy and projects, and trained professionals - environmental analysts in all production units, ensuring the unique tracking ahead to the issues of Sustainability.
CC1.2
Do you provide incentives for the management of climate change issues, including the attainment of targets?
Yes
CC1.2a
Please provide further details on the incentives provided for the management of climate change issues

Who is entitled to benefit from these incentives?
The type of incentives
Incentivized performance
indicator
Comment
Environment/Sustainability managers Monetary reward
Emissions reduction project Energy reduction project Energy reduction target Efficiency project Efficiency target
The beef business units have targets for implementation of the environmental management system (NBR ISO 14001:2004), which contains targets for water consumption, wastewater treatment, environmental compliance and by-product recovery in wastewater treatment plant (number of indicators related to production). The recovery of the by-product effluent treatment plant reduces emissions by reducing organic carbon (COD – Chemical Oxygen Demand) in the effluent and thus the potential for formation of methane in the wastewater treatment steps that follow. Moreover JBS Foods also have environmental targets for wastewater treatment efficiency (COD), solid waste and water consumption. These goals are related to JBS’s program of annual bonus.
Facility managers Monetary reward
Emissions reduction project Efficiency project Efficiency target
The beef business units have targets for implementation of the environmental management system (NBR ISO 14001:2004), which contains targets for water consumption and by-product recovery in wastewater treatment plant (number of indicators related to production). The recovery of the by-product effluent treatment plant reduces emissions by reducing organic carbon (COD) in the effluent and thus the potential formation of methane in the wastewater treatment steps that follow. In 2014, JBS set a target for water consumption (intensity indicator / consumption per tonnes produced, applicable for facility managers and also Corporative Manager of Engineering and Operations Director. JBs expect that this target can also reduce GHG emissions through reductions in wastewater generation and treatment and reduction in energy consumption due to water pumping. Moreover JBS Foods also have environmental targets for wastewater treatment efficiency (COD), solid waste and water consumption. These goals are related to JBS’s program of annual bonus.
Other: Regional environmental coordinators and facilities environmental supervisor
Monetary reward
Emissions reduction project Efficiency project Efficiency target
The beef business units have targets for implementation of the environmental management system (NBR ISO 14001:2004), which contains targets for water consumption and by-product recovery in wastewater treatment plant (number of indicators related to production). The recovery of the by-product effluent treatment plant reduces emissions by reducing organic carbon (COD) in the effluent and thus the potential formation of methane in the wastewater treatment steps that follow. Moreover JBS Foods also have environmental targets for wastewater treatment efficiency (COD), solid waste and water consumption. These goals are related to JBS’s program of annual bonus.

Further Information
Page: CC2. Strategy
CC2.1
Please select the option that best describes your risk management procedures with regard to climate change risks and opportunities
Integrated into multi-disciplinary company wide risk management processes
CC2.1a
Please provide further details on your risk management procedures with regard to climate change risks and opportunities
Frequency of monitoring
To whom are results
reported?
Geographical
areas considered
How far into
the future are risks
considered?
Comment
Six-monthly or more frequently
Board or individual/sub-set of the Board or committee appointed by the Board
All areas where JBS has operations.
> 6 years
The process of risks and opportunities identification is under the responsibility of the Sustainability Direction, which reports to the Sustainability Committee, appointed by the Board. To evaluate the risks and opportunities within the Company, in relation to climate change, the process follows a methodology issued by the Sustainability Committee. The Sustainability Committee meets every quarter, where major advances and new opportunities and risks identified are evaluated. It reports to the Board, and the guidelines are forwarded to the technical team developing the necessary actions.
CC2.1b
Please describe how your risk and opportunity identification processes are applied at both company and asset level

The process of risk and opportunity identification is under the responsibility of the Sustainability Direction, which reports to the Sustainability Committee. To evaluate the climate change risks and opportunities within the Company and asset level, the process follows a methodology issued by the Sustainability Committee, which includes mapping and description of risks and opportunities, performed by the Technical Team and analysis and prioritization of mapped risks and opportunities and the evaluation and study to transform the risk into opportunities. The Sustainability Committee meets every quarter, where major advances and new opportunities and risks identified are evaluated. It reports to the Board, and the guidelines are forwarded to the technical team developing the necessary actions. In the asset level, each manager is responsible for monitoring the environmental legislation of their region / country and establishes measures for compliance. Climate change risk and opportunity assessment are directly linked with JBS operations performance, since the price raising and availability of commodities, for example, are direct linked to the possibility of energy restrictions, due to water scarcity. In 2015, the continuous improvement of JBS’s Sustainability management took the decision of promoting a meeting involving the Sustainability leaders from every business unit, which was held in Brazil, on February 2016. The meeting aimed to strengthen JBS climate change strategy, comprising corporate actions about related risks and opportunities, promoting a broad discussion of each region climate change and sustainability prioritize issues, knowledge sharing and present business cases.
CC2.1c
How do you prioritize the risks and opportunities identified?
To evaluate and prioritize the risks and opportunities within the Company (Company and asset level) in relation to climate change, as already mentioned in the previously question, the process follows a methodology issued by the Sustainability Committee in which its main steps are described below: (a) Description of risks and opportunities identified, the mapping process is performed by the Technical Team; (b) Analysis of mapped Risks and Opportunities and their prioritization. This step is based on business impact and likelihood of occurrence: i) Each risk or opportunity is classified as a consequence of its impact on business and its likelihood of occurrence. It is developed under three different scenarios: short, medium and long term. ii) The Sustainability Committee focuses the Action Plan on the short-term scenario with risks / opportunities classified as high impact to business and high probability of occurrence or medium and high likelihood or high and medium probability impact. In the scenarios of medium and long term, only the risks / opportunities classified with high business impact and high probability of occurrence are the object of attention of the Sustainability Committee; (c) The risks are studied to be transformed into opportunities; The criteria for priorities are determined by assessing the impact of the risk and the probability of occurrence. The Sustainability Committee evaluates the results. The identified opportunities for GHG emission reduction are assessed considering the additionally and the potential for emission reduction, therefore these both criteria are considered for decision making of Sustainability Committee. Moreover, the investments decisions are based also on the legal requirements, pay back and environmental benefits. The unit size is also take in consideration, due to its greater potential impact / benefit to the environment.
CC2.1d

Please explain why you do not have a process in place for assessing and managing risks and opportunities from climate change, and whether you plan to introduce such a process in future
Main reason for not having a process
Do you plan to introduce a process?
Comment
CC2.2
Is climate change integrated into your business strategy?
Yes
CC2.2a
Please describe the process of how climate change is integrated into your business strategy and any outcomes of this process
Climate change is a priority issue and is comprised into JBS’s business strategy. It may poses risks to operations, since resources such as water and animal feed are critical to the production of raw material and, therefore, are very sensitive to climate change, which may negatively influence the Company's business. In addition, new laws and regulations have been created because of climate change, which consequences may affect the Company's business. So, it is important to point out the following: i)JBS has an Environmental Policy being aware of its responsibility, as well as monitoring all the impacts generated by its operations in each region. JBS focuses on the entire production chain on the implementation of its strategy, which must be aligned with its Environmental Policy, so that its processes are always based on the environment and strategies to mitigate the environmental impacts of their activities. JBS policy established the commitment of pollution prevention, compliance with legal requirements, setting objectives and targets for continuous improvement in processes and optimization of natural resources. Thus, among the goals and targets set by the Company, the responsibility on climate change is considered ii)The JBS sustainability initiatives are divided between suppliers and industrial processes. The climate change aspects that guide JBS are based on physics, financial, regulatory and image risks that might interfere negatively in its operation. Based on these aspects, JBS supported and developed the following initiatives: good practices in agribusiness, hiring legal cattle suppliers according to JBS' social and environmental criteria, industrial processes, legal compliance, improvement in industrial projects and eco efficiency projects iii)The main aspects of climate change which has been influencing JBS strategy are those related to regulatory issues and the mitigation of impacts which contributes to climate change. Its strategy comprises mechanisms that fully monitors and complies with the related legislation, and, further, it allows JBS to develop programs and action plans that aims reducing its impacts along its supply chain iv)Components of climate change that have influenced its short term business strategy: In order to measure the climate change impacts due to JBS’s activities, since 2009 JBS performs annually its GHG Emissions Inventory, which is an instrument to measure the emissions of GHG from its operations in Brazil, which accounts for direct and indirect emissions. From the year 2012, JBS expanded this measurement to its operations worldwide. In 2013, JBS became a member of the GHG
Protocol Brazil Program, through the publication of its GHG Emissions Inventory. The Company also participates in other voluntary initiatives for reporting information regarding GHG emissions and the management and strategy related to climate change, as the ICO2 Carbon Efficiency Index of BM&FBOVESPA and in the Climate Change Protocol of São Paulo State Government Besides, JBS participated in the Technical Working Group Scope 3 of the GHG Protocol Brazil Program (development of auxiliary tool for GHG emissions in ground transportation and distribution – available in 2016) and the Agriculture GHG Protocol. Through a partnership with WRI, JBS developed a training program for the application of calculation tool tests for cattle suppliers. Currently, the tool is being used, as a test, by JBS supplier’s farms located in the state of Mato Grosso, which participates in the “New Field Program”, developed by JBS in partnership with other institutions v)Components of climate change that have influenced its long term business strategy: JBS intends to include all sectors of its supply chain worldwide in its GHG emission inventory and also to promote the mitigation of JBS and its supply chain emissions. Therefore, JBS’s aims to reduce directly and indirectly climate change impacts due to JBS’s activities. Based on that, different initiatives have been developed and supported by JBS, as the New Field Program under the coordination of the Brazilian NGO Instituto Centro de Vida (ICV) to promotes sustainable cattle raising in the Amazon biome, developing production models that improve management, increase productivity, increment quality in the product delivered to the market, reduce emissions of greenhouse gases in the production system (avoided deforestation, energy efficiency targets, improving the wastewater treatment process and logistics, etc.) and comply with environmental legislation vi) Currently, JBS has a better understanding of the risks and opportunities related to climate change. Therefore, we consider ourselves more prepared to the possible climate change impacts; so, we take advantage of the opportunities and we believe this represents a strategic advantage. For example, we were the first Company of our sector with a CDM project registered on UNFCCC and one of the pioneers on elaborating GHG emissions inventory in Brazil. Moreover, JBS are investing in new technologies to reduce emissions of greenhouse gases. JBS also supports and funds organizations through partnerships regarding the development and implementation of industry’s best practices, making their operations more efficient and incorporating princip les of sustainability into their operations and seeking constant innovation and development of their business vii)In 2015, JBS set up some emissions reduction targets. Initially, it was decided that the energy efficiency projects were the most feasible efficient monitoring plan to start with. In order to evolve on the issue, JBS participates as an active member of EPC (“Empresas pelo Clima” - Business for the Climate Platform), a continuous Brazilian business platform, whose goal is to mobilize, engage and involve corporate leaderships for managing and reducing GHG emissions, managing climate risks, and suggesting public policies and positive incentives in the context of climate change viii)JBS is fully committed against deforestation, which is an action that complies with regulatory issues and, it is also an opportunity to develop green business. One of JBS public commitments and most substantial business decision is the engagement in combating deforestation. Therefore, practical actions have also been applied in policy and in the livestock sector of our cattle suppliers. JBS prepared internal guidelines on the cattle purchase from the Amazon biome, pledging to purchase cattle only from farms that are in regularity with social, environmental and land standards. To ensure its raw materials are sourced from responsible suppliers, JBS has developed a system for social and environmental monitoring of cattle suppliers. This Monitoring System is annually audited, to ensure compliance with the Company's commitments to sustainability ix)Finally, in 2015 JBS invested roughly BRL700 million in environmental protection projects aligned with its climate change strategy.
CC2.2b
Please explain why climate change is not integrated into your business strategy
CC2.2c

Does your company use an internal price of carbon?
No, but we anticipate doing so in the next 2 years
CC2.2d
Please provide details and examples of how your company uses an internal price of carbon
CC2.3
Do you engage in activities that could either directly or indirectly influence public policy on climate change through any of the following? (tick all that apply)
Direct engagement with policy makers Trade associations Funding research organizations Other
CC2.3a
On what issues have you been engaging directly with policy makers?
Focus of legislation
Corporate Position
Details of engagement
Proposed legislative solution
Energy efficiency
Support with major exceptions
Consultation responses directly and through lobby bodies CBI (Confederation of British Industry) and BPC (British Polling Council).
JBS, through its subsidiary in UK Moypark, actively engages directly with policy makers. The environmental issues and awareness is very effective in Europe, which demands Company tighten its actions in relation to the risks and opportunities of its business (each topic of "Focus of legislation cited in this question refers to Moypark engaging directly with policy makers). For this energy efficiency issue, Moypark is supporting an UK Energy tax reform.
Energy efficiency
Support with minor exceptions
Energy Saving Opportunity Scheme(ESOS) consultation response.
ESOS review.

Focus of legislation
Corporate Position
Details of engagement
Proposed legislative solution
Cap and trade
Support with minor exceptions
EU ETS Consultation response. EU ETS reform.
Cap and trade
Oppose Climate Change Agreement (CCA) consultation response.
CCA review.
Carbon tax Support with minor exceptions
Carbon Reduction Commitment (CRC) simplification consultation response.
CRC scheme reform.
CC2.3b
Are you on the Board of any trade associations or provide funding beyond membership?
Yes
CC2.3c
Please enter the details of those trade associations that are likely to take a position on climate change legislation
Trade association
Is your position on
climate change
consistent with theirs?
Please explain the trade association's
position
How have you, or are you attempting to, influence the position?
JBS Five Rivers, a business unit from JBS USA, is on the Board and Executive Committee of National Cattlemen’s Beef Association (NCBA), Texas Cattle Feeders Association and Colorado Livestock Association.
Consistent
Five Rivers’ position would be consistent with these trade associations.
In essence, JBS Five Rivers, as a board and executive committee member, supports and tries to amplify the development of accurate greenhouse gas emissions data for domestic cattle production systems based on sound science, develops a communication strategy that addresses inaccuracies regarding greenhouse gas emissions from cattle and accurately states the greenhouse gas emissions of domestic cattle production systems and supports unlimited offsets for agriculture.

CC2.3d
Do you publicly disclose a list of all the research organizations that you fund?
Yes
CC2.3e
Please provide details of the other engagement activities that you undertake
JBS is part of the Board of The Global Roundtable for Sustainable Beef (GRSB), a global, multi-stakeholder initiative developed to advance continuous improvement in sustainability of the global beef value chain through leadership, science and multi-stakeholder engagement and collaboration. The GRSB envisions a world in which all aspects of the beef value chain are environmentally sound, socially responsible and economically viable. In the same way, JBS is also part of the Board of The Brazilian Roundtable on Sustainable Livestock (BRSL) which its main goal is to discuss and formulate, in a transparent manner, principles, standards and common practices to be adopted by the sector, which contribute to the development of a sustainable cattle ranching, socially just, environmentally friend and economically viable. With the policy of not acquiring cattle and soy from farms listed among the IBAMA (Brazilian Institute of the Environment) areas of illegal deforestation, JBS works through ABIEC - Brazilian Beef Exporters Association and the sector of grains (ABIOVE - Brazilian Oilseed Processors Association) to improve the public list of illegal deforestation areas. Because of these efforts, in 2012 the GT-IBAMA (IBAMA Working Group) was created, in order to propose solutions to operational improvements relating to the public list of areas embargoed by IBAMA. This joint work in partnership with the productive sector and technicians from IBAMA has led to continuous improvement of the IBAMA list as a query tool for companies that establishes environmental criteria for their suppliers. Moreover, the Company is often involved in events, participation in seminars and multi-stakeholders meetings that JBS is requested to provide information on the policies and procedures related to social responsibility and corporate sustainability, including climate change. In 2015, JBS became an active member of EPC (“Empresas pelo Clima” - Business for the Climate Platform), a continuous Brazilian business platform, whose goal is to mobilize, engage and involve corporate leaderships for managing and reducing GHG emissions, managing climate risks, and suggesting public policies and positive incentives in the context of climate change. EPC is seeking proper financial and economical mechanisms for mitigation and adaption on climate change. Since 2013, JBS became a member of the Brazilian GHG Protocol Program, through the publication of its Inventory of Emissions of Greenhouse Gases in the Public Registry of Emissions Platform. The Company also participates in other initiatives for reporting information regarding GHG emissions and the management strategy and related climate change, such as the CDP - Driving Sustainable Economies and the Carbon Efficient Index (ICO2) of BM&FBOVESPA and the Climate Change Protocol of São Paulo State Government. Besides, JBS has participated in the Scope 3 Technical Working Group of the Brazilian GHG Protocol Program, for further discussion and development of auxiliary tool for calculating emissions from transportation. JBS also contributed to the Working Group of the Agriculture GHG Protocol, which developed a tool with a new metric for calculating carbon emissions by the agribusiness sector, seeking to adapt to the Brazilian reality the indicators used worldwide (countries of temperate climate) currently in agricultural measurement. Every JBS’s voluntary commitments, projects and partnerships with these institutions (funding, co-working, institutional support) against deforestation, decrease on greenhouse gases emissions and toward sustainability that have the potential to influence public policies on climate change meets the need established by the Brazilian Government on its National Policy on Climate Change (2008). The National Plan on Climate Change is established through two plans: the Prevention and Control Action Plans of deforestation in the biomes, and the Department of Mitigation and Adaptation.

CC2.3f
What processes do you have in place to ensure that all of your direct and indirect activities that influence policy are consistent with your overall climate change strategy?
To ensure that all JBS’s engagements are consistent with the overall climate change strategy, the Sustainability Committee Board is responsible for dealing with and connecting all subjects related to the topic of sustainability and climate change in the Company's business in a global perspective, such as: identification, evaluation and treatment of critical issues that result in risks and business impact; monitoring and implementation of policies, strategies and specific actions and evaluation of proposals for investments in sustainability. The Sustainability and climate change strategy of JBS is focused on both the supply chain (cattle purchase programs and actions on the poultry chain and swine chain) and processing products (internal environmental improvements and eco-efficiency). Regarding the supply chain and based on the best practices in agribusiness, the main strategies adopted by JBS’s Sustainability Committee to promote the Sustainable Farming Program in Brazil are related to decreased pressure on new pastures and thus contributing to reduce deforestation, and consequently to reduce CO2 emissions. Following this strategy, since 2010, we have been supported EMBRAPA (Brazilian Corporation of Agricultural Research) for developing a Technical Cooperation Agreement to inform and support farmers in implementing best practices in agribusiness and sustainable use of natural resources involved in production. Also, the New Field Project aims to promote sustainable cattle raising in the Amazon biome, developing production models that improve management, increase productivity, increment quality in the product delivered to the market, reduce emissions of greenhouse gases in the production system (mainly avoided deforestation) and comply with environmental legislation. Every supplier must present the approved License of Operation, which guarantee the compliance of the facilities with the demands of the environmental bodies. Moreover, in relation to the System for social and environmental monitoring of cattle suppliers implemented in the Amazon region, a public commitment assumed by JBS whether one supplier falls within any of the list of embargoed cattle producers and/or whether deforestation is identified in conservation areas, the trade is cancelled, thus preventing the acquisition of raw materials from deforestation. Every year the Company is audited by a third party and publishes the results about its endeavour against deforestation. Up to this moment, the available data refers to 2014, when JBS achieved a compliance level of 99.97%, higher than the result for 2013, which was 99.75%. The 2015 audit was in progress at the moment of CDP report and its results will be made available in JBS site. Thus, JBS has a policy of only buying soy products from companies that are signatories of the Soy Moratorium. an initiative launched by ABIOVE (Brazilian Association of Vegetable Oil Industries) and ANEC (National Association of Cereal Exporters), operationalized by the GTS (Soy Working Group), entity formed by rural producers and national and international NGOs. By this agreement, participants commit to not purchase soy produced in land deforested after 2006, including direct and indirect soy suppliers. This is a result of the company's public commitment to not purchase raw materials from farms that have deforested native forests in the Amazon Biome that are located within Indigenous Lands and Environmental Conservation Areas or have used work practices that are degrading or analogue to slavery. JBS also requires the poultry and pork suppliers to present its environmental licensing and instructed them to perform composting of the organic waste produced by the farms. Moreover, the pork suppliers are also encouraged to put in place a wastewater treatment. Both initiatives encourage the suppliers to reduce their GHG emissions. Besides that, according to the JBS Sustainability policy, JBS commitment to sustainability is evidenced by the manner in which the relationships are established with willing partners who seek to make a positive impact throughout its value chain.
CC2.3g
Please explain why you do not engage with policy makers

Further Information
0
Page: CC3. Targets and Initiatives
CC3.1
Did you have an emissions reduction or renewable energy consumption or production target that was active (ongoing or reached completion) in the reporting year?
Intensity target
CC3.1a
Please provide details of your absolute target
ID
Scope
% of emissions in
scope
% reduction from base year
Base year
Base year emissions covered by
target (metric tonnes CO2e)
Target year
Is this a science-
based target?
Comment
CC3.1b
Please provide details of your intensity target

ID
Scope
% of emissions in scope
% reduction
from base year
Metric
Base year
Normalized base year emissions covered by
target
Target year
Is this a science-based target?
Comment
Int1 Scope 2 (location-based)
10% 3%
Other: kg CO2e per tonne of product – JBS Foods
2014 40.66 2015
No, but we anticipate setting one in the next 2 years
JBS elaborates its GHG Emissions Inventory since 2009. After six years understanding the profile of its emissions, the Company decided to set its first GHG emissions target as an experimental first measurement. Moreover, it is a reinforcement towards its Climate Change strategy guidelines and a run up for mitigation of risks and seize the opportunities mapped for climate change. For this purpose, JBS had chosen the GHG emissions sources that had a good quality data and the best-consolidated management framework including a processes innovation culture. Therefore, JBS Foods (Poultry Processing Plants) – Scope 2 was chosen as the emissions sources for setting the first Company’s GHG emissions reduction target. By this moment, setting its first GHG emissions reduction target did not mean any external commitment by the Company, but just an internal Climate Change issue management procedure. In relation to a science-based target, JBS expects to set one according to the evolution of the definitions towards the Brazilian Emissions Trading Scheme through EPC (Business for the Climate Platform), even in an experimental way. It is clear that any target decision for the Companies must be science-based, a fact that promotes more credibility to it.
CC3.1c
Please also indicate what change in absolute emissions this intensity target reflects

ID
Direction of change
anticipated in absolute Scope
1+2 emissions at target
completion?
% change anticipated in absolute Scope 1+2 emissions
Direction of change
anticipated in absolute Scope 3 emissions at
target completion?
% change anticipated in absolute
Scope 3 emissions
Comment
Int1 Increase 35.53
For JBS Foods, absolute emissions increased by 35.53%, even with the reduction of GRID Emission Factor of 8.92%, due to the increase in production of 55.45% (tonnes produced). If the target set had not been overcome, for the same level of production, absolute emissions for JBS Foods should increase by 5.30%.
CC3.1d
Please provide details of your renewable energy consumption and/or production target
ID
Energy types
covered by target
Base year
Base year energy for energy type covered
(MWh)
% renewable
energy in base year
Target year
% renewable
energy in target year
Comment
CC3.1e
For all of your targets, please provide details on the progress made in the reporting year

ID
% complete
(time)
% complete (emissions or
renewable energy)
Comment
Int1 100% 100%
There are two scenarios of GRID emission factor for measurement and follow up: 1) 2014 GRID emission factor (0.1355 tCO2/MWh): in this scenario, considering the same GRID emission factor for 2014 and 2015 (same comparison basis), the target was overcame (GHG emissions 2.8% lower than the target). 2) 2015 GRID emission factor (0.1244): in this scenario, the target was also overcame (GHG emissions 10.8% lower than the target).
CC3.1f
Please explain (i) why you do not have a target; and (ii) forecast how your emissions will change over the next five years
CC3.2
Do you classify any of your existing goods and/or services as low carbon products or do they enable a third party to avoid GHG emissions?
Yes
CC3.2a
Please provide details of your products and/or services that you classify as low carbon products or that enable a third party to avoid GHG emissions

Level of
aggregation
Description of product/Group of
products
Are you
reporting low carbon product/s or avoided emissions?
Taxonomy, project or
methodology used to classify
product/s as low carbon or to calculate
avoided emissions
%
revenue from low carbon
product/s in the
reporting year
% R&D in
low carbon
product/s in the
reporting year
Comment
Product
With biodiesel produced by JBS Biodiesel using beef tallow, JBS contributed to reducing emissions from third parties scope 1 regarding the use of fossil fuels. In 2015, JBS produced approximately 170 million liters (149.6 thousand tonnes) of biodiesel from animal and plant oils. Since 2012, with the production of biodiesel, it is estimated that were avoided the emission of around 417,918 tCO2, that would be emitted if diesel were employed. The estimations were performed considering the amount of energy that would be generated by biodiesel (amount of biodiesel x net calorific value of biodiesel – 149,600.00 tones x 0.0377 TJ/ton = 5,639.92 TJ), that could result in emissions from diesel (5,639.92 TJ x 74.1 tCO2/TJ = 417,918.07 tCO2). The emission factor of diesel available in 2006 IPCC Guidelines for National Greenhouse Gas Inventories (74.1 tCO2/TJ) were employed. The net calorific value was obtained from Brazilian National Energy Balance (0.0377 TJ/ton).
Avoided emissions
Other: Brazilian GHG Protocol Program
JBS Biodiesel is the largest vertically integrated global producer of biodiesel from beef tallow. It has production capacity authorized by the National Agency of Petroleum, Natural Gas and Biofuels (ANP) of more than 500 million liters per year and is the first biodiesel industry in Brazil with the carbon, sustainability and traceability seal of the International Sustainability and Carbon Certification (ISCC), allowing it to enter the European market without restrictions on the products. Beef tallow is a byproduct of cattle slaughter activity and if the residue does not have the proper treatment / disposal, it can be considered as a high potential pollutant. Beef tallow is now the second most important raw material for biodiesel production in Brazil. Beef tallow biodiesel is a clean and high quality fuel that adds value to the beef chain and contributes to the environment by properly disposing unwanted waste.
Product
JBS offers solid waste management solutions by its Company, JBS Environmental (JBS Ambiental), that directly enables scope 1 GHG emissions to be avoided by a third party. JBS exclusive
Avoided emissions
Other: Brazilian GHG Protocol Program
Thus, in compliance with National Policy on Solid Waste, JBS joined the National Sectorial Agreement, managed by the Business Commitment for Recycling (Cempre). In 2016, JBS will make

Level of
aggregation
Description of product/Group of
products
Are you
reporting low carbon product/s or avoided emissions?
Taxonomy, project or
methodology used to classify
product/s as low carbon or to calculate
avoided emissions
%
revenue from low carbon
product/s in the
reporting year
% R&D in
low carbon
product/s in the
reporting year
Comment
and independent business unit that offers solid waste management solutions, with treatment and proper allocation of recyclable, non-recyclable and hazardous waste, as well as ensuring waste certification to contribute to the Company’s and its client’s commitment to sustainability. The goal is to reduce disposal of waste in landfills and create value from waste processing and turning it back into raw material. Waste from plastic packaging generated in the JBS units or coming from other sources are routed to the JBS Environmental, where is made all the plastic transformation process in recycled raw material. In 2015, JBS Environmental managed 3.713 tons of paper and cardboard, 5.202 tons of plastic and 8.045 tons of metals. This will avoid through the inherent decomposition years the emissions of approximately 963.42 tCO2e considering that the waste recycled by JBS Environmental would be sent to a sanitary landfill (paper and cardboard emission factor = 1.995 kgCO2e/tonnes - for plastic and metals, emission factor = 0 - 2006 IPCC Guidelines - Chapter 3 Solid Waste Disposal; GWP CH4 = 25).
investments to promote the recycling chain through the reverse logistics of packaging of their products. The planned activities are focused on developing and empowering screening cooperatives of recyclable materials, educating consumers about the proper disposal and increasing the production of recycled material.

CC3.3
Did you have emissions reduction initiatives that were active within the reporting year (this can include those in the planning and/or implementation phases)
Yes
CC3.3a
Please identify the total number of projects at each stage of development, and for those in the implementation stages, the estimated CO2e savings
Stage of development
Number of projects
Total estimated annual CO2e savings in metric tonnes CO2e (only for rows marked *)
Under investigation 0 0
To be implemented* 7 0
Implementation commenced* 21 0
Implemented* 22 20576.50
Not to be implemented 0 0
CC3.3b
For those initiatives implemented in the reporting year, please provide details in the table below

Activity type
Description of activity
Estimated annual CO2e
savings (metric tonnes CO2e)
Scope
Voluntary/ Mandatory
Annual monetary savings
(unit currency
- as specified in CC0.4)
Investment required
(unit currency -
as specified in CC0.4)
Payback period
Estimated lifetime of
the initiative
Comment
Transportation: fleet
Replacement of trucks by trains and coasting in Brazil. Each train or coasting transportation replaces one truck transportation. In 2015, it occurred 1,309 coasting transportation and 1,965 train transportation.
10836 Scope 1 Scope 3
Voluntary
6-10 years
Cost savings on fuel and toll fees. The project is expected to expand with greater use of the railways and coasting for the distribution of products for export.
Energy efficiency: Processes
Energy efficient lighting project in Moypark - UK.
3000
Scope 2 (location-based)
Voluntary Mandatory
3480750 0 <1 year 6-10 years Investor financed
Process emissions reductions
Biomass boiler installations in Moypark - UK.
3000 Scope 1
Voluntary Mandatory
432607 1491750 4-10 years
16-20 years
Subsidy scheme received for 20 years.
Energy efficiency: Building services
In the Leather Business, all new projects that require lighting will adopt the LED lighting. Moreover, a gradual replacement of conventional lighting by LED is being adopted. When the conventional bulb burns out, the same is replaced by a new LED. Until the end of 2016, the stock of conventional bulbs should be reset.
Scope 2 (location-based)
Voluntary
Ongoing

Activity type
Description of activity
Estimated annual CO2e
savings (metric tonnes CO2e)
Scope
Voluntary/ Mandatory
Annual monetary savings
(unit currency
- as specified in CC0.4)
Investment required
(unit currency -
as specified in CC0.4)
Payback period
Estimated lifetime of
the initiative
Comment
Energy efficiency: Building services
In 7 Brazilian Beef Units were installed the air vents in the cooling system, which enable the reduction in the energy consumed in these equipments.
283.84
Scope 2 (location-based)
Voluntary
1008000 1082436 1-3 years
Ongoing
Low carbon energy installation
JBS Foods: Installation of 6 boilers fed with woodchip, instead of fossil fuel boilers.
Scope 1
Voluntary
5716000 21600000 4-10 years
Ongoing
Energy efficiency: Building services
JBS Foods: energy saving from the installation of 30 condensers in the boilers
3456.66
Scope 2 (location-based)
Voluntary
8575140 12395970 1-3 years
Ongoing
CC3.3c
What methods do you use to drive investment in emissions reduction activities?
Method
Comment
Dedicated budget for other emissions reduction activities
JBS has an annual budget to carry out emission reduction projects. In Brazil, the major JBS's GHG emission source is wastewater treatment. More than 60% of the budget of JBS Beef and Leather are dedicated to carry out projects to improve the parameters of effluents and consequently, reduce greenhouse gases emissions. In 2015, JBS Beef and Leather Brazil invested more than BRL 14 million in improvement projects (eco-efficiency projects) which one of the main results were the mitigation of greenhouse gases. These projects are related to the reduction of water consumption and energy efficiency, wastewater treatment, energy reuse,
Method
Comment
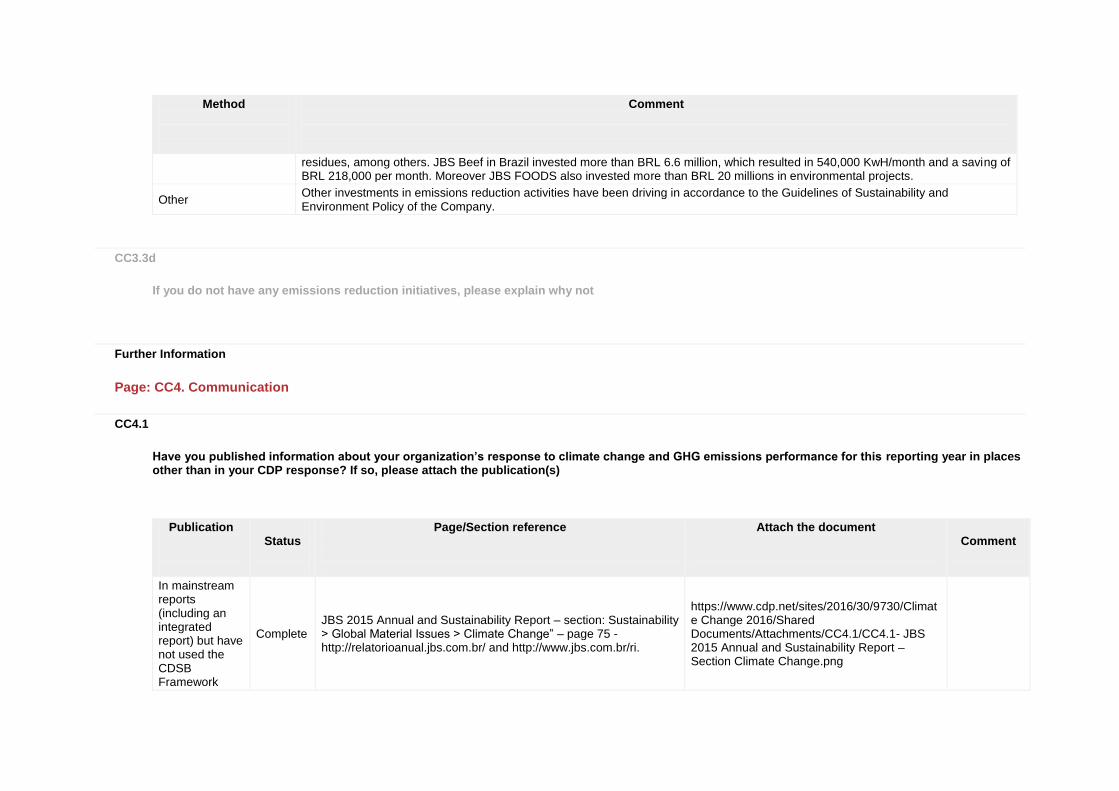
residues, among others. JBS Beef in Brazil invested more than BRL 6.6 million, which resulted in 540,000 KwH/month and a saving of BRL 218,000 per month. Moreover JBS FOODS also invested more than BRL 20 millions in environmental projects.
Other Other investments in emissions reduction activities have been driving in accordance to the Guidelines of Sustainability and Environment Policy of the Company.
CC3.3d
If you do not have any emissions reduction initiatives, please explain why not
Further Information
Page: CC4. Communication
CC4.1
Have you published information about your organization’s response to climate change and GHG emissions performance for this reporting year in places other than in your CDP response? If so, please attach the publication(s)
Publication
Status
Page/Section reference
Attach the document
Comment
In mainstream reports (including an integrated report) but have not used the CDSB Framework
Complete JBS 2015 Annual and Sustainability Report – section: Sustainability > Global Material Issues > Climate Change” – page 75 - http://relatorioanual.jbs.com.br/ and http://www.jbs.com.br/ri.
https://www.cdp.net/sites/2016/30/9730/Climate Change 2016/Shared Documents/Attachments/CC4.1/CC4.1- JBS 2015 Annual and Sustainability Report – Section Climate Change.png

Publication
Status
Page/Section reference
Attach the document
Comment
In voluntary communications
Underway - previous year attached
GHG Protocol Brazilian Program - https://registropublicodeemissoes.com.br/index.php/participante/930
https://www.cdp.net/sites/2016/30/9730/Climate Change 2016/Shared Documents/Attachments/CC4.1/PBGHGP 2014.pdf
2015 GHG Inventory Emissions reported in May 31st. It is not publically available by this questionnaire deadline.
In voluntary communications
Underway - previous year attached
ICO2 Carbon Efficiency Index – BMF&BOVESPA - http://www.bmfbovespa.com.br/pt_br/produtos/indices/indices-de-sustentabilidade/indice-carbono-eficiente-ico2-composicao-da-carteira.htm
https://www.cdp.net/sites/2016/30/9730/Climate Change 2016/Shared Documents/Attachments/CC4.1/Carteira teórica ICO2.xlsx
ICO2 2016 should be reported by August 31st.
In other regulatory filings
Complete Reference Form 2016 - JBS SA – pages 23, 24, 137, 143 and 147.
https://www.cdp.net/sites/2016/30/9730/Climate Change 2016/Shared Documents/Attachments/CC4.1/Formulário de Referência 2016.pdf
In voluntary communications
Complete Environmental System of São Paulo. http://www.ambiente.sp.gov.br/2016/03/18/sma-divulga-pontuacao-de-empresas-no-protocolo-climatico/
https://www.cdp.net/sites/2016/30/9730/Climate Change 2016/Shared Documents/Attachments/CC4.1/Protocolo Climático do Estado de SP.pdf
Further Information
Module: Risks and Opportunities
Page: CC5. Climate Change Risks
CC5.1

Have you identified any inherent climate change risks that have the potential to generate a substantive change in your business operations, revenue or expenditure? Tick all that apply
Risks driven by changes in regulation Risks driven by changes in physical climate parameters Risks driven by changes in other climate-related developments
CC5.1a
Please describe your inherent risks that are driven by changes in regulation
Risk driver
Description
Potential impact
Timeframe
Direct/ Indirect
Likelihood
Magnitude of impact
Estimated financial
implications
Management
method
Cost of
management
Uncertainty surrounding new regulation
As JBS is present in many different countries worldwide and faces different regulatory risks according to its location, in the medium and long term we have been expecting more strict legislation regarding GHG emissions reduction as an approach to mitigate climate change. Therefore, there is
Increased operational cost
3 to 6 years
Direct Very likely Medium
The risks presented by this type of regulation translate into higher production and energy costs, as well as a possible effect on market competiveness. So far, it is not possible to provide an accurate or even an estimated final implication. Nevertheless, JBS is expecting consequences in the agriculture, livestock and
JBS believes that the inclusion of sustainability principles, aligned with its Sustainability strategy, in all operations allows innovation and continuous development of its business; therefore, it could anticipate future obligations. This commitment, formally expressed in the Environmental Policy, is the basis for the EMS
Brazil - To monitor and deal with risks, the costs can be described as expenses in the area of sustainability, where in 2015 approximately R$ 3,000,000 (BRL) were spent.

Risk driver
Description
Potential impact
Timeframe
Direct/ Indirect
Likelihood
Magnitude of impact
Estimated financial
implications
Management
method
Cost of
management
a risk that our business will have to comply by changing operation processes and investing on new mandatory technologies, processes and complying schemes. In 2015, JBS revised the risks related to uncertainty surrounding new regulation, which are the following: o Brazilian National Policy on Climate Change: In December 2010, the Brazilian government published Decree 7390, which regulates the National Policy on Climate Change. It was established through two plans: the Prevention and Control Action Plans of deforestation in
production operations sectors.
certified by ISO14001 standard. The adoption of good governance practices and socio-environmental management by JBS units have provided success in the development of initiatives through mapping risks and opportunities. The Sustainability Committee identifies and deals with critical matters which represent risks or may have a relevant impact on the Company. Therefore, the awareness about new regulation on climate change is one of the hot topics of the Sustainability Committee meetings. Moreover, Climate Change was defined as a material issue for the company globally. In addition,

Risk driver
Description
Potential impact
Timeframe
Direct/ Indirect
Likelihood
Magnitude of impact
Estimated financial
implications
Management
method
Cost of
management
the biomes, and the Department of Mitigation and Adaptation. The decree states that the sector plans will be prepared and shall include emission reduction targets for 2020. Although there are no reduction targets for each sector separately, the Decree emphasizes the voluntary commitment to reduce national emissions by 36.1% to 38.9% by 2020. o Brazilian States Carbon Mitigation regulations: First of all, JBS had identified two regulations in state level in Brazil: 1. Environmental Company from São Paulo State (CETESB) – according to the
every JBS unit are aware about these issues, which implies in the identification of these risks locally and, further, the need of anticipate future obligations. Finally, as an example, in 2015 JBS had adhered to the São Paulo State Climate Protocol in a voluntary manner, which aim is stimulate companies in reducing their GHG emissions and seeks for climate change adaptation measures. This protocol intends to establish public policies by improving competitiveness from the adoption of clean technologies and was one of the commitments of São Paulo State presented in COP21.

Risk driver
Description
Potential impact
Timeframe
Direct/ Indirect
Likelihood
Magnitude of impact
Estimated financial
implications
Management
method
Cost of
management
regulation 254/2012/V/I, from August 22nd 2012, it institutes the obligation of some sectors to elaborate its greenhouse gases inventory and are demanded to provide it annually to the environmental body. 2. Environment State Institute (INEA) – Rio de Janeiro – according to the regulation Nr. 64, companies that applies for the environmental licenses are obligated to provide its verified greenhouse gases inventory to the environmental body. o COP 21 – Paris Agreement: According to the Paris Agreement, countries should comply with their

Risk driver
Description
Potential impact
Timeframe
Direct/ Indirect
Likelihood
Magnitude of impact
Estimated financial
implications
Management
method
Cost of
management
own INDC (Intended Nationally Determined Contribution). These commitments varies from countries and, as a global company, JBS business units should map every local agreements and regulations towards the achievement of each assumed commitment. Since this agreement occurred in December 2015, JBS units around the world are still determining the related impacts and preparing the planning to attend it.
Cap and trade schemes
Brazil: Tied to the Brazilian National Policy on Climate Change, that incentivizes
Increased operational cost
3 to 6 years
Direct Very likely Medium
Increase of operational costs. May incur increased energy costs,
In the USA, EPA regulates emissions of greenhouse gases through the Clean Air Act. A
Brazil - To monitor and deal with risks, the costs can be described as

Risk driver
Description
Potential impact
Timeframe
Direct/ Indirect
Likelihood
Magnitude of impact
Estimated financial
implications
Management
method
Cost of
management
financial mechanisms for emissions mitigation and climate change adaptation actions, JBS and other companies are jointly discussing ways to implement a Brazilian Emissions Trading Scheme through EPC (“Empresas pelo Clima” - Business for the Climate Platform). USA: The probability to create a national cap and trade market for GHG emissions is considered as high within the next years. Our units in the United States are currently seeking strategic positioning and studying how it might adapt to emission targets. The West Coast
environmental costs and other, and investments to comply with existing or new restrictions GHG emissions.
number of the Company's facilities are already required to monitor and report emissions of greenhouse gases, according to reports from the EPA. In Europe, Moy Park Ltd – Dungannon is eligible with EU ETS and, according to “GB-ETS-0030-04”, had set the allocations allowances from 2013 to 2020 phase three period of EU ETS (total of 63,756 tCO2e). In Brazil, JBS currently is an active member of EPC (Business for the Climate Platform), which are designing a Brazilian Emissions Trading Scheme.
expenses in the area of sustainability, where in 2015 approximately R$ 3,000,000 (BRL) were spent.

Risk driver
Description
Potential impact
Timeframe
Direct/ Indirect
Likelihood
Magnitude of impact
Estimated financial
implications
Management
method
Cost of
management
of the United States is developing several climate change initiatives, especially the State of California, which has developed a cap and trade scheme. The Environmental Protection Agency has released in April 2009 new mandatory GHG reporting guidelines that are being enforced since the beginning of 2011 in different sectors, including the Food Processing and Manure Management. Europe: European JBS units are tied to the EU Emissions Trading System (EU ETS). Moy Park, JBS units in UK and France, participate in the

Risk driver
Description
Potential impact
Timeframe
Direct/ Indirect
Likelihood
Magnitude of impact
Estimated financial
implications
Management
method
Cost of
management
EU ETS emissions reduction scheme as well as the Climate Change Agreement Scheme across industrial and agricultural sectors. For JBS Global, the risks about Carbon Taxes are related to financial penalties imposed to the Company due to the not achievement of the assumed / imposed GHG emissions reduction targets.
Carbon taxes
JBS considers Carbon Taxes a very likely measure that the Company will have to deal in a close future. We have been constantly monitoring Carbon Taxes legislations in countries where
Increased operational cost
3 to 6 years
Direct Likely High
The Company must anticipates that it will incur additional costs as a result of (1) additional investments that will bear to comply with new regulations and (2) the price of carbon which may need to pay as a result of their level of carbon
Every JBS unit throughout the world has GHG emission reduction projects, which is, indeed, besides an efficiency measure, an efficient manner to anticipate eventual penalties related to Carbon Taxes. Up to this moment, we had
Costs related to the processes identification of carbon taxes, related to each country, specifically. For example, in Brazil this activity is in charge of the area of sustainability,

Risk driver
Description
Potential impact
Timeframe
Direct/ Indirect
Likelihood
Magnitude of impact
Estimated financial
implications
Management
method
Cost of
management
we operate, in order to anticipate the related rules and to prepare the management of this issue.
emissions. identified Carbon Taxes, in countries where we have units, in Mexico, UK and France, but not strictly related to our core businesses so far.
2015 approximately R$ 3,000,000 (BRL) were spent.
Fuel/energy taxes and regulations
Energy related to regulations, including fossil fuel and electricity taxation, might affect the Company’s costs of goods sale (COGS), since as a production inputs until the transportation of products.
Increased operational cost
3 to 6 years
Direct Likely Low
In UK, due to the "Climate Change Agreements", Moypark expects for the period between 2019-2023 a cost of energy carbon of roughly 100,000 pounds. The agreement states that if the UK is to cut its greenhouse gas emissions by 80% by 2050, energy efficiency will have to increase across all sectors to the extent that energy use per capita is between a fifth and a half lower than it is today.
In Brazil, Corporate Sustainability department is monitoring any similar taxation, mainly through EPC (Business for the Climate Platform). In UK, this issue is fully comprised by Moypark risk management, the same for JBS USA. Also, production units of JBS throughout the world develops energy efficiency projects, promoting current and long run benefits, also supporting Company mitigate energy/fuel taxation effects in the operational costs.
Brazil - To monitor and deal with risks, the costs can be described as expenses in the area of sustainability, where in 2015 approximately R$ 3,000,000 (BRL) were spent.

CC5.1b
Please describe your inherent risks that are driven by changes in physical climate parameters
Risk driver
Description
Potential impact
Timeframe
Direct/ Indirect
Likelihood
Magnitude of impact
Estimated financial
implications
Management
method
Cost of
management
Induced changes in natural resources
The physical risks identified by JBS are both local and global, and are divided by physical assets, supply chain and business structure. The water scarcity, due to the lack of a steady rainy season attributed to, among others, climate change, is a phenomenon that the Company faced in the last couple of years, mainly in Brazil, negatively influencing our business. The water scarcity had negatively influenced the availability of energy to our production units and caused the raise of electrical energy fares. In addition, JBS was
Increased operational cost
Up to 1 year
Direct Very likely High
The potential financial implications of the risk before taking action are related to the increase in operational costs. JBS is facing financial implications due to changes in natural resources already.
Regarding electrical energy in Brazil, JBS prioritizes the energy acquired from clean sources (free Market) and from own production (power plant by sugar cane bagasse). Regarding water availability, JBS planned to start in 2016 a mapping of water stress for all its production units in Brazil (which comprises a substantial part of its supply chain).
To monitor and deal with risks, the costs can be described as expenses in the area of sustainability, where in 2015 approximately R$ 3,000,000 (BRL) were spent.

Risk driver
Description
Potential impact
Timeframe
Direct/ Indirect
Likelihood
Magnitude of impact
Estimated financial
implications
Management
method
Cost of
management
obligated to partially discontinue the operations in a production unit in Brazil due to the lack of water access.
Induced changes in natural resources
The productivity of livestock and crops/pasture may be severely affected by increasing temperatures, CO2 concentration in the atmosphere, changes in annual rain patterns and future increase in disease, pests and weeds that affect livestock and plants alike. The studies regarding these variables have been developed for several years, however the effects are still fairly uncertain. Livestock: from an animal physiology perspective, an increase in overall temperatures to
Increased operational cost
Up to 1 year
Indirect (Supply chain)
More likely than not
High
According to a recent study published by FAO and EU, the production of agricultural commodities shall rise up to 60% in the next 25 years. One of the main factor that may negatively influence this result is climate change. Therefore, the reversal of the current tendency of low prices is a likely possibility. High prices of agricultural commodities may continue to have an adverse effect on the JBS's operating results.
JBS seeks to assume advance purchase or financial derivative contracts for the purchase of agricultural commodities in order to manage their costs with feed ingredients. Moreover, JBS develops projects for avoiding and mitigating GHG emissions, as for example, the New Field Project in a partnership with ICV (“Instituto Centro de Vida”), which aims to promote sustainable livestock farming in the Amazonia biome. Moreover, JBS Foods invests
As a result of the partnership with ICV, JBS developed subsidy protocols for purchase of cattle in the project area which comply with the criteria of quality and the basic requirements of Good Agricultural Practices. Other costs are related to the support on the dissemination of results of Good Agricultural Practices through corporate videos, brochures, field days in conjunction with the ICV a and training of technical and ranchers together with ICV regarding

Risk driver
Description
Potential impact
Timeframe
Direct/ Indirect
Likelihood
Magnitude of impact
Estimated financial
implications
Management
method
Cost of
management
which the animals are exposed could have severe effects on the animals. If average temperatures reach a level above the animals upper critical limit in its thermal neutral zone, studies have shown that the animal will suffer from heat stress and will require a higher energy and water intake, affecting the animal’s weight gain and its ability to reproduce. In the long run this may affect cattle prices as well as its supply as farmers may prefer to raise other livestock that reacts better to higher temperatures. Feed: considering that part of the JBS’s livestock supply is raised in feedlots, and that the largest percentage of feed,
in projects that improve the feed conversion of poultry and pork, so that less food is necessary.
good practice. The cost in 2015 regarding this partnership is estimated in BRL 115,000 including travel expenses, sponsorship for day camp and institutional video, advertising materials (banners and brochures) and training in agricultural techniques.
Risk driver
Description
Potential impact
Timeframe
Direct/ Indirect
Likelihood
Magnitude of impact
Estimated financial
implications
Management
method
Cost of
management
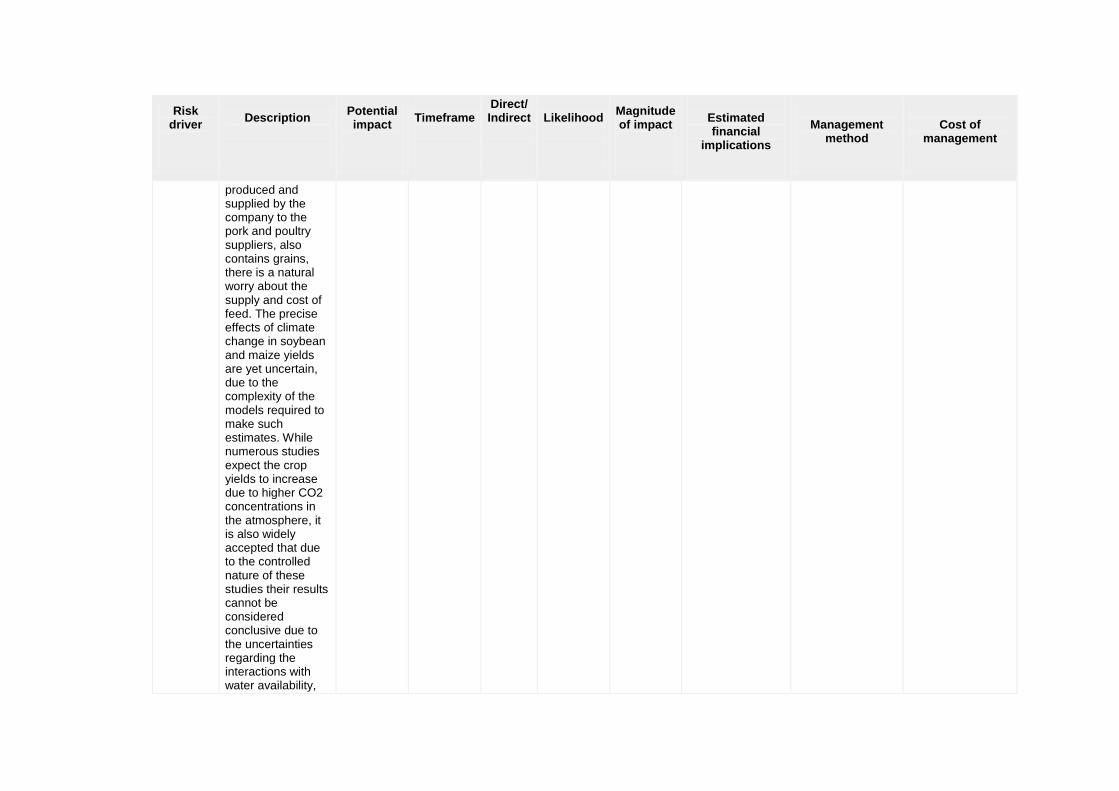
produced and supplied by the company to the pork and poultry suppliers, also contains grains, there is a natural worry about the supply and cost of feed. The precise effects of climate change in soybean and maize yields are yet uncertain, due to the complexity of the models required to make such estimates. While numerous studies expect the crop yields to increase due to higher CO2 concentrations in the atmosphere, it is also widely accepted that due to the controlled nature of these studies their results cannot be considered conclusive due to the uncertainties regarding the interactions with water availability,

Risk driver
Description
Potential impact
Timeframe
Direct/ Indirect
Likelihood
Magnitude of impact
Estimated financial
implications
Management
method
Cost of
management
soil nutrients, pests, weeds, etc. While JBS identifies feed availability as a risk, it is still uncertain about its magnitude. Pasture: as mentioned before, the effects of climate change are still uncertain regarding plants. Pastures can be considered a specific case, since there are known differences in the response to climate change between plants with different metabolic carbon fixations such as pastures. Changes in the pasture growth and availability could be risky for the supply of livestock, especially in Brazil and Argentina.
CC5.1c

Please describe your inherent risks that are driven by changes in other climate-related developments
Risk driver
Description
Potential impact
Timeframe
Direct/ Indirect
Likelihood
Magnitude of impact
Estimated financial
implications
Management
method
Cost of
management
Reputation
JBS is exposed to risks that indirectly affect its operations and ability to operate in the international market. As the topic of climate change becomes a concern to consumers all over the world, the Company is aware of its responsibility. JBS is working to create tools and control mechanisms that allows it to mitigate its exposure to reputational and image risks regarding the effect of its activities in climate change. The image risks that could affect JBS is related to food security and the supply chain, which may cause
Reduced demand for goods/services
Up to 1 year
Direct Likely High
The potential financial implication is decrease of income due to the risk of reputation. As an example of estimative, whether JBS is accused of commercializes meat from a deforested area in the Amazon region, the financial implication could be related to the purchase embargo from JBS’s clients outside Brazil, which is a sensitivity market about this issue, and the Brazilian retail clients, due the Greenpece Brazilian campaign “Carne ao Molho Madeira” (“Beef in wood sauce”). This embargo could be estimated in around BRL 1.5 billion.
JBS assumed the commitment to ensure the responsible origin of its raw materials. It does not acquire cattle from suppliers involved in the deforestation of native forests, the invasion of public lands such as indigenous lands or environmental conservation units, rural violence and agrarian conflicts, or the use of compulsory and child labor. To ensure it, JBS has developed a system for social and environmental monitoring of cattle suppliers. This system is comprised of two joint analysis procedures. The first involves geospatial
Approximately R$ 1,000,000 (BRL) are spent per year with the social and environmental monitoring system, considering the costs with third parties (geographic monitoring, preparation of Easy Map project system, advanced analysis and integration of systems), audits, travel for training and meetings with involved employees.

Risk driver
Description
Potential impact
Timeframe
Direct/ Indirect
Likelihood
Magnitude of impact
Estimated financial
implications
Management
method
Cost of
management
deforestation to create new pastures. Deforestation is a very sensitive issue not just in Brazil, but also with huge rebound throughout the world.
monitoring of the suppliers properties, that performs the digital overlay of georeferenced maps of cattle suppliers farms to official data of deforestation in Brazil and indigenous land and environmental conservation areas maps. The second performs the intersection of the registration data of the Company's cattle suppliers with the information from the public lists of areas embargoed by IBAMA - by illegal deforestation – and employers who used work practices that are degrading or analogue to slavery, according the Ministry of Labor (MTE). This entire process of

Risk driver
Description
Potential impact
Timeframe
Direct/ Indirect
Likelihood
Magnitude of impact
Estimated financial
implications
Management
method
Cost of
management
social and environmental analysis and monitoring of the farms is carried out on a daily basis, both for new suppliers as well as for those who are already included in JBS’s registry of suppliers. The aim is to maintain the social and environmental compliance of the suppliers and block the purchase of raw materials from farms that do not comply with the JBS social and environmental criteria.
CC5.1d
Please explain why you do not consider your company to be exposed to inherent risks driven by changes in regulation that have the potential to generate a substantive change in your business operations, revenue or expenditure

CC5.1e
Please explain why you do not consider your company to be exposed to inherent risks driven by physical climate parameters that have the potential to generate a substantive change in your business operations, revenue or expenditure
CC5.1f
Please explain why you do not consider your company to be exposed to inherent risks driven by changes in other climate-related developments that have the potential to generate a substantive change in your business operations, revenue or expenditure
Further Information
Page: CC6. Climate Change Opportunities
CC6.1
Have you identified any inherent climate change opportunities that have the potential to generate a substantive change in your business operations, revenue or expenditure? Tick all that apply
Opportunities driven by changes in regulation Opportunities driven by changes in physical climate parameters Opportunities driven by changes in other climate-related developments
CC6.1a

Please describe your inherent opportunities that are driven by changes in regulation
Opportunity driver
Description
Potential impact
Timeframe
Direct/Indirect
Likelihood
Magnitude of impact
Estimated financial
implications
Management
method
Cost of
management
Cap and trade schemes
Despite it also represents a risk, Cap and trade schemes are, on the other hand, a good opportunity for JBS globally. Due to its operational features and number of operational units, the Company could identify a significant amount of GHG emissions reduction projects opportunities. Currently, JBS has developed 2 CDM projects in Brazil (in monitoring phase), which can generate revenue through the
Premium price opportunities
3 to 6 years
Direct Very likely Medium
The development of project activities to reduce GHG emissions can generate positive financial implications to JBS through the revenue of sales of carbon credits. According to the PDDs from JBS CDM projects, about 73066 tCO2e would be generated per year. As currently the credit amount is low (about EUR 0.40 in June 2016 - BRL 1.61), the potential financial impact will not be significant (about BRL 115,000). Thus, JBS is waiting for a better time to verifying the monitoring of
Besides its participation in EPC and in the other initiatives towards a cap a trade scheme in other locations where it operates, JBS will continue to invest in GHG emission reduction projects. The reason is because it is a prioritized issue and it is a Company guideline related to its sustainability strategy, regardless of the generation of additional revenue from the sale of carbon credits.
The development of these projects have associated costs. JBS has already spent about roughly 9,200,000 BRL in CDM projects.

Opportunity driver
Description
Potential impact
Timeframe
Direct/Indirect
Likelihood
Magnitude of impact
Estimated financial
implications
Management
method
Cost of
management
sale of carbon credits. The scope of the project is avoidance of methane through wastewater treatment. The projects were implemented in two units: Vilhena (Rondônia) and Barra dos Garças (Mato Grosso), which were registered on UNFCCC (United Nations Framework Convention on Climate Change) in 2011. Especially in Brazil, the participation of JBS in the EPC (Business for the Climate Platform), which are
these projects and sell the CERs in the market.

Opportunity driver
Description
Potential impact
Timeframe
Direct/Indirect
Likelihood
Magnitude of impact
Estimated financial
implications
Management
method
Cost of
management
designing a Brazilian Emissions Trading Scheme, may open new opportunities to the Company earn a new source of revenues through the selling of carbon credits.
Emission reporting obligations
JBS develops its GHG emissions inventory and reports into public voluntary platforms and in financial reports. Despite an obligation for some conditions, as in Brazil (state of Rio de Janeiro: environmental license conditions;
Increased stock price (market valuation)
Up to 1 year
Direct Virtually certain
High
The participation of JBS in a sustainability index like BMF&BOVESPA ICO2, promotes intangible benefits, as increase on reputation and market penetration, and tangible benefits, as the increase on shares negotiation (shares liquidity).
The GHG Emissions report is elaborated annually by specialized advisory consultants and involves the Company globally. The participation of JBS in ICO2 Index is prepared by the same consultants and by the Investor Relations Department.
Around 150,000 BRL per year.

Opportunity driver
Description
Potential impact
Timeframe
Direct/Indirect
Likelihood
Magnitude of impact
Estimated financial
implications
Management
method
Cost of
management
state of São Paulo: report to the environmental areas is an obligation for some business sectors and/or GHG emissions threshold) it is an efficient management tool and allows Company participates in a specific stock exchange index in Brazil (ICO2 Index).
Moreover, in order to lead good practice and strengthen the relationship with the government, in 2015 JBS had adhered to the São Paulo State Climate Protocol in a voluntary manner, which aim is stimulate companies in reducing their GHG emissions and seeks for climate change adaptation measures. This protocol intends to establish public policies by improving competitiveness from the adoption of clean technologies. In the next years JBS plans to adhere to initiatives from others state governments.

Opportunity driver
Description
Potential impact
Timeframe
Direct/Indirect
Likelihood
Magnitude of impact
Estimated financial
implications
Management
method
Cost of
management
Other regulatory drivers
Biodiesel – In 2008 the Brazilian government, through the National Program of Biodiesel Production and Use (PNPB) forced the mix of pure biodiesel (B100) in diesel oil used in the country in order to reduce GHG emissions. Between January and June 2008, the blend of biodiesel in diesel oil was 2% (B2) and in 2015 the blend was 7% (National Petroleum Agency). From 2014 to 2015, the blend percentage
New products/business services
Up to 1 year
Direct Virtually certain
Low-medium
Thanks to regulations, today the biodiesel production also generates revenue for JBS. The estimated financial implications due to this opportunity in 2015 was the increase of around 15% of the Gross operating revenue of 2014.
In 2015, 170 million liters of biodiesel were produced from different animal and plant oils in the plants located in Brazil. JBS has two plants in Brazil, one in Lins (SP) and another in Campo Verde (MT), the latter having received investments of R$15 million in 2015 to double its production capacity, from 48 million liters/year to 100 million liters/year. The Company is now working on development and certification of glycerin, a biodiesel byproduct to be sold to the construction industry and exported to Asia beginning
The investment of JBS in its biodiesel facility in 2015 increased 177% relating to 2014.

Opportunity driver
Description
Potential impact
Timeframe
Direct/Indirect
Likelihood
Magnitude of impact
Estimated financial
implications
Management
method
Cost of
management
increased 1.3% (from 5.67% to 7%). In 2015, the Brazilian Government also sanctioned the law nº 3834/2015, which established a timetable for increasing the mandatory blending of biodiesel to diesel. The regulatory framework establishes that, in 12 months, the mixture should be 8%, increasing to 10% in 3 years. The regulation increases the demand for this biofuel in Brazil, consequently increasing the demand for
in 2016. It is important to mention that 80% of the animal fat from JBS processes are used in biodiesel generation.

Opportunity driver
Description
Potential impact
Timeframe
Direct/Indirect
Likelihood
Magnitude of impact
Estimated financial
implications
Management
method
Cost of
management
the Biodiesel produced and sold by JBS.
CC6.1b
Please describe the inherent opportunities that are driven by changes in physical climate parameters
Opportunity driver
Description
Potential impact
Timeframe
Direct/ Indirect
Likelihood
Magnitude of impact
Estimated financial
implications
Management
method
Cost of
management
Change in mean (average) temperature
Changes in temperature and rainfall can cause the increase of productivity in pasture areas.
Increased production capacity
>6 years Indirect (Supply chain)
Likely High
The potential financial implication is the increase of production capacity due to the increase in raw material availability. This opportunity, added to partnership of JBS and NGO ICV to promotes sustainable livestock farming in the Amazon biome, has the potential to become an
JBS and NGO ICV have partnered to support sustainable livestock farming in the Amazon biome by showing that livestock farming can be profitable even within a framework of rigorous environmental controls. The project, called New Field, helps the Livestock farmers to refurbish degraded pasture, promotes sustainable cattle raising in the Amazon biome, developing
As a result of the partnership with ICV, JBS developed subsidy protocols for purchase of cattle in the project area which comply with the criteria of quality and the basic requirements of Good Agricultural Practices. Other costs are related to the support on the dissemination of results of Good Agricultural Practices through corporate videos,

Opportunity driver
Description
Potential impact
Timeframe
Direct/ Indirect
Likelihood
Magnitude of impact
Estimated financial
implications
Management
method
Cost of
management
important competitive advantage to the Company.
production models that improve management, increase productivity, increment quality in the product delivered to the market, strengthening of the local economy, reduce emissions of greenhouse gases in the production system (mainly avoided deforestation) and comply with environmental legislation. The results were that not only farm incomes rose, but the properties automatically started to implement a more environmentally responsible production model.
brochures, field days in conjunction with the ICV a and training of technical and ranchers together with ICV regarding good practice. The cost in 2015 regarding this partnership is estimated in 115,000 BRL including travel expenses, sponsorship for day camp and institutional video, advertising materials (banners and brochures) and training in agricultural techniques.
Change in mean (average) precipitation
Changes in temperature and rainfall can cause the increase of productivity in pasture areas.
Increased production capacity
>6 years Indirect (Supply chain)
Likely High
The potential financial implication is the increase of production capacity due to the increase in raw material availability. This
JBS and NGO ICV have partnered to support sustainable livestock farming in the Amazon biome by showing that livestock farming can be profitable even within a framework of
As a result of the partnership with ICV, JBS developed subsidy protocols for purchase of cattle in the project area which comply with the criteria of

Opportunity driver
Description
Potential impact
Timeframe
Direct/ Indirect
Likelihood
Magnitude of impact
Estimated financial
implications
Management
method
Cost of
management
opportunity, added to partnership of JBS and NGO ICV to promotes sustainable livestock farming in the Amazon biome, has the potential to become an important competitive advantage to the Company.
rigorous environmental controls. The project, called New Field, helps the Livestock farmers to refurbish degraded pasture, promotes sustainable cattle raising in the Amazon biome, developing production models that improve management, increase productivity, increment quality in the product delivered to the market, strengthening of the local economy, reduce emissions of greenhouse gases in the production system (mainly avoided deforestation) and comply with environmental legislation. The results were that not only farm incomes rose, but the properties automatically started to implement a more environmentally responsible
quality and the basic requirements of Good Agricultural Practices. Other costs are related to the support on the dissemination of results of Good Agricultural Practices through corporate videos, brochures, field days in conjunction with the ICV a and training of technical and ranchers together with ICV regarding good practice. The cost in 2015 regarding this partnership is estimated in 115,000 BRL including travel expenses, sponsorship for day camp and institutional video, advertising materials (banners and brochures) and training in agricultural techniques.

Opportunity driver
Description
Potential impact
Timeframe
Direct/ Indirect
Likelihood
Magnitude of impact
Estimated financial
implications
Management
method
Cost of
management
production model.
CC6.1c
Please describe the inherent opportunities that are driven by changes in other climate-related developments
Opportunity driver
Description
Potential impact
Timeframe
Direct/ Indirect
Likelihood
Magnitude of impact
Estimated financial
implications
Management
method
Cost of
management
Reputation
JBS has the opportunity to support initiatives that promote the benefits for mitigating climate change along the value chain of its businesses. The Company has a distinct opportunity to become a market leader regarding environmental practices and climate change management in its operations worldwide. JBS intends to continue its pioneering
Increased stock price (market valuation)
Up to 1 year
Direct Virtually certain
Medium-high
The financial implications are not measurable but it is estimated to result in increased income for JBS. As an example of positive intangible impact, in 2015 JBS was positive highlighted in the Greenpeace publication “Carne ao molho madeira”, which presents the supermarkets that sell meat from livestock in deforested
JBS is developing mechanisms to support initiatives that promote the certification of its value chain. JBS supports the sustainable growth of the Brazilian livestock sector with the Sustainable Livestock Program. The program raises awareness and trains suppliers on social and environmental issues, food safety and animal welfare. To
To monitor and deal with reputational opportunities for the Company, the costs can be described as expenses in the area of sustainability, where in 2015 approximately R$ 3,000,000 (BRL) were spent.
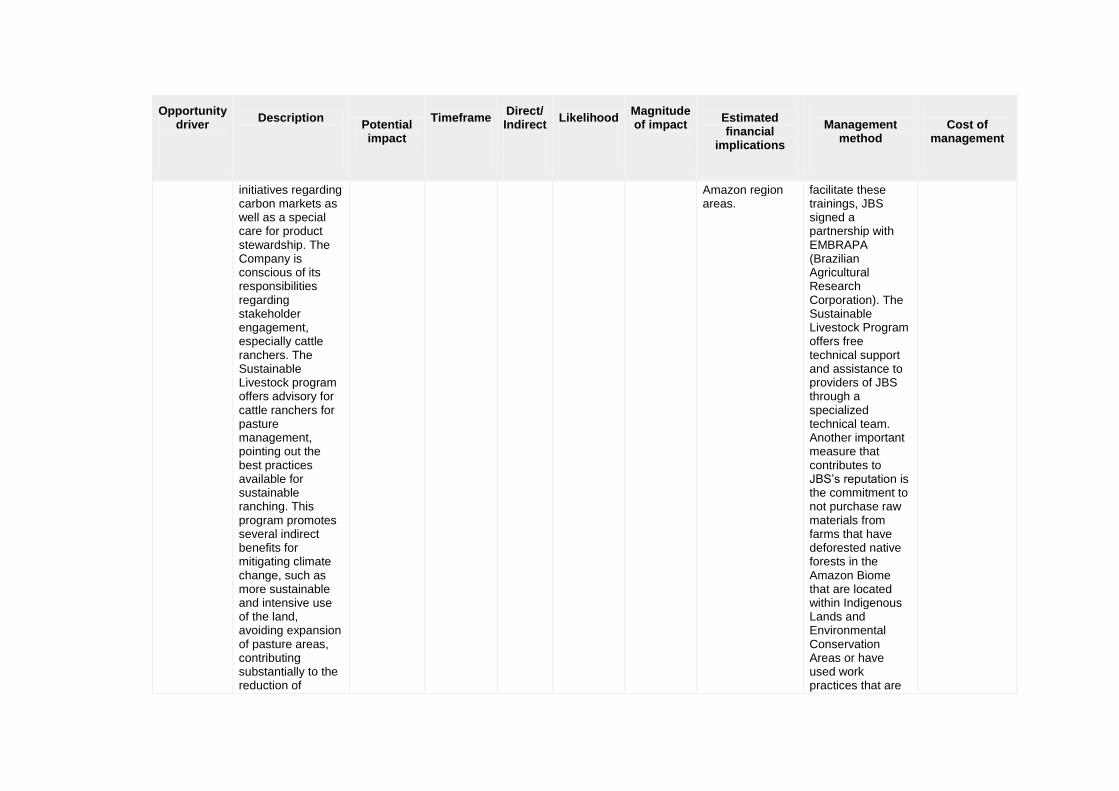
Opportunity driver
Description
Potential impact
Timeframe
Direct/ Indirect
Likelihood
Magnitude of impact
Estimated financial
implications
Management
method
Cost of
management
initiatives regarding carbon markets as well as a special care for product stewardship. The Company is conscious of its responsibilities regarding stakeholder engagement, especially cattle ranchers. The Sustainable Livestock program offers advisory for cattle ranchers for pasture management, pointing out the best practices available for sustainable ranching. This program promotes several indirect benefits for mitigating climate change, such as more sustainable and intensive use of the land, avoiding expansion of pasture areas, contributing substantially to the reduction of
Amazon region areas.
facilitate these trainings, JBS signed a partnership with EMBRAPA (Brazilian Agricultural Research Corporation). The Sustainable Livestock Program offers free technical support and assistance to providers of JBS through a specialized technical team. Another important measure that contributes to JBS’s reputation is the commitment to not purchase raw materials from farms that have deforested native forests in the Amazon Biome that are located within Indigenous Lands and Environmental Conservation Areas or have used work practices that are

Opportunity driver
Description
Potential impact
Timeframe
Direct/ Indirect
Likelihood
Magnitude of impact
Estimated financial
implications
Management
method
Cost of
management
deforestation and, consequently, emissions related to changes in land use in Brazil.
degrading or analogue to slavery. The management of this opportunity is done through its System for social and environmental monitoring of cattle suppliers. Every year the Company is audited by a third party and publishes the results about its endeavour against deforestation. In 2014, JBS achieved a compliance level of 99.97%.
Other drivers
Opportunity for improvement - Internal Management of Greenhouse Gas Emissions: The Company is studying the feasibility of creating a global mechanism for internal management of its GHG emissions. The Company has
Other: Increased operational efficiency and comply with possible legislation
3 to 6 years
Direct Likely Low-medium
The financial implications are not measurable so far but it is estimated to result in increased income for JBS.
In order to measure climate change impacts due to JBS’s activities, since 2009 JBS performs annually Inventory Emissions of GHG, which is an instrument of corporate management of the Company to measure the
For this opportunity, the costs can be described as expenses in the area of sustainability, where in 2015 approximately R$ 3,000,000 (BRL) were spent.

Opportunity driver
Description
Potential impact
Timeframe
Direct/ Indirect
Likelihood
Magnitude of impact
Estimated financial
implications
Management
method
Cost of
management
several operations spread throughout the world. Each country has its own system of regulation and where applicable, GHG emission targets. This mechanism is a way to manage and develop individual goals for emissions reduction projects in different countries and ways to use international offsets to supplement the allowances allocated where appropriate. The feasibility of such an engine tends to increase as the rules and regulations of an American market are better drawn.
emissions of greenhouse gases from its operations in Brazil, related to the period analyzed, which accounts for direct and indirect emissions. From the year 2012, JBS expanded this measurement to the operations all over the world. Since 2012, JBS is a member of the Brazilian GHG Protocol Program, where it publishes its GHG Emissions Inventory in the Public Registry of Emissions Platform. Besides, JBS participated in the Technical Working Group Scope 3 of the Brazilian GHG Protocol Program (development of auxiliary tool for GHG emissions in ground transportation and distribution) and the Agriculture

Opportunity driver
Description
Potential impact
Timeframe
Direct/ Indirect
Likelihood
Magnitude of impact
Estimated financial
implications
Management
method
Cost of
management
GHG Protocol. The use of a specialized software for the management of environmental and sustainability indicators by all units of JBS in Brazil allows the Company to standardize the environmental management of the units and also to improve the corporate management of sustainability indicators. This software allows to identify, measure the positive and negative impacts and monitor the performance of goals. JBS USA is studying the feasibility of the adoption of the same software.
CC6.1d
Please explain why you do not consider your company to be exposed to inherent opportunities driven by changes in regulation that have the potential to generate a substantive change in your business operations, revenue or expenditure
CC6.1e
Please explain why you do not consider your company to be exposed to inherent opportunities driven by physical climate parameters that have the potential to generate a substantive change in your business operations, revenue or expenditure
CC6.1f
Please explain why you do not consider your company to be exposed to inherent opportunities driven by changes in other climate-related developments that have the potential to generate a substantive change in your business operations, revenue or expenditure
Further Information
Module: GHG Emissions Accounting, Energy and Fuel Use, and Trading
Page: CC7. Emissions Methodology
CC7.1
Please provide your base year and base year emissions (Scopes 1 and 2)

Scope
Base year
Base year emissions (metric tonnes CO2e)
Scope 1 Thu 01 Jan 2015 - Thu 31 Dec 2015
4445098.00
Scope 2 (location-based) Thu 01 Jan 2015 - Thu 31 Dec 2015
1779980.77
Scope 2 (market-based) Thu 01 Jan 2015 - Thu 31 Dec 2015
0
CC7.2
Please give the name of the standard, protocol or methodology you have used to collect activity data and calculate Scope 1 and Scope 2 emissions
Please select the published methodologies that you use
Brazil GHG Protocol Programme
IPCC Guidelines for National Greenhouse Gas Inventories, 2006
The Greenhouse Gas Protocol: A Corporate Accounting and Reporting Standard (Revised Edition)
CC7.2a
If you have selected "Other" in CC7.2 please provide details of the standard, protocol or methodology you have used to collect activity data and calculate Scope 1 and Scope 2 emissions

CC7.3
Please give the source for the global warming potentials you have used
Gas
Reference
CO2 IPCC Fourth Assessment Report (AR4 - 100 year)
CH4 IPCC Fourth Assessment Report (AR4 - 100 year)
N2O IPCC Fourth Assessment Report (AR4 - 100 year)
HFCs IPCC Fourth Assessment Report (AR4 - 100 year)
CC7.4
Please give the emissions factors you have applied and their origin; alternatively, please attach an Excel spreadsheet with this data at the bottom of this page
Fuel/Material/Energy
Emission Factor
Unit
Reference
Further Information
Emission Factors spreadsheet for calculation of JBS Global GHG Emissions 2015 (question CC7.4).
Attachments

https://www.cdp.net/sites/2016/30/9730/Climate Change 2016/Shared Documents/Attachments/ClimateChange2016/CC7.EmissionsMethodology/7.4_Emission Factors_JBS Global GHG Emissions 2015.xlsx https://www.cdp.net/sites/2016/30/9730/Climate Change 2016/Shared Documents/Attachments/ClimateChange2016/CC7.EmissionsMethodology/7.4_Emission Factors_JBS Global GHG Emissions 2015.pdf
Page: CC8. Emissions Data - (1 Jan 2015 - 31 Dec 2015)
CC8.1
Please select the boundary you are using for your Scope 1 and 2 greenhouse gas inventory
Operational control
CC8.2
Please provide your gross global Scope 1 emissions figures in metric tonnes CO2e
4445098.00
CC8.3
Does your company have any operations in markets providing product or supplier specific data in the form of contractual instruments?
No
CC8.3a
Please provide your gross global Scope 2 emissions figures in metric tonnes CO2e

Scope 2,
location-based
Scope 2, market-
based (if applicable)
Comment
1779980.77
JBS in Brazil purchase Energy from marked-based (free market). However, once this energy is provided through the National Grid, JBS does not calculate it as market-based and it was not considered as a low carbon energy. Beside that, it is important to mention that 60% of the energy purchased from free market is considered renewable.
CC8.4
Are there are any sources (e.g. facilities, specific GHGs, activities, geographies, etc.) of Scope 1 and Scope 2 emissions that are within your selected reporting boundary which are not included in your disclosure?
No
CC8.4a
Please provide details of the sources of Scope 1 and Scope 2 emissions that are within your selected reporting boundary which are not included in your disclosure
Source
Relevance of Scope 1 emissions from this
source
Relevance of location-based Scope 2 emissions from this
source
Relevance of market-based Scope 2
emissions from this source (if applicable)
Explain why the source is excluded
CC8.5

Please estimate the level of uncertainty of the total gross global Scope 1 and 2 emissions figures that you have supplied and specify the sources of uncertainty in your data gathering, handling and calculations
Scope
Uncertainty range
Main sources of
uncertainty
Please expand on the uncertainty in your data
Scope 1 More than 2% but less than or equal to 5%
Other: Published Emissions Factors Data Management
In general, the IPCC factors have an uncertainty of 5% for carbon dioxide (GHG most representative). It was not possible to associate uncertainties related to the parameters quantification, because the data was collected aggregately in each unit by independent systems of information management.
Scope 2 (location-based)
More than 2% but less than or equal to 5%
Other: Published Emissions Factors Data Management
The emission factor was estimated based on the energy generation and fuel consumption available. However, the National Operator System (Brazilian Institution) has a strict control of the power plants, therefore we consider that the uncertainty is relatively low.
Scope 2 (market-based)
CC8.6
Please indicate the verification/assurance status that applies to your reported Scope 1 emissions
No third party verification or assurance
CC8.6a
Please provide further details of the verification/assurance undertaken for your Scope 1 emissions, and attach the relevant statements

Verification or
assurance cycle in place
Status in the
current reporting year
Type of verification or
assurance
Attach the statement
Page/section reference
Relevant standard
Proportion of reported Scope 1 emissions
verified (%)
CC8.6b
Please provide further details of the regulatory regime to which you are complying that specifies the use of Continuous Emissions Monitoring Systems (CEMS)
Regulation
% of emissions covered by the system
Compliance period
Evidence of submission
CC8.7
Please indicate the verification/assurance status that applies to at least one of your reported Scope 2 emissions figures
No third party verification or assurance
CC8.7a
Please provide further details of the verification/assurance undertaken for your location-based and/or market-based Scope 2 emissions, and attach the relevant statements

Location-based or
market-based figure?
Verification or
assurance cycle in place
Status in the
current reporting year
Type of verification
or assurance
Attach the statement
Page/Section reference
Relevant standard
Proportion of
reported Scope 2 emissions verified
(%)
CC8.8
Please identify if any data points have been verified as part of the third party verification work undertaken, other than the verification of emissions figures reported in CC8.6, CC8.7 and CC14.2
Additional data points verified
Comment
Other: Not applicable Not applicable
CC8.9
Are carbon dioxide emissions from biologically sequestered carbon relevant to your organization?
Yes
CC8.9a
Please provide the emissions from biologically sequestered carbon relevant to your organization in metric tonnes CO2
2713532.66
Further Information

Page: CC9. Scope 1 Emissions Breakdown - (1 Jan 2015 - 31 Dec 2015)
CC9.1
Do you have Scope 1 emissions sources in more than one country?
Yes
CC9.1a
Please break down your total gross global Scope 1 emissions by country/region
Country/Region
Scope 1 metric tonnes CO2e
Brazil 611341.55
Italy 3181.82
Argentina 41419.19
Paraguay 806.19
Uruguay 2436.33
China 1859.58
Germany 144.26
Mexico 121982.40
United Kingdom 91881.98
Ireland 416.85
France 10661.43
United States of America 2282083.05
Canada 177533.50
Australia 1097056.66
Puerto Rico 2293.22

CC9.2
Please indicate which other Scope 1 emissions breakdowns you are able to provide (tick all that apply)
By business division By GHG type By activity
CC9.2a
Please break down your total gross global Scope 1 emissions by business division
Business division
Scope 1 emissions (metric tonnes CO2e)
JBS Europa 106142.07
JBS Foods 186252.00
JBS Mercosul 471919.09
JBS USA 3680784.84
CC9.2b
Please break down your total gross global Scope 1 emissions by facility
Facility
Scope 1 emissions (metric tonnes CO2e)
Latitude
Longitude
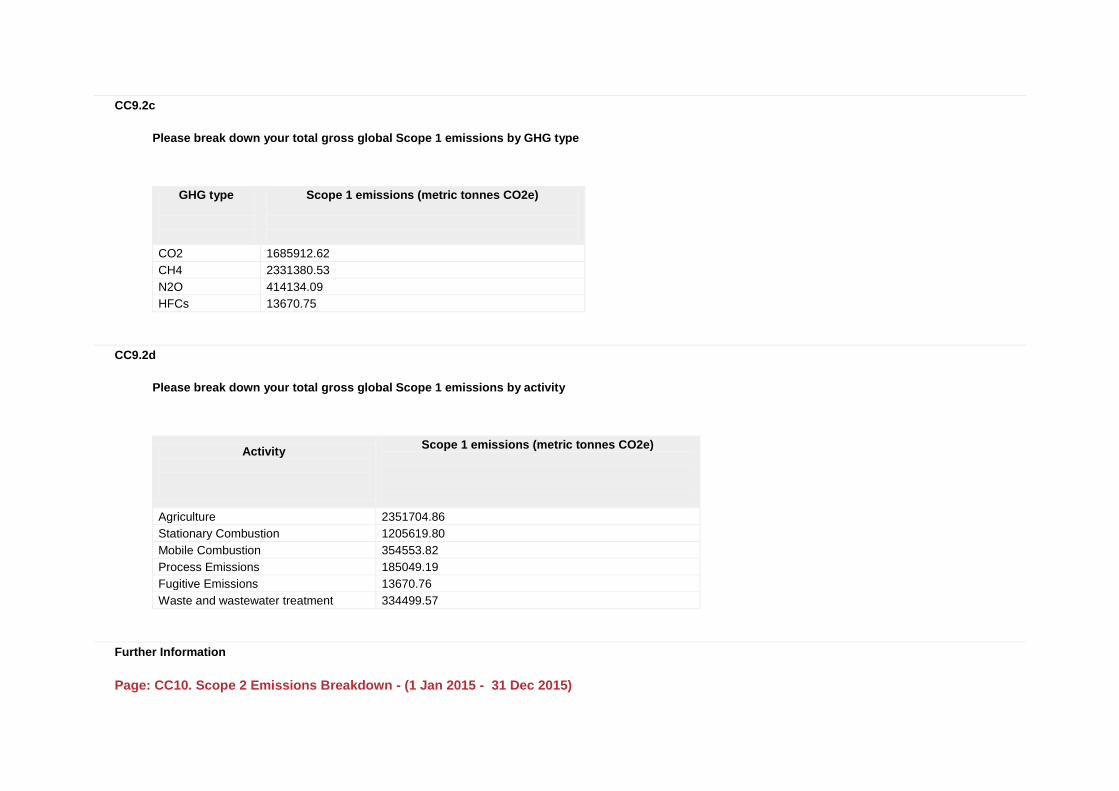
CC9.2c
Please break down your total gross global Scope 1 emissions by GHG type
GHG type
Scope 1 emissions (metric tonnes CO2e)
CO2 1685912.62
CH4 2331380.53
N2O 414134.09
HFCs 13670.75
CC9.2d
Please break down your total gross global Scope 1 emissions by activity
Activity
Scope 1 emissions (metric tonnes CO2e)
Agriculture 2351704.86
Stationary Combustion 1205619.80
Mobile Combustion 354553.82
Process Emissions 185049.19
Fugitive Emissions 13670.76
Waste and wastewater treatment 334499.57
Further Information
Page: CC10. Scope 2 Emissions Breakdown - (1 Jan 2015 - 31 Dec 2015)

CC10.1
Do you have Scope 2 emissions sources in more than one country?
Yes
CC10.1a
Please break down your total gross global Scope 2 emissions and energy consumption by country/region
Country/Region
Scope 2, location-based (metric
tonnes CO2e)
Scope 2, market-based (metric tonnes CO2e)
Purchased and consumed
electricity, heat, steam or cooling
(MWh)
Purchased and consumed low carbon electricity, heat, steam or
cooling accounted in market-based approach (MWh)
Brazil 297051.36 0 3212511.44 0
Italy 3701.43 0 9277.00 0
Argentina 30122.23 0 62236.01 0
Paraguay 4530.54 0 24593.10 0
Uruguay 4790.05 0 26001.78 0
China 4158.16 0 5526.17 0
Germany 72.10 0 152.82 0
Mexico 65530.96 0 146157.01 0
United Kingdom 54072.37 0 293520.60 0
Ireland 929.59 0 5046.08 0
France 2394.57 0 40835.13 0
United States of America
985451.25 0 1977031.29 0
Canada 13458.46 0 82043.75 0
Australia 311458.14 0 382814.83 0
Puerto Rico 2259.56 0 12265.55 0

CC10.2
Please indicate which other Scope 2 emissions breakdowns you are able to provide (tick all that apply)
By business division
CC10.2a
Please break down your total gross global Scope 2 emissions by business division
Business division
Scope 2 emissions, location based (metric tonnes CO2e)
Scope 2 emissions, market-based
(metric tonnes CO2e)
JBS Europa 61097.95 0
JBS Foods 194852.96 0
JBS Mercosul 145961.33 0
JBS USA 1378068.53 0
CC10.2b
Please break down your total gross global Scope 2 emissions by facility
Facility
Scope 2 emissions, location based (metric tonnes CO2e)
Scope 2 emissions, market-based
(metric tonnes CO2e)
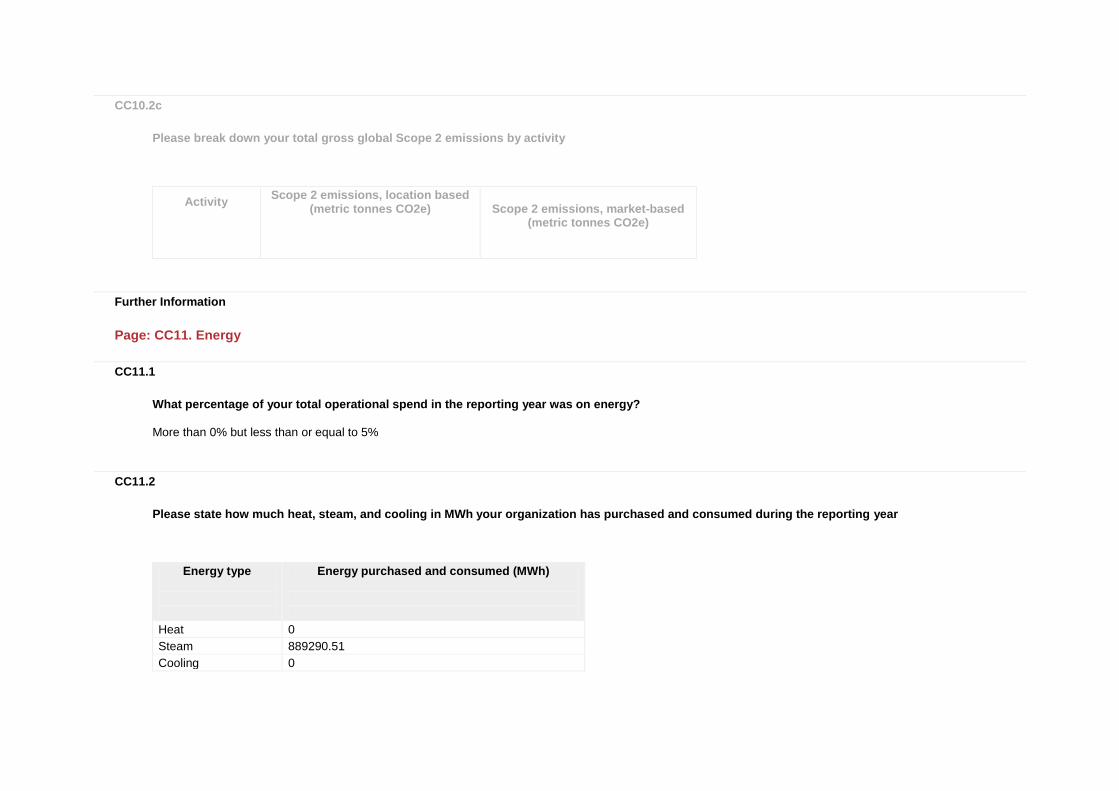
CC10.2c
Please break down your total gross global Scope 2 emissions by activity
Activity
Scope 2 emissions, location based (metric tonnes CO2e)
Scope 2 emissions, market-based
(metric tonnes CO2e)
Further Information
Page: CC11. Energy
CC11.1
What percentage of your total operational spend in the reporting year was on energy?
More than 0% but less than or equal to 5%
CC11.2
Please state how much heat, steam, and cooling in MWh your organization has purchased and consumed during the reporting year
Energy type
Energy purchased and consumed (MWh)
Heat 0
Steam 889290.51
Cooling 0

CC11.3
Please state how much fuel in MWh your organization has consumed (for energy purposes) during the reporting year
13142629.04
CC11.3a
Please complete the table by breaking down the total "Fuel" figure entered above by fuel type
Fuels
MWh
Diesel/Gas oil 1501578.35
Biodiesels 0.01
Natural gas 5054426.13
Liquefied petroleum gas (LPG) 246003.57
Wood or wood waste 5241861.77
Naphtha 1.85
Motor gasoline 29010.23
Propane 1426.01
Butane 2.80
Bituminous coal 144598.68
Shale oil 21320.69
Residual fuel oil 43017.81
Biogas 141567.50
Kerosene 2.45
Other: Vegetable waste 1324.90
Other: Tallow 63610.91
Other: Sawdust 56738.34
Other: Ethanol 510.77
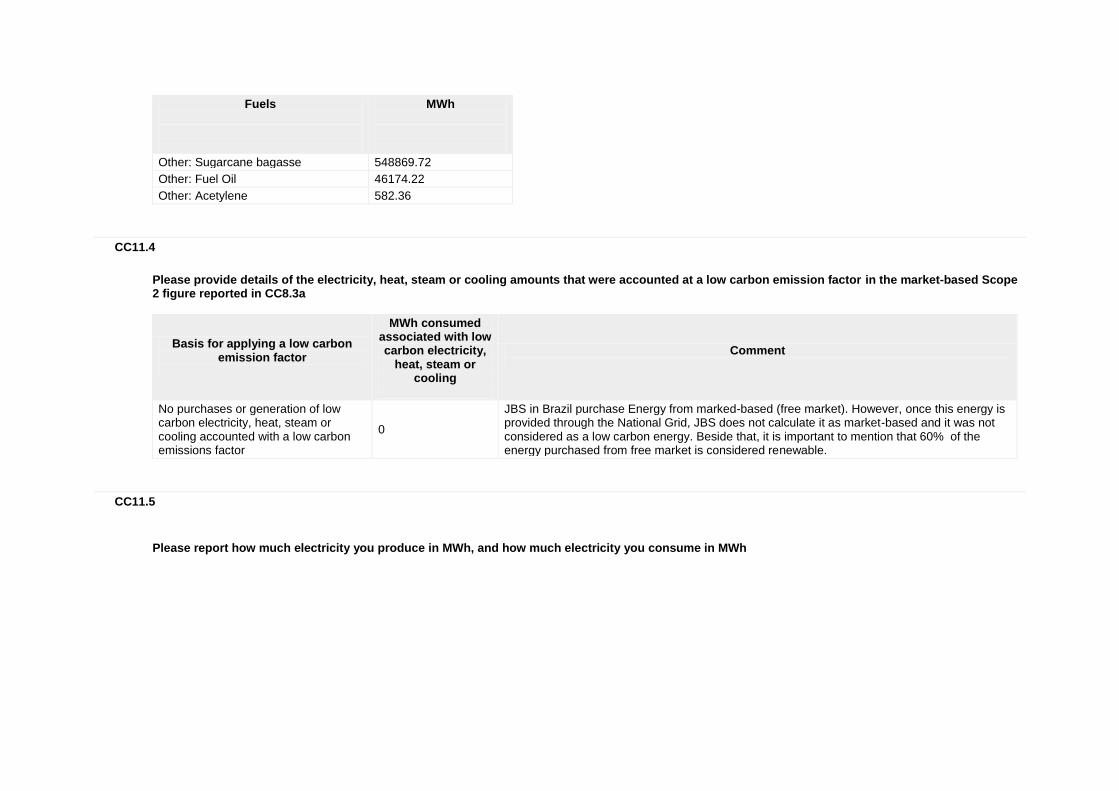
Fuels
MWh
Other: Sugarcane bagasse 548869.72
Other: Fuel Oil 46174.22
Other: Acetylene 582.36
CC11.4
Please provide details of the electricity, heat, steam or cooling amounts that were accounted at a low carbon emission factor in the market-based Scope 2 figure reported in CC8.3a
Basis for applying a low carbon emission factor
MWh consumed associated with low carbon electricity,
heat, steam or cooling
Comment
No purchases or generation of low carbon electricity, heat, steam or cooling accounted with a low carbon emissions factor
0
JBS in Brazil purchase Energy from marked-based (free market). However, once this energy is provided through the National Grid, JBS does not calculate it as market-based and it was not considered as a low carbon energy. Beside that, it is important to mention that 60% of the energy purchased from free market is considered renewable.
CC11.5
Please report how much electricity you produce in MWh, and how much electricity you consume in MWh

Total electricity consumed
(MWh)
Consumed
electricity that is purchased (MWh)
Total electricity produced
(MWh)
Total renewable
electricity produced (MWh)
Consumed renewable
electricity that is produced by company (MWh)
Comment
5409610.28 5390722.04 179697.43 179697.43 18888.24
Further Information
Page: CC12. Emissions Performance
CC12.1
How do your gross global emissions (Scope 1 and 2 combined) for the reporting year compare to the previous year?
Increased
CC12.1a
Please identify the reasons for any change in your gross global emissions (Scope 1 and 2 combined) and for each of them specify how your emissions compare to the previous year
Reason
Emissions value
(percentage)
Direction of change
Please explain and include calculation
Emissions reduction activities
2 Decrease
"In 2015 it is estimated that 118,438 tCO2e were reduced by JBS's emissions reduction projects implemented in the previous years, which reduced emission in 2015. Considering that the total Scope 1 and Scope 2 emissions in 2014 was 5,869,648 tCO2e, therefore we arrived at 2% (118,438 / 5,869,648 = 0.02 *100 = 2%). This is an estimated decrease (avoided emissions) in global scope 1+2 emissions and the main emissions reductions projects were developed for fossil fuel replacement, improvement on wastewater treatment and logistics."

Reason
Emissions value
(percentage)
Direction of change
Please explain and include calculation
Divestment
Acquisitions 2.7 Increase In 2015 JBS acquired the operations of MoyPark located in Europe. The emissions of this operation increased the JBS Scope 1 and 2 emissions in 2% ((160,356.8 / 5,869,648 = 0.027 *100 = 2.7%), once it represented 160,357 tonnes of CO2e in 2015 and considering the 2014 JBS Scope 1 and 2 emissions.
Mergers
Change in output
Change in methodology
Change in boundary
Change in physical operating conditions
Unidentified
Other
CC12.1b
Is your emissions performance calculations in CC12.1 and CC12.1a based on a location-based Scope 2 emissions figure or a market-based Scope 2 emissions figure?
Location-based
CC12.2
Please describe your gross global combined Scope 1 and 2 emissions for the reporting year in metric tonnes CO2e per unit currency total revenue

Intensity figure =
Metric numerator (Gross global combined
Scope 1 and 2 emissions)
Metric denominator:
Unit total revenue
Scope 2 figure used
% change
from previous
year
Direction of change
from previous
year
Reason for change
0.000032 metric tonnes CO2e 162900000000.00 Location-based
21.5 Decrease
In 2015 there was a slight increase in scope 1 emissions and an increase of 22% in scope 2, mainly due to the acquisition by JBS Australia of Andrews Meats and Primo Smallgoods and inclusion of Moypark, which means a variation in Scopes 1 and 2 of roughly 6%. However, due to an increase about 35% in revenues, the intensity figure has decreased over 21%.
CC12.3
Please provide any additional intensity (normalized) metrics that are appropriate to your business operations
Intensity figure =
Metric numerator (Gross global combined
Scope 1 and 2 emissions)
Metric denominator
Metric
denominator: Unit total
Scope 2 figure used
% change
from previous
year
Direction of
change from
previous year
Reason for change
2.123 metric tonnes CO2e Other: thousand metric tonnes of product
355413.86 Location-based
3.7 Increase
This intensity figures considers only the emissions and production of the Brazilians units of JBS Beef, JBS Leather and JBS Foods, once it represents more than 90% of all JBS Brasil production. The small increase in intensity compared to 2014 is mainly due to the acquisition of new production units, farms and distribution centers in Brazil. Moreover JBS improve wastewater data quality and gathering, which, consequently required the adequacy of the calculation

Intensity figure =
Metric numerator (Gross global combined
Scope 1 and 2 emissions)
Metric denominator
Metric
denominator: Unit total
Scope 2 figure used
% change
from previous
year
Direction of
change from
previous year
Reason for change
methodologies.
Further Information
Page: CC13. Emissions Trading
CC13.1
Do you participate in any emissions trading schemes?
Yes
CC13.1a
Please complete the following table for each of the emission trading schemes in which you participate
Scheme name
Period for which data is supplied
Allowances allocated
Allowances purchased
Verified emissions in metric tonnes
CO2e
Details of ownership
European Union ETS
Thu 01 Jan 2015 - Thu 31 Dec 2015
8663 12000 20273 Facilities we own and operate

CC13.1b
What is your strategy for complying with the schemes in which you participate or anticipate participating?
The more countries face national or multinational agreements on climate change mitigation issues, more companies located in those countries must comply with them, mainly through emission trading schemes. In 2015 the only JBS business unit that was actively participating in an emissions trading scheme was Moypark, located in UK and France. In UK, due to the "Climate Change Agreements", Moypark complies with that agreement by also participating in EU ETS through emissions reduction projects and buying the necessary allowances. The agreement states that if the UK is to cut its greenhouse gas emissions by 80% by 2050, energy efficiency will have to increase across all sectors to the extent that energy use per capita is between a fifth and a half lower than it is today.
CC13.2
Has your organization originated any project-based carbon credits or purchased any within the reporting period?
Yes
CC13.2a
Please provide details on the project-based carbon credits originated or purchased by your organization in the reporting period
Credit origination
or credit purchase
Project type
Project identification
Verified to which
standard
Number of
credits (metric tonnes
of CO2e)
Number of
credits (metric tonnes CO2e):
Risk adjusted volume
Credits cancelled
Purpose, e.g.
compliance

Credit origination
or credit purchase
Project type
Project identification
Verified to which
standard
Number of
credits (metric tonnes
of CO2e)
Number of
credits (metric tonnes CO2e):
Risk adjusted volume
Credits cancelled
Purpose, e.g.
compliance
Credit origination
Methane avoidance
Project 2610 : Project JBS S/A – Slaughterhouse Wastewater Aerobic Treatment – Vilhena Unit http://cdm.unfccc.int/Projects/DB/TUEV-SUED1243507454.91/view
CDM (Clean Development Mechanism)
29912 29912 No Voluntary Offsetting
Credit origination
Methane avoidance
Project 2609 : Project JBS S/A – Slaughterhouse Wastewater Aerobic Treatment – Barra do Garças Unit http://cdm.unfccc.int/Projects/DB/TUEVSUED1243498760.08/ view
CDM (Clean Development Mechanism)
43154 43154 No Voluntary Offsetting
Further Information
Page: CC14. Scope 3 Emissions
CC14.1
Please account for your organization’s Scope 3 emissions, disclosing and explaining any exclusions

Sources of Scope 3
emissions
Evaluation status
metric tonnes CO2e
Emissions calculation methodology
Percentage of emissions
calculated using data obtained
from suppliers or value chain
partners
Explanation
Purchased goods and services
Relevant, not yet calculated
Due to its very wide supply chain, by the end of 2015 JBS did not find a consensus about the best methodology to calculate it, an efficient and feasible manner.
Capital goods Not relevant, explanation provided
Capital goods required for the Company's operations do not contribute to their exposure to risks related to climate change and are not considered critical by stakeholders, and especially those associated with the life cycle emissions cannot be significantly influenced by the Company. Furthermore, compared to emissions associated with purchased goods (mainly animals and meat), these emissions would be negligible.
Fuel-and-energy-related activities (not included in Scope 1 or 2)
Not relevant, explanation provided
The Company's activities do not require anything special in relation to the extraction / production and transport of fuels and energy. Thus, the emissions associated with these activities would be negligible forward to the emissions associated with purchased animals and meat, which are what the Company can influence more and more attract the attention of stakeholders.
Upstream transportation and distribution
Relevant, calculated
567396.91
The methodology used to calculate this GHG emissions complies with “The Greenhouse Gas Protocol: A Corporate Accounting and Reporting Standard (Revised Edition)” and IPCC Guidelines for National Greenhouse Gas Inventories, 2006. For Brazil, it was considered national emission factors, according to Brazil GHG
100.00%
Emissions from transport and distribution of products purchased or acquired by the organization. Road and rail transports contracted by JBS are included.

Sources of Scope 3
emissions
Evaluation status
metric tonnes CO2e
Emissions calculation methodology
Percentage of emissions
calculated using data obtained
from suppliers or value chain
partners
Explanation
Protocol Programme.
Waste generated in operations
Relevant, calculated
2256709.25
The methodology used to calculate this GHG emissions complies with “The Greenhouse Gas Protocol: A Corporate Accounting and Reporting Standard (Revised Edition)” and IPCC Guidelines for National Greenhouse Gas Inventories, 2006.
100.00%
Emissions from external treatment of residues (landfill, composting, incineration and fertigation), wastewater and fertigation from the organization's operations.
Business travel Relevant, calculated
10215.89 The methodology applied is the Guidelines to Defra / DECC's GHG Conversion Factors for Company Reporting.
100.00% The emissions described refer to the air travels of JBS staff.
Employee commuting
Relevant, calculated
23319.87 The methodology applied complies with Brazil GHG Protocol Programme.
100.00% Emissions from this category are partially reported (only for Brazil).
Upstream leased assets
Not relevant, explanation provided
Upstream leased assets required for the Company's operations do not contribute to their exposure to risks related to climate change and are not considered critical by stakeholders, and especially those associated with the life cycle emissions cannot be significantly influenced by the Company. Furthermore, compared to emissions associated with purchased goods (mainly animals and meat), these emissions would be negligible.
Downstream transportation and distribution
Relevant, calculated
98600.20
The methodology used to calculate this GHG emissions complies with “The Greenhouse Gas Protocol: A Corporate Accounting and Reporting Standard (Revised Edition)” and IPCC Guidelines for National Greenhouse Gas Inventories, 2006. For Brazil, it was considered national emission factors, according to Brazil GHG
100.00%
Emissions from transport and distribution of products sold by the organization. Emissions from road and rail transports contracted by the JBS are included.

Sources of Scope 3
emissions
Evaluation status
metric tonnes CO2e
Emissions calculation methodology
Percentage of emissions
calculated using data obtained
from suppliers or value chain
partners
Explanation
Protocol Programme.
Processing of sold products
Not relevant, explanation provided
0
The vast majority of sales are now to the end consumer, not needing subsequent processing steps.
Use of sold products
Not relevant, explanation provided
The use of goods sold consists of the consumption of meat and processed food to meet nutritional needs. The only emissions associated would be the use of energy (or fuel) for cooking / preparation and refrigeration products and fugitive emissions related to refrigerants.
End of life treatment of sold products
Not relevant, explanation provided
The term treatment of end of life cycle does not properly apply to products sold, since these are ingested by consumers. The exception would be in cases where the products become unfit for consumption and must be discarded. However, you can make this assessment on packaging in which products are sold, as they can result in some issue if they are disposed of in landfills or incinerated.
Downstream leased assets
Not relevant, explanation provided
Compared to the owned units themselves, the leased plants are not relevant.
Franchises Not relevant, explanation provided
Not applicable to JBS operations.
Investments Not relevant, explanation provided
Emissions of investments are not significant in comparison with the other scope 3 emissions.
Other (upstream)

Sources of Scope 3
emissions
Evaluation status
metric tonnes CO2e
Emissions calculation methodology
Percentage of emissions
calculated using data obtained
from suppliers or value chain
partners
Explanation
Other (downstream)
CC14.2
Please indicate the verification/assurance status that applies to your reported Scope 3 emissions
No third party verification or assurance
CC14.2a
Please provide further details of the verification/assurance undertaken, and attach the relevant statements
Verification or
assurance cycle in place
Status in the
current reporting year
Type of
verification or assurance
Attach the statement
Page/Section reference
Relevant standard
Proportion of
reported Scope 3 emissions verified (%)
CC14.3

Are you able to compare your Scope 3 emissions for the reporting year with those for the previous year for any sources?
Yes
CC14.3a
Please identify the reasons for any change in your Scope 3 emissions and for each of them specify how your emissions compare to the previous year
Sources of
Scope 3 emissions
Reason for
change
Emissions
value (percentage)
Direction of change
Comment
Upstream transportation & distribution
Other: Improvement on data gathering
79.72 Increase
Emissions from upstream transport and distribution. The emissions in 2014 was 315,711.6 tCO2 and in 2015 was 567,396.9. (Emission increase = 251,685 tCO2e / 2014 Emission = 315,712 tCO2e)*100 = 79.7% The identified main reasons were: improvement on data gathering.
Waste generated in operations
Change in boundary
463 Increase
In 2014 the scope 3 emissions of waste generated in operations did not account emissions from the JBS units outside Brazil. In 2015, it was possible to gather the waste data from this operations, so then the Company was able to calculate it emissions. The emissions from this source in operations outside Brazil totalized 1,911,138.6 tCO2e in 2015 and the 2014 emission in JBS from this source was 412,504 tCO2e. Calculation: (1,911,138.6/ 412,504.5)*100 = 463%
Business travel Other: Improvement on data gathering
13.50 Increase
Emissions from upstream transport and distribution. The emission in 2014 was 9,000.6 tCO2 and in 2015 was 10,215.9. (Emission increase = 1,215.2 tCO2e / 2014 Emission = 9,000.6 tCO2e)*100 = 13.5% The identified main reasons were: improvement on data gathering.
Employee commuting
Other: Improvement on data gathering
35.43 Increase
Emissions from upstream transport and distribution. The emissions in 2014 was 17,219.7 tCO2 and in 2015 was 23,319.9. (Emission increase = 6,100 tCO2e / 2014 Emission = 17,219,8 tCO2e)*100 = 35.43% The identified main reasons were: improvement on data gathering.
CC14.4

Do you engage with any of the elements of your value chain on GHG emissions and climate change strategies? (Tick all that apply)
Yes, our suppliers Yes, our customers
CC14.4a
Please give details of methods of engagement, your strategy for prioritizing engagement and measures of success
JBS sustainability strategy is to focus on its supply chain prioritizing initiatives that promotes sustainable best practices on its cattle suppliers and avoiding deforestation from its value chain, accordingly to its priorities issues of its business strategy. JBS is a founding member of the Committee and the Executive Council of the Global Roundtable for Sustainable Beef in US - and currently board member of the Brazilian Roundtable on Sustainable Livestock. The Company maintains frequent dialogue with its suppliers, non-governmental organizations and the government and developed Good Practices in order to assist the producers accordingly helping to cultivate transparency between it and its cattle suppliers to promote the strengthening of value chain. One of JBS public commitments is the engagement in combating deforestation. Therefore, practical actions have also been applied in policy and in livestock sector of our cattle supply. Through the “Legal Supplier” Program, JBS has built a network of environmental consulting to assist the Company's cattle suppliers to comply with the Rural Environmental Registry of their properties. In addition, the “Easy Map” Program a tool that has been developed which enables the JBS cattle suppliers the opportunity to elaborate their georeferenced map of the properties for free at any of the units located in the Amazon. Besides, JBS has developed a system for social and environmental monitoring of cattle suppliers and, in a partnership with a NGO, maintains the New Field Program. Its aim is to promote sustainable cattle raising in the Amazon biome, developing production models that improve management, increase productivity, increment quality in the product delivered to the market, reduce emissions of greenhouse gases in the production system (mainly avoided deforestation) and comply with environmental legislation. Livestock farmers received help to refurbish degraded pasture, institute integrated management practices for pastureland and increase the number of cattle the property could handle. The results were that not only farm incomes rose, but also the properties automatically started to implement a more environmentally responsible production model. The application of best practices techniques allowed the number of head per hectare to rise from 1 to 3, increasing efficiency without the need to create additional farmland, therefore less the need to deforest new land. Beneficiated farms already are more than five times more productive than state average. In order to encourage farmer´s participation JBS promised to purchase animals from this first phase of the program and is currently developing a specific bonus protocol for livestock farmers. The idea is to create an award for farmers who can ensure that animals sold through the Company offer both quality and sustainability, giving to end consumers sustainable products that stand out. The project is expected to grow, and the model to be replicated at other properties in Amazon. In 2014, JBS’s system for social and environmental monitoring of cattle suppliers achieved a compliance level of 99.97% .The 2015 audit was in progress at the moment of CDP report and its results will be made available in JBS site. Further, a pilot audit performed by an independent assurance firm confirmed that JBS is deploying raw material control systems for the acquisition of cattle only in areas without illegal logging, without invasion of public land and no slave labour in the state of Pará in Brazil, from an agreement made with the Federal Public Ministry since 2009. Regarding its customer, JBS has been engaged with different customers, as KFC, McDonald’s and Walmart, regarding sustainability best practices. In 2015, McDonalds awarded JBS in CDP Supply Chain Water. Poultry and pork suppliers undergo a social and environmental assessment to be part of the JBS supplier’s portfolio. The rating ranks suppliers in 3 colors: greens are approved, Yellow go through a committee before its approval and red is reproved. Any project for suppliers expansion for new registration, also undergo this assessment. Poultry and pork suppliers that are approved have to comply with environmental legislation and to have its operating license approved by the environmental agency. In addition, all farms are visited and receive technical guidance from various topics, including environmental.

Concluding, the measurement of success is through the recognition of our customers, increasing of our revenues and acknowledgments and prizes won by JBS due to its value chain sustainable programs.
CC14.4b
To give a sense of scale of this engagement, please give the number of suppliers with whom you are engaging and the proportion of your total spend that they represent
Number of suppliers
% of total spend (direct and indirect)
Comment
83000 100% Social and Environmental Monitoring of Cattle, Poultry and Pork Suppliers.
CC14.4c
If you have data on your suppliers’ GHG emissions and climate change strategies, please explain how you make use of that data
How you make use of the data
Please give details
Use in supplier scorecards
The Company follows closely a list continuously audited by IBAMA (Brazilian Environmental Institute) that points out farms that are not in accordance with national regulation, immediately interrupting commercial relationships with those suppliers, which guarantees the provenance of all cattle shipped. Poultry and pork suppliers undergo a social and environmental assessment to be part of the JBS supplier’s portfolio. The rating ranks suppliers in 3 colors: greens are approved, Yellow go through a committee before its approval and red is reproved. Any project for suppliers expansion for new registration, also undergo this assessment. Poultry and pork suppliers that are approved have to comply with environmental legislation and to have its operating license approved by the environmental agency. In addition, all farms are visited and receive technical guidance from various topics, including environmental.
CC14.4d
Please explain why you do not engage with any elements of your value chain on GHG emissions and climate change strategies, and any plans you have to develop an engagement strategy in the future

Further Information
Module: Sign Off
Page: CC15. Sign Off
CC15.1
Please provide the following information for the person that has signed off (approved) your CDP climate change response
Name
Job title
Corresponding job category
Márcio Nappo Sustainability Director Director on board
Further Information
Module: FBT
Page: FBT1. Agriculture
FBT1.1
Are agricultural activities, whether in your direct operations or elsewhere in your value chain, relevant to your climate change disclosure?
Yes
FBT1.1a
Please explain why agricultural activities are not relevant to your climate change disclosure

FBT1.2
Are the agricultural activities that you have identified as relevant undertaken on your own farm(s), elsewhere in your value chain, or both?
Both own farm(s) and elsewhere in value chain
FBT1.2a
Please explain why agricultural emissions from your own farms are not relevant
FBT1.3
Do you account for greenhouse gas emissions from agricultural activities undertaken on your own farm(s) as part of the global gross Scope 1 emissions figure reported in CC8.2, and/or the Scope 2 figure reported in CC8.3a of the core climate change questionnaire?
Yes
FBT1.3a
Please select the form(s) in which you wish to report the greenhouse gas emissions produced by agricultural activities (agricultural emissions) undertaken on your own farm(s)
Total agricultural emissions separated by Scope 1 and 2
FBT1.3b
Please report your total agricultural emissions produced on your own farm(s) and identify any exclusions in the table below
Scope
Agricultural emissions (metric
tonnes CO2e)
Methodology
Exclusions
Explanation
Comment

Scope
Agricultural emissions (metric
tonnes CO2e)
Methodology
Exclusions
Explanation
Comment
Scope 1 2351704.86 Default emissions factors
None Considered emissions from enteric fermentation, manure management and fertirrigation.
Scope 2 22646.07 Default emissions factors
None Considered the scope 2 emissions from confinement activities and Brazilian Poultry and Pork Farms
FBT1.3c
Please report your agricultural emissions produced on your own farm(s), disaggregated by category, and identify any exclusions in the table below
Emissions category
Agricultural
emissions (metric tonnes CO2e)
Methodology
Exclusions
Explanation
Comment
FBT1.3d
Please explain why you do not account for greenhouse gas emissions from agricultural activities undertaken on your own farm(s), and describe any plans for the collection of this data in the future
FBT1.4
Do you implement agricultural management practices on your own farm(s) with a climate change mitigation and/or adaptation benefit?
Yes
FBT1.4a

Please identify agricultural management practices undertaken on your own farm(s) with a climate change mitigation and/or adaptation benefit. Complete the table
Activity ID
Agricultural
management practice
Description of agricultural management practice
Climate change related benefit
Comment
1 Waste management
Waste management for the production of fertilizers through aerobic composting.
Emissions reductions (mitigation)
In Brazil, 60% of the composition of the overall waste is organic matter that is possible to recycling through the composting process (Brazilian Ministry of Environment).
FBT1.4b
Does your implementation of these agricultural management practices have other impacts? Complete the table
Activity ID
Impact on yield
Impact on cost
Impact on soil quality
Impact on biodiversity
Impact on water
Other impact
Description of impacts
Comment
1 Evaluated - no impact
Evaluated - beneficial impact
Evaluated - beneficial impact
Evaluated - beneficial impact
Evaluated - beneficial impact
0
Waste management for the production of fertilizers through aerobic composting generates positive impacts in cost, soil quality, biodiversity, water and climate change. The activity avoids the disposal in landfill and provides revenue through the fertilizer sale. Moreover, the fertilizer improves the soil quality and biodiversity. Other impact: GHG emissions reduction.
FBT1.4c
Do you have any plans to implement agricultural management practices in the future?
Yes
FBT1.4d

Please detail your plans to implement agricultural management practices in the future
JBS and the Brazilian NGO Instituto Centro de Vida (ICV) promotes sustainable cattle raising in the Amazon biome (New Field Program), through the reduction of emissions of greenhouse gases in the production system (mainly avoided deforestation) and comply with environmental legislation. Livestock farmers received help to refurbish degraded pasture, institute integrated management practices for pastureland and increase the number of cattle the property could handle. The results were that not only farm incomes rose, but also the properties automatically started to implement a more environmentally responsible production model. The application of best practices techniques allowed the number of head per hectare to rise from 1 to 3, increasing efficiency without the need to create additional farmland, therefore less the need to deforest new land. Beneficiated farms already are more than five times more productive than state average. In order to encourage farmer´s participation JBS promised to purchase animals from this first phase of the program and is currently developing a specific bonus protocol for livestock farmers. The idea is to create an award for farmers who can ensure that animals sold through the Company offer both quality and sustainability, giving to end consumers sustainable products that stand out. The project is expected to grow, and the model to be replicated at other properties in Amazon. Poultry and pork suppliers undergo a social and environmental assessment to be part of the JBS supplier’s portfolio. The rating ranks suppliers in 3 colors: greens are approved, Yellow go through a committee before its approval and red is reproved. Any project for suppliers expansion for new registration, also undergo this assessment. Poultry and pork suppliers that are approved have to comply with environmental legislation and to have its operating license approved by the environmental agency. In addition, all farms are visited and receive technical guidance from various topics, including environmental. Also, he GHG Protocol Agriculture methodology support continued in 2015, when JBS supports the work of partner organizations such as World Resources Institute (WRI) in the training and field testing of this tool, complying a sample of its cattle suppliers.
FBT1.5
Is biogenic carbon pertaining to your own farm(s) relevant to your climate change disclosure?
No
FBT1.5a
Please report biogenic carbon data pertaining to your own farm(s) in the table below
CO2 flux
Emissions/
Removals (metric tonnes CO2e)
Methodology
Exclusions
Explanation
Comment

FBT1.6
Do you account for greenhouse gas emissions from agricultural activities in your value chain as part of the Scope 3 category "Purchased goods and services" reported in CC14.1 of the core climate change questionnaire?
No
FBT1.6a
Please report these agricultural emissions from your value chain and identify any exclusions in the table below
Scope
Agricultural emissions (% of the emissions reported in the category “Purchased goods
and services”)
Exclusions
Explanation
Comment
FBT1.6b
Please explain why you do not account for greenhouse gas emissions from agricultural activities in your value chain as part of the Scope 3 category “Purchased goods and services” reported in CC14.1 of the core climate change questionnaire
In 2015, JBS supported the work of World Resources Institute (WRI) in the trained and field testing of the tool derived from the GHG Protocol Agriculture methodology, complying a sample of its cattle suppliers. Due to its very wide supply chain, by the end of 2015 it was not possible to compile and approves these data.
FBT1.7
Do you encourage your agricultural suppliers to undertake any agricultural management practices with a climate change mitigation and/or adaptation benefit?
Yes

FBT1.7a
Please identify agricultural management practices with a climate change mitigation and/or adaptation benefit that you encourage your suppliers to implement. Complete the table
Activity ID
Agricultural
management practice
Description of agricultural
management practice
Your role in the implementation of this practice
Explanation of how you encourage implementation
Climate change related benefit
Comment
1 Land use change
JBS and the Brazilian NGO Instituto Centro de Vida (ICV) promotes sustainable cattle raising in the Amazon biome (New Field Program), through the reduction of emissions of greenhouse gases in the production system (mainly avoided deforestation) and comply with environmental legislation.
Procurement
The JBS role is to develop bonus protocols for purchase of cattle in the project area that comply with the criteria of quality and the basic requirements of Good Agricultural Practices. The idea is to create an award for farmers who can ensure that animals sold through the Company offer both quality and sustainability, giving to end consumers sustainable products that stand out. In addition, the Company support the dissemination of results of Good Agricultural Practices through corporate videos, brochures, field days in conjunction with the ICV team and training of technical and ranchers regarding good practice.
Emissions reductions (mitigation) Increasing resilience to climate change (adaptation)
Livestock farmers received help to refurbish degraded pasture, institute integrated management practices for pasture land and increase the number of cattle the property could handle. The results were that not only farm incomes rose, but the properties automatically started to implement a more environmentally responsible production model. The application of best practices techniques allowed the number of head per hectare to rise from 1 to 3, increasing efficiency without the need to create additional farmland, therefore less the need to deforest new land. Beneficiated farms already are more than five times more productive than the state average.
2
Other: Social and environmental monitoring system
Social and environmental monitoring system.
Procurement
JBS prepared internal guidelines on the cattle purchase from the Amazon biome, pledging to purchase cattle only from farms that are in regularity with social, environmental and land standards. The Company’s supplier list is frequently updated
Emissions reductions (mitigation) Increasing resilience to climate change (adaptation)
This action aims to ensure the source of our raw material, but also serves to aid the reduction of deforestation in Amazon Biome, and therefore lower CO2 emissions from forest degradation. The Social and Environmental Suppliers

Activity ID
Agricultural
management practice
Description of agricultural
management practice
Your role in the implementation of this practice
Explanation of how you encourage implementation
Climate change related benefit
Comment
with official list of IBAMA, which indicates farms in environmental non-compliance, and with the Ministry of Labour (MTE), which indicates farms analogous to slave and/or child labour. Whether one falls within any of the list, trade relations are immediately cancelled with suppliers. Besides these controls, JBS performs satellite monitoring, where suppliers are located in Amazon biome. If deforestation is identified in conservation areas, the trade is cancelled, thus preventing the acquisition of raw materials from deforestation.
Monitoring System of JBS is annually audited, independently, to ensure compliance with the Company's commitments to sustainability. In 2014, JBS achieved a compliance level of 99.97%, higher than the result for 2013, which was 99.75% (figures from 2015 not released by this questionnaire deadline). With the fulfilment of the criteria JBS ensures that your entire value chain, including all products and by-products derived from cattle operations are sustainable.
FBT1.7b
Does the implementation of these agricultural management practices in your value chain have other impacts? Complete the table
Activity ID
Impact on yield
Impact on cost
Impact on soil quality
Impact on biodiversity
Impact on water
Other impact
Description of impacts
Comment
1 Evaluated - beneficial impact
Evaluated - beneficial impact
Evaluated - beneficial impact
Evaluated - beneficial impact
Evaluated - beneficial impact
Evaluated - beneficial impact
The New Field Program aims to increase the farm profitability, improving soil quality, reducing the impact on biodiversity and water usage. Other Impact: GHG emissions reduction.
2 Evaluated - no impact
Evaluated - beneficial impact
Evaluated - beneficial impact
Evaluated - beneficial impact
Evaluated - beneficial impact
Evaluated - beneficial impact
The social and environmental monitoring system aims to reduce deforestation in Amazon Biome, reducing consequently

Activity ID
Impact on yield
Impact on cost
Impact on soil quality
Impact on biodiversity
Impact on water
Other impact
Description of impacts
Comment
carbon emission. Other Impact: GHG emissions reductions and positive social impact (avoidance of slave/child labour).
FBT1.7c
Do you have any plans to engage with your suppliers on their implementation of agricultural management practices?
Yes
FBT1.7d
Please detail these plans to engage with your suppliers on their implementation of agricultural management practices
The New Field Program promotes more sustainable production techniques at husbandry farms in the Amazon region, such as: - Intensification of the production area and an increase in productivity (through pasture reform and management); - Nutritional supplementation of the animals to ensure weight gain; - Installation of drinking stations in the grazing areas; - Diversification of income sources, through the planting of trees with commercial value in the legal reserve areas. Since the project start, the breeders who took part in the project perceived a variety of benefits. These included: - Reduction in the production cycle from 44 to 36 months for male animals and from 34 to 26 months for females; - Increase in productivity from 4.7 arrobas (unit of measure corresponding to 15 kilograms) to more than 10 arrobas per hectare per year; - Improvement in the quality of the beef; - Increase in income for producers.
Further Information
Page: FBT2. Processing
FBT2.1

Are processing activities, whether in your direct operations or elsewhere in your value chain, relevant to your climate change disclosure?
Yes
FBT2.1a
Please explain why processing activities are not relevant to your climate change disclosure
FBT2.2
Are the processing activities that you have identified as relevant undertaken in your direct operations, elsewhere in your value chain, or both?
Direct operations
FBT2.2a
Please explain why emissions from processing activities in your direct operations are not relevant
FBT2.3
Do you account for emissions from processing activities in your direct operations as part of the global gross Scope 1 emissions figure reported in CC8.2a and/or the Scope 2 figure reported in CC8.3a of the core climate change questionnaire?
Yes
FBT2.3a
Please report these emissions from processing activities in your direct operations and identify any exclusions in the table below

Scope
Emissions from processing activities (metric tonnes CO2e)
Exclusions
Explanation
Comment
Scope 1 1738839.32 None Considered stationary combustion, process emissions, fugitive emissions and waste and wastewater emissions.
Scope 2 1755613.06 None Emissions from electric energy and steam purchased (except for confinement units, Brazilian poultry and pork farms and offices).
FBT2.3b
Please explain why you do not account for emissions from processing activities in your direct operations, and describe any plans for the collection of this data in the future
FBT2.4
Do you account for emissions from processing activities in your value chain as part of the Scope 3 category "Purchased goods and services" and/or "Processing of sold products" reported in CC14.1 of the core climate change questionnaire?
Further Information
Page: FBT3. Distribution
FBT3.1
Are distribution activities, whether in your direct operations or elsewhere in your value chain, relevant to your climate change disclosure?
Yes
FBT3.1a

Please explain why distribution activities are not relevant to your climate change disclosure
FBT3.2
Are the distribution activities that you have identified as relevant undertaken in your direct operations, elsewhere in your value chain, or both?
Both direct operations and elsewhere in value chain
FBT3.2a
Please explain why emissions from distribution activities in your direct operations are not relevant
FBT3.3
Do you account for emissions from distribution activities in your direct operations as part of the global gross Scope 1 emissions figure reported in CC8.2 and/or the Scope 2 figure reported in CC8.3a of the core climate change questionnaire?
Yes
FBT3.3a
Please report these emissions from distribution activities in your direct operations and identify any exclusions in the table below
Scope
Emissions from distribution activities (metric tonnes CO2e)
Exclusions
Explanation
Comment
Scope 1 354553.82 None Transportation of raw materials and finished product.
Scope 2 610.94 None Emissions from electric energy purchased.

FBT3.3b
Please explain why you do not account for emissions from distribution activities in your direct operations, and describe any plans for the collection of this data in the future
FBT3.4
Do you account for emissions from distribution activities in your value chain as part of the Scope 3 category "Upstream transportation and distribution" and/or "Downstream transportation and distribution" in CC14.1 of the core climate change questionnaire?
Yes
Further Information
Page: FBT4. Consumption
FBT4.1
Are emissions from the consumption of your products relevant to your climate change disclosure?
No
FBT4.1b
Please explain why emissions from the consumption of your products are not relevant to your climate change disclosure
The mostly of JBS products are food, consumed by humans and in a wide variety of ways and locations. For these reasons, any attempt to estimate the emissions from the consumption of JBS products should present a huge uncertainty, besides these emissions could be considered as lower than the emissions from the other parts of the value chain, as agriculture and industrial process, for example.
FBT4.1a
Do you account for emissions from the consumption of your products as part of the Scope 3 category "Use of sold products" and/or "End of life treatment of sold products" in CC14.1 of the core climate change questionnaire?
Further Information
CDP 2016 Climate Change 2016 Information Request