Embed Size (px)
Citation preview

1
CDKL5 localizes at the centrosome and midbody and is required for
faithful cell division
Isabella Barbiero§1, Davide Valente§2, Chetan Chandola§1^, Fiorenza Magi§3^, Anna
Bergo1, Laura Monteonofrio2, Marco Tramarin1, Maria Fazzari4, Silvia Soddu2,
Nicoletta Landsberger4, Cinzia Rinaldo2,3+*, Charlotte Kilstrup-Nielsen1+*
1Department of Biotechnology and Life Sciences, University of Insubria, 21052 Busto
Arsizio, Italy
2Institute of Molecular Biology and Pathology (IBPM), National Research Council
(CNR), c/o Sapienza University, 00185 Rome, Italy
3Unit of Cellular Networks and Molecular Therapeutic Targets, Department of
Research, Advanced Diagnostic, and Technological Innovation, Regina Elena
National Cancer Institute – IRCCS, 00144 Rome, Italy
4Department of Medical Biotechnology and Translational Medicine, University of
Milan, 20090 Segrate, Italy
§These authors contributed equally to the work
*corresponding author: [email protected].
+co-last authors.
^Present addresses: CC: Centre for Drug Research, Division of Pharmaceutical
Biosciences, Univeristy of Helsinki, Finland; FM: Laboratory of Biomedical Research
“Fondazione Niccolò Cusano per la Ricerca Medico-Scientifica”, Niccolò Cusano
University, Rome, Italy.

2
Correspondence: Dr Cinzia Rinaldo, IBPM-CNR, Laboratory of Genetics, Via degli
Apuli, 4, I-00185 Rome, Italy. Phone: +39-06-49917537; e-mail:
[email protected]; [email protected]
Dr. Charlotte Kilstrup-Nielsen, University of Insubria, Via Manara 7, 21052 Busto Arsizio, Italy. Phone +39-0331339430; e-mail: [email protected]

3
Supplementary Figure S1. Specificity of centrosomal localization of CDKL5. (a)
Interphase MRC-5 cells were stained with monoclonal anti-CDKL5 Ab (green) and
anti-γ-tubulin Ab (red). The inset shows the magnified centrosome. (b) MRC-5 cells
were transfected with a control siRNA (siCtr.) or a CDKL5-specific siRNA
(siCDKL5#1). Three days post-silencing the cells were stained with polyclonal anti-
CDKL5 Ab (green) and anti-γ-tubulin Ab (red). The inset shows the magnified
centrosome. Silencing efficiency was verified by western blotting using α-tubulin as
loading control. (c) The fluorescence intensity of CDKL5 at the centrosome was
quantified with Image J. The graph shows the mean fluorescence intensity ±S.E.M. of
95 cells. *** p<0.001, Student’s t test. Scale bar, 5 µm.

4
Supplementary Figure S2. Midbody localization of CDKL5 in HeLa cells can be
detected also with a monoclonal anti-CDKL5 antibody. HeLa cells were stained for
CDKL5 (monoclonal Ab, green), α-tubulin (red), and with DAPI (blue) to visualize
DNA. Representative images of different stages of cytokinesis are shown. Scale bar,
5 µm.

5
Supplementary Figure S3. Mitotic defects in MRC-5 cells silenced for CDKL5. (a)
MRC5 cells were silenced for CDKL5 (si#1 or si#2) using siCtr as control. Silencing
efficiency was verified by western blotting. Asterisk indicates an unspecific band
recognized by the anti-CDKL5 antibody. (b) Graph showing the number of mitotic
cells with multipolar spindles. Data represent mean ±SEM, *p<0.05; **p<0.01 in 4
independent experiments analyzing an average of 74 siCtr and 130 siCDKL5 cells in
each experiment. Differences among groups were analyzed with Kruskall-Wallis and
Dunn’s post-hoc test. (c) Graph showing the number of binucleated cells. Data
represent mean ±SEM, *p<0,05; in 4 independent experiments analyzing an average

6
of 240 siCtr and 365 siCDKL5 cells in each experiment. Differences among groups
were analyzed with Kruskall-Wallis and Dunn’s post-hoc test. Representative image
of normal and binucleated cells stained with anti-α-tubulin (red) and DAPI (blue) is
shown. Scale bar, 10 µm. (d) MRC5 cells silenced for CDKL5 (si#1 and si#2) were
stained for the centromeres (CREST; Antibodies Inc., 15-234-0001; green), α-tubulin
(red), and with DAPI (blue). (e) Graph showing total CREST intensity in bipolar and
multipolar mitosis. Data represent mean ±SEM, *p<0.05; **p<0.01 in 3 technical
replicates analyzing 29 siCtr and 51 siCDKL5 cells. Differences among groups were
analyzed with ANOVA and Dunnet’s post-hoc test. CREST intensity was analyzed
with ImageJ. Scale bar, 10 µm.

7
Supplementary Figure S4. CDKL5 deficiency does not affect microtubule nucleation.
(a) MRC-5 and (b) COS7 cells were transfected with siCDKL5 or control siRNAs and
the MT nucleation capacity was analyzed 60 h after silencing. MT disruption was
obtained through incubation with 10 µg/ml nocodazole for 3 h. MT regrowth was
tested by releasing cells in fresh media for 2, 5, and 10 min. Fixed cells were stained
with an anti α-tubulin antibody and analyzed for the nucleation capacity through
aster size. Scale bar, 10 µm.
8
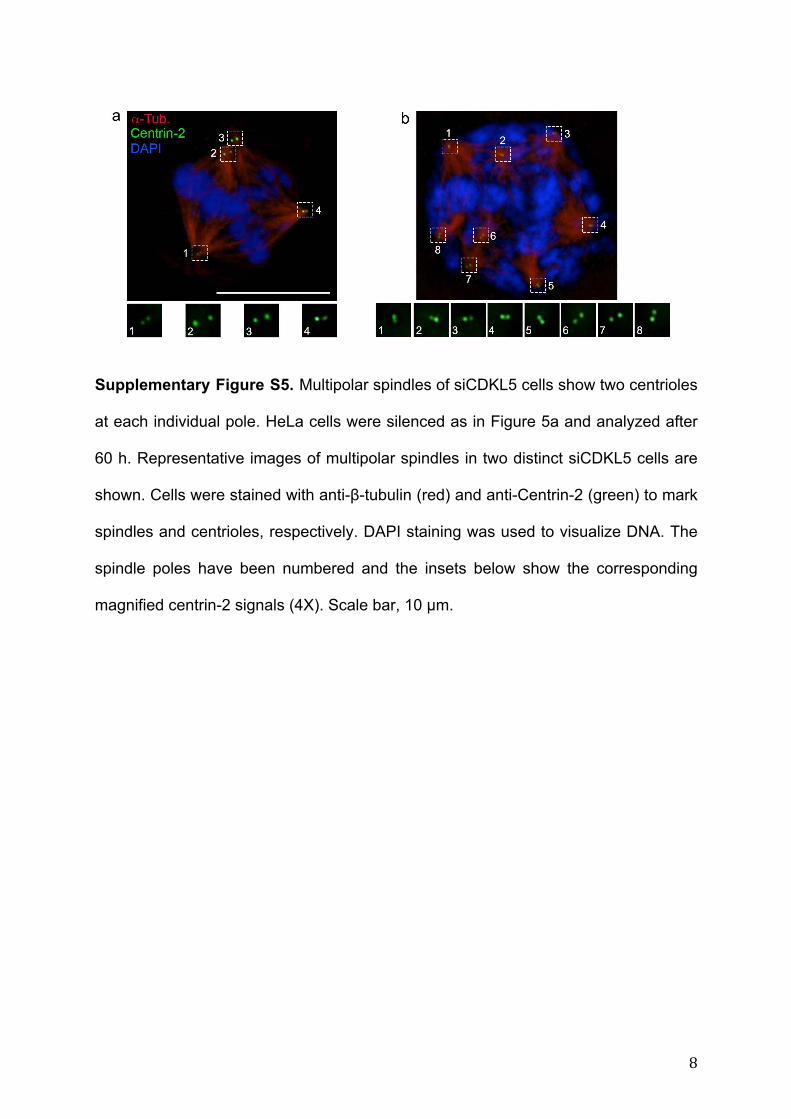
Supplementary Figure S5. Multipolar spindles of siCDKL5 cells show two centrioles
at each individual pole. HeLa cells were silenced as in Figure 5a and analyzed after
60 h. Representative images of multipolar spindles in two distinct siCDKL5 cells are
shown. Cells were stained with anti-β-tubulin (red) and anti-Centrin-2 (green) to mark
spindles and centrioles, respectively. DAPI staining was used to visualize DNA. The
spindle poles have been numbered and the insets below show the corresponding
magnified centrin-2 signals (4X). Scale bar, 10 µm.

9
Supplementary Figure S6. CDKL5 deficiency does not interfere with midbody
localization of MKLP1, MgcRacGap1, PRC1, or SPASTIN. HeLa cells were
transfected with siCDKL5 or control siRNAs and stained for beta-tubulin (red)
together with MKLP1, MgcRacGap1, PRC1, or SPASTIN (green). Scale bar, 10 µm.

10
Supplementary Figure S7. Full-membrane blots of Figures 2c (a) and 4e (b). (a)
Left membrane shows fractions 1-6 of HeLa cells transfected with siCtr and siCDKL5
as indicated. A lower exposure of the same membrane (middle panel) shows the
Inputs, confirming the silencing of CDKL5. Right panel shows γ-tubulin levels. (b)
The left-most membrane shows CDKL5 levels in HeLa cells transfected with siCtr
and siCDKL5#1. The band corresponding to CDKL5 is indicated with an arrow.
Please note that the membrane was turned 180° in Figure 4e and that the third lane
with lysates overexpressing CDKL5 was covered during this exposure. The second
membrane shows CDKL5 overexpression. Tubulin and GFP levels are shown in the
two right panels.

11
Movie S1: Time-lapse Movie of asynchronous HeLa siCtr cells related to Figure 6a.
DIC (differential interference contrast) images of cells were captured every 4 min.
The display rate is one frame every 150 milliseconds. Still images of this video are
shown in Figure 6b upper panels.
Movies S2: Time-lapse Movie of Asynchronous HeLa siCDKL5 cells Related to
Figure 6a. DIC images of cells were captured every 4 min. The display rate is one
frame every 150 milliseconds. Still images of this video are shown in Figure 6b
middle panels.
Movies S3: Time-lapse Movie of Asynchronous HeLa siCDKL5 cells Related to
Figure 6a. DIC images of cells were captured every 4 min. The display rate is one
frame every 150 milliseconds. Still images of this video are shown in Figure 6b lower
panels.