Embed Size (px)
Citation preview

Noratel et al. BMC Cell Biology 2012, 13:29http://www.biomedcentral.com/1471-2121/13/29
RESEARCH ARTICLE Open Access
The adhesion modulation protein, AmpA localizesto an endocytic compartment and influencessubstrate adhesion, actin polymerization andendocytosis in vegetative Dictyostelium cellsElizabeth F Noratel, Chere’ L Petty, Jessica S Kelsey, Hoa N Cost, Nisha Basappa and Daphne D Blumberg*
Abstract
Background: AmpA is a secreted 24Kd protein that has pleiotropic effects on Dictyostelium development. Nullmutants delay development at the mound stage with cells adhering too tightly to the substrate. Prestalk cellsinitially specify as prespore cells and are delayed in their migration to the mound apex. Extracellular AmpA canrescue these defects, but AmpA is also necessary in a cell autonomous manner for anterior like cells (ALCs) tomigrate to the upper cup. The ALCs are only 10% of the developing cell population making it difficult to study thecell autonomous effect of AmpA on the migration of these cells. AmpA is also expressed in growing cells, but,while it contains a hydrophobic leader sequence that is cleaved, it is not secreted from growing cells. This makesgrowing cells an attractive system for studying the cell autonomous function of AmpA.
Results: In growing cells AmpA plays an environment dependent role in cell migration. Excess AmpA facilitatesmigration on soft, adhesive surfaces but hinders migration on less adhesive surfaces. AmpA also effects the level ofactin polymerization. Knockout cells polymerize less actin while over expressing cells polymerize more actin thanwild type. Overexpression of AmpA also causes an increase in endocytosis that is traced to repeated formation ofmultiple endocytic cups at the same site on the membrane. Immunofluorescence analysis shows that AmpA isfound in the Golgi and colocalizes with calnexin and the slow endosomal recycling compartment marker, p25, in aperinuclear compartment. AmpA is found on the cell periphery and is endocytically recycled to the perinuclearcompartment.
Conclusion: AmpA is processed through the secretory pathway and traffics to the cell periphery where it isendocytosed and localizes to what has been defined as a slow endosomal recycling compartment. AmpA plays arole in actin polymerization and cell substrate adhesion. Additionally AmpA influences cell migration in anenvironment dependent manner. Wild type cells show very little variation in migration rates under the differentconditions examined here, but either loss or over expression of AmpA cause significant substrate and environmentdependent changes in migration.
Keywords: Actin polymerization, Endocytosis, Substrate adhesion, Migration, Dictyostelium discoideum
* Correspondence: [email protected] of Biological Sciences, University of Maryland, Baltimore County1000 Hilltop Circle, Baltimore, MD 21250, USA
© 2012 Noratel et al.; licensee BioMed Central Ltd. This is an Open Access article distributed under the terms of the CreativeCommons Attribution License (http://creativecommons.org/licenses/by/2.0), which permits unrestricted use, distribution, andreproduction in any medium, provided the original work is properly cited.
Noratel et al. BMC Cell Biology 2012, 13:29 Page 2 of 24http://www.biomedcentral.com/1471-2121/13/29
BackgroundCell migration plays a vital role in many cellular pro-cesses, including neural crest migration and gastrulationin the embryo, immune responses and cancer metastasis.In order for these processes to proceed, there has to bean optimal level of cell adhesion [1]. If the adhesion tothe substrate is too weak relative to the contractile forceexerted by the cell, cells spread inefficiently and tractionis reduced. Strong adhesion relative to contractile forcecauses the cells to spread correctly but to lose the abilityto regulate the adhesion and the cells remain adhered tothe substrate. Both of the above cases lead to inefficientmotility. An optimal level of actin polymerization is alsorequired [2].Actin polymerization takes place at the leading edge of
migrating cells [3]. This process is tightly controlled andinvolves severing proteins, capping proteins and nucleat-ing proteins (reviewed in [4]). In mammalian cells, integ-rins bind to the extracellular matrix, sending signalsfrom the matrix back into the cell. Depending on thesignal from the ECM, the cell either will adhere to thematrix and continue growth, division or migration orwill differentiate [5]. Cells form focal adhesions at sitesof integrin binding which recruit actin binding proteins,such as Arp2/3, that induce actin polymerization [6].Thus, actin polymerization and adhesion are irrevocablycoupled in the process of cell migration.The model organism Dictyostelium discoideum is
uniquely suited for the study of cell migration andchemotaxis. It is a haploid protist which is ideal for gen-etic manipulation, and its genome has been sequenced[7]. Its life cycle consists of a vegetative state in which itsurvives in nature on the forest floor. It feeds by chemo-tacting to and consuming bacteria [8]. When resourcesbecome scarce, the program of development begins [9].There are several points during development where
the cells must migrate in order for development toproceed correctly. As nutrients become scarce, a pro-genitor cell secretes a signal indicating to other cells thatstarvation is imminent. Cells receiving this signal beginto secrete cAMP, a chemoattractant signal for aggrega-tion. Cells then migrate into aggregation centers, initiallymoving as single cells, but later in the process they formend to end and side to side contacts, streaming in a“daisy chain” like manner to create the multi-cellularmounds (reviewed in [9,10]). At this point the cells dif-ferentiate into pre-spore and pre-stalk cells, along with asubset of pre-stalk cells called Anterior Like Cells(ALC’s). The cells migrate through the mound to theirappropriate positions [11]. As development continues,the ALC’s prove to be the most migratory of the cells.They are initially found at the mound periphery andthen a subset of the ALCs migrate to the tip of themound. Their swirling migration pattern is a driving
force in culmination, where they form the upper andlower cups supporting the sorus and the basal disk sup-porting the stalk [12,13].The question that arises is how cells regulate their
adhesions, both to the wide variety of substrates thatDictyostelium finds in the forest and to other cells dur-ing multicellular development. No true integrins havebeen found in the Dictyostelium genome, although someproteins with homology to integrin β have been discov-ered to have roles in cell adhesion [14,15]. Dictyosteliumhas genes coding for homologues of paxillin and talinproteins, suggestive of an ability to form focal adhesions,although evidence for the presence of focal adhesions isunclear [16,17]. Interestingly, there are two differenttalin genes. The talB gene functions primarily in devel-opment when cells are migrating over each other duringmorphogenesis; the talA gene functions primarily duringgrowth when cells migrate on a wide variety of sub-strates from dirt to cellulous nitrate filters to glass andplastics [17]. Recent work seems to indicate that the twotalin proteins also have some overlapping functions [18].How cells modify their adhesions to accommodate somany different substrates is not trivial.We have previously described a novel adhesion pro-
tein, Adhesion Modulation Protein A (AmpA), that playsa role in cell migration and adhesion during develop-ment [19-21]. During development, about 70% of theAmpA protein is secreted, but a small proportionremains cell associated [19]. When the ampA gene isknocked out, cells reach mound stage at the same timeas wildtype, but there is a 4 to 6 hour delay in tip forma-tion compared to wild type. Cells at the mound periph-ery that would normally differentiate as prestalk cellsinitially express prespore genes. They remain at themound periphery and are delayed in their migration tothe tip of the mound. A large percentage of the cellsshow significantly increased adhesion to the substrate inthe AmpA knockouts suggesting that the increased cellsubstrate adhesion may be responsible for the delayedmigration of the prestalk cells to the mound apex[19,20]. In chimeras of wild type and ampA null cells,most of these defects are rescued by the presence ofsecreted AmpA protein suggesting that AmpA actsextracellularly. However, AmpA also plays an internal,cell autonomous role in regulating the migration ofALCs. In wild type-AmpA null chimeras, ALCs carryingthe ampA null mutation never migrate to the upper cupregion. They remain at the base of the mound. Theupper cup region forms entirely from wildtype cells inthe chimeras. Using reporter constructs, it was shownthat AmpA is expressed in all growing cells and in scat-tered cells during early development, but its expressionbecomes entirely localized to the ALCs as developmentproceeds [22]. Since the ALC’s comprise only about 10%

Table 1 Comparison of plaque size on rich broth andminimal media plates
Strain Plaque area (mm2) onminimal medium plates
Plaque area (mm2) onrich broth plates
WT 1.41 +/−0. 17 0.94+/−0.08
KO 0.28 +/− 0.04* 0.020+/−0.002*
OE 2.33 +/− 0.28* 0.018+/−0.002*
Cells were plated for 4 days on LP (minimal media plates) with E.coli B/r andfor 11 days on 1/2xHL5 plates on E.coli B/r (rich broth plates). The areas ofbetween 30 to 70 plaques per strain were determined on a minimum of 5different plates per strain. Experiments were repeated at least 3 times withsimilar results on different days. Absolute plaque size differs with differentbatches of plates but the relative plaque size differences between strains arehighly reproducible. Errors are standard error of the mean. * indicatesdifference is significant from Wt (p value < 0.001). There was no significantdifference in plaque size between KO and OE (p value = 0.26) on rich brothplates but significant differences between KO and OE on minimal media plates(p value < 0.001).
Noratel et al. BMC Cell Biology 2012, 13:29 Page 3 of 24http://www.biomedcentral.com/1471-2121/13/29
of the cells in the final fruiting body, studying the role ofAmpA in the migration of these cells is difficult [23].During vegetative growth, AmpA is expressed in all
cells especially as they reach high density and, unlike indeveloping cells, AmpA is not secreted during growth[19,22]. It contains a hydrophobic leader sequence whichis cleaved but the AmpA protein is never found free inthe media in growing cells. Thus, growing cells representan opportunity to study the cell autonomous functionsof AmpA. Here, we demonstrate a role for the presenceof AmpA causing a decrease in cell adhesion to the sub-strate and thereby promoting cell migration. Dependingon environmental conditions, an optimal amount ofAmpA is required for chemotaxis of growing cells tofolic acid which is thought to be the bacterial chemo-attractant [24]. Loss of AmpA or excessive AmpA resultsin cells that are only able to migrate efficiently undercertain conditions. We also show a role for AmpA in in-fluencing actin polymerization and we show that excessAmpA can increase the amount of endocytosis. Basedon the localization of AmpA on the cell surface and itsendocytosis and subsequent localization to a perinuclearrecycling compartment, we postulate a role for AmpA inpossibly controlling the recycling of an adhesion recep-tor or acting as a signaling molecule.
ResultsThe ampA gene influences the migration of growing cellsto folic acidIn nature Dictyostelium lives on the forest floor and feedson bacteria which it locates by chemotaxis to folic acidpresent in bacteria. In the laboratory Dictyostelium amoe-bae can be grown on agar plates in association with bac-teria. Under these conditions, single Dictyostelium cellsgrow by ingesting the bacteria by phagocytosis, clearingplaques in the bacterial lawn as cells migrate out radiallyto forage for more bacteria. The size of the plaques can re-flect the rate of phagocytosis, the growth rate of the cellsor the rate of migration of the cells out into the bacteriallawn. We have previously shown that plaques formed byampA null cells are significantly smaller than those formedby wild type cells [25] and summarized in Table 1. By con-trast the plaques formed by the AmpA overexpressingstrain are significantly larger than the wild type plaques[25] and summarized in Table 1. The rate of phagocytosisas measured by the uptake of latex beads by ampA nulland overexpressing cells is no different than wild type(Additional file 1). Additionally the rate of clearing of bac-teria from a suspension culture is also no different be-tween the 3 strains (data not shown). This indicates thatthe difference in plaque size is not likely due to differencesin the rates of phagocytosis of bacteria.In order to determine if the difference in plaque size
might reflect a difference in cell motility, the migration
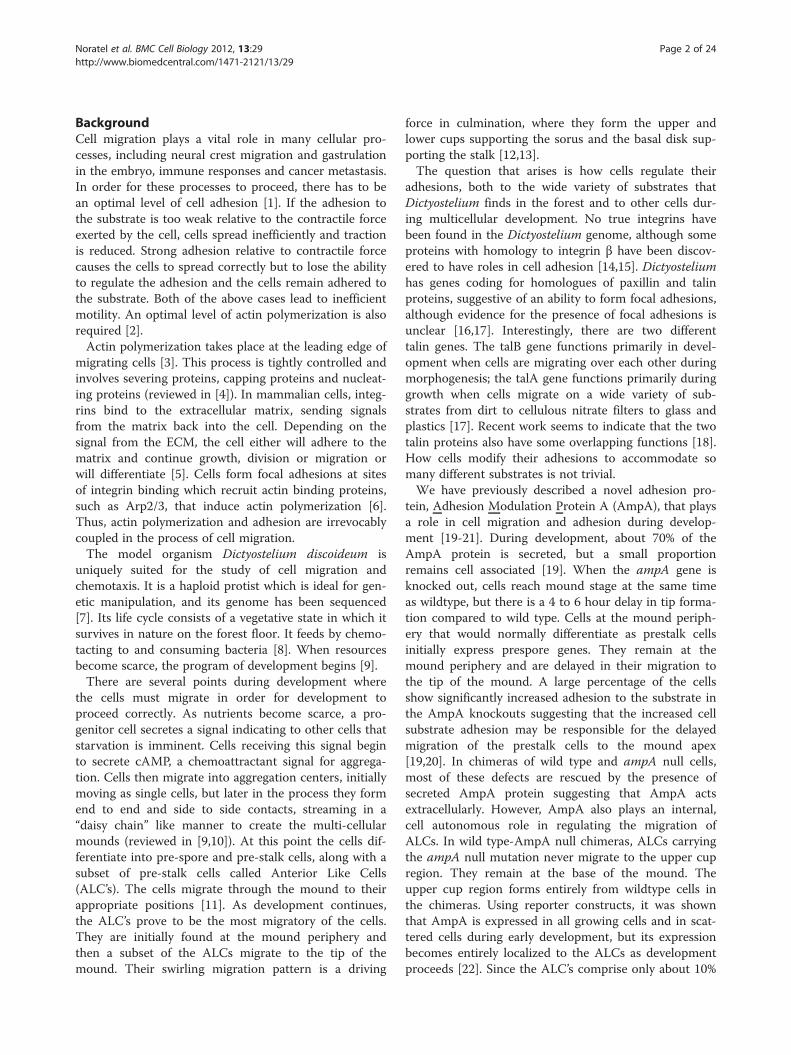
of single cells toward folic acid was monitored. Growingcells were placed on a thin layer of agar and folic acidwas spotted a millimeter away. The migration of cells tothe folic acid spot was imaged by time lapse video mi-croscopy [26]. The ampA null cells were largely unableto migrate toward folic acid (Figure 1A and D). Theymostly remained stationary, occasionally reaching out apseudopod, but almost never doing much more than roll-ing back and forth in the same spot (see movies inAdditional files 2 (Wt) and 3 (KO)). This caused a de-crease in velocity and distance moved when compared towild type (Figure 1A and D). The few knockout cells thatare actually able to migrate do sense the chemoattractantand migrate towards it, albeit much more slowly thanwild type (Figure 1A). The low chemotactic index(a measure of how directly a cell migrates to the chemo-attractant defined in methods) for the ampA null cellsreflects the failure of most of the cells to migrate ratherthan a loss of directionality when they do migrate(Figure 1D). AmpA overexpressing cells move at a muchincreased velocity and cover much more distance thanwild type (Figure 1A and D). Several cells were measuredthat moved at speeds up to 30 um per minute but theaverage velocity was 16 um/min as compared to 11 um/min for the wild type (Figure 1A and D & Movie inAdditional file 4). Both Wt and AmpA overexpressingcells showed a similar ability to migrate directionally to-wards the folic acid as indicated by the chemotactic index.In comparing morphologies, wild type cells have a true
pseudopod and uropod (Figure 1B). Knock out cells pro-duce fewer pseudopods (Figure 1B). The pseudopodsthat the cells do extend are more rounded and not at allelongated as in wild type. In contrast, the overexpressingcells form multiple pseudopods, statistically more thanwild type, and the cells are also much more elongated,as can be seen in the roundness value (Figure 1D).Roundness is the ratio between the width and the lengthof the cells. Perfectly round cells have a roundness value

Cellline
TotalDistance (um)
ProductiveDistance(um)
Directionality C.I. Velocity(um/min)
Round(%)
Pseudopodnumber
Wt 55.4 +/- 3 31.6 +/- 2 0.56 +/- 0.02 0.6+/-0.1 11.1+/-0.1 75 +/-3 1.01 +/- 0.04
KO 25.0 +/- 4* 9.4 +/- 2* 0.37 +/- 0.04* 0.4+/-0.1 5.0+/-0.1* 72 +/-3 0.8 +/- 0.03*
OE 78.5 +/- 4* 44.6 +/- 3* 0.56 +/- 0.02 0.6+/-0.1 16.0+/-0.1* 51 +/-2 1.37 +/- 0.04*
A
B C
D
* Indicates p value <0.05
Wt KO OE
E
Figure 1 (See legend on next page.)
Noratel et al. BMC Cell Biology 2012, 13:29 Page 4 of 24http://www.biomedcentral.com/1471-2121/13/29
(See figure on previous page.)Figure 1 ampA null cells are defective migrating on top of agar; overexpressing cells move very rapidly. A) Chemotaxis plots ofindividual cells in a representative field. Arrows indicate the location of the folic acid source. Note scale difference on the plot of ampA knockout.B) Morphology of cells migrating on top of agar. Black arrows indicate pseudopods; white arrows, uropods. Time is in seconds. Scale bars are20 um. C) Difference plots created by overlaying the cell outline in frame 1 with the cell outline in frame 2. Green represents areas of protrusionand red represents areas of retractions. D) Quantification of cell migration. Data are the averages +/− the standard error of the mean. Differenceswere checked using a 2 tailed paired Student’s t-test with p < 0.05 indicating a significant difference (*). Data are compilations of 40–100 cellstracked in 6 different experiments. C.I. Chemotactic Index (see Methods). The distance migrated (total) is in 5 minutes. Productive distance is theEuclidian distance from the start of imaging to the final time point. Directionality is the ratio of productive to total distance and is a measure ofhow progressive the movement is. E) Differences in actin organization in ampA mutant cells migrating to folic acid on top of agar. Live cells carrya plasmid containing the ABD120-GFP fusion protein (a marker for F-actin). Wt and AmpA overexpressing cells contain the blasticidin resistantversion of the plasmid and ampA null cells carry the G418 version of the plasmid. The direction of migration is toward the top of the image.Scale bar is 20 um.Time is in seconds.
Noratel et al. BMC Cell Biology 2012, 13:29 Page 5 of 24http://www.biomedcentral.com/1471-2121/13/29
of 1 or 100%. Figure 1C illustrates the differences in pro-trusion and retraction of pseudopods. The protrusionsare illustrated in green and retractions in red. Knock outcells form very small protrusions and retractions whichuse very little of their cell mass. In contrast, overexpres-sing cells use most of their cell mass when forming pro-trusions (Figure 1C).
AmpA regulates the level of actin polymerizationin growing cellsThe differences in pseudopod protrusion suggested thepossibility that actin polymerization could be influencedby AmpA. In order to analyze the actin cytoskeleton,growing cells were stained with fluorescently labeledphalloidin and DNAse I to detect polymerized F-actinand unpolymerized globular actin (G-actin) respectively(Figure 2A, zoomed images of representative individualcells and Additional file 5A and 5B for whole fields ofcells). AmpA null cells clearly contain significantly lesspolymerized F-actin than do wild type cells. By contrast,the overexpressing cells polymerize more actin than dowild type. Quantification of the images indicates thatampA null cells have about 3x less F-actin than wildtype while AmpA overexpressers have about 2x more F-actin than wild type (Figure 2B). In order to confirm thatthere was a difference in F-actin levels as a function ofampA expression, the amount of phalloidin binding tocell extracts was also measured (Figure 2C). This moreaccurate method indicates that ampA null cells have2.5x less F-actin than wild type while AmpA overexpres-sers have 1.6x more F-actin. In order to determine if thedifference in F-actin level is due to actin polymerizationrather than actin protein synthesis, the total amount ofactin protein in the 3 cell lines was compared in two dif-ferent ways (Figure 3A, B, and C). First, equal numbersof cells were harvested and subjected to polyacrylamidegel electrophoresis and stained with Coomassie blue.The amount of protein loaded on the gels was deter-mined to be in a linear range for the actin protein band.The relative amount of actin protein was quantified. In
order to control for differences in loading, a ratio of actinprotein to a reference band was determined. These ratioswere identical for all three cell lines indicating that thesame amount of total actin protein was present (Figure 3Aand B). This result was confirmed by western blots whichalso showed no significant difference in the amount oftotal actin protein in the 3 cell lines, indicating that AmpAcontrols the levels of actin polymerization in growing cells,not the amount of actin protein (Figure 3C).In order to observe the effects of the ampA mutations
on the actin cytoskeleton in live cells, Wt, ampA nulland AmpA overexpressing cells were transfected with aplasmid, GFP-filABD, which contains the actin bindingdomain of the ABD120 protein fused to GFP [27,28].While migrating ampA null cells are more rounded, theyclearly show actin polymerizing directionally in polar-ized, pseudopod and uropod like structures althoughthey are not as large and extended as seen with Wt orAmpA overexpressing cells (Figure 1E). They do notshow the pseudopod splitting that seems more prevalentin growing cells as they migrate to folic acid. By con-trast, the AmpA overexpressing cells not only showmore pseudopod splitting but they also show actin poly-merized strongly around most of the entire cell cortex.The Wt and AmpA overexpressing cells carry a GFP-filABD plasmid that contains a blastocidin resistancecassette. The ampA null cells had to be transformedwith a GFP-filABD plasmid that carried a G418 resist-ance marker that is usually present at much higher copynumbers. The F-actin level in the knockout cells was toolow for detection when the blasocidin cassette was usedas a selectable marker. Thus it is not possible to com-pare differences in actin levels in this image, only actindistribution and dynamics.
AmpA influences cell migration in an environmentdependent mannerLoss of AmpA clearly reduces actin polymerization andcell migration, while overexpressing AmpA results inrapid migration and excessive actin polymerization. The

B
C*indicates significant difference from Wt (p Value <0.01)
Strain
Average PixelIntensity/cell
Average CellArea (um2)
AveragePixelIntensity/um2
FoldDifference
Wt 36.7+/-1.5 141.6+/-9.6 0.30+/-0.03KO 9.5+/-0.4* 106.5+/-5.3 0.10+/-0.01 3 fold lower
Wt 13.5+/-0.8 152.5+/-13.2 0.09+/-0.01
OE 25.8+/-1.6* 156.0+/-19.3 0.18+/-0.02 2 fold higher
A
Figure 2 AmpA influences the level of polymerized F actin. A) Wild type, ampA knockout (KO) and overexpresser (OE) cells were stained withAlexa 488-phalloidin to detect F-actin (green) and TRITC labeled DNAse I to detect G-actin (red). Imaging conditions were optimized for levels ofphalloidin staining (see Methods). The fields of cells from which the representative individual cells were excised are in Additional file 5. Theimages are 3D reconstructions from a confocal z series. Scale bar is 20 um. The fluorescent F-actin images were all equally enhanced to moreclearly see the F-actin in the ampA knockout. B) Fields of Wt, KO and OE cells stained with Alexa 488 phalloidin shown in Additional file 5 werequantified (see Methods). The average pixel intensity per cell, cell surface area and pixel intensity/um2 are shown. Significance was determined bya two-tailed paired Student’s t-test with a p value < 0.05 indicated as significantly different from Wild type. 15 to 20 cells per strain werequantified per experiment. The staining experiment was repeated 6 different times with cells grown on different days. C) The amount of Alexa488-phalloidin bound to cells was determined (see Methods). Results are averages of 3 different experiments with data points in triplicate. Errorbars are standard error of the mean.
Noratel et al. BMC Cell Biology 2012, 13:29 Page 6 of 24http://www.biomedcentral.com/1471-2121/13/29
differences in cell migration are clearly consistent withthe differences observed in plaque size that we hadreported [25 and summarized in Table 1]. When analyz-ing plaque morphology one normally uses a low nutrientagar (minimal media plates) that reduces the density ofthe bacterial lawn and allows plaques to spread. It isunder these conditions that AmpA overexpressingstrains make much larger than normal plaques. Howeverif one wants to screen large numbers of Dictyostelium
plaques on bacterial plates, a higher nutrient agar is usedand the bacterial lawn that forms is denser and the pla-ques are much smaller [29]. Surprisingly under theseconditions AmpA overexpressing cells form plaques thatare much smaller than wild type and are about the samesize as those formed by the ampA null cells (Table 1 andAdditional file 6B insets). In order to better understandthe role of AmpA in influencing plaque size in highdensity lawns, cells at the plaque periphery were imaged

A
B
C
Figure 3 AmpA does not change the amount of total actinprotein in the cells. A) Polyacrylamide gels were loaded with totalprotein from 1 x 10⁵ cells per lane and stained with Coomassie.B) The amount of protein loaded was determined to give a linearrange signal when scanned on a densitometer. To control forprotein loading differences the ratio of intensity of the F-actin bandto a reference band was determined. C) Western blot of totalprotein using an anti-actin antibody. 1 x 10⁵ cells were loaded perlane. In control experiments this amount of protein gave antibodystaining for actin which was linearly dependent on the amount ofprotein loaded.
Noratel et al. BMC Cell Biology 2012, 13:29 Page 7 of 24http://www.biomedcentral.com/1471-2121/13/29
at high magnification from underneath the agar plates andthe migrations of individual cells that could be distin-guished at the plaque periphery were tracked (Additional
file 6A and B). Increasing the density of the lawn of bac-teria appears to inhibit the ability of AmpA overexpressingcells to penetrate the bacterial lawn. Analysis of the cen-troid tracks of individual cells at the plaque periphery indi-cates that both wild type and ampA null cells movedirectly perpendicular to the edge of the plaque, but, sur-prisingly, the overexpressing cells migrate circumferen-tially around the plaque (Additional file 6B). The yellowlines mark the tracks of individual cells over 30 minutes.The overexpressing cells travel nearly twice as fast as thewild type cells and cover more distance even though it isin a circumferential direction (Additional file 6A and B).By traveling circumferentially around the plaque the over-expressing cells avoid the problem of penetrating into thedense lawn of bacteria. The ampA null cells, by contrast,cover about the same total distance as the wild type cellsbut they cover significantly less productive distance(Additional file 6A). The productive distance moved bythe ampA null cells is only about 40% of the total distancemigrated, indicating that most of the movement of thenull cells is rolling back and forth rather than progressivelymoving out into the bacterial lawn (Additional file 6A).Regardless of the density of the bacterial lawn, both wildtype and overexpressing cells still migrate efficiently; whatdiffers is their direction of travel. The smaller plaques ofthe overexpressing strains under rich broth conditions areclearly a result of the failure of the cells to enter the bac-terial lawn while the small plaque size of the ampA nullcells is the result of multiple reversals in direction so thatthe cells cover less productive distance. This raises thequestion of whether over expression of AmpA results in areduction of substrate adhesion. Such a defect might per-mit faster migration but prevent the cells from being ableto adhere strongly enough to the substrate to be able toexert the force to migrate through the dense lawn ofbacteria.
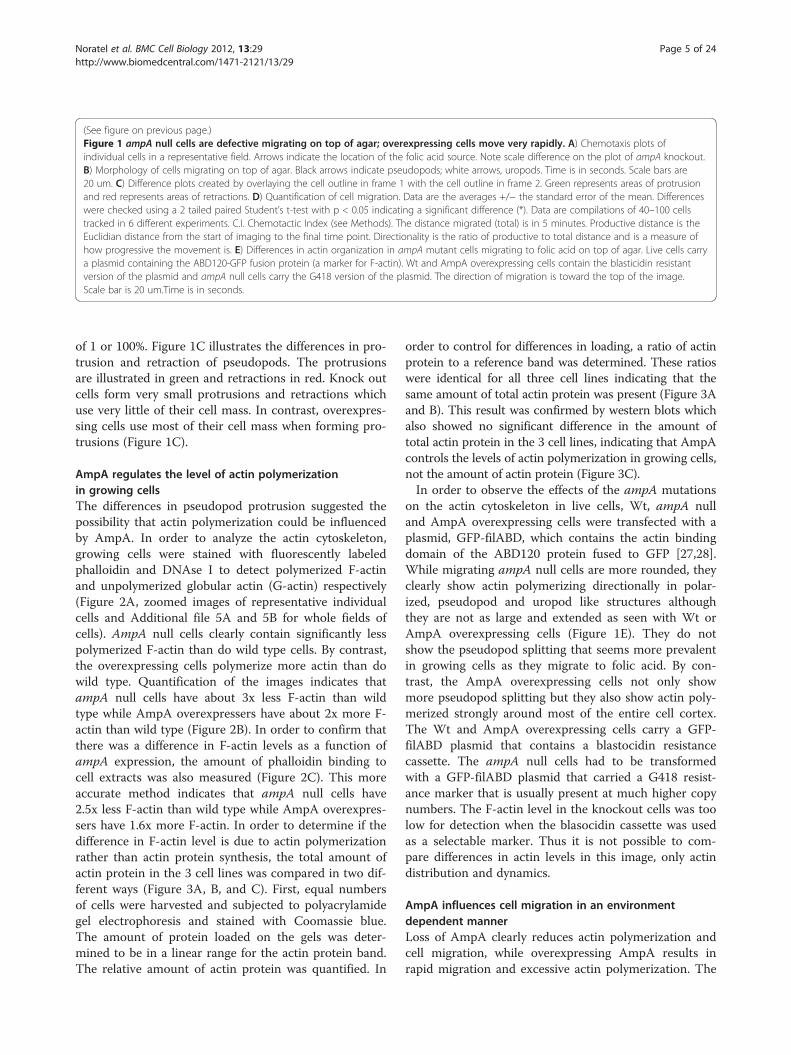
AmpA influences cell-substrate adhesionIn order to address the question of whether the differencesin migration detailed above were due to an effect ofAmpA on cell substrate adhesion, the relative ability ofampA null and AmpA overexpressing cells to adhere to asubstrate was determined. The cells were allowed to ad-here to culture dishes overnight. They were then shakenat increasing shaker speeds and the percentage of cellsthat remain attached after 45 minutes at each speed wasdetermined (Figure 4A). At 50 rotations per min (rpms)80% of the ampA null cells remain attached to the sub-strate, while only 50% of Wt cells remain attached. By con-trast, less than 30% of the AmpA overexpressing cells arestill adhering to the substrate. Thus, ampA knockout cellsare clearly more adherent than wild type cells, while theAmpA overexpressing cells have significantly decreased ad-hesion. Reflection imaging was used to determine the
A
B
* Indicates significant difference from Wt ( p value <0.05)
Figure 4 AmpA influences cell substrate adhesion andsubstrate contact area. A) AmpA influences cell substrateadhesion. Cells grown on petri dishes were shaken at increasingshaker speeds, RPM (rotations per minute) for 45 minutes and thepercent of cells remaining on the dish was determined. B) AmpAinfluences the % of the cell surface in contact with the substrate. Todetermine the percentage of the cell in contact with the substratecells were imaged using transmitted light and in reflection mode toidentify the area of the cell in contact with the substrate (Additionalfile 7 for raw data). The area of the cell and the area of the contactsites were determined and the contact sites were expressed as a %of the total area of the cell. The number of cells imaged was 65 to125 for cells sitting on glass and 50 to 95 for cells migrating underagar. Results are averages from two different experiments preformedon different days. Error bars are the standard error of the mean.* indicates a significant difference with a P value < 0.05 using a twotailed paired Student’s t-test.
Noratel et al. BMC Cell Biology 2012, 13:29 Page 8 of 24http://www.biomedcentral.com/1471-2121/13/29
percent of the cell area that was in contact with the sub-strate. For wildtype cells growing on glass cover slips about50% of the cell surface area was in contact with the sub-strate but for AmpA overexpressing cells far less, 34%,was in contact with the substrate. For ampA null cells,more of the cell surface area, 62%, was in contact withthe substrate than for wild type cells (Figure 4B top rowof table (on glass); transmission and reflection images inAdditional file 7A).
Migration under agar rescues the motility defect of ampAnull cells and reduces the rapid migration of AmpAoverexpressing cellsSince AmpA overexpressing cells appear to have troublepenetrating a lawn of dense bacteria and show less adhe-sion to the substrate, we tested the ability of AmpA mu-tant cells to migrate in an environment where they have
to migrate under agar, which requires more force [30].Cells were placed in a well in a thin layer of agar on aglass cover slip about 1mm from a well containing folicacid. Over time the cells slip under the agar and migrateon the glass cover slip towards the folic acid. In this en-vironment cells have a layer of agar on top of them towhich they can adhere and form contacts and they mi-grate on a less deformable and less adhesive glass coverslip. Under these conditions the ampA knockout cellsno longer have any migration defect (Figure 5A and Dand movies in Additional files 8 (Wt) and 9 (KO). AmpAnull cells actually move significantly better than wildtype cells and even better than overexpressing cellsunder these conditions. Their velocity increased signifi-cantly over wild type reaching an average of 13 um/min(Compare Figure 1D with 5D). The distance traveledalso increased significantly compared with wild type. Incontrast, the AmpA overexpressing cells appear to revertto the wild type phenotype (Movie in Additional file 10).There is no significant difference between wild type andoverexpressing cells in any of the migration parametersmeasured (Figure 5A and D).Migration under agar on glass also produces significant
changes in morphology and substrate contact. Knockoutcells under agar on glass now have true pseudopods anduropods (Figure 5B and C) and are more elongated(Figure 5D). This is particularly apparent when one com-pares the roundness value of 72% for the ampA null cellsmigrating on top of agar with the roundness value 41%when migrating on glass under agar (Figure 1D vs 5D).Additionally, the number of pseudopods that knockoutcells extend is significantly greater than wild type. Thesedifferences in the morphology of the ampA null cells mi-grating on glass under agar are also apparent when oneobserves the actin cytoskeleton in live migrating cellsunder agar (Figure 5E). The ampA null cells migratingunder agar show clear dynamic pseudopods that appearto split frequently. For the AmpA overexpressing cells,actin remains polymerized around the entire cell cortex(Figure 5E) although difference plots show less pseudo-pod extension and retraction than was seen when theymigrated on top of agar (Figure 5C).The difference in migration behavior of ampA mutant
cells under these different environmental conditionsraises the question of whether either the difference inthe substrate or the presence of agar overlaying the cellsalters the contact of the cells with the substrate. Reflec-tion imaging was used to compare the percentage of theventral cell surface in contact with the cover slip in thecells migrating under agar (Figure 4B bottom row ofTable (under agar); transmission and reflection imagesin Additional file 7B). The wild type cells show relativelythe same percentage of the cell area in contact with thesubstrate in both conditions (53% sitting on glass vs 58%

Cellline
Total Distance (um)
ProductiveDistance (um)
Directionality C.I. Velocity(um/min)
Round(%)
Wt 49.4 +/- 1.9 27.5 +/- 1.7 0.56 +/- 0.02 0.56 +/-0.1 10.3 +/- 0.4 61 +/ 1
KO 67.7+/-1.7* 38.7 +/- 1.4* 0.68 +/- 0.06 0.45 +/-0.1 13.6 +/- 0.3* 41 +/- 2
OE 52.5 +/- 1.5 33.4 +/- 1.3 0.63 +/- 0.02 0.53 +/-0.1 10.2 +/- 0.3 65 +/- 4
* Indicates p values < 0.05
C
D
B
Wt KO OEA
E
Figure 5 (See legend on next page.)
Noratel et al. BMC Cell Biology 2012, 13:29 Page 9 of 24http://www.biomedcentral.com/1471-2121/13/29
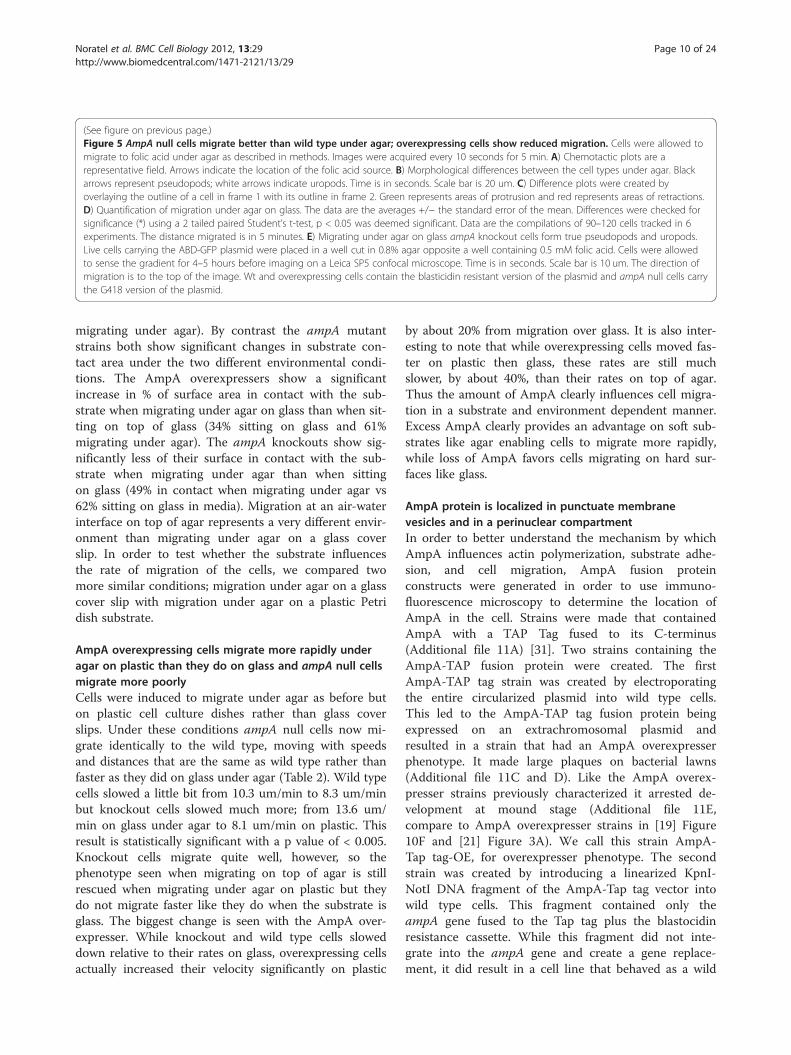
(See figure on previous page.)Figure 5 AmpA null cells migrate better than wild type under agar; overexpressing cells show reduced migration. Cells were allowed tomigrate to folic acid under agar as described in methods. Images were acquired every 10 seconds for 5 min. A) Chemotactic plots are arepresentative field. Arrows indicate the location of the folic acid source. B) Morphological differences between the cell types under agar. Blackarrows represent pseudopods; white arrows indicate uropods. Time is in seconds. Scale bar is 20 um. C) Difference plots were created byoverlaying the outline of a cell in frame 1 with its outline in frame 2. Green represents areas of protrusion and red represents areas of retractions.D) Quantification of migration under agar on glass. The data are the averages +/− the standard error of the mean. Differences were checked forsignificance (*) using a 2 tailed paired Student’s t-test, p < 0.05 was deemed significant. Data are the compilations of 90–120 cells tracked in 6experiments. The distance migrated is in 5 minutes. E) Migrating under agar on glass ampA knockout cells form true pseudopods and uropods.Live cells carrying the ABD-GFP plasmid were placed in a well cut in 0.8% agar opposite a well containing 0.5 mM folic acid. Cells were allowedto sense the gradient for 4–5 hours before imaging on a Leica SP5 confocal microscope. Time is in seconds. Scale bar is 10 um. The direction ofmigration is to the top of the image. Wt and overexpressing cells contain the blasticidin resistant version of the plasmid and ampA null cells carrythe G418 version of the plasmid.
Noratel et al. BMC Cell Biology 2012, 13:29 Page 10 of 24http://www.biomedcentral.com/1471-2121/13/29
migrating under agar). By contrast the ampA mutantstrains both show significant changes in substrate con-tact area under the two different environmental condi-tions. The AmpA overexpressers show a significantincrease in % of surface area in contact with the sub-strate when migrating under agar on glass than when sit-ting on top of glass (34% sitting on glass and 61%migrating under agar). The ampA knockouts show sig-nificantly less of their surface in contact with the sub-strate when migrating under agar than when sittingon glass (49% in contact when migrating under agar vs62% sitting on glass in media). Migration at an air-waterinterface on top of agar represents a very different envir-onment than migrating under agar on a glass coverslip. In order to test whether the substrate influencesthe rate of migration of the cells, we compared twomore similar conditions; migration under agar on a glasscover slip with migration under agar on a plastic Petridish substrate.
AmpA overexpressing cells migrate more rapidly underagar on plastic than they do on glass and ampA null cellsmigrate more poorlyCells were induced to migrate under agar as before buton plastic cell culture dishes rather than glass coverslips. Under these conditions ampA null cells now mi-grate identically to the wild type, moving with speedsand distances that are the same as wild type rather thanfaster as they did on glass under agar (Table 2). Wild typecells slowed a little bit from 10.3 um/min to 8.3 um/minbut knockout cells slowed much more; from 13.6 um/min on glass under agar to 8.1 um/min on plastic. Thisresult is statistically significant with a p value of < 0.005.Knockout cells migrate quite well, however, so thephenotype seen when migrating on top of agar is stillrescued when migrating under agar on plastic but theydo not migrate faster like they do when the substrate isglass. The biggest change is seen with the AmpA over-expresser. While knockout and wild type cells sloweddown relative to their rates on glass, overexpressing cellsactually increased their velocity significantly on plastic
by about 20% from migration over glass. It is also inter-esting to note that while overexpressing cells moved fas-ter on plastic then glass, these rates are still muchslower, by about 40%, than their rates on top of agar.Thus the amount of AmpA clearly influences cell migra-tion in a substrate and environment dependent manner.Excess AmpA clearly provides an advantage on soft sub-strates like agar enabling cells to migrate more rapidly,while loss of AmpA favors cells migrating on hard sur-faces like glass.
AmpA protein is localized in punctuate membranevesicles and in a perinuclear compartmentIn order to better understand the mechanism by whichAmpA influences actin polymerization, substrate adhe-sion, and cell migration, AmpA fusion proteinconstructs were generated in order to use immuno-fluorescence microscopy to determine the location ofAmpA in the cell. Strains were made that containedAmpA with a TAP Tag fused to its C-terminus(Additional file 11A) [31]. Two strains containing theAmpA-TAP fusion protein were created. The firstAmpA-TAP tag strain was created by electroporatingthe entire circularized plasmid into wild type cells.This led to the AmpA-TAP tag fusion protein beingexpressed on an extrachromosomal plasmid andresulted in a strain that had an AmpA overexpresserphenotype. It made large plaques on bacterial lawns(Additional file 11C and D). Like the AmpA overex-presser strains previously characterized it arrested de-velopment at mound stage (Additional file 11E,compare to AmpA overexpresser strains in [19] Figure10F and [21] Figure 3A). We call this strain AmpA-Tap tag-OE, for overexpresser phenotype. The secondstrain was created by introducing a linearized KpnI-NotI DNA fragment of the AmpA-Tap tag vector intowild type cells. This fragment contained only theampA gene fused to the Tap tag plus the blastocidinresistance cassette. While this fragment did not inte-grate into the ampA gene and create a gene replace-ment, it did result in a cell line that behaved as a wild
Noratel et al. BMC Cell Biology 2012, 13:29 Page 11 of 24http://www.biomedcentral.com/1471-2121/13/29
type cell line, contained about 3x less AmpA-Tap tagprotein that the stain with the overexpressing pheno-type (Additional file 11B) and formed plaques on bac-terial lawns that were not significantly different fromthe size of Wt plaques (Additional file 11C and D).Like Wt, this strain progressed normally through de-velopment (Additional file 11E). We refer to it asAmpA-Tap tag-Wt.We also constructed a second vector containing an
AmpA fusion protein. This one had the mRFP proteinfused to the N terminus of the AmpA protein imme-diately after the hydrophobic leader sequence(Additional file 12A) [32]. When this plasmid wasintroduced into wild type cells as a circular plasmid,the cells also displayed an AmpA overexpresserphenotype, making large plaques on bacterial lawnsand arresting development at mound stage(Additional file 12B, C and D). The fact that bothoverexpressing fusion protein vectors showed the typ-ical AmpA overexpression phenotype indicates thatboth the AmpA-tap tag and the mRFP-AmpA fusionproteins are active and functional and can thus beused as probes to localize AmpA. Initial localizationexperiments were done with the AmpA-Tap tag con-structs but later batches of anti-tap antibody were notsuitable for immunofluorescence studies so themRFP-AmpA construct was used instead. Where pos-sible, results are shown with both constructs.Both AmpA-Tap tag-OE and AmpA-Tap tag Wt
cells and cells containing the mRFP-AmpA fusionprotein construct were imaged using fluorescently la-beled anti-tap tag or anti-RFP antibodies (Figure 6Ashowing the mRFP-AmpA construct and Additionalfile 13A showing AmpA-Tap tag Wt and OE). AmpAprotein was localized to a series of punctuate spotspresent throughout the cell and also in a perinuclearlocation which is evident in Figure 6A where the nu-clei are stained with DAPI. All three strains showedthe same pattern of AmpA location indicating thatneither the source of the fusion protein or the over-expressing phenotype appeared to influence the loca-tion. The punctuate spots are likely membrane bound
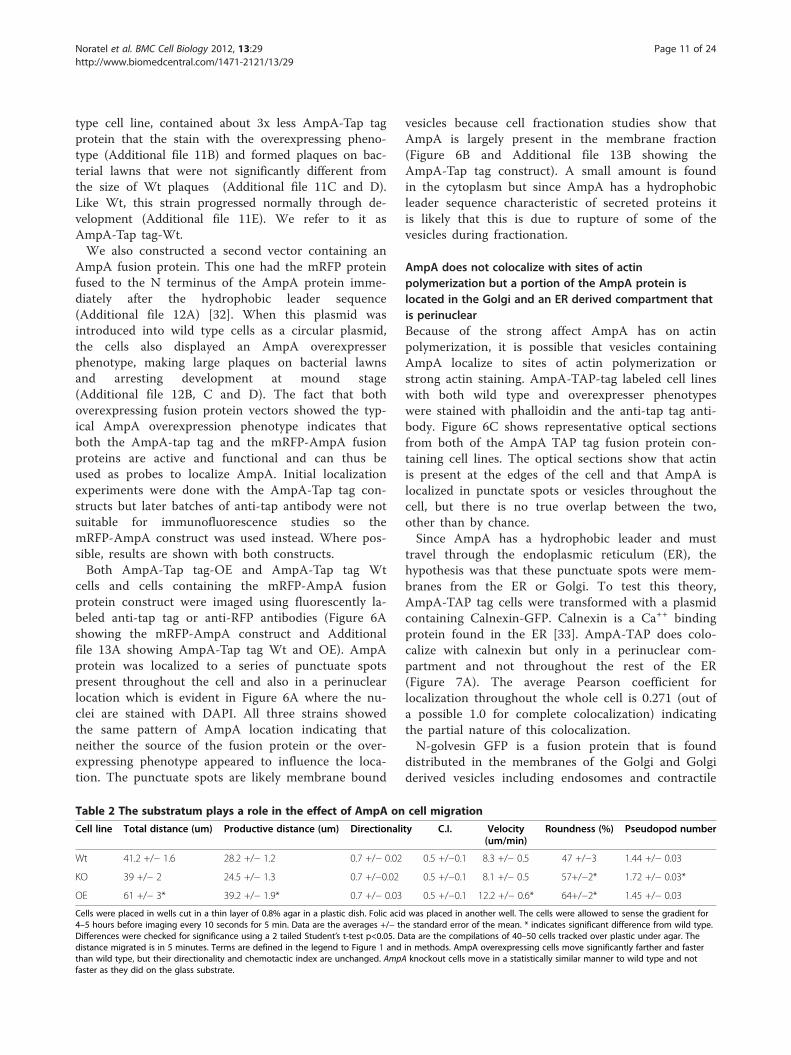
Table 2 The substratum plays a role in the effect of AmpA on
Cell line Total distance (um) Productive distance (um) Directionali
Wt 41.2 +/− 1.6 28.2 +/− 1.2 0.7 +/− 0.02
KO 39 +/− 2 24.5 +/− 1.3 0.7 +/−0.02
OE 61 +/− 3* 39.2 +/− 1.9* 0.7 +/− 0.03
Cells were placed in wells cut in a thin layer of 0.8% agar in a plastic dish. Folic acid4–5 hours before imaging every 10 seconds for 5 min. Data are the averages +/− thDifferences were checked for significance using a 2 tailed Student’s t-test p<0.05. Ddistance migrated is in 5 minutes. Terms are defined in the legend to Figure 1 andthan wild type, but their directionality and chemotactic index are unchanged. AmpAfaster as they did on the glass substrate.
vesicles because cell fractionation studies show thatAmpA is largely present in the membrane fraction(Figure 6B and Additional file 13B showing theAmpA-Tap tag construct). A small amount is foundin the cytoplasm but since AmpA has a hydrophobicleader sequence characteristic of secreted proteins itis likely that this is due to rupture of some of thevesicles during fractionation.
AmpA does not colocalize with sites of actinpolymerization but a portion of the AmpA protein islocated in the Golgi and an ER derived compartment thatis perinuclearBecause of the strong affect AmpA has on actinpolymerization, it is possible that vesicles containingAmpA localize to sites of actin polymerization orstrong actin staining. AmpA-TAP-tag labeled cell lineswith both wild type and overexpresser phenotypeswere stained with phalloidin and the anti-tap tag anti-body. Figure 6C shows representative optical sectionsfrom both of the AmpA TAP tag fusion protein con-taining cell lines. The optical sections show that actinis present at the edges of the cell and that AmpA islocalized in punctate spots or vesicles throughout thecell, but there is no true overlap between the two,other than by chance.Since AmpA has a hydrophobic leader and must
travel through the endoplasmic reticulum (ER), thehypothesis was that these punctuate spots were mem-branes from the ER or Golgi. To test this theory,AmpA-TAP tag cells were transformed with a plasmidcontaining Calnexin-GFP. Calnexin is a Ca++ bindingprotein found in the ER [33]. AmpA-TAP does colo-calize with calnexin but only in a perinuclear com-partment and not throughout the rest of the ER(Figure 7A). The average Pearson coefficient forlocalization throughout the whole cell is 0.271 (out ofa possible 1.0 for complete colocalization) indicatingthe partial nature of this colocalization.N-golvesin GFP is a fusion protein that is found
distributed in the membranes of the Golgi and Golgiderived vesicles including endosomes and contractile
cell migration
ty C.I. Velocity(um/min)
Roundness (%) Pseudopod number
0.5 +/−0.1 8.3 +/− 0.5 47 +/−3 1.44 +/− 0.03
0.5 +/−0.1 8.1 +/− 0.5 57+/−2* 1.72 +/− 0.03*
0.5 +/−0.1 12.2 +/− 0.6* 64+/−2* 1.45 +/− 0.03
was placed in another well. The cells were allowed to sense the gradient fore standard error of the mean. * indicates significant difference from wild type.ata are the compilations of 40–50 cells tracked over plastic under agar. Thein methods. AmpA overexpressing cells move significantly farther and fasterknockout cells move in a statistically similar manner to wild type and not

Figure 6 AmpA is found in vesicles and in the perinuclear region but not with F-actin. A) Wt control cells (top row) and cells carrying themRFP-AmpA fusion protein construct (bottom row) were immunostained with rat anti-RFP antibody and goat anti-rat antibody conjugated toAlexa Fluor 488 (Invitrogen). The left panel is anti-RFP antibody staining (green), and the right panel shows overlays of the immunostaining onDAPI stained images (blue) to mark the nucleus and transmitted images. The scale bar is 9 um. B) Western blots of cell fractionations of mRFP-AmpA expressing cells. MW is molecular weight standard. CY-Cytoplasm, Mem-Membrane, SN-Soluble Nuclear, CB-Chromatin Bound, CS-Cytoskeletal. Controls for this fractionation are in [25]. C) AmpA does not colocalize with F-actin. Cells were fixed and stained for AmpA Tap tagand F-actin. Green: Alexa fluor 488 phalloidin stain for F-actin; Red: AmpA Tap tag antibody. Representative images are single optical sectionsfrom a Z series. Scale bar is 5 um. An AmpA-Tap-Wt (top) and an AmpA-Tap-overexpressing strain (bottom) are shown.
Noratel et al. BMC Cell Biology 2012, 13:29 Page 12 of 24http://www.biomedcentral.com/1471-2121/13/29
vacuoles [34]. mRFP-AmpA cells were transformedwith the N-golvesin-GFP containing plasmid. AmpAwas seen to colocalize with N-golvesin predominantlyin the Golgi adjacent to the nucleus (Figure 7B). Italso showed some colocalization with AmpA in
vesicles near the perimeter of the cell but there wereother golvesin labeled vesicles that did not containAmpA (Figure 7B). The Pearson coefficient for thislocalization throughout the whole cell is 0.23 indicat-ing the partial nature of the colocalization sites. Thus
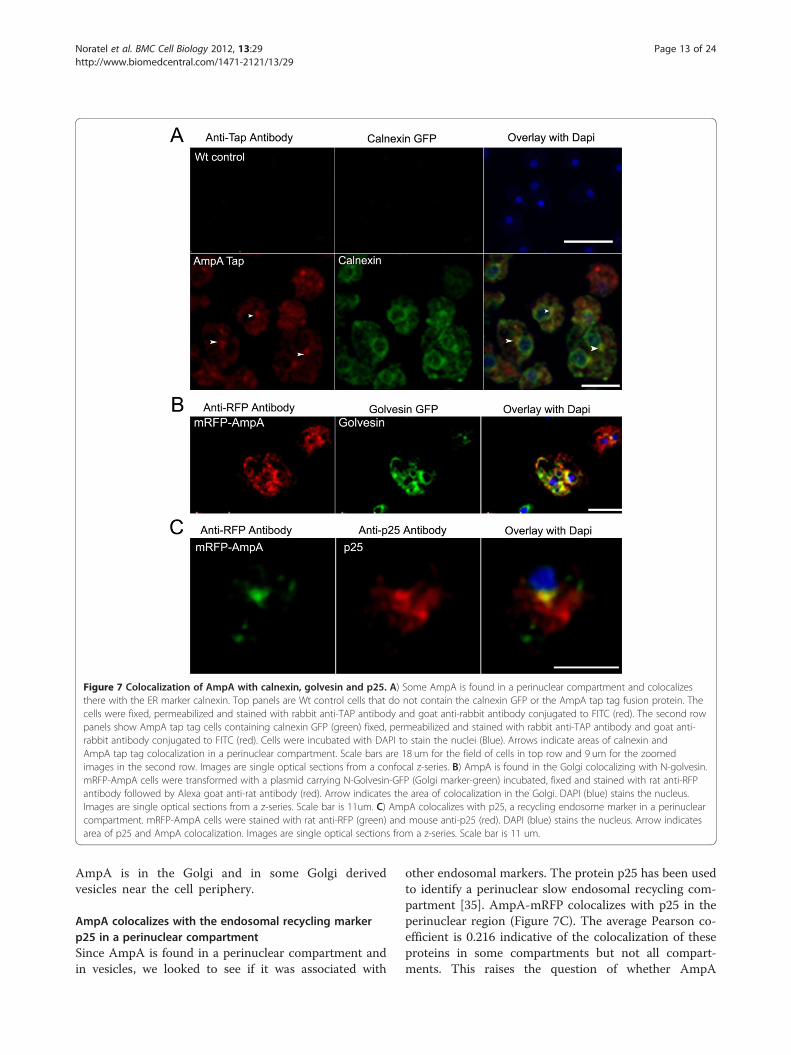
Figure 7 Colocalization of AmpA with calnexin, golvesin and p25. A) Some AmpA is found in a perinuclear compartment and colocalizesthere with the ER marker calnexin. Top panels are Wt control cells that do not contain the calnexin GFP or the AmpA tap tag fusion protein. Thecells were fixed, permeabilized and stained with rabbit anti-TAP antibody and goat anti-rabbit antibody conjugated to FITC (red). The second rowpanels show AmpA tap tag cells containing calnexin GFP (green) fixed, permeabilized and stained with rabbit anti-TAP antibody and goat anti-rabbit antibody conjugated to FITC (red). Cells were incubated with DAPI to stain the nuclei (Blue). Arrows indicate areas of calnexin andAmpA tap tag colocalization in a perinuclear compartment. Scale bars are 18 um for the field of cells in top row and 9 um for the zoomedimages in the second row. Images are single optical sections from a confocal z-series. B) AmpA is found in the Golgi colocalizing with N-golvesin.mRFP-AmpA cells were transformed with a plasmid carrying N-Golvesin-GFP (Golgi marker-green) incubated, fixed and stained with rat anti-RFPantibody followed by Alexa goat anti-rat antibody (red). Arrow indicates the area of colocalization in the Golgi. DAPI (blue) stains the nucleus.Images are single optical sections from a z-series. Scale bar is 11um. C) AmpA colocalizes with p25, a recycling endosome marker in a perinuclearcompartment. mRFP-AmpA cells were stained with rat anti-RFP (green) and mouse anti-p25 (red). DAPI (blue) stains the nucleus. Arrow indicatesarea of p25 and AmpA colocalization. Images are single optical sections from a z-series. Scale bar is 11 um.
Noratel et al. BMC Cell Biology 2012, 13:29 Page 13 of 24http://www.biomedcentral.com/1471-2121/13/29
AmpA is in the Golgi and in some Golgi derivedvesicles near the cell periphery.
AmpA colocalizes with the endosomal recycling markerp25 in a perinuclear compartmentSince AmpA is found in a perinuclear compartment andin vesicles, we looked to see if it was associated with
other endosomal markers. The protein p25 has been usedto identify a perinuclear slow endosomal recycling com-partment [35]. AmpA-mRFP colocalizes with p25 in theperinuclear region (Figure 7C). The average Pearson co-efficient is 0.216 indicative of the colocalization of theseproteins in some compartments but not all compart-ments. This raises the question of whether AmpA

Noratel et al. BMC Cell Biology 2012, 13:29 Page 14 of 24http://www.biomedcentral.com/1471-2121/13/29
colocalizes with p25 because it plays a role in membranerecycling or because AmpA itself is recycled from themembrane.
AmpA is localized at low levels on the cell periphery andrecycled via endocytosisSince AmpA is found in a cell compartment consistentwith a role in membrane protein recycling, it is possiblethat AmpA would be found on the plasma membrane.In standard fixation procedures we have not clearly seenAmpA on the membrane but the association could belost due to the fixation or permeabilization. To deter-mine if AmpA is on the membrane, live AmpA mRFPcells were incubated with DiI membrane stain and thenwith anti mRFP primary antibody either at roomtemperature (Figure 8A) or at 4°C (Figure 8B). The cellswere then washed and incubated with goat anti rabbitsecondary antibody conjugated to FITC. The figures rep-resent optical sections from a z-series and indicate thatunder these conditions where live cells were used,AmpA colocalizes with DiI on the membrane. Theseresults suggest that AmpA is on the plasma membranebut, when cells are permeabilized prior to staining, thisfraction of AmpA is lost, perhaps indicating a weakinteraction. Although these cells were never permeabi-lized, there is a fraction of labeled intra-cellular AmpAwhich is likely the result of endocytosis of the extracellu-lar cellular AmpA plus bound antibodies (Figure 8A).The internalized AmpA is in the same locations as theDiI which enters the live cells by endocytosis(Figure 8A). The internal fraction of AmpA staining islargely missing in Figure 8B where the live cells weremaintained at 4°C to prevent endocytosis.In order to determine if AmpA is being endocytosed, live
AmpA-mRFP cells were incubated with primary anti mRFPantibody at 4o for 10 minutes [35]. Some of the live cellswere immediately incubated with secondary antibody andimaged (Figure 8B). These live cells showed mRFP-AmpAon the cell surface. A second set of the live cells were thenincubated at room temperature for 15 minutes to allow timefor the AmpA-mRFP plus antibody to be endocytosed.These cells were then washed and fixed with formaldehyde.The cells were then permeabilized to allow entry of the sec-ondary antibody. This led to high intra-cellular staining ofmRFP-AmpA, which could only happen if AmpA had beenendocytosed by the live cells while bound to the primaryantibody (Figure 8B and C). Some of this staining is locatedin the perinuclear area suggesting that endocytosed AmpAmay travel to the perinuclear slow recycling complex whereit was observed to colocalize with p25 (Figure 7C).
AmpA overexpression increases endocytosisActin plays an important role in endocytosis and the factthat AmpA appears to cycle from the cell surface to
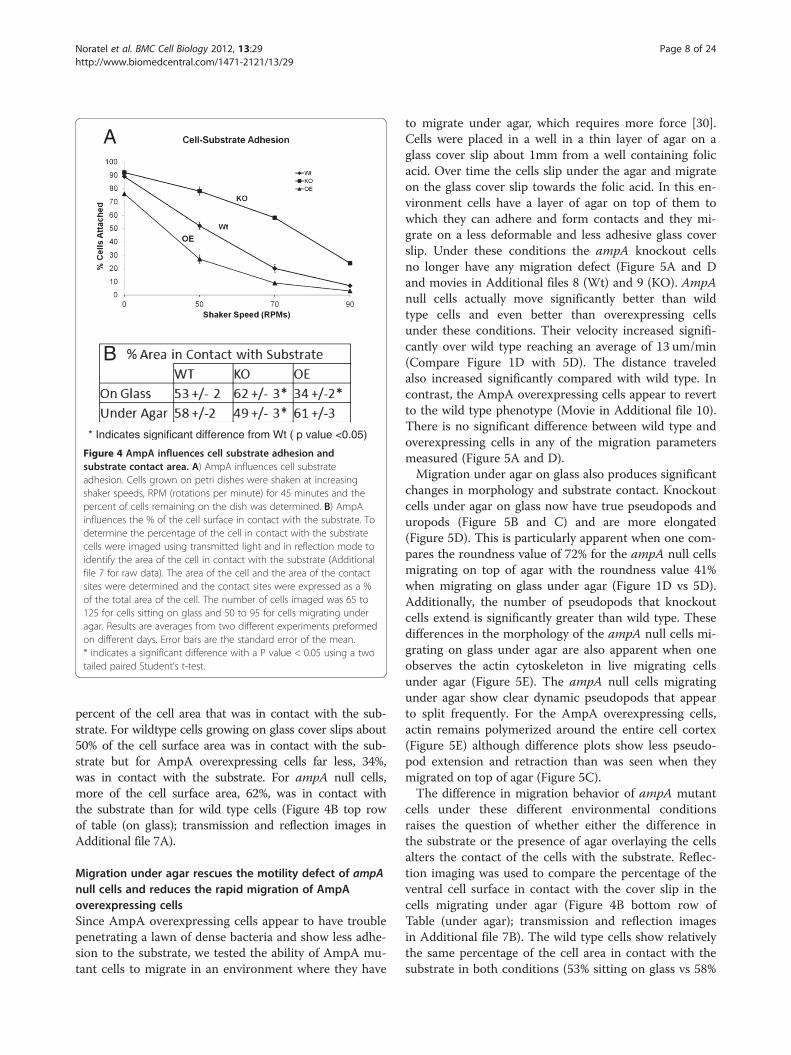
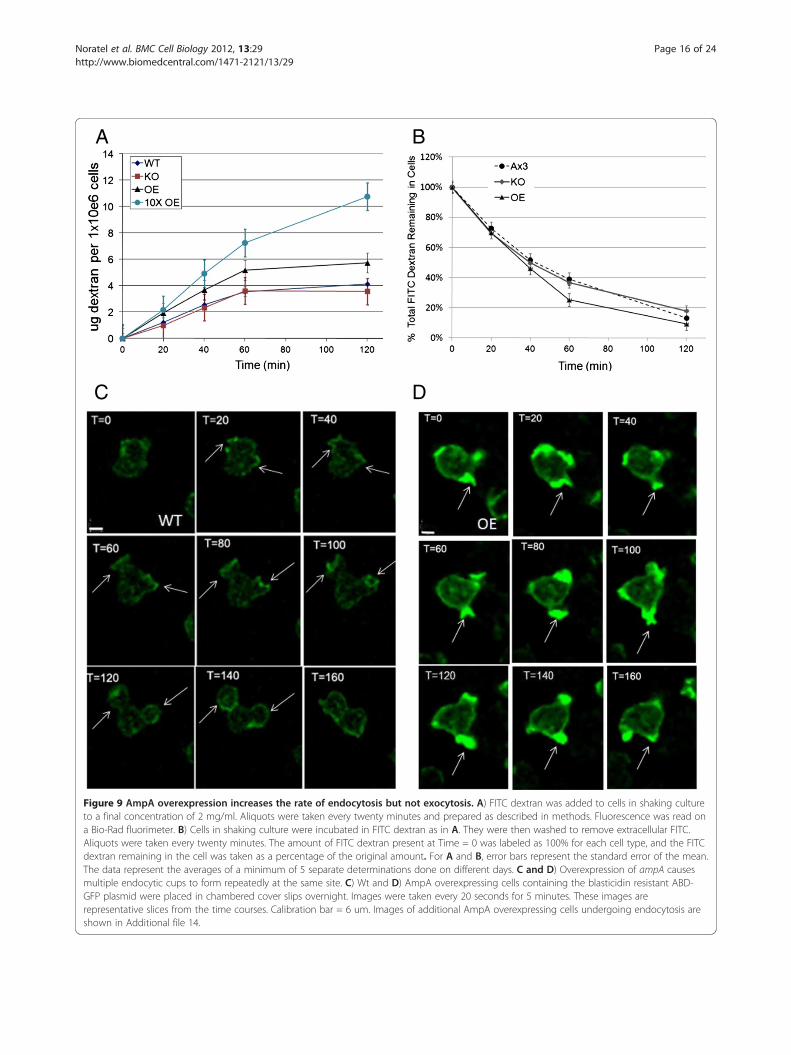
interior vesicles and a perinuclear site raises the questionof whether AmpA is passively endocytosed or whether itinfluences macropinocytosis. In order to determine ifthere was a change in levels of macropinoctyosis inAmpA mutants, the rate of FITC dextran uptake wasmeasured. AmpA over expressing cells endocytose dex-tran at a more rapid rate than do the wild type cells(Figure 9A). The rate of endocytosis for the ampAknockout was not reproducibly different than wild typealthough in some experiments the rate does not plateau,in all other measures of endocytosis, such as time lapsevideos or imaging of the amount of dextran in the cells(data not shown), the ampA null cells were similar towild type. The AmpA overexpressing strain (OE1) makesabout 3X the wild type level of AmpA protein [19]. Asecond AmpA overexpressing strain (OE2) that makesabout 6X the wild type level of AmpA was created byselecting for an AmpA overexpresser that could grow in10x the normal amount of G418 [19]. The rate of endo-cytosis by the OE2 AmpA overexpresser was even morerapid than that of the OE1strain. The OE1 strain endo-cytosed dextran at a rate of 5 ug dextran per 106 cellsper hour while the OE2 strain endocytosed the dextranat 7 ug per 106 cells per hour compared to the wild typerate of 3.5 ug dextran per 106 cells per hour. Thus, whileAmpA is not essential for normal rates of endocytosis,overexpressing AmpA protein significantly increases therate of endocytosis in a dose dependent manner. Therate of exocytosis, by contrast, was similar for all celllines tested (Figure 9B).In order to understand the mechanism by which over-
expressing AmpA protein increases the rate of endocyto-sis, live cells containing the ABD-GFP plasmid wereimaged as they underwent endocytosis. The overexpres-sing cells showed a very unusual phenotype. They didnot appear to make more endocytic cups but instead anumber of the cells extended multiple endocytic cupsfrom exactly the same point, one right after the other(Figure 9D versus wild type in Figure 9C and Additionalfile 14 for images of 2 additional AmpA overexpressingcells and the movies in Additional files 15 (Wt endo-cytosis) and 16 and 17 (AmpA overexpresser endocyto-sis)). In the wild type cells, the endocytic cup opens,engulfs the medium, and then retracts. At this point thepolymerized actin at the site of cup formation isremoved (Figure 9C and movie in Additional file 15). Ina number of AmpA overexpressing cells, the endocyticcup opens, engulfs, then partially retracts, then opensand engulfs again appearing to use the same nucleus ofpolymerized actin to form the next endocytic cup(Figure 9D, Additional file 14 for 2 additional cells andthe movies in Additional files 16 and 17). This repeatedformation of endocytic cups at the same site is seen in49% of the overexpressing cells (94 cells counted) but in

Figure 8 Some AmpA protein is found extracellularly on the cell surface. A) Live cells were incubated with the membrane stain DiI andwith rat anti-RFP antibody in the dark at room temperature. Cells were washed and then incubated for 1 hour with goat anti-rat antibodyconjugated to Alexa-Fluor 488, then washed and fixed but never permeabilized. Images represent single optical sections of a z-series. Arrowsindicate colocalization of mRFP-AmpA with DiI at the cell periphery. Scale bar is 13 um in the field images (top row) and 5 um in the zoom of asingle cell (bottom row). B and C) AmpA on the cell surface is endocytosed and traffics to a perinuclear endosomal recycling compartment. Livecells were incubated 4°C with rat anti-RFP antibody. B) Some of the coverslips were maintained at 4°C to prevent endocytosis, washed to removeexcess anti-mRFP antibody, fixed and then permeabilized and labeled with goat anti-rabbit second antibody. Slices of cells from a Z series toshow that the labeling is largely on the outside of the cell and not in the interior. Scale bar is 10 um C) Cells on the other coverslips (panelslabeled 22 degrees) were washed to remove excess anti-mRFP antibody, then incubated at room temperature for 15 min to allow endocytosis ofthe antibody bound mRFP-AmpA and then fixed and permeabilized to allow labeling with second antibody to detect anti-RFP antibody that hadbeen internalized with the AmpA. The image is a slice from a Z series. The scale bar is 10 um.
Noratel et al. BMC Cell Biology 2012, 13:29 Page 15 of 24http://www.biomedcentral.com/1471-2121/13/29
A B
C D
Figure 9 AmpA overexpression increases the rate of endocytosis but not exocytosis. A) FITC dextran was added to cells in shaking cultureto a final concentration of 2 mg/ml. Aliquots were taken every twenty minutes and prepared as described in methods. Fluorescence was read ona Bio-Rad fluorimeter. B) Cells in shaking culture were incubated in FITC dextran as in A. They were then washed to remove extracellular FITC.Aliquots were taken every twenty minutes. The amount of FITC dextran present at Time = 0 was labeled as 100% for each cell type, and the FITCdextran remaining in the cell was taken as a percentage of the original amount. For A and B, error bars represent the standard error of the mean.The data represent the averages of a minimum of 5 separate determinations done on different days. C and D) Overexpression of ampA causesmultiple endocytic cups to form repeatedly at the same site. C) Wt and D) AmpA overexpressing cells containing the blasticidin resistant ABD-GFP plasmid were placed in chambered cover slips overnight. Images were taken every 20 seconds for 5 minutes. These images arerepresentative slices from the time courses. Calibration bar = 6 um. Images of additional AmpA overexpressing cells undergoing endocytosis areshown in Additional file 14.
Noratel et al. BMC Cell Biology 2012, 13:29 Page 16 of 24http://www.biomedcentral.com/1471-2121/13/29
Noratel et al. BMC Cell Biology 2012, 13:29 Page 17 of 24http://www.biomedcentral.com/1471-2121/13/29
only 8% of the wild type cells (98 cells counted). Otheraspects of the endocytic process in the AmpA overex-pressing cells seem entirely normal. The acidification ofthe endosomes occurs normally (Additional file 18), in-dicating that the actin surrounding the early endosomeis properly depolymerized allowing the fusion of theearly endosomes with the vesicle proton pumps.When measuring endocytosis rates in the AmpA over-
expressing cells, centrifugation of these cells prior to theassay led to a long delay before the cells were able totake up the dextran. For this reason we determinedendocytosis rates by adding dextran to the media. Thesensitivity of the AmpA overexpressing cells to eitherthe cold or centrifugation itself led to the question ofwhether there was a contractile vacuole defect in theAmpA overexpressing cells but this does not appear tobe the case. The contractile vacuole network in the Wt,ampA null and over expressing cells appeared to beidentical (Additional file 19).
DiscussionAmpA has effects on cell adhesion, cell migration, actinpolymerization, and endocytosis. The question becomeshow a protein not localized to sites of actin polymerizationcan play a role in these diverse cytoskeleton associatedevents. It is possible that AmpA acts as a signaling mol-ecule that triggers these diverse events. Another possibilityis that AmpA is involved in endocytosis and plays a role inmembrane recycling. AmpA colocalizes with the p25 pro-tein in the perinuclear region. Not much is currentlyknown about the p25 protein other than that it is involvedin the endosomal recycling pathway [35]. The identifica-tion of this protein was the first time recycling endosomeshad been demonstrated in Dictyostelium.Endosomal recycling has been extensively studied in
mammalian cells. Some of the most well studied cases ofrecycling to the plasma membrane involve integrins. Inorder for migration to occur, integrins must be removedfrom the plasma membrane via endocytosis and thenrecycled back to form new adhesions [36]. There is acomplex pathway of interactions taking place in the earlyendosome to sort the proteins to be recycled from thosethat are being degraded [37]. There are at least two dis-tinct portions of the early endosome, a tubular compart-ment to which proteins to be recycled are targeted, andlarge vesicle like compartments, where proteins targetedfor degradation are stored [38,39].There are two types of endosomal recycling, slow recyc-
ling and fast recycling. Fast recycling occurs when thetubules in the recycling endosomes pinch off and are im-mediately reabsorbed into the plasma membrane [40,41].The slow recycling may be where AmpA functions. Dur-ing this process, the proteins are targeted to the endoso-mal recycling complex (ERC) [42]. There are two potential
reasons for the slow versus fast recycling. The first is thatthe cell has tight regulation of the proteins on the plasmamembrane. If the proteins are recycled too rapidly, it maynegatively affect how the cell migrates or growth factorsignaling may be over stimulated. But there is another, re-cently discovered cellular reason for proteins to enter theERC. Some proteins need to go back through the Golgi viaretrograde transport [43,44]. Once the proteins have goneback through the Golgi, they can now re-enter thesecretory pathway.AmpA is localized in what Charette suggests is an
endosomal recycling complex in Dictyostelium [35].AmpA also appears to be localized to a distinct portionof the ER and to the Golgi. However, Charette did notsee any colocalization of p25 with calnexin or golvesin, amarker for the Golgi body [35]. Since AmpA does havesome colocalization with the ER, it is possible that, afterrecycling, AmpA may be reprocessed through a portionof the ER and Golgi in order to be trafficked back to theplasma membrane.By imaging live cells, it is seen that AmpA can be
found on the extracellular surface. We have demon-strated that AmpA can be endocytosed, or recycled, be-cause it can be extracellularly labeled in live cells withprimary antibody and the antibody is then brought intothe cell. Taken together these results seem to indicate arole for AmpA as a signaling molecule on the cell sur-face, possibly controlling adhesion and stimulating actinpolymerization. Since AmpA is never detected free inthe media in wild type cells yet can be detected on thecell surface in live cells, it is possible that it interactswith a membrane receptor protein as it passes throughthe ER, Golgi or secretory vesicles and is transiently pre-sented on the extracellular face of the plasma membranebound to its receptor. Possibly, AmpA functions on thecell surface to signal the down regulation of an adhesionprotein by endocytosis. The presence of excessive AmpAfunctioning in this manner would result in a decrease inadhesion relative to wild type and the lack of AmpAcould result in excess adhesion protein on the cell sur-face. However so far no such adhesion protein has beenidentified.Zanchi et al. have used a temperature sensitive
mutant of the secA gene to explore the relation be-tween plasma membrane recycling and cell move-ment. The failure of exocytosis to take place inthese mutants at the restrictive temperature resultsin a net uptake of plasma membrane which is sug-gested to restrict pseudopodial expansion [45]. It ispossible that the role of AmpA in increasing endo-cytosis could alter plasma membrane recycling inthe opposite direction resulting in increased pseudo-pod extension which could influence cell migration.However the ampA null cells do not show any

Noratel et al. BMC Cell Biology 2012, 13:29 Page 18 of 24http://www.biomedcentral.com/1471-2121/13/29
alteration in endocytosis that we can reproduciblydocument so an explanation centering on generalmembrane turnover seems unlikely.For cell migration it would appear that the effect of
AmpA on substrate adhesion is more important than itsrole in actin polymerization, since ampA null cells can mi-grate as well as Wt cells under the right environmentalconditions. Interestingly, wild type cells show far less vari-ation in their migration rates as a result of environmentalconditions (11.1 um/min on top of agar and 10.3 um/minunder agar on glass) than either AmpA overexpressers(16.0 um/min on top of agar vs 10.2 um/min under agaron glass) or ampA null cells (5.0 um/min on top of agar vs13.6 um/min under agar on glass). This suggests that thereis an optimal level of AmpA that enables a cell to migrateconsistently through a variety of environments and thattoo much or too little AmpA, while advantageous in someenvironments, is detrimental in others. Cells with an opti-mal amount of AmpA may not win the race on some sur-faces but they can get to the bacteria and feed when facedwith a wide variety of surfaces.The ampA null cells clearly are more adhesive not
only to the substrate during growth (Figure 3A) and de-velopment [19] but they are also more adhesive to eachother [21]. When sitting at an air water interface on acover slip the more adhesive ampA null cells have amuch larger % of their surface area in contact with thesubstrate and the less adhesive AmpA overexpressingcells show a very reduced substrate contact area. Thisreverses when the cells are migrating under agar. TheampA null cells now show a reduction in substrate con-tact while the AmpA overexpressing cells show an in-crease. Interestingly the wild type cells show littledifference in surface area contact under the two condi-tions (Figure 4B). It is possible that with their increasedadhesion levels the ampA null cells adhere to the overly-ing agar as well as to the substrate, thereby spreadingadhesion receptors over a greater portion of the cell sur-face and thus reducing the area of contact with theunderlying substrate. The AmpA overexpressing cellsmay show more contact with the substrate under agarthan they do at an air water interface not only becauseof the flattening effect of the agar but also because theagar layer on top of the cells may prevent aerial exten-sion of the robust, overly actin rich pseudopods formedby these cells, directing them instead along the substrateand increasing the contact area. Another possibility sug-gested in a review by Lammerman and Sixt [46] is thatwhile surface anchoring is essential for migration in a2D environment it is possibly dispensable in a 3D envir-onment where cells are closely surrounded by matrixmaterials. They base this suggestion on their studies inwhich genetic depletion of all 24 possible integrin het-erodimers left unaltered the migration rate of
neutrophils, dendritic cells and B cells in a 3D collagengel. In this model the fact that the ampA null cells areoverly adhesive may indeed restrict their motility in asoft 2D environment up top of agar but under agar thisexcess adhesion may not come into play. Likewise theadvantage of the reduced adhesion of the AmpA overex-pressing cells in a soft 2D environment may be lost in a3D environment where dependence on adhesion recep-tors may be dispensable.What is difficult to explain is the fact that AmpA both
increases F-actin content and yet decreases adhesionand its absence has the opposite effect of increasing ad-hesion and decreasing F actin. This is the opposite ofwhat would be expected since actin is a major compo-nent of cell adhesion. It is possible that AmpA acts as asignaling molecule on two different pathways and isrequired at a critical level to keep the pathways in bal-ance. A better understanding of this will require a moreextensive knowledge of the proteins that are involved insubstrate adhesion during motility and their interactionwith the actin cytoskeleton and the effects of membranedynamics on their turnover. The results presented heresuggest that AmpA is a player in these processes but itsmechanism of action is unclear. AmpA likely functionsas a signaling molecule binding to another protein or re-ceptor or a complex of proteins. We have made manyattempts to identify receptors or proteins that mightinteract with AmpA but the AmpA protein is 17% cyst-eine and has proved refractory to all affinity chromatog-raphy or pull down approaches for identifying aninteracting protein. We have identified suppressors ofAmpA overexpressing phenotypes and two of these haveeffects on endocytosis that influence cell migration butneither mutant identifies a candidate for an AmpA re-ceptor or AmpA regulated adhesion protein [25,47]. It ispossible that yeast 2 hybrid screens or identification ofsecond site suppressors of ampA null phenotypes willeventually result in the identification of the partnerswith which AmpA interacts and allow for a definitivemodel for AmpA function.
ConclusionsAmpA influences cell migration by influencing substrate ad-hesion and the area of cell substrate contact. Cells requirean optimal level of Amp in order to migrate successfullyover a wide variety of surfaces and environmental condi-tions. Excess AmpA on soft deformable surfaces like agar atan air water interface results in rapid migration but if thecells encounter a thick layer of bacteria they cannot generatethe force to invade it even with the excess actin that theypolymerize. This is presumably because of the decreasedsubstrate adhesion. By contrast, the absence of AmpA in thenull cells results in an almost complete failure of these cellsto be able to migrate on top of agar at an air water interface

Noratel et al. BMC Cell Biology 2012, 13:29 Page 19 of 24http://www.biomedcentral.com/1471-2121/13/29
and in a lawn of bacteria they jig and roll back and forthand can only make very small plaques. In a 3D environmentunder agar and on a hard surface like glass the advantage ofexcess AmpA is lost and the knockout cells that lack AmpAare able to migrate better than wild type cells possibly be-cause of their increased adhesion or possibly because a 3Denvironment has a reduced requirement for adhesion [46].Even though they have a reduced level of F-actin, it is suffi-cient to allow them to migrate better than wild type cells inthis 3D environment.AmpA is associated with an ER derived perinuclear com-
partment, Golgi and Golgi derived vesicles; it is present onthe extracellular surface and is endocytosed and found in aperinuclear endocytic recycling compartment colocalizedwith p25, a protein used to identify a slow recycling com-partment [35]. In spite of its effects on F-actin levels and cellmigration AmpA is not associated with the actin cytoskel-eton. Since AmpA does not have any transmembranedomains, only a hydrophobic leader sequence, it must re-quire the partnership of another protein to be present onthe cell surface. It is likely that as it transits through the ERand Golgi to the cell surface where it binds to a receptor.We postulate that this receptor plays a role in cell-cell andcell-substrate adhesion. AmpA could potentially control thelife time of this receptor on the cell surface and in this wayinfluence adhesion and possibly actin polymerization. But itis also possible that AmpA is a secreted autocrine ligandthat signals through a surface receptor. Obviously thesemodels rests on identification of an AmpA receptor or inter-acting protein which has so far not been identified. TheSadA protein influences cell-substrate adhesion but is un-likely to be the AmpA receptor because SadA also influ-ences phagocytosis and AmpA does not [14,15]. We havemade many attempts to isolate this receptor but, with 17%cysteine in the protein, AmpA is very difficult to work withbiochemically and none of the attempts to isolate interactingproteins have succeeded. We have used REMI mutagenesisto identify second site suppressors of AmpA overexpressingcell lines by selecting for reduced cell migration. Interest-ingly, all of these mutants influence cell migration and twoout of three of these mutants influence or are associatedwith endocytic processes [25,47]. The best way to identify apotential AmpA receptor may be to use REMI mutagenesisto isolate second site suppressors of the ampA null mutant.Until a receptor for AmpA can be identified it will not bepossible to further define how an optimal level of AmpAinfluences both cell substrate adhesion and actinpolymerization to maintain a constant rate of migration overa wide variety of substrates.
MethodsAxenic Growth of DictyosteliumCell lines with the ampA gene knocked out or overexpressed as well as methods for growing cells are
described by [19]. For cell lines containing the blasticidinresistance cassette (bsr) or the G418 resistance cassette,10ug/ml blasticidin S hydrochloride or 9.6 ug/ml G418was included in the media respectively. Cells in late logphase (3-4 × 10⁶) were used in all experiments unlessotherwise indicated. The ampA knockout and AmpA pro-tein overexpressing cell lines are available from the Dic-tyostelium Stock Center (www.dictybase.org). An ampAnull strain in which the blastocidin cassette has beenremoved by the lox-cre recombination system is described[25,48]. Cells were plated on LP agar plates (5 gm/literBactopeptone, 5 gm/liter Lactose, 2% agar) on a lawn of E.coli B/r for single colonies for plaque formation assays.The plates were incubated in a moist chamber at 22°Cfor 72 to 96 hours. In some experiments cells were platedon 1/2HL5 plates instead of LP agar plates. These richerplates allow for a thicker bacterial lawn. Plaques on LPplates were imaged after 5 to 6 days while plaques on1/2HL5 plates were imaged after 11 days.
Generation of mRFP-AmpA and AmpA-Tap tag fusionprotein plasmidsAmpA-Tap tag plasmidThe ampA gene from the Eco RI site at the start of thepromoter to the last amino acid codon (2.3Kb) was PCRamplified and cloned into the multiple cloning site be-tween the Eco R1 and BamH1 sites of the pDDGal 16 vec-tor [49]. The 50 primer (Eco R1 site underlined) was50 CCGGAATTCTAAGAATATTATTATTATTATTA and the30 primer (Bam H1 site underlined) was 50 CGCGGATCCTTGAGTTAAATTTTCACG. The beta-galactosidase sequencewas removed by cutting with BamH1 and XhoI and replacedwith the Tap tag sequence which was amplified from pBS1479[31] using a 5’ primer containing a BamH1 site (underlined) (50
AAGGGAACAAAAGCTGGAGGATCCATG) and a 30 pri-mer containing an XhoI site (underlined) 50 CTGACGCTCGAGTTAGGTTGACTTCCCCGCGGA to obtain a plasmidcalled pKL1. The pKL1 plasmid has a KpnI site immediatelyupstream of the EcoR1 site at the start of the AmpA pro-moter. The AmpA 30 downstream region from the AmpAtermination codon to a site ~1000 base pairs downstreamwas PCR amplified. The 50 primer containing a Bam H1 site(underlined) was 50 AAGGGAACAAAAGCTGGAGGATCCATG and the 30 primer containing a Not I site (underlined)was 50 TCAAGGATGAGCGGC CGCAATTCTCTATGGTCAACATTA. This PCR fragment was ligated into pLPBLP[48] at the BamH1 Not1 sites. This plasmid which containsthe floxed blasticidin cassette was called pKL2. The 215 bpampA terminator site was PCR amplified from the full lengthgenomic clone of ampA in pGem3 using a 50 primer containingan Xho I site (underlined) 50 GGTTGTTGCCCATCTCGAGAAAATTTAACTCAA and a 30 primer containing a Hind IIIsite (underlined) 50 GCGGCCAAGCTTTTAATAGTGTGTTATTA. Instead of simply adding the restriction sites

Noratel et al. BMC Cell Biology 2012, 13:29 Page 20 of 24http://www.biomedcentral.com/1471-2121/13/29
onto the 50 end of each primer, two bases were changedin the ampA sequence to create the sense primer andone base was changed to create the antisense primer.This was done because it is hard to find segments witha high enough GC content for PCR. Therefore, twoshort primer binding sites with a relatively high GCcontent were chosen that flanked the ampA terminatorregion at the 30 end of the gene. In the sense 50 primer,GTCGTG was changed to CTCGAG to create an XhoIsite, while in the antisense 30 primer AAGTTT waschanged to AAGCTT to create a HindIII site. ThisPCR fragment was cloned into the pBluescript II vectorat the Hind III –XhoI site to obtain plasmid pKL3. TheampA promoter, coding region, and in frame fusion tothe Tap tag was excised from pKL1 by Kpn I – XhoIand subcloned into the pKL3 plasmid at the KpnI-XhoIsite so that the ampA terminator sequence was imme-diately downstream of the AmpA-Tap tag fusion pro-tein gene. This generated plasmid pKL4. The KpnI-Hind III fragment from pKL4 was then subcloned intothe KpnI –Hind III site of pKL3 to place the ampA-Taptag –Terminator sequence adjacent to the blastocidincassette and 30 downstream ampA sequence in theAmpA-Tap tag vector shown in Additional file 5.The mRFP-AmpA plasmid was constructed so that the
AmpA hydrophobic leader sequence (MLNKLILLLILSSCLVLSVKSEV – predicted cleavage site underlined) pre-ceded the mRFP coding sequence [32] which was followedby the remainder of the ampA coding sequence starting withthe amino acid “N” which immediately follows the hydro-phobic leader. A PCR copy of the ampA coding sequencestarting at the amino acid (N) immediately following thehydrophobic leader and continuing 193 nucleotides down-stream past the unique Age I restriction enzyme site in theampA coding sequence was generated. The 50 primer con-taining a BamH1 site (underlined) was 50 GCGCGGATCCAATGTTGATTGCTCCCTCG and the 30 primer contain-ing a ClaI site (underlined) was 50 CGCGATCGATGGTTGGTGGGAGAGTACATGGA. This PCR fragment wascloned into the 339–3 mRFPmars-BsrH plasmid [32] togenerate an in frame fusion of mRFP-mars to AmpA cod-ing sequence distal to the hydrophobic leader (mRFP-mars-AmpA-C-terminal). This 880 base pair DNA fragment wasexcised from the BsrH plasmid as a HindIII-ClaI fragmentand subcloned into the HindIII –ClaI site of a pBluescriptplasmid (Stratagene) to generate pBlue1. A 1550 base pairPCR fragment was generated that included the 50 AmpApromoter sequence starting upstream of the unique Bgl IIsite and ending at the last amino acid of the AmpA hydro-phobic leader sequence (V). The 50 primer for this PCRproduct containing an Eco RI site (underlined) was 50
CGCGGAATTCACAACTAATTGTAATACCTGCAATTGand the 30 primer containing a Hind III site (underlined) was50GCGCAAGCTTAACTTCACTTTTAACTGATAGTACC.
This fragment was cloned into the pBlue1 plasmid at theEco RI –Hind III site to generate mRFP-AmpA-pBlue2.Next, the pBlue2 plasmid was cut with BglII and AgeI. Theseare unique restriction enzyme sites in the ampA promoterand coding region respectively. Cutting at these sites excisesthe mRFP-AmpA construct from the pBlue2 vector. ThisBglII-AgeI fragment was cloned into a full length ampA EcoRI genomic DNA fragment in a pGem3 vector and replacedthe endogeneous BglII-AgeI DNA fragment with the BglII-AgeI DNA fragment that now contained the AmpA hydro-phobic leader fused in frame to the N-terminus of themRFPmars coding sequence which is fused in frame N-terminal to the remainder of the AmpA coding sequence. Fi-nally the floxed blastocidin cassette from the PLPBLP plas-mid [48] was excised with PstI and XmaI and cloned intothe PstI-XmaI restriction sites in the multiple cloning site ofthe pGem3-mRFP-AmpA vector (Additional file 6).
Transformation of DictyosteliumPlasmids containing GFP fused to ABD120 [28], Calnexin[33] or N-Golvesin [34] were acquired from the Dictyoste-lium Stock Center. All plasmids were inserted into theDictyostelium cells via electroporation [50].
Live Cell Microscopy of Transformed StrainsCells were placed on chambered coverslips overnight inHL5 media for 16–18 hours and imaged on a Leica SP5confocal microscope. For time courses, images wereacquired every 5–10 seconds for 5 minutes. All datawere analyzed using either the Volocity Program (PerkinElmer) or Image J (NIH).
EndocytosisWild type Ax3, ampA knock out, and AmpA overex-pressing cells were grown to a density of approximately3 × 106 cells/ml and assayed as in [51] with the excep-tion that the media was supplemented with 2 mg/mlFITC dextran without centrifugation of the cells. Onemilliliter aliquots were taken at times 0, 20, 40, 60 and120 minutes. Fluorescence was read on a spectrofluori-meter (Bio-Rad) using a 488nm excitation filter and a520nm emission filter. The fluorescence was comparedagainst a standard curve and the micrograms of FITCdextran that were endocytosed per 1 × 10⁶ cells weredetermined.
ExocytosisFor exocytosis assays, the cells were grown to a densityof 3 × 10⁶ cells/ml. The growth medium was supple-mented with 2 mg/ml FITC dextran and the cells wereincubated for 3 hours. The cells were then centrifugedand the media was replaced with unsupplemented HL5.One milliliter aliquots were taken at 0, 20, 40, 60, and120 minutes. The aliquots were washed once with HL5

Noratel et al. BMC Cell Biology 2012, 13:29 Page 21 of 24http://www.biomedcentral.com/1471-2121/13/29
and once with endocytosis wash buffer. The procedurethen was as described above [51].
PhagocytosisPhagocytosis was assayed by following the uptake of car-boxylated fluorescent latex beads (FITC#15702) fromPolyScience, Warrenton Pa. (1 um in diameter) asdescribed [52]. Fluorescence was determined using aBioRad spectrofluorimeter.
FM-64 stainingFM-64 Staining is described in [53]. Cells were imagedusing a Leica SP5 confocal microscope.
Phalloidin bindingPhalloidin binding to quantify the amount of polymerizedactin was carried out according to [54]. Cells were grownto mid-log phase and 3 × 10⁷ cells were centrifuged andthe pellet resuspended in 1 ml 20 mM K2KPO4. A 100 ulsample of cells was placed in 1 ml fixing solution (3.7%formaldehyde, 10 mM PIPES, 0.1% TritonX-100, 20 mMK2KPO4, 5 mM EGTA, 2 mM MgCl2 and 250 nM Alexafluor 488-phalloidin (Molecular Probes) and incubated atroom temperature for 1 hour. Cells were then centrifugedfor 5 minutes at 2000 rpm in a microcentrifuge and afterone wash in 20 mM K2KPO4 the pellet was resuspendedin 1ml methanol and vortexed briefly. Cell debris wasremoved by a brief centrifugation in a microfuge and theFITC-fluorescence in the supernatant was determinedusing a BioRad versafluor fluorometer with a 488 nm exci-tation filter and a 520 nm emission filter. Data points weretaken in triplicates and the assays repeated 3 times on dif-ferent days with different batches of cells. Nanomoles ofphalloidin were determined by comparison to a knownconcentration standard curve assayed in parallel.
Cell adhesion assay2 × 106 cells in 10 ml were placed on 60x15 mm plates(Sarstedt) and allowed to incubate overnight in a humidchamber. The following day, the cells were placed on ashaking platform at the indicated shaker speeds (rota-tions per minute, RPMs) for 45 minutes. The supernatantwas then removed and the number of cells released fromthe plates was determined. Medium (10 ml) was then re-added to the plates which were scraped and the numberof cells that had remained attached to the plate wasassayed. The number of cells that remained attachedwas calculated as a percentage of total cells.
Reflection imaging to determine the percent of the cellsurface in contact with the substrateCells were allowed to adhere in chambered cover slipsovernight. The following day they were imaged on theSP5 Confocal microscope in both transmitted light mode
and reflection mode. The argon laser was used and theexcitation wavelength was 488 nm for reflection imaging.This allowed the visualization of the area of the cell indirect contact with the substrate. The images wereimported into ImageJ and the ratio of the area of the cellin contact with the substrate to the total area of the cellwas determined.
Migration of growing cells on top of and under agarMigration of cells under agar was according to [30]using 0.8% agar. The agar was formed either on cham-bered glass cover slips or on plastic dishes. Cells in HL5were placed into wells cut in the agar. Folic acid(0.5 mM) was added to a trough 5mm away from thetrough containing the cells 1 hour prior to the additionof cells to allow a gradient to form. Cells were imagedfrom underneath using a 40x objective on a Leica SP5scanning confocal microscope. Imaging was initiated 3to 5 hours after the addition of cells to the wells. Imageswere collected at 10 second intervals for periods of 5min.Migration of cells on top of 1% agar in 20 mM
NaKPO4 buffer was as described by [26] except that avery thin layer of agar was spread on a chambered coverslip. Cells were grown to mid log phase in axenic cul-ture. Cells were centrifuged and resuspended at a vol-ume of 1 × 10⁷ cells/ml. Ten microliters of cells werespotted 1 mm away from a 5 ul drop of 0.5 mM folicacid. The folic acid was spotted on the agar 1 hr beforethe cells to allow diffusion of the folic acid through theagar. Imaging was started 4 hours after the addition ofcells. Cells were imaged from underneath with a 40x ob-jective equipped with a correction collar on an invertedLeica SP5 confocal microscope. Because the thickness ofthe thin layer of agar varies from dish to dish it was ne-cessary to use the zoom function to get the very clearestimages of cells on top of the agar. This means that themagnification is not always identical from image toimage in these experiments but scale bars are imbeddedin each image. Images were captured every 10 secondsfor 5 min intervals. Image analysis was done using theImage J (NIH), Volocity (Perkin Elmer), Metamorph(Universal Imaging) and DIAS software (Solltec). Eachimage or video series was calibrated with its own scalebar.
Analysis of cell motilityDirectionality is a measurement of how well cells movein a single direction and is determined by the ratio ofproductive distance to total distance. Total distance isthe sum of how far the cell traveled. The productive dis-tance is how far the cell traveled from the point of originover the time of the measurement and is determined bythe length of a straight line from the starting position to

Noratel et al. BMC Cell Biology 2012, 13:29 Page 22 of 24http://www.biomedcentral.com/1471-2121/13/29
the ending position (Euclidian distance). The chemotac-tic index is used to determine how well cells migrate toa source of chemoattractant and is determined by takingthe cosine of the angle between a line that parallels thegradient and a line created between the cell’s end pointand the cell’s starting point. A value of 1 indicates thecell is moving directly up the gradient and a value of −1indicates a cell is moving directly against the gradient.Roundness is the ratio of the length to the width of thecell converted to a percent. 100% is totally round.
Western BlottingStrains were grown to log phase. 1 × 10⁶ cells were har-vested by centrifugation and the pellet was resuspendedin 30ul Laemmli sample buffer [55]. Polyacrylamide gelelectophoresis (PAGE) was performed under the stand-ard conditions [55]. For Western blots the proteins weretransferred onto nitrocellulose using a Bio-Rad transferapparatus. The transfer buffer was continuous buffer(0.292% glycine, 0.58% Tris, 0.0376% SDS, 20% MeOH).The nitrocellulose was blocked overnight with 2.5% non-fat dry milk in TBST (10 mM Tris–HCl 150mM NaCl,0.05% Tween 20). The blot was then probed with eitherthe anti-actin antibody (1:1000 dilution 224-236-1Hybridoma Bank) [56] or the anti-TAP antibody (1:1000,Open Biosystems). Initial lots of anti-Tap antibodyshowed no cross reactivity with any Dictyostelium pro-teins and were suitable for immunofluorescence imagingbut subsequent lots contained cross reacting antibodiesand were only suitable for western blots. Secondary anti-bodies were goat anti-mouse conjugated to alkalinephosphatase from Jackson Immunoresearch.
ImmunofluorescenceCells were grown to a high density (6 × 10⁶ cells/ml).100ul were spotted onto a cover slip that had beenplaced in a petri dish with moistened paper towels. Thecells were allowed to adhere to the cover slips for 18hours. The medium was removed and the cells werefixed with 4% formaldehyde in 20mM Na2KPO4 bufferfor 15 minutes at room temperature. The cells were per-meabilized in anhydrous MeOH with 1% formaldehydeat −20°C for five minutes. The cells were incubated withanti-tap (Open Biosystems) or anti-mRFP (Chromtek)antibodies for 2 hours followed by incubation for 2hours with secondary antibodies (Invitrogen). The coverslips were washed 3x in PBS and mounted on micro-scope slides (Corning) coated with Prolong Gold Anti-fade Reagaent (Molecular Probes). For actin staining,cells were fixed in 0.3% gluteraldehyde and permeabi-lized with 0.1% TritonX-100 in PBS (pH 7.4) buffer.Where utilized, primary antibodies were applied fol-lowed by incubation with secondary antibodies. Alexafluor 488-phalloidin (Molecular Probes) at a 1:500
dilution was included in the secondary incubation tolabel F-actin. Alexa fluor-594 conjugated deoxyribo-nuclease I (Molecular Probes) was added along with thephalloidin to label unpolymerized G-actin.For localization of mRFP-AmpA or AmpA-Tap tag to
the plasma membrane, cells were incubated for 10 min-utes at 4o with the DiI membrane stain (Invitrogen) resus-pended per the manufacturer's instructions. The cellswere then incubated for 1 hour at room temperature or at4°C with rat anti-RFP primary antibody (Chromtek) orrabbit anti-tap antibody (Open Biosystems). They werewashed 3x with HL5 and then incubated in secondary goatanti-rat or goat anti-rabbit antibodies conjugated to FITC.They were again washed with HL5 and then fixed with3.7% formaldehyde in 20mM Na2KPO4 buffer. They werewashed and mounted on cover slips using Prolong GoldAntifade (Invitrogen).Imaging of fixed cells was done on a Leica SP confocal
microscope. For FITC and Alexa fluor 488-conjugatedantibodies the Argon laser line 488 was used for excita-tion (20%) and an emission band width of 500-550 nmwas used. For 594 Alexa conjugated antibody imagingexcitation was with the DPSS laser line 561 (15%) andHeNe laser line 594 (30%) and emission was detected ata range of 600 nm-767 nm. In DiI staining the DPSSlaser line 561 nm (30%) was used for excitation and anemission range of 604-767 nm was used. For DAPIstaining and nuclei visualization, the stain was excitedwith the Diode laser line 405 nm (8%) and emission wasrecorded at 430-477nm.
Quantitation of fluorescent images of F-actin stainingin cellsImaging of fluorescently labeled cells was done in pairsof Wt and ampA nulls or AmpA overexpresser and Wt.In each pair the gain and laser power on the confocalmicroscope was set so that the most intense pixels ofthe pair (Wild type or Overexpresser) were set equal to255 grey scale units so that the pair of fluorescentimages would be in the linear range (0 to 255 grey scalevalues) and could be quantified relative to each other. Zseries were collected and converted to an extended focus3D reconstruction and a 2D image of the 3D renderingwas quantified in image J. The integrated pixel intensityper cell area in um2 was calculated.
Microscopy and Image AnalysisDictyostelium plaque formation on bacterial lawns wasviewed under an Olympus dissecting scope. All plaqueimages were acquired at a magnification of 22x. For highmagnification viewing of cells within plaques, cells wereimaged from underneath the petri dish using a LeicaDM IRB microscope with a 40x objective with a correc-tion collar. Images were collected using a DC330 video

Noratel et al. BMC Cell Biology 2012, 13:29 Page 23 of 24http://www.biomedcentral.com/1471-2121/13/29
camera (DAGE-MTI, Inc., Michigan City, IN, USA) anda frame grabber. Images were digitized, processed, andanalyzed using the Metamorph image processing system,(Universal Imaging, West Chester, PA, USA). Timelapsevideos of cells migrating in plaques were taken at 1 to 2minute intervals for 30 to 60 min. The microscope wasrefocused after collection of each image in the series. Cellmigration was tracked and the velocity determined usingthe centroid-tracking program in the Metamorph imageprocessing software. To track individual cells at the per-iphery of plaques, each image in the video stack wasenlarged 400x to clearly see individual cell outlines.
Additional files
Additional file 1: Phagocytosis is not significantly altered in ampAmutants. Supplemental figure and legend.
Additional file 2: Quick Time Movie Wt cells migrating on top ofagar to folic acid −2 frames per second.
Additional file 3: Quick Time Movie KO cells migrating on top ofagar to folic acid-2 frames per second.
Additional file 4: Quick Time Movie OE cells migrating on top ofagar to folic acid-2 frames per second.
Additional file 5: AmpA influences the level of F-actin in growingDictyostelium cells. Supplemental figure and legend.
Additional file 6: AmpA overexpressing cells cannot penetrate athick bacterial lawn.
Additional file 7: The area of the cell in contact with the substrateis influenced by AmpA in an environment dependent manner.
Additional file 8: Quick Time Movie Wt cells migrating under agarto folic acid-2 frames per second.
Additional file 9: Quick Time Movie KO cells migrating under agarto folic acid-2 frames per second.
Additional file 10: Quick Time Movie OE cells migrating under agarto folic acid-2 frames per second.
Additional file 11: An AmpA-Tap tag fusion protein vectorintroduced into cells as a linear KpnI-Not I DNA fragment expressesthe AmpA-tap tag fusion protein and retains a wild type phenotypewhile the same plasmid introduced as a covalently closed circularbacterial plasmid shows an AmpA over expressing phenotype.Supplemental figure and legend.
Additional file 12: A mRFP-AmpA fusion protein plasmidintroduced as an extrachromosomal plasmid correctly expresses themRFP-AmpA fusion protein and has an overexpressor phenotype.Supplemental figure and legend.
Additional file 13: AmpA Tap tag fusion proteins show the samedistribution of AmpA protein in vesicles throughout the cells and ina perinuclear compartment as the mRFP-AmpA tagged construct.AmpA-tap tagged OE and AmpA-tap tagged Wt strains show asimilar distribution of AmpA protein within the cell. Supplementalfigure and legend.
Additional file 14: Overexpression of ampA causes multipleendocytic cups to form repeatedly at the same site. Supplementalfigure and legend.
Additional file 15: Quick Time Movie; Wt cells carrying the ABD-GFP plasmid (Bsr) undergoing endocytosis. Movie-2 frames persecond.
Additional file 16: Quick Time Movie; AmpA overexpressing cellscarrying the ABD-GFP plasmid (Bsr) undergoing endocytosis. Movie-2 frames per second.
Additional file 17: Quick Time Movie; AmpA overexpressing cellscarrying the ABD-GFP plasmid (Bsr) undergoing endocytosis. Movie-2 frames per second.
Additional file 18: Endosomes acidify properly in ampA mutants.Supplemental figure and legend.
Additional file 19: There is no defect in the formation of contractilevacuoles in ampA mutants. Supplemental figure and legend.
Competing interestsThe authors declare that they have no competing interests.
Authors’ contributionsEFN and CLP designed and carried out cell migration experiments. EFNdesigned and carried out live and fixed cell imaging and reflectionmicroscopy experiments. CLP and HNC designed and assayed migration inbacterial lawns. HNC generated and characterized the AmpA overexpressingstrain. JSK carried out substrate adhesion experiments and provided helpfulinsight to the direction of the studies. NB helped to maintain and constructthe cell lines and preformed the cell fractionations and western blots. EFNhelped to draft the manuscript and helped to plan the studies. DDBdesigned the studies, conceived of the project and helped draft themanuscript and was responsible for obtaining funding. All authors have readand approved the manuscript.
Authors' informationDDB is associate professor at the University of Maryland, Baltimore County.This work constituted partial completion of a Ph.D. thesis for EFN, JSK andHNC and an M.S. thesis for CLP. CLP is currently the manager of the Keith R.Porter Light and Electron Microscopy Facility at University of Maryland,Baltimore County. NB was an undergraduate research intern and a MeyerhoffScholar at University of Maryland, Baltimore County.
AcknowledgementsThis work was supported by grants # RO1GM56690 from the NationalInstitutes of General Medical Sciences, #MCB-0444883 and #BIR-9419949 fromthe National Science Foundation to DDB and MRI-0722569 from the NSFInstrumentation program to D.D.B. and Theresa Good. We thank SteveCharette and Pierre Cosson for the p25 antibody. We also thank AnnetteMuller-Taubenberger and the Dictyostelium Stock center for the mRFPplasmid, and the Calnexin-GFP plasmid, Dave Knecht and the DictyosteliumStock center for the ABD120-GFP plasmid and Alan Kimmel for the floxedblast cassette plasmid and the cre recombinase plasmid. We thank KateLannon, Stephanie Steiner and Julie Wolf for help with construction of theAmpA-Tap tag plasmid and the mRFP-AmpA plasmid and Juliette Russel fortechnical assistance. Also, the Dictyostelium Stock center and Gunther Gerishsupplied the GFP N-golvesin construct. The coronin and fimbrin antibodiesdeveloped by Gunther Gerish were obtained from the DevelopmentalStudies Hybridoma Bank developed under the auspices of the NICHD andmaintained by The University of Iowa, Department of Biology, Iowa City, IA52242. We are grateful to the UMBC Keith R. Porter Imaging Facility for useof the microscopes and imaging software. The tap tag construct wasobtained from Bertrand Seraphin under a Material Transfer Agreement.
Received: 30 May 2012 Accepted: 22 October 2012Published: 5 November 2012
References1. DiMilla PA, Stone JA, Quinn JA, Albelda SM, Lauffenburger DA: Maximal
migration of human smooth muscle cells on fibronectin and type IV collagenoccurs at an intermediate attachment strength. J Cell Biol 1993, 122(3):729–737.
2. Ke H, Parron VI, Reece J, Zhang JY, Akiyama SK, French JE: BCL2 inhibits celladhesion, spreading, and motility by enhancing actin polymerization.Cell Res 2010, 20(4):458–469.
3. Ponti A, Machacek M, Gupton SL, Waterman-Storer CM, Danuser G: Two distinct actinnetworks drive the protrusion of migrating cells. Science 2004, 305(5691):1782–1786.
4. Le Clainche C, Carlier MF: Regulation of actin assembly associated withprotrusion and adhesion in cell migration. Physiol Rev 2008, 88(2):489–513.
5. Giancotti FG, Ruoslahti E: Integrin signaling. Science 1999, 285(5430):1028–1032.
Noratel et al. BMC Cell Biology 2012, 13:29 Page 24 of 24http://www.biomedcentral.com/1471-2121/13/29
6. DeMali KA, Barlow CA, Burridge K: Recruitment of the Arp2/3 complex tovinculin: coupling membrane protrusion to matrix adhesion. J Cell Biol2002, 159(5):881–891.
7. Eichinger L, Pachebat JA, Glöckner G, Rajandream MA, Sucgang R,Berriman M, Song J, Olsen R, Szafranski K, Xu Q, et al: The genome of thesocial amoeba Dictyostelium discoideum. Nature 2005, 435(7038):43–57.
8. Rivero F: Endocytosis and the actin cytoskeleton in Dictyosteliumdiscoideum. Int Rev Cell Mol Biol 2008, 267:343–397.
9. Kessin R: Dictyostelium: Evolution, Cell Biology, and the Development ofMulticellularity, Volume 38. Cambridge, The United Kingdom: CambridgeUniversity Press; 2001.
10. Loomis WF: The spatial pattern of cell-type differentiation inDictyostelium. Dev Biol 1982, 93(2):279–284.
11. Jermyn KA, Williams JG: An analysis of culmination in Dictyostelium usingprestalk and stalk-specific cell autonomous markers. Development 1991,111(3):779–787.
12. Dormann D, Siegert F, Weijer CJ: Analysis of cell movement during the culminationphase of Dictyostelium development. Development 1996, 122(3):761–769.
13. Sternfeld J: The anterior-like cells in Dictyostelium are required for the elevationof the spores during culmination. Dev Genes Evol 1998, 208(9):487–494.
14. Cornillon S, Froquet R, Cosson P: Involvement of Sib proteins in theregulation of cellular adhesion in Dictyostelium discoideum. Eukaryot Cell2008, 7(9):1600–1605.
15. Fey P, Stephens S, Titus MA, Chisholm RL: SadA, a novel adhesion receptorin Dictyostelium. J Cell Biol 2002, 159(6):1109–1119.
16. Bukharova T, Bukahrova T, Weijer G, Bosgraaf L, Dormann D, van Haastert PJ, WeijerCJ: Paxillin is required for cell-substrate adhesion, cell sorting and slug migrationduring Dictyostelium development. J Cell Sci 2005, 118(Pt 18):4295–4310.
17. Tsujioka M, Yoshida K, Inouye K: Talin B is required for force transmissionin morphogenesis of Dictyostelium. EMBO J 2004, 23(11):2216–2225.
18. Tsujioka M, Yoshida K, Nagasaki A, Yonemura S, Müller-Taubenberger A,Uyeda TQ: Overlapping functions of the two talin homologues inDictyostelium. Eukaryot Cell 2008, 7(5):906–916.
19. Varney TR, Casademunt E, Ho HN, Petty C, Dolman J, Blumberg DD: A novelDictyostelium gene encoding multiple repeats of adhesion inhibitor-like domainshas effects on cell-cell and cell-substrate adhesion. Dev Biol 2002, 243(2):226–248.
20. Varney TR, Ho H, Petty C, Blumberg DD: A novel disintegrin domainprotein affects early cell type specification and pattern formation inDictyostelium. Development 2002, 129(10):2381–2389.
21. Blumberg DD, Ho HN, Petty CL, Varney TR, Gandham S: AmpA, a modular proteincontaining disintegrin and ornatin domains, has multiple effects on celladhesion and cell fate specification. J Muscle Res Cell Motil 2002, 23(7–8):817–828.
22. Casademunt E, Varney TR, Dolman J, Petty C, Blumberg DD: A geneencoding a novel anti-adhesive protein is expressed in growing cellsand restricted to anterior-like cells during development of Dictyostelium.Differentiation 2002, 70(1):23–35.
23. Abe T, Early A, Siegert F, Weijer C, Williams J: Patterns of cell movementwithin the Dictyostelium slug revealed by cell type-specific, surfacelabeling of living cells. Cell 1994, 77(5):687–699.
24. Manahan CL, Iglesias PA, Long Y, Devreotes PN: Chemoattractant signalingin dictyostelium discoideum. Annu Rev Cell Dev Biol 2004, 20:223–253.
25. Kelsey JS, Fasman NM, Blumberg DD: Evidence of an evolutionarily conservedLMBR1 domain-containing protein that associates with endocytic cups andplays a role in cell migration in Dictyostelium discoideum. Eukaryotic Cell2012, 11:401–416.
26. Hadwiger JA, Srinivasan J: Folic acid stimulation of the Galpha4 G protein-mediated signal transduction pathway inhibits anterior prestalk celldevelopment in Dictyostelium. Differentiation 1999, 64(4):195–204.
27. Washington RW, Knecht DA: Actin binding domains direct actin-bindingproteins to different cytoskeletal locations. BMC Cell Biology 2008, 9:10. Feb 13.
28. Pang KM, Lee E, Knecht DA: Use of a fusion protein between GFP and anactin-binding domain to visualize transient filamentous-actin structures.Curr Biol 1998, 8(7):405–408.
29. Sussman M: Cultivation and synchronous morphogenesis of Dictyosteliumunder controlled experimental conditions. Methods Cell Biol 1987, 28:9–29.
30. Laevsky G, Knecht DA: Under-agarose folate chemotaxis of Dictyosteliumdiscoideum amoebae in permissive and mechanically inhibited conditions.Biotechniques 2001, 31(5):1140–1149.
31. Puig O, Caspary F, Rigaut G, Rutz B, Bouveret E, Bragado-Nilsson E, Wilm M,Séraphin B: The tandem affinity purification (TAP) method: a generalprocedure of protein complex purification. Methods 2001, 24(3):218–229.
32. Fischer M, Haase I, Simmeth E, Gerisch G, Müller-Taubenberger A: A brilliantmonomeric red fluorescent protein to visualize cytoskeleton dynamics inDictyostelium. FEBS Lett 2004, 577(1–2):227–232.
33. Müller-Taubenberger A, Lupas AN, Li H, Ecke M, Simmeth E, Gerisch G:Calreticulin and calnexin in the endoplasmic reticulum are important forphagocytosis. EMBO J 2001, 20(23):6772–6782.
34. Schneider N, Schwartz JM, Köhler J, Becker M, Schwarz H, Gerisch G:Golvesin-GFP fusions as distinct markers for Golgi and post-Golgivesicles in Dictyostelium cells. Biol Cell 2000, 92(7):495–511.
35. Charette SJ, Mercanti V, Letourneur F, Bennett N, Cosson P: A role foradaptor protein-3 complex in the organization of the endocytic pathwayin Dictyostelium. Traffic 2006, 7(11):1528–1538.
36. Ivaska J, Heino J: Interplay between cell adhesion and growth factorreceptors: from the plasma membrane to the endosomes. Cell Tissue Res2010, 339(1):111–120.
37. Mayor S, Presley JF, Maxfield FR: Sorting of membrane components fromendosomes and subsequent recycling to the cell surface occurs by abulk flow process. J Cell Biol 1993, 121(6):1257–1269.
38. Gruenberg J: The endocytic pathway: a mosaic of domains. Nat Rev MolCell Biol 2001, 2(10):721–730.
39. Mellman I: Endocytosis and molecular sorting. Annu Rev Cell Dev Biol 1996,12:575–625.
40. van der Sluijs P, Hull M, Webster P, Mâle P, Goud B, Mellman I: The smallGTP-binding protein rab4 controls an early sorting event on theendocytic pathway. Cell 1992, 70(5):729–740.
41. Sheff DR, Daro EA, Hull M, Mellman I: The receptor recycling pathwaycontains two distinct populations of early endosomes with differentsorting functions. J Cell Biol 1999, 145(1):123–139.
42. Deneka M, Neeft M, Popa I, van Oort M, Sprong H, Oorschot V,Klumperman J, Schu P, van der Sluijs P: Rabaptin-5alpha/rabaptin-4 servesas a linker between rab4 and gamma(1)-adaptin in membrane recyclingfrom endosomes. EMBO J 2003, 22(11):2645–2657.
43. Bonifacino JS, Rojas R: Retrograde transport from endosomes to thetrans-Golgi network. Nat Rev Mol Cell Biol 2006, 7(8):568–579.
44. Johannes L, Popoff V: Tracing the retrograde route in protein trafficking.Cell 2008, 135(7):1175–1187.
45. Zanchi R, Howard G, Bretscher MS, Kay RR: The exocytic gene secAisrequired for Dictyostelium cell motility and osmoregulation. J Cell Sci2010, 123:3226–3234.
46. Lammermann T, Sixt M: Mechanical modes of “amoeboid” cell migration.Curr Opin Cell Biol 2009, 21:636–644.
47. Kelsely JS, Fastman N, Noratel BF, Blumberg DD: Ndm, a coiled coildomainprotein that suppresses macropinocytosis and has effects on cell migration.Mol Biol Cell, 23:1–14.
48. Kimmel AR, Faix J: Generation of multiple knockout mutants using theCre-loxP system. Methods Mol Biol 2006, 346:187–199.
49. Harwood AJ, Drury L: New vectors for expression of the E.coli lacZ genein Dictyostelium. Nucleic Acids Res 1990, 18(14):4292.
50. Kuspa A: Restriction enzyme-mediated integration (REMI) mutagenesis.Methods Mol Biol 2006, 346:201–209.
51. Duran MB, Rahman A, Colten M, Brazill D: Dictyostelium discoideumpaxillin regulates actin-based processes. Protist 2009, 160(2):221–232.
52. Witke W, Schleicher M, Noegel AA: Redundancy in the microfilament system:abnormal development of Dictyostelium cells lacking two F-actin cross-linking proteins. Cell 1992, 68(1):53–62.
53. Kirsten JH, Xiong Y, Davis CT, Singleton CK: Subcellular localization ofammonium transporters in Dictyostelium discoideum. BMC Cell Biol 2008, 9:71.
54. Zigmond SH, Joyce M, Borleis J, Bokoch GM, Devreotes PN: Regulation ofactin polymerization in cell-free systems by GTPgammaS and Cdc42.J Cell Biol 1997, 138(2):363–374.
55. Laemmli UK: Cleavage of structural proteins during the assembly of thehead of bacteriophage T4. Nature 1970, 227(5259):680–685.
56. Westphal M, Jungbluth A, Heidecker M, Mühlbauer B, Heizer C, Schwartz JM, MarriottG, Gerisch G:Microfilament dynamics during cell movement and chemotaxismonitored using a GFP-actin fusion protein. Curr Biol 1997, 7(3):176–183.
doi:10.1186/1471-2121-13-29Cite this article as: Noratel et al.: The adhesion modulation protein,AmpA localizes to an endocytic compartment and influences substrateadhesion, actin polymerization and endocytosis in vegetativeDictyostelium cells. BMC Cell Biology 2012 13:29.