Embed Size (px)
Citation preview

SECTION 78 OF THE TOWN AND COUNTRY PLANNING ACT 1990
Appeal Against Decision by Uttlesford District Council relating to planning application UTT/18/0460/FUL for works and increase in
throughput of Stansted Airport to 43 Million Passengers in any 12month Period
Statement of Common Ground on Surface Access Matters Between Stansted Airport Limited, Highways England and Essex County
Council
V2.0 (FINAL) Dated 07 January 2021
CD25.6

Introduction
This statement of Common Ground (SoCG) relates to the proposed expansion of operations at Stansted Airport and the appeal against the decision by Uttlesford District Council relating to planning application UTT/18/0460/FUL for works and increase in throughput of Stansted Airport to 43 Million Passengers in any 12 month period. The SoCG provides a summary of the consultation undertaken by Stansted Airport Limited (STAL) to date with Highways England (HE) and Essex County Council (ECC) and the matters agreed or not agreed between the Applicants and HE/ECC (based on discussions and information exchanged between the Applicants and HE/ECC) are set out below for each of the SoCG topic areas.
The Development
The proposal will result in the potential increase of future passenger numbers at Stansted increasing from the current cap of 35 million passengers per annum (mppa) to 43mppa with an associated increase in surface access travel.
Statement of Common Ground
Table 1 provides an overview of 2018 application submission regarding traffic and transport.
Table 2 presents the position of the parties in relation to traffic and transport in 2020.
Appendix A - Review of Transport Assessment Addendum (updated version of appendix E of document HA1/3 Highway Authorities Proof of Evidence (withdrawn))
Appendix B – Stansted Airport 35+: Planning Appeal Traffic Modelling Test 23rd December 2020 – (Essex Highways)
Appendix C – Agreed Cost Estimates for the J8 Improvement Scheme (for commuted sum)

Traffic and Transport
Definitions DMRB – Design Manual for Roads and Bridges – Department for Transport Interim Scheme – is the ECC sponsored scheme file number B355308A-00-010 Site Plan (002)(006)_100820 Interim Plus scheme – is the STAL 2018 mitigation scheme drawing number 23003401-SDG-HGN-DR-D-104 Rev P2 (a clarified version of P1) Standalone Mitigation Scheme – is the STAL 2020 mitigation scheme drawing number 23003401-SDG-HGN-DR-D-106 Rev P2 (a clarified version of P1)
Table 1: Overview of 2018 application submission regarding traffic and transport
ID Topic Statement STAL Position HE Position ECC Position Notes
1.1 Transport Assessment
The scope of the Transport Assessment (TA) was submitted and commented upon in 2017 in advance of submission of the planning application.
A review of the TA was undertaken by Highways England and Essex County Council following submission of the Application in February 2018 and comments were made.
An addendum to the Transport Assessment (ATA) was provided to address issues raised through the review of the TA and issued in July 2018. The traffic forecasting methodology was agreed, the junction capacity modelling required further work.
Agreed Agreed Agreed Key matters agreed: Traffic forecasting, capacity assessment (using Vissim model), and mitigation (in the form of Interim+ scheme, in addition to ECC Interim Scheme).
1.2 Junction 8 modelling
Following review of the submitted Linsig model, all parties agreed that the ECC microsimulation model (Vissim) would be a more suitable tool to
Agreed Agreed Agreed Linsig model in isolation was not accepted as sufficient by the highway authorities to assess the impact of development at Junction 8 as it

examine the impact of the scheme and develop an appropriate highway mitigation scheme.
doesn’t report network conditions, particularly interaction with adjacent junctions.
1.3 Sensitivity Testing
Additional sensitivity analysis was undertaken at the same time that examined the potential for 10% additional airport related traffic (above the predicted modelling) passing through M11 J8, and a further test with alternative distribution of airport traffic at this junction.
Agreed Agreed Agreed This was to capture risk associated with a number of assumptions used in the forecasting, and to reflect distribution sensitivities. This was to ensure a robust assessment had taken place and to give the highway authorities confidence that the network could acccommodate the proposed development.
1.4 Junction 8 Improvement
A set of mitigation measures (known as the Interim Plus Scheme) were agreed that could be implemented alongside a proposed Essex County Council Junction 8 improvement scheme, (known as the Interim Scheme). This was to be secured through the S106.
Agreed Agreed Agreed The proposed measures were audited according to the requirement of DMRB, including an outline design and road safety audit. The mitigation measures were referred to as the ‘Interim Plus‘ scheme. This was to be in addition to, and to be implemented at a later date, once the agreed trigger was reached.
1.5 Local Road Network (beyond M11 J8)
The scale of traffic impact on local roads was examined and mechanisms for monitoring and funding for potential future mitigation was agreed in advance of the November 2018 Planning Commitee to be secured through the S106.
Agreed N/A Agreed

Table 2: Current position of the parties in relation to traffic and transport.
ID Topic Statement MAG Position HE Position ECC Position Notes
2.1 J8 Mitigation It was agreed between all parties that standalone mitigation measures needed to be considered due to the delay in the delivery of the ECC Interim Scheme.
Agreed Agreed Agreed
2.2 TA update A Transport Assessment Addendum (TAA) was prepared in 2020 that reported on updated modelling with material changes to baseline and future year assessments.
Agreed Agreed Agreed
2.3 TAA Review A review of the 2020 TAA was undertaken by Highways England and Essex County Council following submission in October 2020. and it was agreed that it was a reasonable representation of the impact on the local and strategic transport networks.
Agreed Agreed Agreed HE and ECC requested more detailed information about what changes in assumptions, methodology and inputs had been used in the TAA. The updated Appendix A (of this SoCG) documents this process and the agreed position.
2.4 Baseline Traffic Data
The use of baseline traffic data as adopted in the TA and updated in the TAA, is appropriate and forms a reasonable basis to understand existing traffic conditions.
Agreed Agreed Agreed
2.5 Highway local road network
Applying TEMPro (V7.2) growth rates to baseline flows and taking account of potential Northside development is a reasonable basis for
Agreed N/A Agreed

traffic growth (Beyond J8)
understanding likely future traffic conditions on the surrounding local road network (excluding airport related traffic), to account for development in the area and national trends in traffic.
2.6 Existing employee travel
The use of 2019 collected data for the 2019 London Stansted Airport Employee Travel Survey Analysis provides a suitable basis for understanding the existing travel patterns and mode share data for employees.
Agreed Agreed Agreed
2.8 Sustainable Transport Targets
We agree that the following targets are fundamental as part of the highway mitigation package and are considered challenging but acheivable given the proposed interventions and will be included in a Unitlateral Undertaking (UU) if this appeal is approved. • A further 10% reduction in employee car
driver trips is a target to be achieved by 43 mppa;
• Maintaining the existing mode share for passenger travel is a target to be maintained between 35mppa and 43mppa; and
• Passenger mode share for Kiss and Fly/Taxis of 20% by 39mppa and 12% by 43mppa.
Agreed Agreed Agreed This will be delivered through a Travel Plan and Surface Access Strategy, which is to be agreed, and monitored through the Stansted Airport Transport Forum.
In addition, STAL to Join the ECC Smarter Travel for Essex Network to strengthen accountability in reaching the target and share good practise this the local business community.
2.9 Sustainable travel initiatives
The strategic approach to achieving sustainable transport targets has been agreed, with a number of specific contributions and actions. These are contained in the draft S106 will be carried forward into a UU if this appeal is approved.
Agreed Agreed Agreed As updated and agreed in the S106
This includes, but is not limited to:
Bus contribution; Bus station improvements;

Local roads contributions; Local road monitoring; Revised approach to Travel Planning; Revised Transport Levy; Revised Terms of Reference and Transport Forum working arrangements; and Membership of the Smarter Travel for Essex Network
2.10 Local Road mitigation Measures
Suitable mechanisms for monitoring and funding for potential future mitigation of impacts of traffic on local roads has been identified, and included in a UU.
Agreed N/A Agreed This will be delivered through the Surface Access Strategy, which is to be agreed, and monitored through the Stansted Airport Transport Forum.
2.11 Revised Junction 8 modelling
Updated modelling using the ECC microsimulation model was carried out, with updated inputs, including sensitivity testing of M11 J8 to examine future operation with and without proposed mitigation measures.
Agreed Agreed Agreed The results of the modelling are detailed in Appendix B Stansted Airport 35+: Planning Appeal, Traffic Modelling Tests (23 December 2020).
2.12 Mitigation of impact on M11 Junction 8
The outcome of the modelling work has informed the identification of standalone mitigation measures. Highways England is content that the proposed mitigation measures are acceptable to outline design standard.
Agreed Agreed Agreed The design review has included the following documents: DMRB design compliance; Stage 1 Road Safety Audit; GG104 Safety Risk Assessment; GG142 Walking, Cycling and Horse Riding Assesment and Review.
2.13 J8 stand alone Mitigation Package
In the event that consent is given to the planning appeal the stand alone mitigation scheme illustrated by Drawing 23003401-SDG-HGN-DR-D-106 Rev P1 (and as clarified on Rev P2) based on
Agreed Agreed Agreed To be delivered the end of the first calendar month at the point when passenger numbers at Stansted Airport have reached a level of 39 mppa in any twelve month period, unless
modelling work undertaken provides suitable mitigation of the proposed development.
Highways England and STAL agree otherwise in writing.
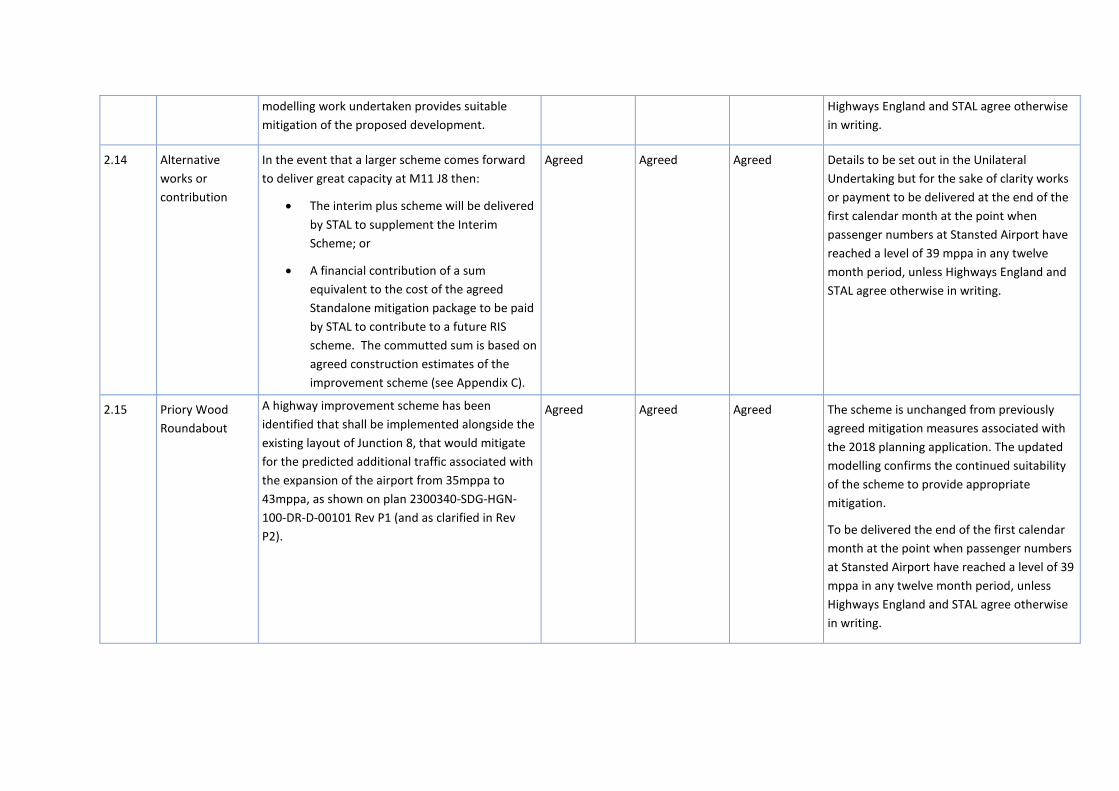
2.14 Alternative works or contribution
In the event that a larger scheme comes forward to deliver great capacity at M11 J8 then:
• The interim plus scheme will be deliveredby STAL to supplement the InterimScheme; or
• A financial contribution of a sumequivalent to the cost of the agreedStandalone mitigation package to be paidby STAL to contribute to a future RISscheme. The commutted sum is based onagreed construction estimates of theimprovement scheme (see Appendix C).
Agreed Agreed Agreed Details to be set out in the Unilateral Undertaking but for the sake of clarity works or payment to be delivered at the end of the first calendar month at the point when passenger numbers at Stansted Airport have reached a level of 39 mppa in any twelve month period, unless Highways England and STAL agree otherwise in writing.
2.15 Priory Wood Roundabout
A highway improvement scheme has been identified that shall be implemented alongside the existing layout of Junction 8, that would mitigate for the predicted additional traffic associated with the expansion of the airport from 35mppa to 43mppa, as shown on plan 2300340-SDG-HGN-100-DR-D-00101 Rev P1 (and as clarified in RevP2).
Agreed Agreed Agreed The scheme is unchanged from previously agreed mitigation measures associated with the 2018 planning application. The updated modelling confirms the continued suitability of the scheme to provide appropriate mitigation.
To be delivered the end of the first calendar month at the point when passenger numbers at Stansted Airport have reached a level of 39 mppa in any twelve month period, unless Highways England and STAL agree otherwise in writing.

Signatures
The above Statement of Common Ground is agreed between MAG/STAL, HE and ECC on the day specified below.
Signed: ___________________________________
Print Name: ________Eric Cooper__________________
Job Title: ________Spatial Planning Manager______
Date: _________07 January 2021_____________
Duly authorised for and on behalf of Highways England
Signed: ___________________________________
Print Name: _______David Sprunt__________________
Job Title: __Principal Transportation and Infrastructure Planner_
Date: ___07 January 2021___________________
Duly authorised for and on behalf of Essex County Council

Signed: ___________________________________
Print Name: ____Alistair Andrew__________________
Job Title: _____Head of Planning Service__________
Date: _______07 January 2021_______________
Duly authorised for and on behalf of MAG/STAL

Appendix A

HA1/3
APPENDIX E
Stansted Airport Appeal
Review of Transport Assessment Addendum
Summary of Position on Traffic Forecasting reached on 23rd December 2020
Item 2018 TA 2020 TA Addendum Comment Steer Response ECC/HE response
3.1 Methodology
Observed baseline + growth + airport growth
Observed baseline + growth + airport growth
Same approach. However, the advanced status of the M11 J7a scheme and rejection of Uttlesford LP may require an alternative approach using (e.g.) ECC VISUM model – discussed at meetings held on 06/10, 05/11 & 11/11.
General Agreement that the use of Tempro factors is likely to provide higher future demand than revised modelling. However, the revised VISUM approach will be processed as a sensitivity test in parallel to the Steer approach.
Use of Visum model allows for traffic reassignment resulting from congestion and J7a construction; HE/ECC request that VISSIM modelling is undertaken using outputs from Visum. This work has now been undertaken
3.2 Baseline 2016 2019 Agreed
3.3 Data 2013 – 2017 counts
2018 – Feb 2020 counts Agreed
3.4-3.5 Normalisation to agreed base
TEMPRO v7.2 + 2016 Airport survey data
TEMPRO v7.2 + 2019 Airport & CAA survey data
Agreed
3.5 Scenarios to be tested
2016 Baseline 2021/22 Construction Period 2028 Do Min (35 MPPA) 2028 D0 Som (43 MPPA)
2019 Baseline 2024/25 Construction Period 2032 Do Min (35 MPPA) 2032 D0 Som (43 MPPA)
Agreed The Vissim modelling was completed and reported by Jacobs on behalf of ECC (dated 23rd December 2020). The central case model include modelling of baseline and future year 35mppa and 43mppa scenarios with traffic movements as modelled and reported in this note. Sensitivity testing was also provided. In total modelling was provided for:
Description Existing Layout Mitigation
35mppa with 2033 revised background traffic growth ✓
43mppa with 2033 revised background traffic growth ✓ ✓
35mppa + 10% with 2033 revised background traffic growth ✓
43mppa + 10% with 2033 revised background traffic growth ✓ ✓
43mppa adjusted distribution (R1) with 2033 revised background traffic growth
✓
The modelling work has now been undertaken and the Highway Authorities are content that it is a fair representation of the junction and the impact of the development and mitigation.
4.3 Base level of passenger demand (Table 4.1)
2016: 24.273 MPPA
2019: 28.274 MPPA Some inconsistencies between the two TAs: the 2020 TA
Steer have adopted ICF passenger model numbers - these are based on STAL advised figures which are slightly different to CAA reported figures. The ICF/STAL figures have been adopted as that ensures consistency between baseline and future assumptions. The alternative approach would simply mean slightly different growth up to 35mppa. The 35mppa-43mppa differences would remain as reported.
Agreed

HA1/3
(not 24.317 MPPA as reported)
reports 24.061 MPPA in 2016, not 24.273 or 24.317. Could an explanation be given, please?
4.6 – 4.10 Base level road traffic mode share (Tables 4.2 & 4.3)
2016: 49.1% by car driver/ car passenger/ taxi (Airport); 50% (CAA) used in TA
2019: 48.1% (Airport); 48% (CAA)
Agreed.
4.7 – 4.8 Tables 4.4 & 4.5)
Disaggregated by passenger type and origin: UK Leisure makes up 54% of passenger numbers
Same Agreed.
4.9 Passenger numbers by mode by origin (Table 4.6)
Car Driver: 3.648 M; Car Passenger: 5.499 M; Taxi: 3.169 M. Total Passengers: 24.273 M Car drivers therefore make up 15% of total demand and Motor vehicle trips (car driver + taxi), 28%; Car occupancy: 2.5
Car Driver: 5.023 M; Car Passenger: 4.904 M; Taxi: 3.624 M. Total Passengers: 28.274 M Car drivers therefore make up 18% of total demand and Motor vehicle trips (car driver + taxi), 30%; Car occupancy: 1.97
There has therefore been an increase in the ratio of vehicle trips (car+ taxi) generated relative to passenger numbers and a decrease in car occupancy between 2016 and 2019. Have these negative trends been acknowledged properly in the forecasting?
The 2019 figures have been adopted for future year forecasting. The 2016 figures were derived with incorrect assumption of car occupancy.
Ratio of vehicles i.e. car driver and taxi to car passenger mode share has reduced, so number of veh trips will have increased relative to passenger numbers. However, we accept that this is offset by the increase in public transport mode share, and adoption of reduced kiss and ride and taxi targets. Agreed
4.9 Passenger numbers by mode by origin (Table 4.6)
Tube Other The column headed ‘tube’ in the 2018 TA is now headed ‘other’: which is correct. Given that Stansted Airport is not on the tube network,
Tube has been included as Rail. The CAA provides a postcode of origin. We only use the postcode data for distribution of car based trips in our modelling. The lookup table from the primary CAA survey data for other is set out below, and in practice other=walk. (I suggest the likelihood is that people have stayed at an on-airport hotel and hence said they walked to the airport- note these are very small numbers and hence have little effect on key impacts that are being examined of highway and rail capacity):
Agreed Agreed
HA1/3
what assumptions have been made about the destination end of trips that originate on the tube network? What else does ‘other’ include other than cycling? This category of trips has expanded significantly and includes trips from a lot more origins than previously. Could you please explain what is going on here?
Other Passenger Type
UK Leisure UK Business Foreign Leisure Foreign Business
Cycle 0 1 0 0 Walk (where only mode) 4 5 15 28 Other 0 0 0 1 (Blanks) 0 0 0 0 Total 4 6 15 29
4.10-4.11 Surface arrivals/ departures by time of day (Figure 4.1 & Table 4.7)
AM Peak is before 0700; PM Peak is 1700 – 1800. Total flows in conventional peak hours: 0800-0900: 3,056 pax (1,528 veh); 1700-1800: 5,356 pax (2,678 veh).
Same Total flows in conventional peak hours: 0800-0900: 3,552 pax (1,706 veh); 1700-1800: 6,225 pax (2,990 veh).
Agreed. A 12% increase in peak hour vehicle movements from a 16% increase in overall (annual) passenger numbers, reflecting a further shift away from motor vehicle trips between 2016 and 2019. The total number of trips in Table 4.7 is exactly 1/364 of the number of annual passenger numbers, therefore an annual average day. When these
STAL provided barrier movement data for all their car parks and the drop off zone for a full year. We have collated this data and then assumed all trips that pass through the Express Drop off and Pick up Zone are 2-way trips and all car park trips are one way. We believe this to be a reasonable proxy and easily monitorable (for the future reduction of 2-way trip target). We do know there are a limited number of drop-off and pick up from mid and short stay car parks. But there are other one way trips using it including airport based taxi or Uber and the drop off zone is also used for rail trips- particularly for local residents who have discounted access to the facility but do not have discounted car parking (i.e. kiss and rail is financially attractive). The analysis was provided as appendix to TAA – (note an errata was issued picking up the error in distribution which includes peak hour 2-way modelling). An extract print of the spreadsheets used for this part of the analysis also provided 16/12/20 to aid response to this comment as attached. The approach has been to assign 43% of all 2019 passenger traffic flows as 2 way and 57% as 1 way. This reflects the proportion of traffic passing through the drop off zone. For both 35mppa and 43 mppa future scenarios we have adopted 33% 2 way trips and 67% 1 way trips in line with future year targets.
Peak hour information was received on 01 and 07/12/2020. The peak hour information has been reviewed and the peak hours for assessment are agreed. Fully worked examples of how passenger trip numbers have been converted into single and double vehicle trips have been provided and reviewed. The methodology is agreed.

HA1/3
numbers have been translated into vehicle movements, what assumptions have been made about double vehicle trips (i.e. kiss & ride/ minicab) where one single trip results in two vehicle movements? These trip types are tabulated in TA Table 5.16 but it is unclear how this has been translated into vehicle numbers
4.12 Staff numbers
10,963 staff (2015)
12,997 staff (2019)
4.14 Staff mode share
64.9% car driver 5.7% car passenger
55.0% car driver 2.2% car passenger
A significant decrease in both car driver and car passenger mode share with a significant increase in the public transport and ‘other’ mode shares.
We believe this reflects an increasing proportion of public transport use relating to increasing proportion of airline and operational (catering baggage handling etc) that are less likely to have access to free parking and more likely to be non-car owners.
Staff survey data received 26-11-20 and trends confirmed. Agreed
4.16 Staff location (Table 4.11)
Total of three largest districts (East Herts, Uttlesford & Braintree): 57.8%
Total of three largest districts (East Herts, Uttlesford & Braintree): 52.5%
As the Airport expands, it draws staff from further away. This is to be expected – what impact might this have on mode shares?
There appears to be expanding proportion of workforce travelling from the Rail corridor. The largest influence on mode share is more likely to be the decreasing proportion of office-based staff as much of the expansion in jobs relates to the operational jobs as noted above. This trend should help deliver eth assumed further reduction in car based employee travel
The Staff Survey has been provided. This shows the greatest proportion of staff using sustainable means in the terminal. Agreed
4.18 Staff working patterns (Tables 4.12 & 4.13)
Table 4.12 provides information on staff working patterns, with 54% of staff working a 5-day week, etc. Para 4.50 of the TA
Was agreed with ECC who reviewed in 2018. ECC was concerned about 50%, but mollified by the previous mistake in Passenger Vehicle Occupancy. This has now been corrected so no buffer now remains to cover this. Revised target for employee mode share should be included in

HA1/3
explains that it has been assumed (in agreement with UDC and ECC), that, on a given day, 50% of staff are on site. This translates into the total arrival and departure numbers in Table 4.13.
S106. The change from 55% to 45% is significant, to help ensure it is reached ECC would want STAL to join the Smarter Travel for Essex Network. Agreed

HA1/3
4.20 Staff movements by time of day (Figure 4.2 & Table 4.13)
Most significant movements between 1200 & 1300 (957); and between 1700 & 1800 (807). Approximately 800 staff movements in each of the conventional peak hours.
Most significant movements between 0500 & 0600 (2,186) and between 1500 & 1600 (1,178). Approximately 800 staff movements in each of the conventional peak hours.
This is a very significant change from 2016 to 2019 and looks like a change to the time period over which data was collected. Please explain. Broadly similar.
This morning figures are because the 2019 survey does not have figures for 00-01 through to 04:00-00:50. In practice the 2019 figures of 2,186 can be assumed to cover all those hours. We do not make use of any of the data until 07:00-08:00. The 15:00-16:00 may be due to a significant shift change- It is not clear- again we do not use that hour and it is clearly not close to the highway network Peak. I have looked at cumulative employee travel times which does highlight the changes
Tables below from staff survey show peaks for each mode
2017 8.9% start 07:00-7:59 2019 8.4% start 07:00-7:59 2017 11.1% start 08:00-08:59 2019 11.6% start 08:00-08:59 2017 11.8% finish 17:00-17:59 2019 11.2% finish 17:00-17:59 It is not clear from the data in the travel survey why the number of trips has changed in the peak hour. Clarification was requested. It is understood revised employee predictions were informed by the report ES Vol 1 Chapter 11 Socio-Economic Impacts. This and the revised Staff Travel Plan Targets account for change Agreed
0%
10%
20%
30%
40%
50%
60%
70%
80%
90%
100%
1 2 3 4 5 6 7 8 9 10 11 12 13 14 15 16 17 18 19 20 21 22 23 24
TAA vs TA Employee Cumulative Travel Time
2019 Arrivals 2019 Departures 2017 Arrivals 2017 Departures

HA1/3
Please note that the 2015 employee survey informed the 2018 TA report, not 2017 as that had not been released in time for the Analysis. As per previous comments, the 2019 survey results do not have figures for 00:00 - 05:00 but we do not make use of any of the data until 07:00-08:00. We use the mode of travel, location and employee start and end time to inform the employee arrivals and departures. This is derived from the raw 2019 Employee Travel Survey data. Meaning the detailed hourly modelling adopts the car driver profile- which has a greater proportion of office based employment

HA1/3

HA1/3
5.1 – 3 Surface networks and usage
The TA presents data to support the view that there is adequate capacity on the rail and bus networks to accommodate forecast growth; an analysis of walk/ cycle access and of car parking.
This analysis is not repeated. However, the TAA asserts that New trains accommodating more passengers have been introduced since July 2020. Rail and bus demand has been updated to 2019 survey data.
Noted
5.5 – 5.14 Tables 5.1 – 5.3 and Figure 5.1: Collision data
Collisions analysed by number, severity, type of vehicle involved.
Ditto, with the collision and casualty rates staying broadly the same.
AECOM analysed the collision data in the January 2018 TA in some detail. This is reported in our TN01. There were a number of non-critical recommendations relating to apparent clusters and patterns, most of which could be addressed in the design of the mitigation scheme. We would expect these to be carried forward into any response to the emerging scheme. There was only one critical recommendation: this related to the proposal to widen the exit from the roundabout into the B1256, an element of the
As discussed 18/11/2020: Any safety issues on the M11 northbound off-slip are likely to be associated with increasing queue lengths. This is mainly associated with background growth, not increase in airport traffic. However, the additional trips to A120 west and M11 north do add to intercepting traffic for this approach so there is some potential impact. The already agreed proposed mitigation and the alternative that should be agreed through the current exercise will result in additional capacity on the Northbound off slip that will reduce queue lengths and should provide safety benefits. The final scheme could include suitable signage and variable messaging warnings.
Steer have only analysed collisions over whole study area, not by location specific clusters, Aecom identified in TN 1, including NB offslip. Further acknowledgement of this welcomed.. Agreed that VMS signing on M11 could mitigate. The predicted queues are still excessive, and above current levels, but the queues are lower than predicted at 35mppa without mitigation. Signing and variable message signing will be required as part of the scheme

HA1/3
mitigation scheme that has since been dropped. The collision data included in the TAA is July 2015 to June 2020. It would have been preferable to have cut off the data set as at mid-March 2020 before the effects of lockdown on traffic flows were first felt.-The annual rate has been calculated incorrectly in both TA and TAA, with the total divided by 6 (the number of years in the table) rather than 5 (the number of 12 month period in the dataset). In neither document has the data been analysed by geographical sub-area (although AECOM did this in our TN01). AECOM TN01 identified a collision cluster and pattern on the M11 Junction 8 northbound off-slip and Figure 5.1 in the TAA shows an increase in both the number and severity of collisions on this

HA1/3
slip road compared to Figure 5.1 of the TA. This is of concern and the opportunity should be taken to incorporate measures in the proposed mitigation scheme to address the identified collision cluster/pattern (TN01, recommendation 19).
6.1 Forecasting methodology
Background traffic increase using TEMPRO v7.2; Air passenger growth pro rata anticipated increase in passenger numbers; Staff to a level anticipated by the Airport.
Same method, using updated data as described above
Same. Advanced status of M11 J7a scheme and rejection of Uttlesford LP may require an alternative approach using (e.g.) ECC VISUM model: discussed at meetings held on 06/10, 05/11 & 11/11.
Methodology using the outputs from the VISUM model agreed.
6.9 Peak Hours for assessment
Highway AM Peak: 0700-0800; Highway PM Peak: 1700-1800; Airport AM Peak: 0500-0600; Airport PM Peak: 1600-1700.
Highway AM Peak: 0700-0800; Highway PM Peak: 1700-1800; Airport AM Peak: 0500-0600; Airport PM Peak: 1600-1700.
Figure 4.1 of the TAA suggests that the AM peak for airport passengers is actually 0600-0700 (although the peak for employees is 0500-0600) and that the PM peak is 1700-1800. Could this be confirmed?
Confirmed- all peak hour tables being provided ECC requested all peak period data is presented hourly to evidence actual peaks are being modelled. Reviewed and agreed
6.16-6.24 & Tables 6.1 – 6.8: Air
The forecasts for air passenger growth
The forecasts for air passenger growth assume growth to 35
Agreed.

HA1/3
passenger forecasts
assume growth to 35 MPPA (DM) or 43 MPPA (DS) by 2028.
MPPA (DM) or 43 MPPA (DS) by 2032.
Table 6.2 Passenger types
The proportion of passenger types is assumed to vary over time, with the proportion of UK Leisure travel increasing from 54% to 58% by 2028
The proportion of passenger types is assumed to vary over time, with the proportion of UK Leisure travel increasing from 54% to 58% by 2032
Same assumption. However, no evidence is presented to support this change.
The passenger profiles have consistently been derived directly from the ICF/STAL forecasts set out in the EA Can accept this as consistent with previously-agreed position.
Table 6.3 Mode Share
The 2016 car driver, car passenger and taxi mode shares are assumed to remain constant over time.
The 2016 car driver, car passenger and taxi mode shares are assumed to remain constant over time.
This is an agreed, robust assumption.
The Kiss and ride share is forecast to decrease, reducing the number of two way trips. The targets are same as 2018 and will be included in the S106 Agreed
Table 6.4 - resulting trip numbers
Car trip forecast to increase as follows: 2016 Base: 9.047M 2028 DM: 13.424M 2028 DS: 16.506M
Car trip forecast to increase as follows: 2019 Base: 9.928M 2032 DM: 12.289M 2032 DS: 15.098M
Same methodology. The lower totals in 2032 result from the higher base and the growth in the proportion of non-car trips between 2016 and 2019. The increases now proposed are exactly pro-rata the forecast growth in the number of passengers between the 2019 base and the 2032 DM and DS. Therefore they can be agreed.

HA1/3
Table 6.5 – resulting daily trip numbers
These follow on logically from Table 6.4.
Tables 6.6 – 6.8 – resulting peak hourly passenger flows by mode.
n/a Peak hourly car driver trips forecast to change as follows:
Unlike the annual and daily totals, these figures do not follow on logically. The increases calculated in the AM peak are not consistent with the relative growth in passenger numbers and, in the PM peak there is a decrease between the 2019 Base and the 2032 DM scenario, with the total flows in the 2032 DS only 30% above the base, where the passenger numbers show an increase of 52%. No explanation is given for this discrepancy, and I cannot think of another factor in the calculations that would have resulted in these figures. These results therefore appear to be incorrect.
These arise from adoption of current and future passenger profiles directly from the ICF/STAL forecasts. The Passenger movements are reported at pages 13,28 and 43 of the Appendix A to the TAA (note these are at GMT so need a 1 hour shift for BST). The resultant landside passenger movements are also set in the TAA Appendix A, and relate to a 2 hour pre departure shift for trips to the airport and 1 hour lag for arriving passengers. For ease of comparison the 2019, 35mppa and 43mppa passenger profiles landside movements derived from the PAX profiles are provided below:
Time Band 2019 2032 35mppa 2032 43mppa
Arrivals Departures Total Arrivals Departures Total Arrivals Departures Total
00:00 0 4086 4086 0 3257 3257 0 3406 3406
01:00 0 880 880 0 1514 1514 0 1946 1946
02:00 0 0 0 0 535 535 0 550 550
03:00 0 0 0 289 261 550 159 292 451
04:00 4584 147 4730 4431 131 4562 4502 134 4636
05:00 4071 0 4071 4441 139 4581 5064 136 5200
06:00 4358 301 4659 4121 0 4121 4789 0 4789
07:00 1386 488 1874 2015 1222 3237 3018 872 3890
08:00 1140 2420 3560 1266 2468 3735 2362 2233 4595
09:00 1633 2832 4465 3075 2361 5436 3457 2786 6243
10:00 2165 680 2844 2895 1457 4352 3154 2638 5792
11:00 2633 1066 3699 3517 2253 5770 3496 3138 6634
12:00 1900 1892 3793 2850 2659 5508 4521 3517 8038
13:00 895 3358 4253 2664 3651 6315 3040 4158 7198
14:00 2330 1777 4107 3270 3305 6574 3672 4043 7715
15:00 2746 1227 3973 2844 2509 5353 3773 2984 6756
16:00 2925 2314 5239 3091 3508 6599 3804 4407 8211
17:00 3234 3005 6239 2713 2385 5099 3539 3111 6650
18:00 2175 2246 4421 3114 2471 5585 3702 3125 6827
19:00 143 2485 2629 1073 2586 3658 1723 3625 5347
20:00 174 3410 3584 276 3396 3672 1147 3675 4822
21:00 347 1182 1529 132 1584 1716 144 2394 2539
22:00 0 324 324 0 1766 1766 0 2698 2698
23:00 0 2719 2719 0 2659 2659 0 3198 3198
Total 38838 38838 77677 48077 48077 96154 59066 59066 118132
Agreed.
0700-0800
1700-1800
2019 Base
333 1,109
2032 DM 575 906 2032 DS 691 1,182
6.24 – 6.31 and Tables 6.9 – 6.14 Employee trip forecasts
The forecasts for employee growth are: 2016 Base: 11,600 employees; 2028 DM: 13,200 employees;
The forecasts for employee growth are: 2019 Base: 12,997 employees; 2032 DM: 13,300 employees; 2032 DS: 16,300 employees
The forecast employee numbers are broadly consistent with those in the TA, albeit no explanation is given in the TAA
The employee figures are taken directly from the economic section of the EA. The employment rates per passenger decrease with time due to efficiencies, more detail is provided in the economic chapter of the EA. Hence the 2019-2032 is only a modest increase despite passenger growth.
Agreed.

HA1/3
2028 DS: 16,200 employees
for the actual figures. Of note is the very low increase (403 employees) for growth from the 2019 Base to the 2032 DM where an increase of 24% in passengers results in an increase of only 3% in the workforce. This assumption should be justified. By contrast, the employee growth between the 2032 DM and 2032 DS scenarios is proportionate to the growth in air passengers.
6.25 – 6.26 & Table 6.10
These paragraphs explain that a further 10% mode shift away from employee car driver trips has been assumed, based on recent trends and commitments in the Travel Plan.
This appears to be a reasonable assumption and is consistent with the approach taken in the TA.
Table 6.11 Employee daily trips by mode
Table 6.11 translates the growth in the workforce and the anticipated mode shift over time into a daily forecast of employee trips by mode.
These follow on logically from Tables 6.9 & 6.10.
Tables 6.12 – 6.14 resulting peak hourly employee trips by mode
Peak hourly car driver trips forecast to change as follows:
0700-0800 1700-1800
2019 Base 385 564 2032 DM 328 483 2032 DS 401 589
These follow on logically from Table 6.11 and the 2019 Base figures cross check against Table 4.13.
6.32 and Tables 6.15 – 6.18 –
Peak hourly car driver trips forecast to change as follows:
0700-0800 1700-1800
These follow on logically from Tables 6.6-6.8 and
See response 6.6-6.8above Agreed

HA1/3
Combined Peak Hour Demand
2019 Base 717 1673 2032 DM 903 1388 2032 DS 1092 1771
6.12-6.14. However, as such the query relating to Tables 6.6-6.8 applies equally to the traffic flows in these tables and the resulting flows can’t be agreed until it is resolved.
7. Highway Impact
Table 7.1 TEMPRO factors
2019 – 2032: 1.1606 Calculations not provided. Not checked.
Input Factors as per TA- scale of change to 2032 from 2019 in TAA are very similar to the TA factors for 2017-2028, albeit starting from a later base
Superseded because modelling has used VISUM
Table 7.3 Air passenger vehicle trips by scenario by origin
2019 Base: 25,721 2032 DM: 31,840 2032 DS: 39,118.
I could not derive these numbers from the equivalent numbers in Table 6.5, which appear to be higher. Could this be explained, please?.
Table 6.5 is passenger demand Table 7.3 is vehicle movements that takes into account car occupancy and 2 way trips for taxi and kiss and fly
Clarification has been received Agreed.
Table 7.4 Directional split of air passenger vehicle trips
M11N: 29% M11S: 52% A120E: 13% A120W: 6%
Similar to TA. I understand that the A120E/W have been transposed and are going to be corrected.
Yes- amended figures now adopted and issued via a Erratum. Latest figures provided adopted for LInsig analysis and provided to Jacobs
Data has been provided and used in the modelling
Table 7.3 Employee vehicle trips by scenario by origin
2019 Base: 7,431 2032 DM: 6,810 2032 DS: 8,342.
These closely resemble those from Table 6.11, and Table 4.13 for car drivers and passengers combined.
Agreed
Table 7.6 Directional split of air passenger vehicle trips
M11N: 7% M11S: 23% A120E: 32% A120W: 13% Local roads: 25%
Query proportion to A120E and consistency with Table 4.11, which shows: E Herts: 25%; Uttlesford: 16%; Braintree, Chelmsford &
Distribution and assignment assumptions were set out in the TA and have not been changed. Detailed breakdown is at Appendix G1 (passengers) and G2 (Employees). Sensitivity modelling undertaken
Description Existing Layout Mitigation
35mppa with 2033 revised background traffic growth ✓
To be covered by distributional sensitivity tests. Agreed

HA1/3
Colchester (combined): 18%. This suggests a lower % to A120E and a higher % to A120W than adopted. Could this be explained, please?
43mppa with 2033 revised background traffic growth ✓ ✓
35mppa + 10% with 2033 revised background traffic growth ✓
43mppa + 10% with 2033 revised background traffic growth ✓ ✓
43mppa adjusted distribution (R1) with 2033 revised background traffic growth
✓
Figure 7.3 & Tables 7.7, 7.8, 7.9 & 7.11
Net impact of 2032 DS vs 2032DM on local network flows in the highway network peaks:
The overall (daily) increase in flows on Airport access, Thremhall Avenue (22%) is in proportion to the predicted increase in passenger numbers and vehicle flows. The AM peak increase is lower than this, and the PM higher. Could this relate to the discrepancy in peak hourly flows identified in Tables 6.6-6.8/ 6.16-6.17?
Thremhall and A120 weave is dominated by passenger traffic and the different AM and PM changes are directly related to the flight profile changes- Employee profiles change less and have greater impact on M11 J8 because of the local employee catchment to the west and hence similar AM and PM impacts
Agreed.
Thremhall Ave A120 weave M11 J8
0700-0800
13.3% 5.9% 4%
1700-1800
29.1% 13.3%
5%
Conclusion The key issue is, not the scale of percentage increase in flows, but whether the correct flows have been provided to the team running the junction capacity models. Whilst the overall methodology appears sound and benchmarks well against the approach taken in the TA, there are some specific examples of
Further clarification has been provided which has allowed us to gain confidence in the traffic modelling.

HA1/3
numbers of trips which need to be queried and these queries answered before we can be confident that the flows used in the modelling are soundly based and accurately calculated.

Appendix B

Stansted Airport 35+:
Planning Appeal
Traffic Modelling Tests
23 December 2020

Stansted Airport 35+ Planning Appeal
Traffic Modelling Tests
i \\ehche2fp000\Common$\9 Trans Impr\TP\(10) Projects 20-21\TRAS - B3553R9F\Stansted Vissim Review
Document Control Sheet
Document prepared by:
Chris Yeung Associate – Traffic Engineering
Transport Planning Victoria House Chelmsford CM1 1JR
E [email protected] W www.essex.gov.uk/highways
Record of Issue
Issue Status Author Date Check Date Review Date
1 Final EC 22/12/20 CY 23/12/20 MW 23/12/20
Approved for Issue By Date
Theunis Kruger 23/12/2020
Distribution
© Copyright 2020 Concepts and information contained in this document are the property of Jacobs/Ringway Jacobs. Use or copying of this document in whole or in part without the written permission of Jacobs constitutes an infringement of copyright. Limitation: This document has been prepared on behalf of, and for the exclusive use of Ringway Jacobs’ client, and is
subject to, and issued in accordance with, the provisions of the contract between Ringway Jacobs’ and the client.
Jacobs/Ringway Jacobs accepts no liability or responsibility whatsoever for, or in respect of, any use of, or reliance upon, this document by any third party.
Report Title Stansted Airport 35+ Planning Appeal – Traffic Modelling Tests
Project Number B3553R9F
Status Draft
Revision 1
Control Date 23/12/2020
Organisation Contact Number of Copies Katherine Wilkinson ECC 1 (by email)
David Sprunt ECC 1 (by email)
Mary Young ECC 1 (by email)
Jenny Jones ECC 1 (by email)

Stansted Airport 35+ Planning Appeal
Traffic Modelling Tests
ii
Contents 1 Introduction .................................................................................................. 1
2 Forecast growth and committed schemes ................................................... 3
3 Existing Layout Scenario Modelling ........................................................... 10
4 Mitigation Scenario Modelling .................................................................... 13
5 Sensitivity Tests ......................................................................................... 16
6 Conclusion and Recommendations ........................................................... 21
References ....................................................................................................... 23
Appendix A: New Passenger and Employment Trip Matrices from MAG ......... 24
Appendix B: New OD Matrices for Vissim ........................................................ 28
Appendix C: MAG’s Proposed Mitigation Measures ......................................... 31
Tables Table 1-1: Scenarios to be modelled .................................................................. 3 Table 2-1: Model simulation start time and period .............................................. 4 Table 2-2: Trip end growth factors for Stansted airport for 2033 used in WEEH model.................................................................................................................. 8 Table 3-1: Average Overall Network Statistics ................................................. 10 Table 3-2 : Mean Max. Queue Comparison (AM) ............................................. 11 Table 3-3 : Mean Max. Queue Comparison (PM) ............................................. 12 Table 4-1: M11 J8 Mitigation Measures............................................................ 13 Table 4-2 : Average Overall Network Statistics ................................................ 14 Table 4-3 : Mean Max. Queue Comparison (AM) ............................................. 15 Table 4-4 : Mean Max. Queue Comparison (PM) ............................................. 15 Table 5-1 : Network Performance from 10% Sensitivity Tests .......................... 17 Table 5-2 : 10% Sensitivity Test Queue Length Comparison (AM) .................. 18 Table 5-3 : 10% Sensitivity Test Queue Length Comparison (PM) .................. 18 Table 5-4 : Adjustment to Airport Trips Distribution .......................................... 19 Table 5-5 : Network Performance from Sensitivity Tests .................................. 20 Table 5-6 : Sensitivity Test Queue Length Comparison (AM)........................... 20 Table 5-7 : Sensitivity Test Queue Length Comparison (PM)........................... 21

Stansted Airport 35+ Planning Appeal
Traffic Modelling Tests
iii
Figures Figure 2-1: M11 J8 Base Model Extents............................................................. 5 Figure 2-2: Process to derive new Vissim OD trip matrices ................................ 7 Figure 3-1: Average Network Speed ................................................................ 10 Figure 4-1: Average Network Speed ................................................................ 14 Figure 5-1: Average Network Speed ................................................................ 17

Stansted Airport 35+ Planning Appeal
Traffic Modelling Tests
iv
Executive summary The Manchester Airport Group (MAG) submitted a planning application to Uttlesford District Council (UDC) in February 2018 which sought to raise the cap on the number of passengers per annum from 35 million (35mppa) to 43 million (43mppa). The airport’s application was, however, refused by the council’s
planning committee in January 2020. MAG is now preparing to appeal UDC’s
decision to block the expansion application and provide revised evidence to the planning inspectorate ahead of next year’s public inquiry. A material change following the original application has occurred since the UDC refusal, as an Interim Scheme at M11 Junction 8 (J8) has been put on hold, as its funding is now uncertain. Mitigation measures that were needed to accommodate the expansion to 43mppa were predicated on the delivery of the interim scheme. The revised evidence needs to take this material change into account, together with changes to the trajectory of airport growth due to the Covid-19 pandemic.
Consequently, Essex County Council’s (ECC) requested use of the existing Vissim microsimulation model of the strategic roads in the vicinity of M11 Junction 8 in order to support ECC and Highways England (HE) in assessing the transport implications of revisions by MAG to its traffic assessment.
Network performance was tested in 2033 using airport traffic forecasts provided by MAG’s consultant Steer and background traffic obtained from the West Essex and East Hertfordshire (WEEH) Local Plan Visum model. As there is not an adopted Local Plan for Uttlesford, a new version of the Visum model was developed, in which growth in Uttlesford is controlled to the National Trip End Model (NTEM). This approach is consistent with Steer’s traffic forecasting.
In Vissim, two scenarios were tested: an Existing Layout scenario where the network remains as existing (2020) and a Mitigation scenario which includes mitigation measures proposed by Steer. Sensitivity tests were also undertaken to assess the impact of increasing airport passenger traffic by an additional 10% and modifying the distribution of all airport traffic.
The network performance deteriorates significantly with the planned 35mppa airport growth while the 43mppa Mitigation scenario improves performance compared to the 35mppa Existing Layout scenario.
The most significant queueing is on the A120 westbound, particularly in the PM. This queue from M11 J8 extends back past Priory Wood Roundabout and beyond the westbound on-slip from the airport and prevents vehicles from the slip road from freely merging with the A120 westbound mainline. The Mitigation

Stansted Airport 35+ Planning Appeal
Traffic Modelling Tests
v
scenario reduces this queue in both time periods but only in the AM does it reduce it enough to allow the vehicles to freely merge.
A significant queue that forms as a result of the increase in passengers to 43mppa is on the M11 southbound off-slip approaching J8 in the PM. At this location queues in the left lane extending over 1.7km, exceeding the off-slip storage capacity and leading to queueing vehicles blocking back onto the M11 southbound mainline. This queue is reduced to 150m by the mitigation measures, well within the storage capacity.
Sensitivity tests appear to have little effect on the overall network statistics with average speeds remaining virtually unchanged. Furthermore, the Mitigation scenario appeared to be the least sensitive to the increase in traffic in terms of changes to queue lengths.
While the model does not include the local road network, concern about the B1256 junction to Bedlar’s Green is identified, at which there is a collision cluster and the potential for queues to tailback to the main J8 roundabout.
Stansted Airport 35+ Planning Appeal
Traffic Modelling Tests
1
1 Introduction 1.1 Background
The Manchester Airport Group (MAG) submitted a planning application to Uttlesford District Council (UDC) in February 2018 which sought to raise the cap on the number of passengers per annum from 35 million (35mppa) to 43 million (43mppa). The airport’s application was, however, refused by the council’s
planning committee in January 2020. MAG is now preparing to appeal UDC’s
decision to block the expansion application and provide revised evidence to the planning inspectorate ahead of next year’s public inquiry. A material change following the original application has occurred since the UDC refusal, as an Interim Scheme at Junction 8 has been put on hold, as its funding is now uncertain. Mitigation measures that were needed to accommodate the expansion to 43mppa were predicated on the delivery of the interim scheme. The revised evidence needs to take this material change into account, together with changes to the trajectory of airport growth due to the Covid-19 pandemic.
Consequently, Essex County Council’s (ECC) requested use of an existing Vissim microsimulation model of the strategic roads in the vicinity of M11 Junction 8 (J8) in order to support ECC and Highways England (HE) in assessing the transport implications of revisions by MAG to its traffic assessment.
This assessment draws on work undertaken in 2018, which included a technical review of the Transport Assessment (TA) submitted as part of this planning application, followed by sensitivity testing and option assessment using the M11 J8 Vissim microsimulation traffic model. The sensitivity tests were around the level of traffic growth in the context of wider growth expected in the emerging Local Plans and the impact on the highway network to ensure the assessment of the airport expansion was reasonable.
In this report the existing Vissim model was used to assess the impact of the revised airport growth on two network configurations: the existing layout (Existing Layout scenario) and the existing layout with mitigation measures identified by Steer (Mitigation scenario). Sensitivity testing and stress testing was also undertaken in order to help to identify robust potential mitigation measures at M11 J8 to satisfactorily accommodate future demand.
The trip matrices associated with 35mppa and 43mppa airport growth (plus sensitivity tests) were provided by Steer and the background traffic was obtained from the West Essex and East Hertfordshire (WEEH) Local Plan

Stansted Airport 35+ Planning Appeal
Traffic Modelling Tests
2
Visum model. However, given that there is not an adopted Local Plan for Uttlesford, a new version of the Visum model was developed, in which growth in Uttlesford is controlled to the National Trip End Model (NTEM) rather than its previously proposed Local Plan which was judged unsound by the planning inspectorate in 2020. This approach is consistent with Steer’s traffic forecasting.
It should be noted that the Vissim model is solely for the purpose of assessing strategic traffic movement and junction interactions and does not include local roads in the area.
1.2 Purpose The purpose of this report is to describe the outcomes of Vissim modelling to assess the implications of the mitigation measures for 43mppa in 2033 with revised background traffic growth where growth in Uttlesford is controlled to NTEM.
It also compares 43mppa findings to a situation with a traffic forecasts based on 35mppa without mitigations. This recognises that Stansted Airport has planning permission to grow to 35mppa; and the current planning application needs only to consider implications and mitigation measures required between 35mppa and 43mppa.
Finally, this report details sensitivity testing to test the robustness of mitigation measures.
The report seeks to improve confidence of the various highway authorities with respect to the robustness of the mitigation measures proposed. Its findings will be used to inform the highways planning response of ECC, Hertfordshire County Council and Highways England to MAG’s planning application.
1.3 Approach In 2033, it is no longer assumed that ECC’s interim scheme at J8 will be
implemented. Therefore, two network configurations were tested for AM and PM peak hours:
• Existing Layout scenario – The network as it is in 2020 and excludes any previously proposed future schemes.
• Mitigation scenario – Includes mitigations proposed by Steer as detailed in Section 4.1.
The Existing Layout scenarios were run for both 35mppa and 43mppa passenger forecasts while the Mitigation scenarios were run for 43mppa

Stansted Airport 35+ Planning Appeal
Traffic Modelling Tests
3
passenger growth only. In all scenarios, background traffic growth is the same and is based on a revised 2033 East Hertfordshire (WEEH) Local Plan Visum model where growth in Uttlesford is controlled to NTEM.
Additionally, sensitivity tests were undertaken for all scenarios based on increasing the volume of airport passenger trips by 10% and, for 43mppa, adjusting the trip distribution.
Table 1-1 below sets out the tests that were run.
Table 1-1: Scenarios to be modelled
Description Existing Layout Mitigation
35mppa with 2033 revised background traffic growth ✓ 43mppa with 2033 revised background traffic growth ✓ ✓
35mppa + 10% with 2033 revised background traffic growth
✓
43mppa + 10% with 2033 revised background traffic growth
✓ ✓
43mppa adjusted distribution (R1) with 2033 revised background traffic growth
✓
The following sections describe how the growth forecasts were identified and the measures in the Existing Layout and Mitigation scenarios and provides the findings of the assessment using Vissim.
2 Forecast growth and committed schemes 2.1 2014 Base Vissim Model
A calibrated and validated Base Vissim model was produced for the weekday AM and PM peak hour scenarios. As far as practically possible, the model was built to the standards set out in the Department for Transport’s (DfT) Transport Appraisal Guidance (TAG) and in IAN 36/01. These provide details on the acceptable differences between modelled and observed flows and the differences between modelled and observed journey times. Following these guidelines ensures that the model is more likely to be suitable to assess future scenarios.

Stansted Airport 35+ Planning Appeal
Traffic Modelling Tests
4
The calibration and validation of the 2014 Base Model is summarised in the M11 Junction 8 Vissim Model – LMVR technical note.
The model simulation start time and simulation periods, selected with reference to the peak traffic volume on the network are shown in Table 2-1. Table 2-1: Model simulation start time and period
Simulation Start Time Simulation period Model Period
Weekday AM Peak 06:45 5400s 07:00 to 08:00
Weekday PM Peak 16:45 5400s 17:00 to 18:00
Both modelled periods include a 15-minute warm-up period to ensure traffic levels within the network are representative at the beginning of the peak period and a 15-minute cool down period.
Three vehicle types have been used in the model. These are Light vehicles (Cars and LGV), Heavy vehicles (OGV1 and OGV2) and Buses (local buses and airport coaches).
The 2014 Base Vissim model was developed using traffic survey data collected mainly in July 2014, which included: • 12 Automatic Number Plate Recognition (ANPR) survey locations on a
cordon around M11 J7 and J8 between 05:00 and 21:00 on Tuesday 15th July 2014;
• Manual Classified Counts (MCC) at the cordons of the ANPR survey; and
• Automatic Traffic Counts (ATC) at A120 / Airport Access Road junctions. The study area covered by the Vissim model is shown in Figure 2-1. It includes all areas of the M11 J8 interchange, sections of the motorway leading to the interchange and the section of the A120 from the A1250 Dunmow Road/ Birchanger Green Roundabout to the overbridge of the A120 at Parsonage Road, east of airport Southgate access.

Stansted Airport 35+ Planning Appeal
Traffic Modelling Tests
5
Figure 2-1: M11 J8 Base Model Extents
The model zone system takes account of the ANPR cordon and acts as the loading points for all traffic in the network.
2014 base year Origin - Destination (OD) matrices for Light and Heavy vehicles were produced for each peak hour using the turning proportions from the ANPR data along with a matrix furnessing process to ensure that the fully observed inbound and outbound flow volumes from the MCC are reflected in the matrices.
The airport and its trips are represented by Zones G, H and I in Figure 2-1. Although it should be recognised that at these locations there is non-airport related employment traffic and some local non-airport traffic using the local road network.
It should be noted that the airport junctions on the periphery of the Vissim model, i.e. the Southgate/Mid-stay car park junction by zone I, the
Stansted Airport 35+ Planning Appeal
Traffic Modelling Tests
6
Bassingbourn and Round Coppice roundabouts by zones H and G, are included in the model as purely proxy junctions. Their flows and delays have not, therefore, been validated against observed data. The B1256 Bedlars Green junction is also outside the modelled area.
2.2 2033 Forecast Model In order to develop the forecast flow, growth between the 2014 and 2033 needs to be identified at each of the cordon points. Furthermore, this growth needs to be disaggregated by airport passenger trips, airport related employment trips and non-airport related employment trips. In this way it was possible to separate out any non-airport related employment growth expected in Uttlesford..
It is also necessary to identify how the trips are distributed, i.e. when trips enter the Vissim network at a particular origin zone to which destination zones are the trips distributed in order to exit the network. Hence, when the new growth in airport related trips is tested, as important as the growth in trips can be the distribution of trips. For example, large growth in trips through a junction comfortably within its design capacity could have minimal impact on network performance; yet a small growth in trips via a junction operating at capacity could have significant performance implications.
Once the growth and distribution of trips between 2014 and 2033 are identified for the different groups of trips of interest, which are set out in OD matrices, these matrices are added to 2014 base OD matrix. On rare occasions (affecting less than 4% of total O-D pairs and less than 0.5% of 2014 trips) where this results in a negative value, growth is instead applied as a factor. The process is repeated for AM and PM time periods.
Figure 2-1 shows the steps which were followed to obtain the appropriately disaggregated growth and distribution information; and then combined it to produce the required OD matrices for the scenarios to be test in Vissim. The subsections below present further details and discuss further adjustments for the sensitivity tests.

Stansted Airport 35+ Planning Appeal
Traffic Modelling Tests
7
Figure 2-2: Process to derive new Vissim OD trip matrices
2.2.1 Using the Local Plan Visum model to produce the previous OD Vissim matrices
The OD forecast matrix in the J8 Vissim model was obtained from the West Essex and East Hertfordshire (WEEH strategic transport model), created using PTV’s Visum software with a base year of 2014 – sometimes referred to as the Harlow transport model as it has been primarily used to test scenarios in the wider Harlow area.
The WEEH strategic model was created to assist with the evaluation of the proposed new M11 junction 7a (J7A) and the scale of development to be

Stansted Airport 35+ Planning Appeal
Traffic Modelling Tests
8
delivered as part of the emerging WEEH Local Plans. The WEEH model includes an emerging Local Plan forecast scenario for 2033, which identifies and assigns trips related to the Local Plans development growth. Across the WEEH districts approximately 50,000 additional dwellings and 40,000 new jobs are forecast. The WEEH Local Plan model includes committed highway improvements, notably the planned improvement of J7A.
As it is no longer expected that the Uttlesford local plan developments will be implemented, the 2033 WEEH Local Plan Visum model was modified to remove the trips associated with Uttlesford local plan and instead apply the standard NETM growth to account for growth in this area.
The WEEH strategic model also includes specific assumptions for growth in passenger numbers at Stansted airport, using peak hour factors which were obtained from MAG. The WEEH model, however, only considers growth up to 35mppa. Within the strategic model, Stansted Airport is represented by model zones 91 and 92, which cover the east and west sides of Stansted respectively. The airport trip weekday peak period growth factors used between the 2014 and 2033 are set out in the table below.
Table 2-2: Trip end growth factors for Stansted airport for 2033 used in WEEH
model
Time period Model zone 91 Model zone 92
AM 1.33 1.39
PM 1.47 1.47
The distribution of airport trips in the Visum model is consistent with information provided via MAG’s transport consultant Steer in 2016. However, the distribution is likely to be coarser and less representative than more recent projections developed by Steer which underpin the TA.
As shown in the flow diagram in Figure 2-2, the Visum model was cordoned to identify the growth and distribution of trips to and from the zones in the Vissim model between 2014 and 2033. This was then added to the 2014 base Vissim base matrix.
2.2.2 New 2033 forecast OD matrix for 35mppa
In order to produce the new 2033 forecast matrix all growth between 2014 and 2033 to and from zones G, H and I was removed. In the main this included:
• Airport passenger trips • Airport related employment trips

Stansted Airport 35+ Planning Appeal
Traffic Modelling Tests
9
• Non airport employment trips
There is also likely to be a few trips on the local road network to other destinations; however, these are not considered to significantly influence the findings.
Steer subsequently provided updated trip projections and distribution information compatible with the Vissim matrix structure for:
• Passenger trips equivalent to 35mppa • Airport related employment trips equivalent to 35mppa and non-airport
related employment trips consistent with Local Plan growth
The new passenger and employment information was added to the revised version of the 2033 Local Plan matrix with growth to and from zones G, H and I deducted. The airport passenger and employment trip matrices from Steer are shown in Appendix A. The final matrices are shown in Appendix B.
Steer also provided a 2033 35mppa matrix with 10% more passenger trips for use in sensitivity tests.
2.2.3 New 2033 forecast OD matrix for 43mppa
The same process was followed for 43mppa as with 35mppa. Again, airport passenger and employee forecasts were provided by Steer as shown in Appendix A and which were added to the same background traffic as 35mppa resulting in the final matrices shown in Appendix B. No further non-airport employment growth was added to the matrices for 43mppa as the committed non-airport employment growth are expected to remain the same as 35mppa.
As with the 35mppa, Steer also provided a 2033 43mppa matrix with 10% more passenger trips for use in sensitivity tests.
2.3 Existing Layout Scenario Network The Existing Layout scenario network is as per the existing (2020) layout. The model includes recent improvements to the highway network and was checked against the observations from Steer’s site visit in October 2020. The model was also checked and updated to match three instances where driver behaviour does not match the lane markings on the Birchanger Green roundabout (M11 J8):
• On the northern overbridge where the middle lane is marked as ahead only but vehicles in this lane turn right towards the M11 southbound.

Stansted Airport 35+ Planning Appeal
Traffic Modelling Tests
10
• On the M11 southbound off-slip where lane 3 is marked as B1256 only but is also used by A120 west and services vehicles.
• On the inner-eastern circulating arm where lane 2 is marked as A120 West and Services only but is also used by M11 southbound on-slip traffic.
3 Existing Layout Scenario Modelling 3.1 Network Performance
This section compares the model outputs of the Existing Layout network with both 35mppa and 43mppa demand. This provides a general understanding of the likely effect of the airport on the road network in the vicinity of J8 and helps to identify where mitigation is required.
Table 3-1 summarises the key network statistics across the entire Vissim model network for the 2014 base, 2033 with 35mppa and 2033 with airport expansion to 43mppa.
Table 3-1: Average Overall Network Statistics
The average network speeds presented in Figure 3-1 show the differences in overall operational performance of the three scenarios.
Figure 3-1: Average Network Speed
AM PM AM PM AM PMTotal No. Arrived Vehicles 11629 12521 14414 15136 14860 15422Total Delay (hr) 183 173 932 1445 865 1577Average Speed (mph) 46 47 28 22 29 21Average Delay (Secs) 53 47 199 288 182 308Latent demand (number of vehicles) 2 0 528 2023 583 2484
Network Statistics 2014 Base2033 Existing Layout with
35MPPA
2033 Existing Layout with
43MPPA
46
2829
47
2221
0
5
10
15
20
25
30
35
40
45
50
2014 Base 2033 Existing Layout with 35MPPA 2033 Existing Layout with 43MPPA
Ave
rage
Sp
ee
d (m
ph
)
Network Average Speed
AM PM

Stansted Airport 35+ Planning Appeal
Traffic Modelling Tests
11
Compared with the 2014 base situation, the results in Table 3-1 show significant deterioration of network performance by 2033 with or without expansion of the airport beyond 35mppa. The average vehicle speeds across the entire modelled network are likely to drop by 39% in the AM and 53% in the PM when comparing the 2014 base scenario with the 35mppa Existing Layout scenario.
The network performance with 43mppa deteriorates somewhat in the PM with the average network speed reducing to 21mph and the number of vehicles unable to deploy in the network due to queues on the entry links (latent demand) increasing by around 23%. In the AM however, although there is an overall increase in airport traffic, redistribution of the traffic results in a reduction from A120 Thremhall Avenue which results in significantly less queueing along the A120 westbound and in increase in average speed across the network from 28mph to 29mph.
The mean maximum queues are shown for the Existing Layout scenarios for 35mppa and 43mppa Table 3-2 and Table 3-3. Mean maximum queues are calculated as the average of the maximum queue recorded in each five-minute interval throughout the modelled period.
Table 3-2 : Mean Max. Queue Comparison (AM)
2033 Existing
Layout 35MPPA
2033 Existing Layout
43MPPA
Average Queue (m) Average Queue (m)
499 537
211 357
42 95
665 634
86 79
187 206
57 57
579 575
117 153
105 102
7 8
58 81
1505 1222
137 163
Location / Movement
M11 NB Off Slip
M11 SB Off Slip Left
A120 WB
M11 Junction 8
A120/A1250 Roundabout
Priory Wood Roundabout
Services Exit
Round Coppice Road
M11 SB Off Slip Straight
B1256 WB
A120 EB
A1250 NB
A120 EB
A120 WB
Birchanger Lane
Thremhall Ave A120 EB
Thremhall Ave A120 WB

Stansted Airport 35+ Planning Appeal
Traffic Modelling Tests
12
Table 3-3 : Mean Max. Queue Comparison (PM)
The most significant queue is the A120 westbound queue. This queue, from M11 J8, extends back past Priory Wood roundabout, beyond the westbound on-slip from the airport, preventing vehicles from the slip road from freely merging with the A120 westbound mainline. The exception to this is the 43mppa AM period where the average maximum queue almost reaches the slip road but does not pass it.
The congestion and queueing on the westbound approach to the Priory Wood roundabout is a result of the new traffic signals on this approach and exit blocking from the A120 Westbound approach at J8. This extends into the A120 mainline and can block the mainline movement and also increases delays to traffic travelling to M11 southbound via J8a.
Also, in the 43mppa PM there is a significant increase in queueing on the M11 southbound off-slip approaching J8 with queues in the left lane extending over 1.7km. This exceeds the off-slip storage capacity leading to queueing vehicles blocking back onto the M11 southbound mainline.
2033 Existing Layout
35MPPA
2033 Existing Layout
43MPPA
Average Queue (m) Average Queue (m)
990 975
859 1779
530 1080
730 731
400 393
155 191
48 51
699 700
27 37
93 81
4 5
43 41
2133 2298
239 239
Services Exit
Birchanger Lane
Thremhall Ave A120 EB
Thremhall Ave A120 WB
Round Coppice Road
M11 SB Off Slip Straight
Location / Movement
M11 NB Off Slip
M11 SB Off Slip Left
A120 WB
B1256 WB
A120 EB
A1250 NB
A120 EB
A120 WB
A120/A1250 Roundabout
M11 Junction 8
Priory Wood Roundabout

Stansted Airport 35+ Planning Appeal
Traffic Modelling Tests
13
4 Mitigation Scenario Modelling 4.1 M11 J8 Mitigation Measures
As short-term improvements previously proposed by ECC are no longer expected to proceed, new mitigation measures are required. The new measures were provided by Steer and are listed in Table 4-1 with Steer’s scheme drawing included in Appendix C.
Table 4-1: M11 J8 Mitigation Measures
Location Summary
MSA Access - Add an extra lane to the service station exit - Remove one lane to the service station entry
A120 West - Extension of flare for left lane - Allow left lane to go ahead into the circulating
carriageway
M11 southbound off-slip - Add an extra lane joining the three lanes of the inner circulating carriageway
- Extension of flare and lengthening of lanes 1 and 2 on approach to the stop line
- Formalise the right turn from the centre lane of the circulating carriageway
A120 East - Allow the left lane of Thremhall Ave to operate as an ahead and left movement, joining the existing outside lane of the circulating carriageway
M11 southbound on-slip - Make the left lane of the outer circulating carriageway ahead and left, making the entrance to the M11 overbridge 3 lanes instead of the current 2, to include localised carriageway widening.
- Formalise exiting to the on-slip from the middle lane of the inner-circulating carriageway
M11 northbound off-slip - Add an extra lane from with dedicated access into services station
4.2 Mitigation Measures Network Performance This section compares the model outputs of the Mitigation scenario network with 43mppa demand.
Table 4-2 summarises the key network statistics for the Mitigation scenario alongside the previously introduced 2014 Base, 2033 with 35mppa and 2033 with airport expansion to 43mppa.

Stansted Airport 35+ Planning Appeal
Traffic Modelling Tests
14
Table 4-2 : Average Overall Network Statistics
The average network speeds presented in Figure 4-1 show the differences in overall operational performance of the Mitigation scenario alongside the three other scenarios.
Figure 4-1: Average Network Speed
The results show the mitigation measures improve the network performance when compared with the 35mppa Existing Layout scenario. Compared with 35mppa, the mitigations result in an increase to the network’s average speed of 4mph in both the AM and PM and a decrease in overall delay of 23% and 18% in the AM and PM respectively. Although latent demand increases by 158 vehicles in the AM compared with the 35mppa scenario, the total number of vehicles able to complete their journeys increases by around 300 to 1,000 vehicles when compared to the 43mppa Existing Layout scenario.
The mean maximum queues are shown for the scenarios are shown in Table 4-3 and Table 4-4.
AM PM AM PM AM PM AM PMTotal No. Arrived Vehicles 11629 12521 14414 15136 14860 15422 15157 16464Total Delay (hr) 183 173 932 1445 865 1577 713 1190Average Speed (mph) 46 47 28 22 29 21 32 26Average Delay (Secs) 53 47 199 288 182 308 151 225Latent demand (number of vehicles) 2 0 528 2023 583 2484 686 1831
Network Statistics 2014 Base2033 Existing Layout with
35MPPA
2033 Existing Layout with
43MPPA
2033 Mitigation with 43MPPA
46
2829
32
47
2221
26
0
5
10
15
20
25
30
35
40
45
50
2014 Base 2033 Existing Layout with 35MPPA 2033 Existing Layout with 43MPPA 2033 Mitigation with 43MPPA
Ave
rage
Sp
ee
d (m
ph
)
Network Average Speed
AM PM

Stansted Airport 35+ Planning Appeal
Traffic Modelling Tests
15
Table 4-3 : Mean Max. Queue Comparison (AM)
Table 4-4 : Mean Max. Queue Comparison (PM)
2033 Existing
Layout 35MPPA
2033 Existing Layout
43MPPA
2033 Mitigation
43MPPA
Average Queue (m) Average Queue (m) Average Queue (m)
499 537 279
211 357 230
42 95 27
665 634 552
86 79 214
187 206 100
57 57 33
579 575 613
117 153 74
105 102 137
7 8 7
58 81 60
1505 1222 776
137 163 229
Location / Movement
M11 NB Off Slip
M11 SB Off Slip Left
A120 WB
M11 Junction 8
A120/A1250 Roundabout
Priory Wood Roundabout
Services Exit
Round Coppice Road
M11 SB Off Slip Straight
B1256 WB
A120 EB
A1250 NB
A120 EB
A120 WB
Birchanger Lane
Thremhall Ave A120 EB
Thremhall Ave A120 WB
2033 Existing Layout
35MPPA
2033 Existing Layout
43MPPA
2033 Mitigation
43MPPA
Average Queue (m) Average Queue (m) Average Queue (m)
990 975 792
859 1779 150
530 1080 65
730 731 667
400 393 574
155 191 234
48 51 32
699 700 700
27 37 243
93 81 60
4 5 7
43 41 43
2133 2298 1612
239 239 239Round Coppice Road
M11 SB Off Slip Straight
Location / Movement
M11 NB Off Slip
M11 SB Off Slip Left
A120 WB
B1256 WB
A120 EB
A1250 NB
A120 EB
A120 WB
A120/A1250 Roundabout
M11 Junction 8
Priory Wood Roundabout
Services exit
Birchanger Lane
Thremhall Ave A120 EB
Thremhall Ave A120 WB

Stansted Airport 35+ Planning Appeal
Traffic Modelling Tests
16
The mitigation measures significantly reduce the longest queues compared with the 35mppa Existing Layout scenario.
Queues on the A120 westbound approaching the Priory Wood roundabout are reduced from 1.5km to 0.77km in the AM and from 2.1km to 1.6km in the PM. This reduction means that in the AM the queue no longer extends to the slip road from the airport however in the PM it still would.
The long queues on the M11 southbound in the PM also reduce from a maximum of 859m down to a maximum of 150m, well within the storage capacity. Also, the M11 northbound which is close to the available storage capacity in the PM is also reduced by around 200m.
Conversely, the B1256 westbound approach to J8 shows increased queueing in both peaks as a result of the mitigations. This is the result of allowing the left lane of Thremhall Avenue to operate as an ahead and left movement, increasing upstream throughput and lane usage of the outside lane on the circulating carriageway which is likely to lead to an increase in exit blocking on the B1256 westbound approach.
As a result of the mitigations, queues along the A120 approaching the A120/A1250 roundabout increase somewhat in westbound direction in the AM (105m to 137m) and significantly in the eastbound direction in the PM (27m to 243m). This is a result of more westbound traffic getting through to the roundabout in the AM and due to blocking back from J8 in the PM as signal timings have been designed to manage and reduce blocking back from the northern overbridge.
Although not on the modelled Vissim network there is a junction on the B1256 to Bedlar’s Green opposite a petrol station, just to the east of J8. Traffic on the B1256 heading east from J8 wishing to turn right to Bedlar’s Green could cause
queuing back the J8 roundabout. Since this junction is not modelled, the potential network impacts of this right turn are not reported. Nevertheless, road accident analysis has shown that there is a collision cluster at the B1256 junction to Bedlar’s Green indicating a problem at this junction exists. While it is
recognised that no airport traffic would be likely to use this link, the proposed mitigations would be likely to adversely impact the B1256 traffic.
5 Sensitivity Tests As set out in the review of the original TA, sensitivity tests were recommended in order to explore variations to the input matrices in conjunction with the

Stansted Airport 35+ Planning Appeal
Traffic Modelling Tests
17
mitigation measures. These tests are to provide an indication of how sensitive the modelling is to changes in the demand inputs and distribution of trips.
5.1 Sensitivity Tests The following tests have been carried out to test the sensitivity to changes in traffic demand and distribution within the model.
1. 10% increase in Airport Trips
The first test was carried out with a 10% increase in airport-related traffic movements through the study network in 2033 for the 35mppa and 43mppa Existing Layout and Mitigation scenarios.
The results of the sensitivity test are set out in Table 5-1 to Table 5-3 and Figure 5-1.
Table 5-1 : Network Performance from 10% Sensitivity Tests
Figure 5-1: Average Network Speed
The increase in traffic has little effect on the overall network statistics. Average speeds are unchanged, and the remainder of network statistics change by less than 10%. The exception to this is latent demand in the PM for the Existing Layout 43mppa scenario which changes by 15%.
AM PM AM PM AM PM AM PM AM PM AM PMTotal No. Arrived Vehicles 14414 15136 14615 15230 14860 15422 14887 15400 15157 16464 15195 16485Total Delay (hr) 932 1445 921 1494 865 1577 913 1618 713 1190 763 1167Average Speed (mph) 28 22 28 22 29 21 29 21 32 26 32 26Average Delay (Secs) 199 288 195 296 182 308 190 316 151 225 160 221Latent demand (number of vehicles) 528 2023 559 2155 583 2484 604 2845 686 1831 731 1829
2033 Mitigation with 43MPPA +
10%Network Statistics
2033 Existing Layout with
35MPPA
2033 Existing Layout with
43MPPA
2033 Existing Layout with
35MPPA + 10%
2033 Mitigation with 43MPPA
2033 Existing Layout with
43MPPA + 10%
28 2829 29
3232
22 2221 21
26 26
0
5
10
15
20
25
30
35
2033 Existing Layout with 35MPPA 2033 Existing Layout with 35MPPA +10%
2033 Existing Layout with 43MPPA 2033 Existing Layout with 43MPPA +10%
2033 Mitigation with 43MPPA 2033 Mitigation with 43MPPA + 10%
Ave
rage
Sp
ee
d (m
ph
)
Network Average Speed
AM PM

Stansted Airport 35+ Planning Appeal
Traffic Modelling Tests
18
Table 5-2 : 10% Sensitivity Test Queue Length Comparison (AM)
Table 5-3 : 10% Sensitivity Test Queue Length Comparison (PM)
Queue length results suggest that the mitigation measures may be the least sensitive to the increase in traffic with as it has the smallest increase in queue lengths across both time periods, the greatest for this scenario being 94m on the A120 westbound approaching Priory Wood roundabout in the AM. The biggest increase in queue lengths as a result of the increase in traffic is in the 35mppa Existing Layout scenario (between 183m and 263m on the M11 southbound off-slip in the PM) followed by the 43mppa Existing Layout scenario (121m on the M11 northbound off-slip in the PM).
2. Adjustment to the Airport Trips Distribution
This test involves applying small adjustments to the distribution of the airport-related traffic movements to vary the proportion of airport traffic travelling through the Vissim model. This was based on a first principles analysis of passenger distribution (from Table 7.5) and employee distribution vehicle data
2033 Existing
Layout 35MPPA
2033 Existing Layout
35MPPA + 10%
2033 Existing Layout
43MPPA
2033 Existing Layout
43MPPA+10%
2033 Mitigation
43MPPA
2033 Mitigation
43MPPA+10%
Average Queue (m) Average Queue (m) Average Queue (m) Average Queue (m) Average Queue (m) Average Queue (m)
499 397 537 458 279 277
211 252 357 472 230 302
42 41 95 134 27 29
665 670 634 639 552 562
86 83 79 92 214 218
187 214 206 214 100 104
57 64 57 55 33 32
579 582 575 581 613 613
117 127 153 161 74 75
105 95 102 92 137 122
7 8 8 7 7 8
58 65 81 77 60 59
1505 1538 1222 1337 776 870
137 139 163 186 229 235
Location / Movement
M11 NB Off Slip
M11 SB Off Slip Left
A120 WB
M11 Junction 8
A120/A1250 Roundabout
Priory Wood Roundabout
Services Exit
Round Coppice Road
M11 SB Off Slip Straight
B1256 WB
A120 EB
A1250 NB
A120 EB
A120 WB
Birchanger Lane
Thremhall Ave A120 EB
Thremhall Ave A120 WB
2033 Existing Layout
35MPPA
2033 Existing Layout
35MPPA + 10%
2033 Existing Layout
43MPPA
2033 Existing Layout
43MPPA+10%
2033 Mitigation
43MPPA
2033 Mitigation
43MPPA+10%
Average Queue (m) Average Queue (m) Average Queue (m) Average Queue (m) Average Queue (m) Average Queue (m)
990 1020 975 1095 792 794
859 1123 1779 1884 150 158
530 713 1080 1110 65 55
730 732 731 730 667 639
400 475 393 373 574 479
155 152 191 209 234 243
48 51 51 52 32 32
699 700 700 699 700 699
27 39 37 78 243 266
93 93 81 71 60 66
4 5 5 6 7 7
43 40 41 42 43 44
2133 2235 2298 2292 1612 1556
239 239 239 239 239 238Round Coppice Road
M11 SB Off Slip Straight
Location / Movement
M11 NB Off Slip
M11 SB Off Slip Left
A120 WB
B1256 WB
A120 EB
A1250 NB
A120 EB
A120 WB
A120/A1250 Roundabout
M11 Junction 8
Priory Wood Roundabout
Services exit
Birchanger Lane
Thremhall Ave A120 EB
Thremhall Ave A120 WB

Stansted Airport 35+ Planning Appeal
Traffic Modelling Tests
19
(from Table 7.7) within the original TA. This analysis was undertaken by ECC and resulted in slight adjustments to airport trip distribution as set out in Table 5-4.
Table 5-4 : Adjustment to Airport Trips Distribution
Origin/ Destination Adjustment
M11 (S) -3%
M11 (N) -2%
A120 (W) +5%
A120 (E) 0%
The results of the sensitivity test on airport trip distribution are set out in Table 5-5 to Table 5-7 alongside Existing Layout and Mitigation scenarios.

Stansted Airport 35+ Planning Appeal
Traffic Modelling Tests
20
Table 5-5 : Network Performance from Sensitivity Tests
Table 5-6 : Sensitivity Test Queue Length Comparison (AM)
AM PM AM PM AM PM AM PMTotal No. Arrived Vehicles 14414 15136 14860 15422 15157 16464 15198 16285Total Delay (hr) 932 1445 865 1577 713 1190 744 1216Average Speed (mph) 28 22 29 21 32 26 32 26Average Delay (Secs) 199 288 182 308 151 225 157 232Latent demand (number of vehicles) 528 2023 583 2484 686 1831 797 2025
2033 Mitigation with 43MPPA + R1Network Statistics
2033 Existing Layout with
35MPPA
2033 Existing Layout with
43MPPA
2033 Mitigation with 43MPPA
2033 Existing
Layout 35MPPA
2033 Existing Layout
43MPPA
2033 Mitigation
43MPPA
2033 Mitigation
43MPPA R1
Average Queue (m) Average Queue (m) Average Queue (m) Average Queue (m)
499 537 279 312
211 357 230 223
42 95 27 27
665 634 552 546
86 79 214 234
187 206 100 88
57 57 33 34
579 575 613 628
117 153 74 44
105 102 137 157
7 8 7 7
58 81 60 59
1505 1222 776 847
137 163 229 234
Location / Movement
M11 NB Off Slip
M11 SB Off Slip Left
A120 WB
M11 Junction 8
A120/A1250 Roundabout
Priory Wood Roundabout
Services Exit
Round Coppice Road
M11 SB Off Slip Straight
B1256 WB
A120 EB
A1250 NB
A120 EB
A120 WB
Birchanger Lane
Thremhall Ave A120 EB
Thremhall Ave A120 WB

Stansted Airport 35+ Planning Appeal
Traffic Modelling Tests
21
Table 5-7 : Sensitivity Test Queue Length Comparison (PM)
Like the 10% test, the results indicate the network performance is similar with the adjusted distribution when compared with the 43mppa Mitigation scenario. All statistics change by 10% or less except for latent demand which increases from 686 to 797 in the AM (an increase of 16%) and 1831 to 2025 in the PM (a smaller increase of 11%). The network speeds remain the same in both time periods compared with the 43mppa Mitigation scenario.
The greatest increase in queueing compared with the 43mppa Mitigation scenario is on the A120 approaching Priory Wood roundabout in the westbound direction where the queue increases by up to 83m in the PM. This queue is still far shorter than without mitigation where it reached over 1.2km in the AM (around 0.85km with mitigation) and almost 2.3km in the PM (around 1.7km with mitigation). Changes in queue lengths at other locations are around 50m or less.
6 Conclusion and Recommendations This study has used the M11 J8 Vissim traffic model to test whether the highway mitigation measures proposed as part of the planning application to expand Stansted Airport from 35mppa to 43mppa will be sufficient in 2033 with the amended Local Plans growth in place. The interaction between junctions has also been considered, which is an added benefit of using Vissim compared to individual junction models.
2033 Existing Layout
35MPPA
2033 Existing Layout
43MPPA
2033 Mitigation
43MPPA
2033 Mitigation
43MPPA R1
Average Queue (m) Average Queue (m) Average Queue (m) Average Queue (m)
990 975 792 845
859 1779 150 109
530 1080 65 32
730 731 667 651
400 393 574 573
155 191 234 245
48 51 32 31
699 700 700 699
27 37 243 249
93 81 60 78
4 5 7 8
43 41 43 46
2133 2298 1612 1695
239 239 239 236
Services Exit
Birchanger Lane
Thremhall Ave A120 EB
Thremhall Ave A120 WB
Round Coppice Road
M11 SB Off Slip Straight
Location / Movement
M11 NB Off Slip
M11 SB Off Slip Left
A120 WB
B1256 WB
A120 EB
A1250 NB
A120 EB
A120 WB
A120/A1250 Roundabout
M11 Junction 8
Priory Wood Roundabout

Stansted Airport 35+ Planning Appeal
Traffic Modelling Tests
22
The scenarios tested were: an Existing Layout scenario where the network remains as existing (2020) and a Mitigation scenario which includes mitigation measures proposed by MAG’s consultant Steer. Sensitivity tests were also
undertaken to assess the impact of increasing airport passenger traffic by an additional 10% and modifying the distribution of airport traffic.
The modelling found that the network performance is due to deteriorate significantly with or without airport growth and the 43mppa Mitigation scenario improves network performance compared to the 35mppa Existing Layout scenario.
The most significant queueing identified was on the A120 westbound, particularly in the PM. The Mitigation scenario reduces this queue in both time periods but only in the AM does it reduce it enough to allow the vehicles to freely merge from the westbound on-slip from the airport. Another significant queue identified is on the M11 southbound off-slip approaching J8 in the PM of the 43mppa Existing Layout scenario. At this location queues in the left lane extend over 1.7km which exceeds the off-slip storage capacity and leads blocking back onto the M11 southbound mainline. The mitigation measures reduce this queue to 150m, well within the storage capacity.
Sensitivity tests appeared to have little effect on the overall network statistics with average speeds remaining virtually unchanged. Furthermore, the Mitigation scenario appeared to be the least sensitive to the increase in traffic in terms of changes to queue lengths.
Finally, concerns close to the modelled network have been identified. These include the B1256 junction to Bedlar’s Green, at which there is a collision cluster alongside potential for right turning traffic coming off the B1256 to cause queues to tailback to the J8 roundabout. In addition, there is potential for disruption and incidents at the Bassingbourn roundabout to cause knock-on effects back to the A120.

Stansted Airport 35+ Planning Appeal
Traffic Modelling Tests
23
References Essex Highways, 2018, “Review of Stansted TA – A Report for ECC”
EssexHighways, 2017, “M11 Junction 8 Vissim Model – LMVR”
Highways Agency, 2001, Interim Advice Note (IAN 36/01): The Use and Application of Microsimulation Traffic Models”

Stansted Airport 35+ Planning Appeal
Traffic Modelling Tests
24
Appendix A: New Passenger and Employment Trip Matrices from MAG In the report, these matrices are sometimes referred to as Steer’s matrices as they were provided by MAG’s transport consultant Steer.
Table A-1: AM new Airport Passenger & Employee Trip Matrix for 35mppa – all
vehicles
Table A-2: PM new Airport Passenger & Employee Trip Matrix for 35mppa – all
vehicles
Table A-3: AM new Airport Passenger & Employee Trip Matrix for 43mppa – all
vehicles
0700-0800 A B C D E F G H I J K TOTALA 0 0 0 0 0 0 14 466 0 0 0 481B 0 0 0 0 0 0 0 0 0 0 0 0C 0 0 0 0 0 0 0 9 0 0 0 9D 0 0 0 0 0 0 2 79 0 0 0 80E 0 0 0 0 0 0 0 0 0 0 0 0F 0 0 0 0 0 0 8 257 0 0 0 265G 11 0 0 1 0 6 0 19 0 0 0 37H 295 0 2 37 0 162 2 0 0 0 0 498I 0 0 0 0 0 0 0 0 0 73 0 73J 0 0 0 0 0 0 0 0 186 0 0 186K 0 0 0 0 0 0 0 0 0 0 0 0
TOTAL 305 0 2 38 0 168 26 831 186 73 0 1631
1700-1800 A B C D E F G H I J K TOTALA 0 0 0 0 0 0 20 549 0 0 0 569B 0 0 0 0 0 0 0 0 0 0 0 0C 0 0 0 0 0 0 0 0 0 0 0 0D 0 0 0 0 0 0 2 62 0 0 0 65E 0 0 0 0 0 0 0 0 0 0 0 0F 0 0 0 0 0 0 12 308 0 0 0 320G 19 0 0 2 0 11 0 2 0 0 0 33H 603 0 18 127 0 328 40 0 0 0 0 1115I 0 0 0 0 0 0 0 0 0 274 0 274J 0 0 0 0 0 0 0 0 136 0 0 136K 0 0 0 0 0 0 0 0 0 0 0 0
TOTAL 622 0 18 129 0 338 74 921 136 274 0 2513
0700-0800 A B C D E F G H I J K TOTALA 0 0 0 0 0 0 20 638 0 0 0 659B 0 0 0 0 0 0 0 0 0 0 0 0C 0 0 0 0 0 0 0 12 0 0 0 12D 0 0 0 0 0 0 2 104 0 0 0 106E 0 0 0 0 0 0 0 0 0 0 0 0F 0 0 0 0 0 0 11 353 0 0 0 365G 34 0 0 1 0 15 0 24 0 0 0 74H 270 0 3 37 0 116 3 0 0 0 0 428I 0 0 0 0 0 0 0 0 0 83 0 83J 0 0 0 0 0 0 0 0 245 0 0 245K 0 0 0 0 0 0 0 0 0 0 0 0
TOTAL 304 0 3 38 0 131 36 1131 245 83 0 1971

Stansted Airport 35+ Planning Appeal
Traffic Modelling Tests
25
Table A-4: PM new Airport Passenger & Employee Trip Matrix for 43mppa – all
vehicles
Table A-5: AM Committed Non-Airport Employment Trip Matrix for 35mppa and
43mppa – all vehicles
Table A-6: PM Committed Non-Airport Employment Trip Matrix for 35mppa and
43mppa – all vehicles
1700-1800 A B C D E F G H I J K TOTALA 0 0 0 0 0 0 27 715 0 0 0 742B 0 0 0 0 0 0 0 0 0 0 0 0C 0 0 0 0 0 0 0 1 0 0 0 1D 0 0 0 0 0 0 3 81 0 0 0 84E 0 0 0 0 0 0 0 0 0 0 0 0F 0 0 0 0 0 0 15 402 0 0 0 417G 25 0 0 3 0 14 0 2 0 0 0 44H 779 0 22 160 0 424 49 0 0 0 0 1433I 0 0 0 0 0 0 0 0 0 345 0 345J 0 0 0 0 0 0 0 0 177 0 0 177K 0 0 0 0 0 0 0 0 0 0 0 0
TOTAL 803 0 22 162 0 438 94 1201 177 345 0 3242
0700-0800 A B C D E F G H I J K TOTALA 0 0 0 0 0 0 70 0 0 0 0 70B 0 0 0 0 0 0 0 0 0 0 0 0C 0 0 0 0 0 0 21 0 0 0 0 21D 0 0 0 0 0 0 64 0 0 0 0 64E 0 0 0 0 0 0 0 0 0 0 0 0F 0 0 0 0 0 0 27 0 0 0 0 27G 32 0 10 29 0 13 0 0 0 42 0 126H 0 0 0 0 0 0 0 0 0 0 0 0I 0 0 0 0 0 0 0 0 0 0 0 0J 0 0 0 0 0 0 93 0 0 0 0 93K 0 0 0 0 0 0 0 0 0 0 0 0
TOTAL 32 0 10 29 0 13 276 0 0 42 0 403
1700-1800 A B C D E F G H I J K TOTALA 0 0 0 0 0 0 19 0 0 0 0 19B 0 0 0 0 0 0 0 0 0 0 0 0C 0 0 0 0 0 0 6 0 0 0 0 6D 0 0 0 0 0 0 18 0 0 0 0 18E 0 0 0 0 0 0 0 0 0 0 0 0F 0 0 0 0 0 0 8 0 0 0 0 8G 63 0 19 58 0 25 0 0 0 83 0 247H 0 0 0 0 0 0 0 0 0 0 0 0I 0 0 0 0 0 0 0 0 0 0 0 0J 0 0 0 0 0 0 25 0 0 0 0 25K 0 0 0 0 0 0 0 0 0 0 0 0
TOTAL 63 0 19 58 0 25 76 0 0 83 0 323

Stansted Airport 35+ Planning Appeal
Traffic Modelling Tests
26
Table A-7: AM new Airport Passenger & Employee Trip Matrix for 35mppa+10%
– all vehicles
Table A-8: PM new Airport Passenger & Employee Trip Matrix for 35mppa+10%
– all vehicles
Table A-9: AM new Airport Passenger & Employee Trip Matrix for 43mppa+10%
– all vehicles
0700-0800 A B C D E F G H I J K TOTALA 0 0 0 0 0 0 16 513 0 0 0 529B 0 0 0 0 0 0 0 0 0 0 0 0C 0 0 0 0 0 0 0 10 0 0 0 10D 0 0 0 0 0 0 2 87 0 0 0 88E 0 0 0 0 0 0 0 0 0 0 0 0F 0 0 0 0 0 0 9 283 0 0 0 292G 12 0 0 1 0 7 0 21 0 0 0 41H 324 0 3 41 0 178 2 0 0 0 0 548I 0 0 0 0 0 0 0 0 0 81 0 81J 0 0 0 0 0 0 0 0 205 0 0 205K 0 0 0 0 0 0 0 0 0 0 0 0
TOTAL 336 0 3 42 0 185 29 914 205 81 0 1794
1700-1800 A B C D E F G H I J K TOTALA 0 0 0 0 0 0 22 604 0 0 0 626B 0 0 0 0 0 0 0 0 0 0 0 0C 0 0 0 0 0 0 0 0 0 0 0 0D 0 0 0 0 0 0 3 68 0 0 0 71E 0 0 0 0 0 0 0 0 0 0 0 0F 0 0 0 0 0 0 13 339 0 0 0 352G 21 0 0 2 0 12 0 2 0 0 0 37H 664 0 19 139 0 360 44 0 0 0 0 1227I 0 0 0 0 0 0 0 0 0 302 0 302J 0 0 0 0 0 0 0 0 150 0 0 150K 0 0 0 0 0 0 0 0 0 0 0 0
TOTAL 684 0 19 142 0 372 82 1013 150 302 0 2764
0700-0800 A B C D E F G H I J K TOTALA 0 0 0 0 0 0 22 702 0 0 0 724B 0 0 0 0 0 0 0 0 0 0 0 0C 0 0 0 0 0 0 0 13 0 0 0 13D 0 0 0 0 0 0 3 115 0 0 0 117E 0 0 0 0 0 0 0 0 0 0 0 0F 0 0 0 0 0 0 13 389 0 0 0 401G 37 0 0 1 0 17 0 26 0 0 0 81H 297 0 3 41 0 128 3 0 0 0 0 471I 0 0 0 0 0 0 0 0 0 91 0 91J 0 0 0 0 0 0 0 0 269 0 0 269K 0 0 0 0 0 0 0 0 0 0 0 0
TOTAL 334 0 3 42 0 144 40 1244 269 91 0 2168

Stansted Airport 35+ Planning Appeal
Traffic Modelling Tests
27
Table A-10: PM new Airport Passenger & Employee Trip Matrix for
43mppa+10% – all vehicles
1700-1800 A B C D E F G H I J K TOTALA 0 0 0 0 0 0 29 787 0 0 0 816B 0 0 0 0 0 0 0 0 0 0 0 0C 0 0 0 0 0 0 0 1 0 0 0 1D 0 0 0 0 0 0 3 89 0 0 0 93E 0 0 0 0 0 0 0 0 0 0 0 0F 0 0 0 0 0 0 17 442 0 0 0 458G 27 0 0 3 0 15 0 2 0 0 0 48H 857 0 24 175 0 466 54 0 0 0 0 1576I 0 0 0 0 0 0 0 0 0 380 0 380J 0 0 0 0 0 0 0 0 195 0 0 195K 0 0 0 0 0 0 0 0 0 0 0 0
TOTAL 884 0 24 179 0 481 103 1321 195 380 0 3566

Stansted Airport 35+ Planning Appeal
Traffic Modelling Tests
28
Appendix B: New OD Matrices for Vissim In the report, these matrices are sometimes referred to as Steer’s matrices as
they were provided by MAG’s transport consultant Steer.
Table B-1: 2033 AM new OD matrix with 35mppa – all vehicles – with new
airport growth
Table B-2: 2033 PM new OD matrix with 35mppa – all vehicles – with new
airport growth
Table B-3: 2033 AM new OD matrix with 43mppa – all vehicles – with new
airport growth
A B C D E F G H I J K TOT
A 0 136 299 510 30 2069 190 841 0 545 49 4668
B 228 0 6 7 0 45 2 9 0 6 1 304
C 388 6 0 115 5 124 42 51 0 179 66 976
D 351 9 213 0 3 301 96 139 0 353 226 1691
E 26 1 29 7 0 11 2 3 0 10 4 93
F 1567 138 117 123 4 0 112 452 0 522 46 3082
G 267 1 14 36 0 26 0 29 0 62 7 443
H 741 2 32 71 1 236 22 0 0 0 12 1117
I 0 0 0 0 0 0 0 0 0 246 0 246
J 1168 18 265 331 12 789 184 0 549 0 65 3383
K 354 1 41 77 2 34 6 5 0 6 0 526
TOT 5090 313 1017 1278 57 3634 656 1530 549 1929 475 16528
A B C D E F G H I J K TOT
A 0 160 319 576 17 1865 159 982 0 1243 30 5352
B 121 0 19 29 1 134 13 48 0 16 11 392
C 327 11 0 134 18 22 17 73 0 340 139 1082
D 405 13 90 0 5 240 32 133 0 372 208 1497
E 20 0 0 7 0 3 0 2 0 6 3 41
F 2006 140 110 221 6 0 45 465 0 771 81 3844
G 221 11 45 99 2 95 0 62 0 232 23 788
H 1185 19 95 244 5 518 78 0 0 0 20 2164
I 0 0 0 0 0 0 0 0 0 669 0 669
J 727 21 167 264 10 368 106 0 375 1 38 2078
K 317 8 151 190 7 68 15 8 0 38 2 802
TOT 5327 384 994 1762 70 3312 466 1774 375 3687 556 18708
A B C D E F G H I J K TOT
A 0 136 299 510 30 2069 196 1013 0 545 49 4846
B 228 0 6 7 0 45 2 9 0 6 1 304
C 388 6 0 115 5 124 42 54 0 179 66 978
D 351 9 213 0 3 301 96 164 0 353 226 1717
E 26 1 29 7 0 11 2 3 0 10 4 93
F 1567 138 117 123 4 0 115 548 0 522 46 3181
G 291 1 14 36 0 36 0 34 0 62 7 480
H 716 2 33 71 1 190 22 0 0 0 12 1047
I 0 0 0 0 0 0 0 0 0 256 0 256
J 1168 18 265 331 12 789 184 0 608 0 65 3441
K 354 1 41 77 2 34 6 5 0 6 0 526
TOT 5088 313 1018 1278 57 3597 666 1830 608 1938 475 16868

Stansted Airport 35+ Planning Appeal
Traffic Modelling Tests
29
Table B-4: 2033 PM new OD matrix with 43mppa – all vehicles – with new
airport growth
Table B-5: 2033 AM new OD matrix with 35mppa+10% – all vehicles – with new
airport growth
Table B-6: 2033 PM new OD matrix with 35mppa+10% – all vehicles – with new
airport growth
A B C D E F G H I J K TOT
A 0 160 319 576 17 1865 166 1149 0 1243 30 5524
B 121 0 19 29 1 134 13 48 0 16 11 392
C 327 11 0 134 18 22 17 73 0 340 139 1082
D 405 13 90 0 5 240 32 152 0 372 208 1517
E 20 0 0 7 0 3 0 2 0 6 3 41
F 2006 140 110 221 6 0 48 559 0 771 81 3941
G 226 11 45 99 2 98 0 62 0 232 23 798
H 1360 19 99 276 5 614 88 0 0 0 20 2481
I 0 0 0 0 0 0 0 0 0 740 0 740
J 727 21 167 264 10 368 106 0 416 1 38 2119
K 317 8 151 190 7 68 15 8 0 38 2 802
TOT 5508 384 998 1796 70 3412 485 2053 416 3758 556 19437
A B C D E F G H I J K TOT
A 0 136 299 510 30 2069 189 779 0 545 49 4605
B 228 0 6 7 0 45 2 9 0 6 1 304
C 388 6 0 115 5 124 13 81 0 179 66 976
D 351 9 213 0 3 301 2 95 0 353 226 1553
E 26 1 29 7 0 11 2 3 0 10 4 93
F 1567 138 117 123 4 0 101 226 0 522 46 2844
G 409 1 4 5 0 12 0 35 0 30 3 499
H 560 2 33 21 1 73 64 0 0 0 8 762
I 0 0 0 0 0 0 0 0 0 183 0 183
J 1168 18 265 331 12 789 86 0 387 0 65 3122
K 354 1 41 77 2 34 8 8 0 6 0 531
TOT 5050 313 1008 1198 57 3456 467 1237 387 1833 468 15473
A B C D E F G H I J K TOT
A 0 160 319 576 17 1865 151 677 0 1243 30 5038
B 121 0 19 29 1 134 12 48 0 16 11 392
C 327 11 0 134 18 22 7 44 0 340 139 1042
D 405 13 90 0 5 240 20 101 0 372 208 1453
E 20 0 0 7 0 3 0 1 0 6 3 40
F 2006 140 110 221 6 0 37 150 0 771 81 3522
G 261 11 20 38 2 55 0 62 0 144 10 603
H 771 19 60 126 3 173 109 0 0 0 30 1291
I 0 0 0 0 0 0 0 0 0 336 0 336
J 727 21 167 264 10 368 78 0 249 1 38 1924
K 317 8 151 190 7 68 13 1 0 38 2 793
TOT 4954 384 935 1584 68 2928 427 1084 249 3267 553 16433

Stansted Airport 35+ Planning Appeal
Traffic Modelling Tests
30
Table B-7: 2033 AM new OD matrix with 43mppa+10% – all vehicles – with new
airport growth
Table B-8: 2033 PM new OD matrix with 43mppa+10% – all vehicles – with new
airport growth
A B C D E F G H I J K TOT
A 0 136 299 510 30 2069 189 779 0 545 49 4605
B 228 0 6 7 0 45 2 9 0 6 1 304
C 388 6 0 115 5 124 13 81 0 179 66 976
D 351 9 213 0 3 301 2 95 0 353 226 1553
E 26 1 29 7 0 11 2 3 0 10 4 93
F 1567 138 117 123 4 0 101 226 0 522 46 2844
G 409 1 4 5 0 12 0 35 0 30 3 499
H 560 2 33 21 1 73 64 0 0 0 8 762
I 0 0 0 0 0 0 0 0 0 183 0 183
J 1168 18 265 331 12 789 86 0 387 0 65 3122
K 354 1 41 77 2 34 8 8 0 6 0 531
TOT 5050 313 1008 1198 57 3456 467 1237 387 1833 468 15473
A B C D E F G H I J K TOT
A 0 160 319 576 17 1865 151 677 0 1243 30 5038
B 121 0 19 29 1 134 12 48 0 16 11 392
C 327 11 0 134 18 22 7 44 0 340 139 1042
D 405 13 90 0 5 240 20 101 0 372 208 1453
E 20 0 0 7 0 3 0 1 0 6 3 40
F 2006 140 110 221 6 0 37 150 0 771 81 3522
G 261 11 20 38 2 55 0 62 0 144 10 603
H 771 19 60 126 3 173 109 0 0 0 30 1291
I 0 0 0 0 0 0 0 0 0 336 0 336
J 727 21 167 264 10 368 78 0 249 1 38 1924
K 317 8 151 190 7 68 13 1 0 38 2 793
TOT 4954 384 935 1584 68 2928 427 1084 249 3267 553 16433

Stansted Airport 35+ Planning Appeal
Traffic Modelling Tests
31
Appendix C: MAG’s Proposed Mitigation Measures Provided as separate attachment.

P
8
9
.
6
1
8
9
.
6
1
8
9
.
2
5
8
9
.
2
4
8
8
.
3
7
8
8
.
4
0
8
8
.
5
5
8
8
.
5
5
8
8
.
2
0
8
8
.
1
6
8
8
.
4
9
8
8
.
4
5
P
P
P
P
P
P
T
C
A
IR
T
E
A
S
T
A
1
2
0
N
O
E
N
T
R
Y
SE
RV
B1256
W
ES
T
A120
A
120
W
ES
T
SE
RV
B1256
A
1
2
0
E
A
S
T
A
IR
T
A120
EA
ST
AIR
T
A120
EA
ST
AIR
T
A120
EA
ST
AIR
T
9
0
.4
3
9
0
.
1
2
9
0
.
0
4
90.45
90
.5
5
9
0
.5
2
9
0
.3
7
90.34
9
0
.3
5
9
0
.2
5
9
0
.2
5
9
0
.1
8
8
7
.
1
3
8
7
.
1
7
8
7
.
2
7
8
3
.
4
5
8
3
.
3
2
8
3
.
0
7
8
2
.
8
6
8
2
.
6
6
8
2
.
7
2
8
2
.
4
7
8
2
.
6
4
87.92
87.66
87.35
8
6
.
7
8
8
6
.
8
0
8
6
.8
2
8
7
.
0
2
8
7
.1
5
8
7
.
0
2
8
6
.
9
8
8
6
.
8
6
8
7
.
5
1
8
7
.
4
3
8
7
.
4
1
8
7
.
0
0
8
7
.
2
1
8
2
.
8
3
8
2
.
3
4
8
2
.
3
4
8
2
.
0
8
8
2
.
0
8
9
7
.
5
9
2
G
P
S
1
0
8
7
.
2
9
8
G
P
S
9
I
B
I
B
S
L
S
L
R
S
R
S
R
S
R
S
P
P
P
P
L
P
L
P
L
P
L
P
L
P
L
P
L
P
L
P
L
P
L
P
L
P
L
P
L
P
ST
OP
BU
S
C
L
E
A
R K
E
E
P
W
E
S
T
A
1
2
0
A
1
2
0
W
E
S
T
AIR
PO
RT
A120
EA
ST
E
X
IT
F
U
E
L
F
U
E
L
SE
RV
IC
ES
8
8
.
9
7
8
5
.
9
4
8
6
.
0
6
8
5
.
9
4
8
5
.
9
4
8
5
.
6
6
8
5
.
7
0
8
5
.0
1
8
8
.
0
2
8
7
.
9
9
8
8
.
2
0
8
8
.
0
5
8
6
.4
6
8
9
.0
6
8
9
.0
6
8
9
.1
1
8
8
.
9
2
8
8
.
9
1
8
9
.
0
6
8
9
.
0
9
8
9
.
1
8
8
7
.
7
9
8
7
.
7
6
8
7
.
8
4
8
6
.0
1
8
6
.0
1
8
6
.1
2
8
8
.
0
3
8
7
.
9
2
8
7
.
8
9
8
7
.
9
7
8
6
.
5
2
8
6
.
6
8
8
6
.
7
0
85.94
8
8
.9
9
85
.0
4
84
.7
8
84.43
84.09
83.73
83.71
83
.8
1
84.10
84
.4
2
84
.7
0
84.98
88.66
8
8
.8
0
8
8
.9
5
8
3
.
3
7
1
G
P
S
5
8
2
.
4
5
5
G
P
S
3
8
6
.
4
1
0
G
P
S
2
8
8
.
6
5
9
G
P
S
1
B
O
L
I
B
I
B
I
B
C
B
X
B
R
C
B
R
C
B
R
C
B
R
C
T
C
W
M
W
M
P
B
O
L
R
S
R
S
R
S
R
S
R
S
R
S
R
S
R
S
R
S
R
S
R
S
R
S
R
S
R
S
R
S
P
P
M
K
R
M
K
R
L
P
L
P
L
P
L
P
L
P
L
P
L
P
L
P
L
P
L
P
L
P
L
P
L
P
L
P
L
P
L
P
L
P
L
P
L
P
L
P
L
P
L
P
L
P
L
P
L
P
L
P
L
P
L
P
L
P
L
P
L
P
L
P
L
P
L
P
L
P
L
P
L
P
L
P
L
P
L
P
L
P
L
P
L
P
L
P
L
P
L
P
L
P
L
P
L
P
L
P
F
L
E
R
E
P
E
P
B
S
L
P
L
P
L
P
M
K
R
R
S
G
P
S
4
8
4
.
8
3
8
G
P
S
6
8
5
.
5
3
3
8
4
.
5
9
SE
RV
(W)
A120
W
ES
T
A120
SE
RV
(W)
A
1
2
0
A
120
A
120
(W)
(E)
T'K
ELE
Y
A120
T'K
ELE
Y
R
S
R
S
T
L
R
S
T
L
L
P
L
P
A120
W
ES
T
A
1
2
0
E
A
S
T
B
1
2
5
6
A
1
2
0
W
E
S
T
A
1
2
0
W
E
S
T
S
E
R
V
A
1
2
0
(W
)
S
E
R
V
A
120
B
1256
T
'K
E
LE
Y
SE
RV
A
1
2
0
W
E
S
T
E
A
S
T
T
'L
E
Y
M
1
1
N
O
R
T
H
A
1
2
0
W
E
S
T
M
1
1
N
O
R
T
H
A120
W
ES
T
M
11
NO
RT
H
M
11
NO
RT
H
SE
RV
T'LE
Y
B
1
2
5
6
B1256
A
1
2
0
B
IR
C
H
BIR
CH
T
'L
E
Y
B
IR
C
H
AIR
T
EA
ST
A120
AIR
T
EA
ST
A120
B1256
A
120
W
ES
T
SE
RV
AIR
T
EA
ST
A120
B1256
SE
RV
W
ES
T
A
120
A
120
W
ES
T
L
P
L
P
R
S
L
P
R
S
T'L
EY
R
S
M
1
1
N
O
R
T
H
S
E
R
V
M
1
1
N
O
R
T
H
A
1
2
0
W
E
S
T
S
E
R
V
M
1
1
S
O
U
T
H
A
1
2
0
E
A
S
T
A
IR
T
A
1
2
0
E
A
S
T
A
IR
T
M
1
1
S
O
U
T
H
S
E
R
V
A
120
E
A
S
T
A
IR
T A
120
E
A
S
T
A
IR
T
M
11
S
O
U
TH
S
E
R
V
B
1256
A120
EA
ST
AIR
T
A120
EA
ST
AIR
T
M11
SO
UT
H
SE
RV
B1256
M
11
S
O
U
TH
M
11
N
O
R
TH
A120
W
ES
T
A
120
W
E
S
T
M
11
N
O
R
TH
A
120
W
E
S
T
S
E
R
V
N
O
R
T
H
A
IR
T
M
11
M11
NO
RT
H
A120
WE
ST
SE
RV
AIR
T
M11
NO
RT
H
M11
NO
RT
H
A120
WE
ST
SE
RV
AIR
T
M11
NO
RT
H
B1256
M
1
1
S
O
U
T
HS
E
R
V
M
1
1
N
O
R
T
H
A
1
2
0
S
E
R
V
A
1
2
0
W
E
S
T
M
1
1
N
O
R
T
H
M
1
1
S
O
U
T
H
M
11
N
O
R
TH
M
11
NO
RT
H
M11
NORTH
M11
NORTH
A120
WEST
M11
NORTH
M11
SOUTH
M
1
1
N
O
R
T
H
A
1
2
0
W
E
S
T
S
E
R
V
A
IR
T
M
1
1
N
O
R
T
H
A120
WEST
SERV
M
1
1
N
O
R
T
H
M11
SOUTH
A
1
2
0
W
E
S
T
S
E
R
V
M
1
1
S
O
U
T
H
A
1
2
0
W
E
S
T
S
E
R
V
M
1
1
S
O
U
T
H
A
120
W
E
S
T
SE
R
V
M
11
SO
U
TH
A120
EAST
AIRT
A120
EAST
AIRT
M11
NO
RT
H
A120
WE
ST
SERV
M11
SOUTH
M11
NO
RT
H
A120
W
ES
T
SE
R
V
M
11
SO
U
TH
Project Title:
DATE
:CA
D RE
FERE
NCE
:
Rev.
REV DESCRIPTIONDATE APPCHKDES
Status:
Suitability
Client:
Drawing Title:
Scale:Size:A1
www.steergroup.com
Drawing No.
-
M11 JUNCTION 8 IMPROVEMENTS
GENERAL ARRANGEMENT
NTS
23003401-SDG-HGN-100-DR-D-00106
P1
FIT FOR INFORMATION
S0
P0 26NOV20 ORIGINAL ISSUE RKO JZC MSB
P1 02DEC20 LAYOUT UPDATED RKO JZC MSB
02/1
2/20
20P:
\Pro
ject
s\23
0\0\
34\0
1\CA
D\Dr
awin
gs\2
3003
401-
SDG-
HGN
-100
-DR-
D-00
106
- 106
N
NOTES:
1. THIS DRAWING IS BASED ON INFORMATION
PROVIDED BY RINGWAY JACOBS.
2. ALL DIMENSIONS IN METRES UNLESS
OTHERWISE STATED.
3. DO NOT SCALE FROM THIS DRAWING.
EXTENSION OF FLARE
AND LENGTHENING OF
NEARSIDE LANES ON
APPROACH TO STOP LANE
CARRIAGEWAY WIDENED
TO ACCOMMODATE
ADDITIONAL LANE
REASSIGNMENT OF NEARSIDE
LANE ON APPROACH AND WITHIN
CIRCULATORY CARRIAGEWAY
EXTENT OF ECC SCHEME
P1

Appendix C

Cost Estimate Junction 8- ECC interim Plus-Updated as per Agreed S106 plans- January 2021 [Summary]
STAL35+ECC Interim Plus Works: 23003401-SDG-HGN-100-DR-D-00104-P2
Dec 2020 prices
TOTALS
Jnt 8- East Circulatory M11 N/B on slip M11 S/B off Slip Priory Wood£159,006.00 £120,654.00 £77,718.00 £237,690.00
15% Traffic Management £182,856.90 £138,752.10 £89,375.70 £273,343.50 Applied to all works cost10% Preliminaries £201,142.59 £152,627.31 £98,313.27 £300,677.85 Applied to cost inc TM10% Design Fee £221,256.85 £167,890.04 £108,144.60 £330,745.64 Applied to cumulative cost 40% £309,759.59 £235,046.06 £151,402.44 £463,043.89 Applied to cost + fees (covers non itemised works = signal ducting- Safety audit requirements etc & commuted sums)
TOTAL COST OF SCHEME 2018 Prices £309,760 £235,046 £151,402 £463,044 £1,159,252
£322,513 £244,723 £157,636 £482,108 £1,206,980END
2020 Prices based on ONS Construction Output Index (113.8/109.3)
Contingency (inc Commuted sum)
Printed on 08/01/2021 at 16:44 Page 1 of 2

Cost Estimate Junction 8- ECC interim Plus-Updated as per Agreed S106 plans- January 2021 [Areas and rates]
[Insert client name or owner of spreadsheet][Insert project name][Insert filename or spreadsheet title]
[Insert heading here]
Item Quantity Unit Rate Price CommentsCosts from SPON'S 2016 unless otherwise stated
Series 200: Site Clearance All rates have been adjusted for 2.5% inflationTAKE UP/DOWN AND SET ASIDE FOR REUSE OR REMOVE TO STORE
Precast concrete kerbs and channels 12.5 m £8.28 £103.5Traffic Sign 2 nr £77.75 £155.5
£259.0Series 700: PavementsANTI-SKID SURFACING SYSTEM07.1606 Pavement Type 1 – Surface Course exceeding 35mm but not exceeding 50mm plus Binder
Course exceeding 60mm but not exceeding 100mm40 m2 £27.24 £1,089.7
BASE COURSE (250mm)07.0100 Ba1A AC 32 HDM base 40/60, 60mm thick in carriageway, hardshoulder or hardstrip 40 m2 £10.71 £428.3
07.0105 Extra Over for each additional 10mm thickness, up to 150mm 40 m2 £1.59 £1,208.0
BINDER COURSE (60mm)07.0420 Bi3H Hot Rolled Asphalt (HRA) 60/20 bin 40/60, 50mm thick in carriageway, hardshoulder or
hardstrip40 m2 £11.03 £441.1
07.0425 Extra Over for each additional 5mm thickness, up to 100mm 40 m2 £0.95 £75.9
SURFACE COURSE (45mm)07.0645 S1H Hot Rolled Asphalt (HRA), 35/14 F surf des PMB WTR 2 + PCC 14/20, 45mm thick in
carriageway, hardshoulder or hardstrip40 m2 £18.53 £741.3
£3,985.0Series 1100: Kerbs, Footways and Paved AreasKERBS, CHANNELS, EDGING, DRAINAGE
Pre-cast concrete kerbs laid straight or curved not exceeding 12m radius (150 x 305mm) 12.5 m £23.40 £292.5Pre-cast concrete quadrants (305 x 305 x 150mm) 1 nr £25.95 £26.0
£319.0Series 1200: Traffic Signs and Road Markings
Site Visit 1 nr £2,000.00 £2,000.0
£2,000.0ROAD MARKINGS
Arrows in reflectorised white (6.0m long double headed) 2 nr £51.60 £103.2Arrows in reflectorised white (6.0m long straight or turning) 3 nr £34.40 £103.2Letters or numerals in reflectorised white (2.0m high) 48 nr £13.76 £660.6Intermittent line in reflectorised white (100mm wide with 4.0m line and 2.0m gap) 500 m £0.96 £478.0
£1,346.0REFLECTING ROAD STUDS
100 x 100 mm square bi-directional reflecting road stud with amber corner cube reflectors1 nr £8.60 £8.6
TRAFFIC SIGNS12.0700 Take up or down and re-erect standard tubular steel sign post 168 mm diameter. 4 nr £123.70 £494.8
12.0140Retro-reflective, externally lit or non lit sign unit, rectangular shaped, exceeding 3.0 square metre but not exceeding 4.0 square metre, fix to existing posts or lighting columns.
2 nr £456.16 £912.3
£1,416.0Provisional sum for works to bridge structure (if detailed surveys prove that it is required)
Works to approach to Bridge Structure £150,000.00 £150,000.0
£150,000.0
Subtotal £159,006.0
Item Quantity Unit Rate Price Comments
Series 400: Road Restraint Systems (Vehicle and Pedestrian)BEAM SAFETY BARRIERS
Single sided open box beam 100 m £52.34 £5,234.2Long driven posts 50 m £56.53 £2,826.7
£8,061.0Series 1200: Traffic Signs and Road Markings
Site Visit 1 nr £2,000.00 £2,000.0
£2,000.0ROAD MARKINGS
Arrows in reflectorised white (6.0m long straight or turning) 3 nr £34.40 £103.2Continuous line in reflectorised white (100mm wide) 50 m £1.15 £57.3Intermittent line in reflectorised white (100mm wide with 4.0m line and 2.0m gap) 360 m £0.96 £344.2Ancillary line in reflectorised white (150mm wide in hatched areas) 80 m £1.09 £87.4
£593.0LIGHTING
New lighting columns 5 nr £2,000.00 £10,000.0
£10,000.0TRAFFIC SIGNALS
Signalisation of depot exit 2 nr £50,000.00 £100,000.0
£100,000.0
Subtotal £120,654.0
Item Quantity Unit Rate Price Comments
Series 200: Site ClearanceTAKE UP/DOWN AND SET ASIDE FOR REUSE OR REMOVE TO STORE
Precast concrete kerbs and channels 125 m £8.28 £1,034.9Traffic Sign 2 nr £77.75 £155.5Lighting column 2 nr £60.94 £121.9
£1,313.0
Series 400: Road Restraint Systems (Vehicle and Pedestrian)BEAM SAFETY BARRIERS
Single sided corrugated beam 150 m £35.71 £5,356.6Long driven posts 75 m £56.53 £4,240.1
£9,597.0Series 600: EarthworksEXCAVATION
General excavation of unacceptable material Class U1/U2 in cutting and other excavation 50 m3 £4.87 £243.7
Disposal of unacceptable material Class U1/U2 + tipping charges 50 m3 £38.20 £1,910.0
General excavation of acceptable material Class 5 A 50 m3 £4.87 £243.7
Disposal of acceptable material Class 5 A + tipping charges 50 m3 £38.20 £1,910.0
£4,308.0Series 700: PavementsANTI-SKID SURFACING SYSTEM
High friction surfacing 400 m2 £20.45 £8,178.1
07.1606 Pavement Type 1 – Surface Course exceeding 35mm but not exceeding 50mm plus Binder Course exceeding 60mm but not exceeding 100mm
400 m2 £27.24 £10,896.8
BASE COURSE (250mm)07.0100 Ba1A AC 32 HDM base 40/60, 60mm thick in carriageway, hardshoulder or hardstrip 400 m2 £10.71 £4,282.8
07.0105 Extra Over for each additional 10mm thickness, up to 150mm 400 m2 £1.59 £12,080.1
BINDER COURSE (60mm)07.0420 Bi3H Hot Rolled Asphalt (HRA) 60/20 bin 40/60, 50mm thick in carriageway, hardshoulder or
hardstrip400 m2 £11.03 £4,410.8
07.0425 Extra Over for each additional 5mm thickness, up to 100mm 400 m2 £0.95 £759.4
SURFACE COURSE (45mm)07.0645 S1H Hot Rolled Asphalt (HRA), 35/14 F surf des PMB WTR 2 + PCC 14/20, 45mm thick in
carriageway, hardshoulder or hardstrip400 m2 £18.53 £7,413.2
£48,022.0Series 1100: Kerbs, Footways and Paved AreasKERBS, CHANNELS, EDGING, DRAINAGE
Pre-cast concrete kerbs laid straight or curved not exceeding 12m radius (150 x 305mm) 125 m £23.40 £2,924.7
£2,925.0Series 1200: Traffic Signs and Road Markings
Site Visit 1 nr £2,000.00 £2,000.0
£2,000.0ROAD MARKINGS
Intermittent line in reflectorised white (200mm wide with 1.0m line and 1.0m gap) 70 m £1.66 £116.2Intermittent line in reflectorised white (100mm wide with 4.0m line and 2.0m gap) 30 m £0.96 £28.7
£145.0LIGHTING
New lighting columns 4 nr £2,000.00 £8,000.0TRAFFIC SIGNS12.0700 Take up or down and re-erect standard tubular steel sign post 168 mm diameter. 4 nr £123.70 £494.8
12.0140Retro-reflective, externally lit or non lit sign unit, rectangular shaped, exceeding 3.0 square metre but not exceeding 4.0 square metre, fix to existing posts or lighting columns.
2 nr £456.16 £912.3
£9,408.0
Subtotal £77,718.0
Item Quantity Unit Rate Price CommentsPriory Wood roundabout westbound off-slip entry
Series 700: PavementsANTI-SKID SURFACING SYSTEM
High friction surfacing 4100 m2 £20.45 £83,825.2
£83,826.0Series 1200: Traffic Signs and Road Markings
Site Visit 1 nr £2,000.00 £2,000.0
£2,000.0ROAD MARKINGS
Arrows in reflectorised white (6.0m long straight or turning) 4 nr £34.40 £137.6Continuous line in reflectorised white (100mm wide) 27 m £1.15 £30.9Intermittent line in reflectorised white (100mm wide with 4.0m line and 2.0m gap) 300 m £0.96 £286.8
£456.0TRAFFIC SIGNALS
Signalisation 2 nr £50,000.00 £100,000.0e/o for High level signals 1 nr £50,000.00 £50,000.0
TRAFFIC SIGNS12.0700 Take up or down and re-erect standard tubular steel sign post 168 mm diameter. 4 nr £123.70 £494.8
12.0140Retro-reflective, externally lit or non lit sign unit, rectangular shaped, exceeding 3.0 square metre but not exceeding 4.0 square metre, fix to existing posts or lighting columns.
2 nr £456.16 £912.3
£151,408.0
Subtotal £237,690.0
TOTALS
Subtotal £595,068.015% Traffic Management £684,328.2010% Preliminaries £752,761.0210% Design Fee £828,037.1240% Contingency £1,159,251.97
TOTAL COST OF SCHEME £1,159,252.0
END
Printed on 08/01/2021 at 16:44 Page 2 of 2

Cost Estimate Junction 8- Alternative improvement to existing layout-Updated as per Agreed S106 plans- January 2021 [Summary]
STAL35+Existing Layout Works: 23003401-SDG-HGN-100-DR-D-00106-P2
Dec 2020 prices
TOTALS
Jnt 8- East Circulatory M11 S/B Off-slipWorks to west- inc n/b offslip Priory Wood
£159,006.00 £157,443.00 £238,157.00 £237,690.0015% Traffic Management £182,856.90 £181,059.45 £273,880.55 £273,343.50 Applied to all works cost10% Preliminaries £201,142.59 £199,165.40 £301,268.61 £300,677.85 Applied to cost inc TM10% Design Fee £221,256.85 £219,081.93 £331,395.47 £330,745.64 Applied to cumulative cost 40% Contingency £309,759.59 £306,714.71 £463,953.65 £463,043.89 Applied to cost + fees (covers non itemised works = signal ducting- Safety audit requirements etc & commuted sums)
TOTAL COST OF SCHEME 2018 Prices £309,760 £306,715 £463,954 £463,044 £1,543,472
£322,513 £319,342 £483,055 £482,108 £1,607,018END
2020 Prices based on ONS Construction Output Index (113.8/109.3)
Printed on 08/01/2021 at 16:43 Page 1 of 2

Cost Estimate Junction 8- Alternative improvement to existing layout-Updated as per Agreed S106 plans- January 2021 [BasicSheet]
[Insert client name or owner of spreadsheet][Insert project name][Insert filename or spreadsheet title]
[Insert heading here]
Item Quantity Unit Rate Price Comments
Costs from SPON'S 2016 unless otherwise statedSeries 200: Site Clearance All rates have been adjusted for 2.5% inflationTAKE UP/DOWN AND SET ASIDE FOR REUSE OR REMOVE TO STORE
Precast concrete kerbs and channels 12.5 m £8.28 £103.5Traffic Sign 2 nr £77.75 £155.5
£259.0Series 700: PavementsANTI-SKID SURFACING SYSTEM07.1606 Pavement Type 1 – Surface Course exceeding 35mm but not exceeding 50mm plus Binder Course
exceeding 60mm but not exceeding 100mm40 m2 £27.24 £1,089.7
BASE COURSE (250mm)07.0100 Ba1A AC 32 HDM base 40/60, 60mm thick in carriageway, hardshoulder or hardstrip 40 m2 £10.71 £428.3
07.0105 Extra Over for each additional 10mm thickness, up to 150mm 40 m2 £1.59 £1,208.0
BINDER COURSE (60mm)07.0420 Bi3H Hot Rolled Asphalt (HRA) 60/20 bin 40/60, 50mm thick in carriageway, hardshoulder or
hardstrip40 m2 £11.03 £441.1
07.0425 Extra Over for each additional 5mm thickness, up to 100mm 40 m2 £0.95 £75.9
SURFACE COURSE (45mm)07.0645 S1H Hot Rolled Asphalt (HRA), 35/14 F surf des PMB WTR 2 + PCC 14/20, 45mm thick in
carriageway, hardshoulder or hardstrip40 m2 £18.53 £741.3
£3,985.0Series 1100: Kerbs, Footways and Paved AreasKERBS, CHANNELS, EDGING, DRAINAGE
Pre-cast concrete kerbs laid straight or curved not exceeding 12m radius (150 x 305mm) 12.5 m £23.40 £292.5Pre-cast concrete quadrants (305 x 305 x 150mm) 1 nr £25.95 £26.0
£319.0Series 1200: Traffic Signs and Road Markings
Site Visit 1 nr £2,000.00 £2,000.0
£2,000.0ROAD MARKINGS
Arrows in reflectorised white (6.0m long double headed) 2 nr £51.60 £103.2Arrows in reflectorised white (6.0m long straight or turning) 3 nr £34.40 £103.2Letters or numerals in reflectorised white (2.0m high) 48 nr £13.76 £660.6Intermittent line in reflectorised white (100mm wide with 4.0m line and 2.0m gap) 500 m £0.96 £478.0
£1,346.0REFLECTING ROAD STUDS
100 x 100 mm square bi-directional reflecting road stud with amber corner cube reflectors1 nr £8.60 £8.6
TRAFFIC SIGNS12.0700 Take up or down and re-erect standard tubular steel sign post 168 mm diameter. 4 nr £123.70 £494.8
12.0140Retro-reflective, externally lit or non lit sign unit, rectangular shaped, exceeding 3.0 square metre but not exceeding 4.0 square metre, fix to existing posts or lighting columns.
2 nr £456.16 £912.3
£1,416.0Provisional sum for works to bridge structure (if detailed surveys prove that it is required)
Works to approach to Bridge Structure £150,000.00 £150,000.0
£150,000.0
Subtotal £159,006.0
Series 200: Site ClearanceTAKE UP/DOWN AND SET ASIDE FOR REUSE OR REMOVE TO STORE
Precast concrete kerbs and channels 265 m £8.28 £2,193.9Traffic Sign 2 nr £77.75 £155.5Lighting column 2 nr £60.94 £121.9
£2,472.0
Series 400: Road Restraint Systems (Vehicle and Pedestrian)BEAM SAFETY BARRIERS
Single sided corrugated beam 350 m £35.71 £12,498.8Long driven posts 175 m £56.53 £9,893.5
£22,393.0Series 600: EarthworksEXCAVATION
General excavation of unacceptable material Class U1/U2 in cutting and other excavation 210 m3 £4.87 £1,023.7
Disposal of unacceptable material Class U1/U2 + tipping charges 210 m3 £38.20 £8,022.2
General excavation of acceptable material Class 5 A 210 m3 £4.87 £1,023.7
Disposal of acceptable material Class 5 A + tipping charges 210 m3 £38.20 £8,022.2
£18,092.0Series 700: PavementsANTI-SKID SURFACING SYSTEM
High friction surfacing 700 m2 £20.45 £14,311.6
07.1606 Pavement Type 1 – Surface Course exceeding 35mm but not exceeding 50mm plus Binder Course exceeding 60mm but not exceeding 100mm
700 m2 £27.24 £19,069.5
BASE COURSE (250mm)07.0100 Ba1A AC 32 HDM base 40/60, 60mm thick in carriageway, hardshoulder or hardstrip 700 m2 £10.71 £7,494.9
07.0105 Extra Over for each additional 10mm thickness, up to 150mm 700 m2 £1.59 £21,140.2
BINDER COURSE (60mm)07.0420 Bi3H Hot Rolled Asphalt (HRA) 60/20 bin 40/60, 50mm thick in carriageway, hardshoulder or
hardstrip700 m2 £11.03 £7,719.0
07.0425 Extra Over for each additional 5mm thickness, up to 100mm 700 m2 £0.95 £1,329.0
SURFACE COURSE (45mm)07.0645 S1H Hot Rolled Asphalt (HRA), 35/14 F surf des PMB WTR 2 + PCC 14/20, 45mm thick in
carriageway, hardshoulder or hardstrip700 m2 £18.53 £12,973.1
£84,038.0Series 1100: Kerbs, Footways and Paved AreasKERBS, CHANNELS, EDGING, DRAINAGE
Pre-cast concrete kerbs laid straight or curved not exceeding 12m radius (150 x 305mm) 265 m £23.40 £6,200.3
£6,201.0Series 1200: Traffic Signs and Road Markings
Site Visit 1 nr £2,000.00 £2,000.0
£2,000.0ROAD MARKINGS
Intermittent line in reflectorised white (200mm wide with 1.0m line and 1.0m gap) 500 m £1.66 £830.0Intermittent line in reflectorised white (100mm wide with 4.0m line and 2.0m gap) 500 m £0.96 £478.0
£1,309.0LIGHTING
New lighting columns 9 nr £2,000.00 £18,000.0TRAFFIC SIGNS12.0700 Take up or down and re-erect standard tubular steel sign post 168 mm diameter. 9 nr £123.70 £1,113.3
12.0140Retro-reflective, externally lit or non lit sign unit, rectangular shaped, exceeding 3.0 square metre but not exceeding 4.0 square metre, fix to existing posts or lighting columns.
4 nr £456.16 £1,824.6
£20,938.0
Subtotal £157,443.0
Item Quantity Unit Rate Price Comments
Series 200: Site ClearanceTAKE UP/DOWN AND SET ASIDE FOR REUSE OR REMOVE TO STORE
Precast concrete kerbs and channels 300 m £8.28 £2,483.7Traffic Sign 4 nr £77.75 £311.0Lighting column 5 nr £60.94 £304.7
£3,100.0
Series 400: Road Restraint Systems (Vehicle and Pedestrian)BEAM SAFETY BARRIERS
Single sided corrugated beam 300 m £35.71 £10,713.2Long driven posts 150 m £56.53 £8,480.1
£19,194.0Series 600: EarthworksEXCAVATION
General excavation of unacceptable material Class U1/U2 in cutting and other excavation 600 m3 £4.87 £2,924.9
Disposal of unacceptable material Class U1/U2 + tipping charges 600 m3 £38.20 £22,920.4
General excavation of acceptable material Class 5 A 600 m3 £4.87 £2,924.9
Disposal of acceptable material Class 5 A + tipping charges 600 m3 £38.20 £22,920.4
£51,691.0Series 700: PavementsANTI-SKID SURFACING SYSTEM
High friction surfacing 800 m2 £20.45 £16,356.1
07.1606 Pavement Type 1 – Surface Course exceeding 35mm but not exceeding 50mm plus Binder Course exceeding 60mm but not exceeding 100mm
1200 m2 £27.24 £32,690.5
BASE COURSE (250mm)07.0100 Ba1A AC 32 HDM base 40/60, 60mm thick in carriageway, hardshoulder or hardstrip 1200 m2 £10.71 £12,848.4
07.0105 Extra Over for each additional 10mm thickness, up to 150mm 1200 m2 £1.59 £36,240.4
BINDER COURSE (60mm)07.0420 Bi3H Hot Rolled Asphalt (HRA) 60/20 bin 40/60, 50mm thick in carriageway, hardshoulder or
hardstrip1200 m2 £11.03 £13,232.5
07.0425 Extra Over for each additional 5mm thickness, up to 100mm 1200 m2 £0.95 £2,278.3
SURFACE COURSE (45mm)07.0645 S1H Hot Rolled Asphalt (HRA), 35/14 F surf des PMB WTR 2 + PCC 14/20, 45mm thick in
carriageway, hardshoulder or hardstrip1200 m2 £18.53 £22,239.6
£135,886.0Series 1100: Kerbs, Footways and Paved AreasKERBS, CHANNELS, EDGING, DRAINAGE
Pre-cast concrete kerbs laid straight or curved not exceeding 12m radius (150 x 305mm) 300 m £23.40 £7,019.2
£7,020.0Series 1200: Traffic Signs and Road Markings
Site Visit 1 nr £2,000.00 £2,000.0
£2,000.0ROAD MARKINGS
Intermittent line in reflectorised white (200mm wide with 1.0m line and 1.0m gap) 70 m £1.66 £116.2Intermittent line in reflectorised white (100mm wide with 4.0m line and 2.0m gap) 350 m £0.96 £334.6
£451.0LIGHTING
New lighting columns 8 nr £2,000.00 £16,000.0TRAFFIC SIGNS12.0700 Take up or down and re-erect standard tubular steel sign post 168 mm diameter. 8 nr £123.70 £989.6
12.0140Retro-reflective, externally lit or non lit sign unit, rectangular shaped, exceeding 3.0 square metre but not exceeding 4.0 square metre, fix to existing posts or lighting columns.
4 nr £456.16 £1,824.6
£18,815.0
Subtotal £238,157.0
Item Quantity Unit Rate Price Comments
Priory Wood roundabout westbound off-slip entrySeries 700: PavementsANTI-SKID SURFACING SYSTEM
High friction surfacing 4100 m2 £20.45 £83,825.2
£83,826.0Series 1200: Traffic Signs and Road Markings
Site Visit 1 nr £2,000.00 £2,000.0
£2,000.0ROAD MARKINGS
Arrows in reflectorised white (6.0m long straight or turning) 4 nr £34.40 £137.6Continuous line in reflectorised white (100mm wide) 27 m £1.15 £30.9Intermittent line in reflectorised white (100mm wide with 4.0m line and 2.0m gap) 300 m £0.96 £286.8
£456.0TRAFFIC SIGNALS
Signalisation 2 nr £50,000.00 £100,000.0e/o for High level signals 1 nr £50,000.00 £50,000.0
TRAFFIC SIGNS12.0700 Take up or down and re-erect standard tubular steel sign post 168 mm diameter. 4 nr £123.70 £494.8
12.0140Retro-reflective, externally lit or non lit sign unit, rectangular shaped, exceeding 3.0 square metre but not exceeding 4.0 square metre, fix to existing posts or lighting columns.
2 nr £456.16 £912.3
£151,408.0
Subtotal £237,690.0
TOTALS
Subtotal £792,29615% Traffic Management £911,14010% Preliminaries £1,002,25410% Design Fee £1,102,48040% Contingency £1,543,472
TOTAL COST OF SCHEME £1,543,472
END
Printed on 08/01/2021 at 16:43 Page 2 of 2