Embed Size (px)
Citation preview

CCLLIIMMAATTEE
AACCTTIIOONN
PPLLAANN
MARCH 6, 2012

Haverford College, while a non-sectarian institution, has Quaker origins which inform many aspects of the life of the College. They help to make Haverford the special college that it is, where the excellence of its academic program is deepened by its spiritual, moral, and ethical dimensions. These show most clearly in the close relationship among members of the campus community, in the emphasis on integrity, in the interaction of the individual and the community, and in the College’s concern for the uses to which its students put their expanding knowledge.
- from the Haverford College Statement of Purpose
I suggest that you preach truth and do righteousness as you have been taught, whereinsoever that teaching may commend itself to your consciences and your judgments. For your consciences and your judgments we have not sought to bind; and see you to it that no other institution, no political party, no social circle, no religious organization, no pet ambitions put such chains on you as would tempt you to sacrifice one iota of the moral freedom of your consciences or the intellectual freedom of your judgments.
—President Isaac Sharpless, Haverford College
Commencement, 1888
"Quaker business process and decision-making practice–with all its strengths and imperfections– has long served as a powerful connection to the College's Quaker roots. Taking the time to carefully hear and consider the wisdom in each of us can be cumbersome, but it often results in a stronger, more unified community of teachers, learners, and staff."
–Emma Lapsansky-Werner, Professor of History
“If we unbalance Nature, human kind will suffer. Furthermore, we must consider future generations: a clean environment is a human right like any other. It is therefore part of our responsibility towards others to ensure that the world we pass on is as healthy as, if not healthier than, we found it.”
— The Dalai Lama
"Be patterns, be examples in all countries, places, islands, nations wherever you come; that your carriage and life may preach among all sorts of people, and to them; then you will come to walk cheerfully over the world, answering that of God in everyone"
– George Fox, 1656

Acknowledgements
Haverford College Facilities Management Department
Ronald Tola, Director of Facilities Management
William Anderko, Assistant Director Facilities Management
Claudia Kent, Assistant Director Facilities Management, Sustainability and Grounds
Committee for Environmental Responsibility
Claudia Kent – Sustainability Coordinator
Gilda Koutsiouroumbas – Staff
Indradeep Ghosh – Faculty, Economics
Donna Ruane – Treasurer Helen White – Faculty, Environmental Studies
Student Representatives: Tamara Agins ‘12 Robin Chernow ‘15
Eleanor Durfee ‘14
Caileigh Feldman ‘14
Steven Griffith ’12, Sustainability Assistant
Siena Mann ‘14
Claire Perry ‘14
David Robinson ‘14
Consultant Team
THE STONE HOUSE GROUP
Table of Contents
Executive Summary ............................................................................................................................................ i
List of Acronyms ............................................................................................................................................... v
1. Introduction .............................................................................................................................1
2. Campus Emissions ....................................................................................................................2 2.1 Methodology ....................................................................................................................................... 2 2.2 Sources of Greenhouse Gas Emissions ................................................................................................ 3
2.2.1 On-Campus Stationary Sources ............................................................................................... 3 2.2.2 College Fleet ............................................................................................................................ 3 2.2.3 Refrigeration ........................................................................................................................... 4 2.2.4 Agriculture ............................................................................................................................... 4 2.2.5 Electricity ................................................................................................................................. 4 2.2.6 Faculty/Staff and Student Commuters .................................................................................... 4 2.2.7 Institutionally Sponsored Air Travel/Study Abroad ................................................................. 4 2.2.8 Solid Waste .............................................................................................................................. 4 2.2.9 Transmission and Distribution Losses ..................................................................................... 5
2.3 Campus Growth & Business as Usual Trends ........................................................................................ 6 2.3.1 Campus Growth ....................................................................................................................... 6 2.3.2 Business as Usual .................................................................................................................... 8
3. Mitigation Strategies .............................................................................................................. 10 3.1 Mitigation Strategy Overview .............................................................................................................. 10 3.2 Energy Audit Overview ...................................................................................................................... 12 3.3 Generation and Distribution Energy Mitigation Strategies ...................................................................... 14
3.3.1 Cooling Strategy .................................................................................................................... 14 3.3.2 Central Steam Plant Opportunities ....................................................................................... 16 3.3.2.1 Reduction in Steam Distribution Pressures ........................................................................ 16 3.3.2.2 Summer Shut-down of Central Steam Plant ...................................................................... 16 3.3.3 Evaluation of Fuel Alternatives.............................................................................................. 17 3.3.4 On-Campus Electricity Generation ........................................................................................ 19 3.3.4.1 Co-Generation ................................................................................................................... 19 3.3.4.2 Renewable Energy Opportunities...................................................................................... 20
3.4 End-Use Mitigation Strategies ............................................................................................................ 22 3.4.1 Lighting .................................................................................................................................. 22 3.4.2 Heating Ventilation and Air-Conditioning ............................................................................. 22 3.4.3 Retro-Commissioning ............................................................................................................ 23 3.4.4 Building Automation System Upgrades................................................................................. 23 3.4.5 Holiday Curtailment and Scheduling Initiatives .................................................................... 23 3.4.6 Geothermal Heat Pumps ....................................................................................................... 24
3.5 Other Campus Related Greenhouse Gas Mitigation Strategies .............................................................. 24 3.5.1 Fugitive Emissions Refrigerant Fluids .................................................................................... 24 3.5.2 Faculty/Staff and Student Commuters .................................................................................. 25 3.5.3 Institutionally Sponsored Air Travel ...................................................................................... 26

3.5.4 Solid Waste ............................................................................................................................ 26 3.5.5 Transmission and Distribution Losses ................................................................................... 26 3.5.6 Campus Fleet ......................................................................................................................... 27 3.5.7 Agricultural Sources .............................................................................................................. 27 3.5.8 Green Building ....................................................................................................................... 27 3.5.9 Offsets ................................................................................................................................... 29
4. Educational, Research, and Community Outreach Efforts .................................................... 32 4.1 Curriculum and other Educational Experiences .................................................................................... 32
4.1.1 Current Offerings and Programs ........................................................................................... 32 4.1.2 Service Learning Opportunities and Student Organizations ................................................. 32 4.1.3 Student Organizations ........................................................................................................... 32 4.1.4 Student Orientation and Other College-wide Initiatives ....................................................... 33 4.1.5 Planned Future Actions ......................................................................................................... 33
4.2 Research ......................................................................................................................................... 33 4.2.1 On-going Research ................................................................................................................ 33
4.3 Community Outreach......................................................................................................................... 33 4.3.1 Planned Future Efforts ........................................................................................................... 33
5. Tracking Changes ................................................................................................................... 34 5.1 Policy & Technical Changes ............................................................................................................... 34 5.2 Tracking Progress ............................................................................................................................. 35 5.3 Target Dates for Emissions Reductions ............................................................................................... 35
6. Assumptions ........................................................................................................................... 37 6.1 Campus Emissions ........................................................................................................................... 37 6.2 Mitigation Strategies .......................................................................................................................... 38 6.3 Other/Miscellaneous .......................................................................................................................... 38
Appendix A Greenhouse Gas Emissions Inventory
Appendix B Energy Capital Investment Plan
Appendix C Calculations and Conversions
Appendix D Peer Institution Comparison
Haverford College Climate Action Plan | Executive Summary i
Executive Summary
Haverford College has been committed to sustainability for many years, with incorporation of
sustainable principles and practices within the College community, including conservation of natural
resources, promotion of energy conservation, conscientious production and consumption of food,
and adoption of green building standards. Haverford’s Committee on Environmental Responsibility
was created in response to a Fall 2000 plenary resolution by the Haverford Student’s Association
and is comprised of a 10 member body of faculty, staff and students. The committee meets on a
weekly basis to discuss and evaluate current and proposed environmental and sustainability issues at
the College. Former President, Tom Tritton, signed the American College and University
President’s Climate Commitment (ACUPCC) associated with Association for Advancement of
Sustainability in Higher Education (AASHE), in the summer of 2007, shortly before leaving office.
In December 2007, President Steve Emerson resigned the commitment. The Commitment
recognizes the unique role colleges and universities have in addressing the global climate crisis, and
places into effect reduction measures including GHG emissions benchmarking, mitigation strategies,
and campus and community initiatives.
The Commitment obligated the College to:
submit within two months information on the institutional structure for developing their
climate action plans, including designating the institutional liaison and two tangible actions
to be implemented before the end of year 2;
report the results of their GHG emissions inventories within 1 year;
submit their climate action plans within 2 years;
update their GHG emissions inventories within 3 years and at least every other year
thereafter (years 5, 7, 9 etc.);
submit narrative reports describing progress in implementing their climate action plans
within 4 years and at least every other year thereafter (years 6, 8, 10 etc).
The publication of this climate action plan represents substantial progress on our path to net climate
neutrality as we now have a framework by which we believe that this goal is achievable. To begin,
Haverford College has set a goal of the year 2017 to achieve a 9% reduction of “net” campus
emissions. Our gross campus emissions during fiscal year 2011 totaled 14,726 metric tons carbon
dioxide equivalents (MTCDE). The distribution of these emissions among the Scope 1, 2 and 3
categories defined by the ACUPCC are as follows:

Haverford College Climate Action Plan | Executive Summary ii
Scope Source Emissions (MTCDE)
1 On-Campus Stationary Sources 4,918
1 College Fleet 143
1 Refrigeration 127
1 Agriculture 14
2 Electricity 7,294
3 Faculty/Staff Commuters 821
3 Institutionally Sponsored Air Travel 436
3 Solid Waste 252
3 Transmission and Distribution Losses 721
Total Gross Campus Emissions (FY 2011*) 14,726
Emissions Reductions (Renewable Energy Certificates) (6,874)
Net Campus Emissions 7,852
* Baseline year
The functional distribution of our emissions demonstrates that on-campus stationary sources
(primarily heating) and purchased electricity represent 87% (Purchased Electricity + On-Campus
Stationary Sources + T&D Losses) of the emissions for the College.
In order to achieve climate neutrality, we have analyzed a range of options that could help us achieve
this goal. This process of analyzing data on energy and emissions was
conducted in concert with campus growth under the Campus Master
Plan developed by Haverford College. Ultimately, we have chosen an
Haverford College Climate Action Plan | Executive Summary iii
approach to climate neutrality that focuses on reducing the amount of energy consumed by the
College, using the energy we do consume more efficiently, employing renewable and alternative
energy and using offsets as our final tool when all other reasonable means of emission reduction
have been exhausted.
Highlights of the major mitigation strategies are as follows:
Improve Efficiency of Existing Utilities we will develop a utility strategy to include
equipment that is not only environmentally responsible, but also has the flexibility to vary
fuel sources as price points in the utility markets change with market demands and
availability. Zoned or district utility plants will be evaluated against a central plant strategy to
determine cost and environmental viability and impacts.
Re-Commissioning of existing building systems to ensure efficient operations and reduced
energy consumption.
Renovation of existing buildings and construction of new buildings to higher energy
standards – will allow us to provide modern campus facilities to our constituents while
reducing energy and water consumption associated with existing and proposed campus
buildings and building projects.
Modernization of our heating infrastructure will allow for cogeneration/trigeneration
through the use of combined heat and power plants, lowering our grid source electricity
requirements and providing hot water and chilled water to serve heating and cooling needs.
Deployment of Renewable Energy Systems - Installation of on-campus photovoltaic arrays
for at least three sites on campus will be seriously considered as a viable source of renewable
energy to support the energy needs of the College.
Reduction of end-use energy consumption through enhancements to our campus Building
Automation System. Many projects have been identified that will reduce the heating and
cooling energy on campus and electricity consumption through improvements of lighting
fixtures and controls. The development of holiday and summer curtailment policies to
reduce consumption of energy and emissions during times of relatively low occupancy will
also have a significant impact.
Exploration of ways to reduce the Scope 3 emissions through implementation of incentives
to use public transportation and improvements in the fuel efficiency of our campus fleet.
In addition to the above, we will continue to develop and offer educational and research
opportunities pertaining to sustainability and climate neutrality to students across campus, promote
research in these areas through institutional support both in funding and materiel, advertise our
efforts through effective communication pieces on-line and in print format, and develop effective
outreach programs to both members of the campus community and to those in the wider
community through conferences and distance learning courses.

Haverford College Climate Action Plan | Executive Summary iv
Haverford College has taken the first steps toward neutrality by:
Incorporation of sustainable principles and practices within the College community, including conservation of natural resources, promotion of energy conservation, conscientious production and consumption of food, and adoption of green building standards.
Enactment in 2005 of a building policy at Haverford College stating that all new construction will be environmentally friendly; by former University President Thomas Tritton.
Purchase of all electricity from Renewable Energy sources since 2005.
Becoming a signatory to the American College and University President's Climate Commitment (ACUPCC).
The College is committed to long-term climate neutrality and intends to set additional, interim
targets to progressively lower emissions until climate neutrality is achieved, while continuing to
develop at better understanding of its overall climate footprint.
To date the College has not set a specific date for reaching climate neutrality.

Haverford College Climate Action Plan | List of Acronyms v
List of Acronyms
AASHE Association for the Advancement of Sustainability in Higher Education ACUPCC American College & University Presidents’ Climate Commitment
ASHRAE American Society of Heating, Refrigeration, and Air-Conditioning Engineers
BAU Business As Usual
CAAA Clean Air Act Amendments CAP Climate Action Plan CACP Clean Air Cool Planet CCC Campus Carbon Calculator CDE Carbon Dioxide Equivalent CER Committee on Environmental Responsibility CER Certified Emissions Reduction CO2 Carbon Dioxide CO2e Equivalent Carbon Dioxide
DCV Demand Control Ventilation
eGrid Emissions & Generation Resource Integrated Database EIA Energy Information Administration EPA Environmental Protection Agency
FY Fiscal Year
GHG Greenhouse Gas GSF Gross Square Feet GWP Global Warming Potential
IPCC Intergovernmental Panel on Climate Change
kW and kWh kilowatt and kilowatt hour
LEED Leadership in Energy & Environmental Design
MMBTU 1 million BTU, or thousand thousand BTU MT Metric Ton MTCDE Metric Tons CO2 Equivalent
PECO Philadelphia Electric Company PESC President's Environmental Sustainability Committee PJM Pennsylvania New Jersey Maryland PV Photovoltaic
REC Renewable Energy Certificates RFCE Reliable First Corporation East RPS Renewable Portfolio Standard
T&D Transmission & Distribution
USGBC US Green Building Council
VAV Variable Air Volume VER Verified Emissions Reduction VMM Virtual Met Mast WRI World Resource Institute WTE Waste to Energy
Haverford College Climate Action Plan | Introduction 1
1. Introduction
The CAP is organized using the general format provided by the ACUPCC Implementation Guide,
with one additional section at the end. The seven sections of Haverford’s CAP are as follows:
Section 1 – Introduction provides background about Haverford College and briefly describes why
we have made this commitment. Section 2 – Campus Emissions and Section 3 – Mitigation
Strategies present data on past emissions and include our proposed methods to reduce emissions
and meet the goal of climate neutrality, respectively. We strive to conserve natural resources and
promote energy conservation, adhere to green building standards, support the conscientious
production and consumption of energy and food, and reduce waste. Section 4 – Educational,
Research, Community Outreach Efforts, describes how we as an educational institution are
making sustainability part of our academic mission and culture both on and beyond campus.
Haverford is committed to advancing its educational, research, and community outreach efforts
toward the goal of creating an environmentally literate and responsible community. In a time when
public understanding of global climate change is waning according to some recent polls, this need is
more acute than ever. Section 5, Tracking Changes, outlines milestones and targets for achieving
our goals. The College assumes responsibility and accountability for its efforts in the area of
sustainability, and is committed to tracking its progress as set forth in the CAP. Finally, an additional
section (Section 6: Assumptions) describes in part the assumptions made while developing the
mitigation strategies.
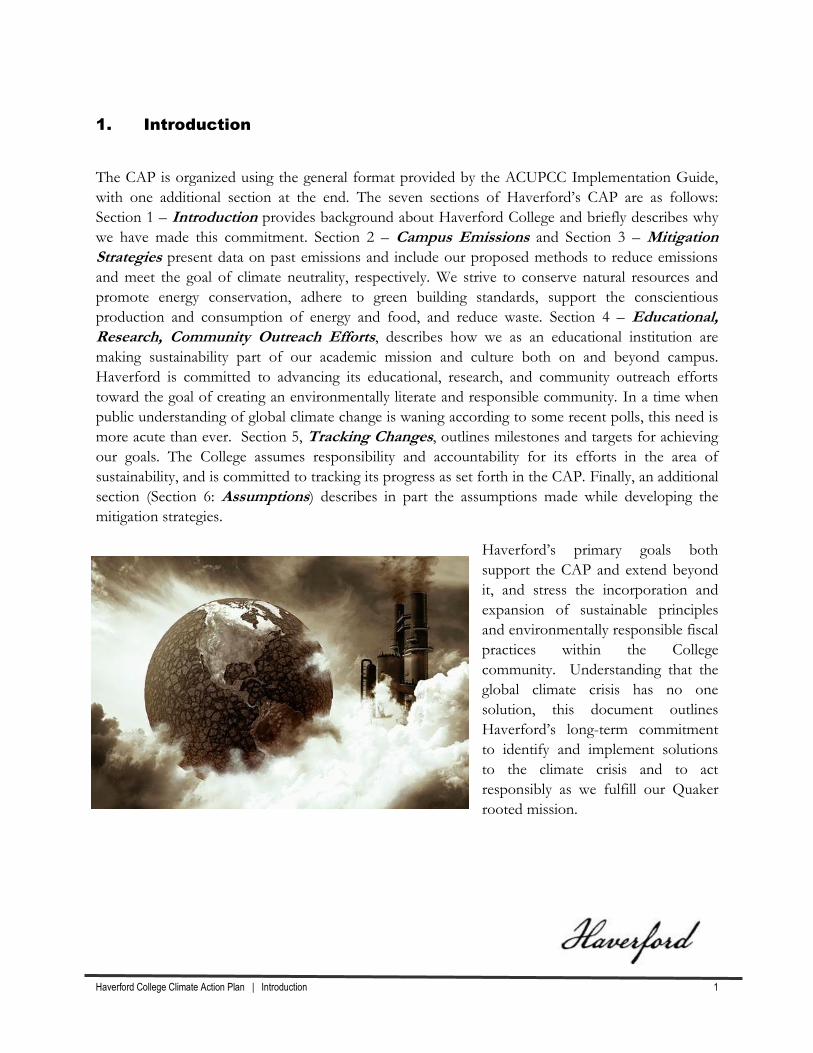
Haverford’s primary goals both
support the CAP and extend beyond
it, and stress the incorporation and
expansion of sustainable principles
and environmentally responsible fiscal
practices within the College
community. Understanding that the
global climate crisis has no one
solution, this document outlines
Haverford’s long-term commitment
to identify and implement solutions
to the climate crisis and to act
responsibly as we fulfill our Quaker
rooted mission.

Haverford College Climate Action Plan | Campus Emissions 2
2. Campus Emissions
Effective climate action planning requires an understanding of the greenhouse gases emitted by the
College. Toward that end, Haverford undertook the task of collecting several years of data to
calculate and categorize the College’s greenhouse gases and their sources.
2.1 Methodology
The Campus Carbon Calculator, developed by Clean Air-Cool Planet (CACP), was used to calculate
the greenhouse gas emissions. The calculator contains a series of spreadsheets created by Clean Air-
Cool Planet and was developed in collaboration with others, including but not limited to, the
Intergovernmental Panel on Climate Change (IPCC) Third Assessment, the U.S. Environmental
Protection Agency’s (EPA) Emissions & Generation Resource Integrated Database (eGRID),
Energy Information Administration (EIA), and the World Resources Institute (WRI). Following
IPCC and WRI guidelines, the emissions calculated for Haverford have been converted to metric
tons carbon dioxide equivalent (MTCDE). This unit is used to report total releases by Scope (i.e.,
Sector) and summarize the Haverford greenhouse gas (GHG) inventory. A copy of the input data
and summary information from the CACP calculator are provided in Appendix A, Greenhouse Gas
Emissions Inventory. During the process of assessing our emissions the CACP calculator has
undergone several revisions. The emissions inventory information presented in Appendix A was
entered into and calculated with version 6.7, the most recent calculator available from CACP at the
time this report was prepared.
Data were obtained from several offices at Haverford including Facilities Management, Dining
Services, Human Resources, Finance and Planning, and Institutional Research. The base year data
reflect a period from July 1, 2010 through June 30, 2011, the Haverford fiscal year (July to June), not
the calendar year. As is typical of any data-gathering undertaking, data were not available for every
year of the study for each sector or source. However, the data obtained were sufficient to
interpolate and thereby complete a comprehensive emissions inventory. The available data were
entered into the appropriate spreadsheets and emissions output determined. Haverford has now
calculated greenhouse gas emissions for multiple years and while the quality of the input data has
grown with each subsequent year, remaining assumptions used in the calculation of the GHG
inventory are included in Section 6 of this report. The emission estimates for on-site energy
generation and purchased energy are based on regional and national average emission factors for the
various fuels used. Included in the waste section are emissions associated with the incineration of
solid waste generated by the College. The refrigeration section examines the release of
hydrofluorocarbon (HFC) and perfluorocarbon (PFC) refrigerants that are primarily sourced from
the on-campus chilled water and refrigeration equipment, and which are collectively known as
fugitive emissions.
As would be expected, there are several sources of emissions that
are not included in this inventory. For example, the emissions
generated by the production and transportation of materials

Haverford College Climate Action Plan | Campus Emissions 3
purchased by Haverford are not included, as they would fall outside of the ‘Boundaries’ of
Haverford’s control. In addition, the emissions resulting from off campus activities of
students/faculty/staff also fall outside of Boundaries. Haverford collected data for student, staff,
and faculty commuting
for the Fiscal Year (FY)
2011 only, and we
include them here.
Because only one year of
data was collected,
however, historic trends
for commuting mileage
and habits were not able
to be established. These
limitations do not imply
that these sources of
greenhouse gases are
insignificant. The intent
of the inventory is to
provide a basis on which
to develop an environmentally and economically sound GHG management and reduction policy for
Haverford College.
2.2 Sources of Greenhouse Gas Emissions
The WRI places GHG emissions sources into three different categories known as Scopes. Scope 1
emissions are those that are attributable to on-campus energy generation (heat, hot water, steam, and
electricity), the campus fleet, fugitive emissions (refrigerant leaks) and agricultural activities. Scope 2
emissions are those associated with indirect sources of emissions such as purchased electricity, steam
and chilled water. Scope 3 emissions are comprised of ‘other’ emissions such as College sponsored
air travel, commuting, solid waste, and electrical transmission and distribution losses. These nine
areas have been identified as the primary sources of greenhouse gas emissions on the Haverford
campus. They are further described as follows:
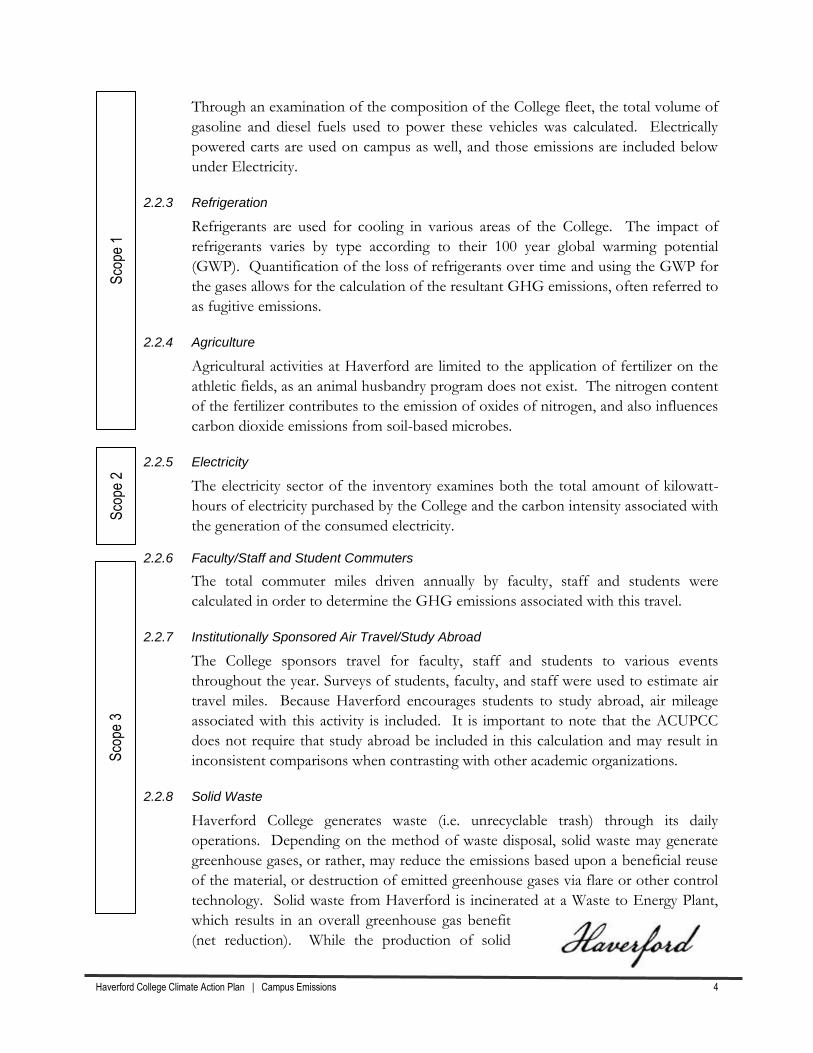
2.2.1 On-Campus Stationary Sources
On-campus stationary sources, composing the majority of GHG emissions, include
fuel consumed on campus to produce energy for heating and hot water. Haverford
uses distillate fuel oil (#2 oil) and natural gas for on-campus energy production.
Natural gas is used predominately at the campus central heating plant (although it
has dual fuel capability - the ability to burn either fuel oil or natural gas) and fuel oil
at small structures not served by the centralized infrastructure.
2.2.2 College Fleet
Haverford College owns and operates vehicles to
assist in the daily operations of the College.
Figure 2-1 GHG Emissions and Scopes
Sco
pe 1
Haverford College Climate Action Plan | Campus Emissions 4
Through an examination of the composition of the College fleet, the total volume of
gasoline and diesel fuels used to power these vehicles was calculated. Electrically
powered carts are used on campus as well, and those emissions are included below
under Electricity.
2.2.3 Refrigeration
Refrigerants are used for cooling in various areas of the College. The impact of
refrigerants varies by type according to their 100 year global warming potential
(GWP). Quantification of the loss of refrigerants over time and using the GWP for
the gases allows for the calculation of the resultant GHG emissions, often referred to
as fugitive emissions.
2.2.4 Agriculture
Agricultural activities at Haverford are limited to the application of fertilizer on the
athletic fields, as an animal husbandry program does not exist. The nitrogen content
of the fertilizer contributes to the emission of oxides of nitrogen, and also influences
carbon dioxide emissions from soil-based microbes.
2.2.5 Electricity
The electricity sector of the inventory examines both the total amount of kilowatt-
hours of electricity purchased by the College and the carbon intensity associated with
the generation of the consumed electricity.
2.2.6 Faculty/Staff and Student Commuters
The total commuter miles driven annually by faculty, staff and students were
calculated in order to determine the GHG emissions associated with this travel.
2.2.7 Institutionally Sponsored Air Travel/Study Abroad
The College sponsors travel for faculty, staff and students to various events
throughout the year. Surveys of students, faculty, and staff were used to estimate air
travel miles. Because Haverford encourages students to study abroad, air mileage
associated with this activity is included. It is important to note that the ACUPCC
does not require that study abroad be included in this calculation and may result in
inconsistent comparisons when contrasting with other academic organizations.
2.2.8 Solid Waste
Haverford College generates waste (i.e. unrecyclable trash) through its daily
operations. Depending on the method of waste disposal, solid waste may generate
greenhouse gases, or rather, may reduce the emissions based upon a beneficial reuse
of the material, or destruction of emitted greenhouse gases via flare or other control
technology. Solid waste from Haverford is incinerated at a Waste to Energy Plant,
which results in an overall greenhouse gas benefit
(net reduction). While the production of solid
Sco
pe 3
S
cope
2
Sco
pe 1

Haverford College Climate Action Plan | Campus Emissions 5
waste yields us a GHG net reduction, we will continue to strive to reduce solid waste
on-campus.
2.2.9 Transmission and Distribution Losses
A sub-component of Electricity, this sector represents the GHG emissions
associated with losses of electricity between the generation sources and the end user.
Because the electricity sector above deals only with end use consumption of
electricity and the carbon intensity of generation, this category is a sector unto itself,
as mitigation of purchased electricity via Renewable Energy Certificates (RECs) does
not abate emissions from transmission and distribution losses.
From the sum of these sources (or scopes), it is possible to obtain an estimate of our total GHG
emissions. For fiscal year 2011, our “net” campus emissions totaled 7,852 MTCDE. A summary of
GHG emissions by scope and sector is presented in Table 2-1. A functional distribution of
emissions is presented graphically in Figure 2-2.
Table 2-1 Campus Emissions (FY 2011) Summary by Scope & Source
Scope Source Emissions
(MTCDE)
1 On-Campus Stationary Sources 4,918
1 College Fleet 143
1 Refrigeration 127
1 Agriculture 14
2 Electricity 7,294
3 Faculty/Staff Commuters 821
3 Institutionally Sponsored Air Travel 436
3 Solid Waste 252
3 Transmission and Distribution Losses 721
Total Gross Campus Emissions (FY 2011*) 14,726
Emissions Reductions (Renewable Energy Certificates) (6,874)
Net Campus Emissions 7,852
* Baseline year
Sco
pe 3

Haverford College Climate Action Plan | Campus Emissions 6
2.3 Campus Growth & Business as Usual Trends
2.3.1 Campus Growth
Haverford has developed a Campus Master Plan with assistance from consultants Venturi, Scott
Brown and Associates. Their recommendations for future campus growth and utility infrastructure
include the construction of new dormitories to bring students closer to campus. Recommendations
for additional academic, research, athletic and campus life facilities were also made. Overall net
campus growth is projected at approximately 1,000,000 gross square feet (GSF) which relates to a
700,000 GSF net gain for the college. As new resident halls are built on campus, the Haverford
College Apartments with a square footage of 222,894 will be removed from the campus building
stock. Also, the demolition of the Alumni fieldhouse and relocation of the Facilities Management
Complex account for the difference between the 1 million GSF and 700,000 GSF net gains
mentioned above. The current Campus Plan retains the historic and cultural centerpieces of the
campus. Our intent is to make the campus more pedestrian friendly while providing an increased
number of housing options so that more of our students may reside on-campus and take better
advantage of the premier educational and social opportunities that we have to offer. Figure 2-3
presents a graphical representation of proposed future campus growth. Because the campus can
currently be considered “space rich” with over 1,000 gsf per student, a focus of the College will be
thoughtful use of existing space. Growth in campus GSF does not necessarily relate to growth in the
overall land ownership of the College. Growth on a campus must be flexible and adaptable; with
this understanding Figure 2-4 represents only one of a variety of possible scenarios.
Figure 2-2 Campus Emissions (FY 2012) Functional Distribution

Haverford College Climate Action Plan | Campus Emissions 7
Figure 2-4 Gross Campus Growth in Gross Square Feet
Figure 2-3 Cumulative Campus Growth in Gross Square Feet

Haverford College Climate Action Plan | Campus Emissions 8
One potential vision of the campus in the long term perspective is provided in Figure 2-5 below.
GHG emissions are directly tied to the amount of energy we consume. Buildings use electricity and
fossil fuels for heating, air conditioning and lighting. As we add GSF to the campus, we increase the
amount of energy consumed. While newer and renovated buildings may use energy more efficiently,
they may also use more of it, as building codes now require larger amounts of conditioned air to be
introduced into the structure, thereby requiring more energy for the conditioning of that air. While
our campus building standards dictate that we build “green”, even with the use of highly efficient
systems some buildings may consume more energy than their older predecessors.
2.3.2 Business as Usual
A construct of the climate change world, the Business As Usual (BAU) scenario assumes that the
institution takes no steps or actions to mitigate its emissions; such BAU scenarios provide an idea of
what the future emissions profile might look like should the institution elect to take no action with
regard to climate change and climate neutrality. BAU does not take into account future regulatory
demands that might affect fuel efficiency in cars and trucks, renewable energy standards for utility
generators, potential technology breakthroughs or behavioral changes that might come about. It is
intended to be a worst-case scenario based upon current consumptions and efficiencies. The BAU
projection does take into account projected campus growth, both
in terms of physical size and the number of faculty, staff and
Figure 2-5 Potential Campus Growth

Haverford College Climate Action Plan | Campus Emissions 9
Figure 2-6 Business as Usual Projection
students. Figure 2-6 below provides a graphical representation of GHG emissions in the BAU
scenario. The purchased electricity and on-campus stationary sources closely mirror the shape of the
data presented in the cumulative Total GSF chart presented above, strongly suggesting that the BAU
growth in emissions is directly related to the anticipated growth of the campus’ physical size in terms
of gross square feet (GSF).
As demonstrated in Figure 2-6, the majority of our GHG emissions are associated with purchased
electricity, the campus heating plant and commuting. Our BAU scenario demonstrates a growth in
GHG emissions to nearly 21,000 MTCDE by 2050. Figure 2-3 demonstrates the anticipated growth
of the campus during the BAU period. BAU growth in emissions is directly related to the
anticipated growth of the physical size, in terms of gross square feet (GSF). Due to limited data on
energy usage intensity for higher education buildings, emissions projections have been estimated
based on the limited information available from organizations like AASHE and EPA. While other
emissions sources are also important, emissions reduction measures associated with a reduction in
purchased electricity, the central heating plant and how we get to and from work will have the
greatest impact on our GHG emissions profile in years to come.

Haverford College Climate Action Plan | Mitigation Strategies 10
3. Mitigation Strategies
Prior to the development of this CAP, Haverford College had prepared a Campus Master Plan along
with consultants Venturi, Scott Brown and Associates and Andropogon Associates. This Master
Plan allowed us to better define and understand the physical space and place of the College as it
exists today, how it may evolve over the next forty years, and the impact that changes on campus
will have on our emissions profile and overall environmental footprint. Haverford had also
previously enlisted the support of Brinjac Engineering to provide Utility Master Planning services,
which offered a framework from which to begin our energy analysis. The BAU projection provided
in Section 2 takes into account the projected campus growth as based upon the Campus Master
Plan. With any type of projection, prognostication can only be made within the limitations of
information available as part of the planning effort. A significant effort went into the development
of the campus build-out, including but not limited to, phasing of construction, building types and
locations, implications with regard to future utility needs, demolition of structures, and campus
building standards. Economics as well as ecology were evaluated in the Plan, and development of
the Climate Action Plan is linked to both.
Greenhouse gas emissions are generally attributed to anthropogenic sources, and reducing them
entails many strategies. Human activities, and in particular the use of fossil-based fuels, have caused,
and continue to contribute to, the climate change phenomenon. Energy consumption is therefore
directly related to GHG emissions. In order to mitigate the effect of energy consumption, we must
adopt several different approaches to energy use: efficiency, renewable/biogenic sources, or
modification of our behaviors so that we consume less energy. Each mitigation strategy proposed
below falls into one of these three approaches to energy use reduction. Where data are presented as
a range of values, we have used the more conservative (typically lesser) of the two values for
inclusion in our projected future emissions profile so as to present a more conservative view.
The mitigation strategies presented below represent a variety of different projects proposed for the
campus. These strategies are “anticipated” because not all of the proposed projects or strategies
may be viable due to permitting, zoning, financial, and/or other constraints, both from within the
Haverford community and from without. Federal, State and local government regulations and the
impact of future regulations must be factored into which projects are ultimately undertaken and
implemented.
3.1 Mitigation Strategy Overview
The goal of net climate neutrality can be a daunting task for any institution. Our gross GHG
emissions for FY 10/11 were 14,726 MTCDE. At first glance, significant reduction of these
emissions appears to be a difficult proposition. As set forth in both the Kyoto protocol and the
ACUPCC implementation guide, a preference is given to reducing, reusing and recycling before
offsetting. THE STONE HOUSE GROUP, our advisors in the climate
action planning process, have developed a planning process to

Haverford College Climate Action Plan | Mitigation Strategies 11
streamline the development of an environmentally responsible institution, making net climate
neutrality an achievable goal.
We approach the climate action planning process with three key steps to
ensure a comprehensive approach: 1) Assess 2) Reduce 3) Offset. The first
step in this process is to ‘Assess’ the current state of the institution.
Assessment encompasses developing an understanding of the data (energy, the
greenhouse gas inventory, and College operations for Haverford), the
foundation for providing a comprehensive approach to developing a plan for
climate neutrality. Assessment also includes analysis to understand rate tariffs,
system capacities, and procurement strategies. This has been summarized in
Section 2.
The second step is to ‘Reduce’ emissions on the campus. The reduction
analysis is completed via a campus energy audit (with primary focus on campus
mechanical and electrical systems), utility strategy and a renewable energy
study. We focus on three areas for project oriented reduction in emissions; generation systems,
distribution systems, and end-use systems. Optimizing our generation systems is vital in reducing
our environmental footprint. Conversion of fossil fuel to usable forms of energy has inherent
losses, which need to be minimized. Maximizing efficiency, control and operation of generation
systems is thus a key element under this system. Additionally, the decision to purchase grid
electricity versus on-site renewable or co-generation options is critical.
Like generation, distribution systems are designed for peak or design target loads and can operate
less efficiently with deviation from these loads.
Energy can often be saved by modulating
temperatures, pump speeds and pressures.
End-Use systems consume over 50% of the
energy for most campuses. Generation and
distribution systems should be designed to
ensure that individual buildings are supplied
with enough energy to meet, but not exceed,
the associated needs. At times, however,
inefficient operation between control systems,
limitations of central systems or outdated
technology can raise energy usage and therefore
emissions. Figure 3-1, to the right, outlines the
six fundamental subsystems that are evaluated
during an energy assessment and climate action
planning process.
Finally, ‘Offset’ is the last step in the climate action planning process. Once the optimal systems are
Figure 3-1 Six Energy Subsystems

Haverford College Climate Action Plan | Mitigation Strategies 12
in place and greenhouse gas emissions are minimized, the remaining emissions can be offset through
the purchase of a variety of available offsetting instruments.
The purpose of the ‘Mitigation Strategies’ section of our Climate Action Plan is to address the
‘Reduce’ step of the process. We have analyzed currently available alternatives which would result in
direct greenhouse gas emission reductions which include energy efficiency measures (for generation,
distribution and end-use systems), fuel alternatives, renewable energy and other greenhouse gas
reduction measures.
3.2 Energy Audit Overview
THE STONE HOUSE GROUP performed an energy assessment and evaluation of Haverford’s campus
beginning in June 2011. The on-site
assessment of the buildings allowed us to
gain a better understanding of the age,
condition, energy consuming equipment
installed, and functionality of the buildings
through a centralized building automation
system. THE STONE HOUSE GROUP also
reviewed and assessed the central steam
plant and incoming electrical service.
Overall, 1.25 million square footage of
space was surveyed during the two month
evaluation period, equating to approximately
83% of the campus overall gross square footage. The selection of buildings to be surveyed was
based upon identifying those deemed to be among the highest consumers of energy and thus had
the highest potential for savings. The energy audit also included a sampling of residence halls,
which, due to the size and similarity between the buildings and systems, were deemed a sufficiently
representative sample.
In addition to the on-site inspections of individual buildings, THE STONE HOUSE GROUP met with
several members of the College’s facilities staff, including the Director and Assistant Director of
Facilities, Assistant Director of Facilities, Grounds and Sustainability, and the boiler plant engineer.
These individuals were very helpful in providing a better understanding of operations, scheduling,
College policy, and the opportunities and limitations of the energy systems on campus.
THE STONE HOUSE GROUP also conducted an analysis of Haverford’s utility data for fiscal years
08/09, 09/10 and 10/11. The results indicated that in FY10/11 Haverford consumed 143,007
MMBTU of energy at a cost of over $2.29 million. The campus energy consumption is comprised
of approximately 64% fossil fuels and 36% electricity. Figure 3-2 outlines the cost and consumption
by energy source.

Haverford College Climate Action Plan | Mitigation Strategies 13
Based on these same data, the campus as a whole used approximately 96 MBTU/GSF. Haverford
was compared to several other institutions, both in and outside of the geographical area to get some
sense of the relative consumption of energy on campus; the results of this benchmarking study
revealed that we consume approximately 23 MBTU/GSF less energy than the average for
comparable institutions. Therefore, while we perform better than average, we believe there is still
opportunity to reduce energy consumption on a square footage basis. Figure 3-3, presents the results
of our benchmarking study.
Figure 3-3 Benchmarking MBTU per GSF Results
Figure 3-2 Cost & Consumption by Source FY 10/11

Haverford College Climate Action Plan | Mitigation Strategies 14
Haverford College is not metered consistently at each building with condensate, chilled water,
electricity or domestic hot water meters. Therefore, it is difficult to decipher precisely how much
energy is consumed at each building. Additionally, we were not able to accurately determine how
much of each fuel source is consumed for end-uses such as lighting, HVAC, water heating, etc.
Therefore our climate neutralization of each fuel source must be analyzed on a campus-wide basis
instead of building by building.
While the following project descriptions represent the complete analysis performed by THE STONE
HOUSE GROUP, those selected by Haverford College to achieve their emission reduction target of
9% by 2017, considered Phase 1, have been listed in Appendix B: Energy Capital Investment Plan.
3.3 Generation and Distribution Energy Mitigation Strategies
There are large cost savings and greenhouse gas reductions to be gained by investigating alterative
energy strategies for the central steam plant, district cooling plants, and electrical power generation
systems on-campus. As discussed in the next section, there are also many energy efficiency
improvements within the individual buildings (end-use projects) that can be implemented to reduce
the overall campus demand for steam and electricity. Above and beyond the end-use reductions,
however, consideration of how the campus steam and electrical energy is produced and delivered
may result in significant additional cost and reductions in emissions. Efficiency improvements in the
supply and distribution of these energy sources are critical in the reduction of GHG emissions.
3.3.1 Cooling Strategy
Haverford currently has most of their academic, administrative and athletic facilities air conditioned
on campus and
the desire to
provide air
conditioned
buildings
continues to
rise. Most of
the buildings
have individual
chillers installed
that serve the
building they are
located in.
There is not a
central chiller
plant for the
campus at this
time and the
increased chiller capacity of independent systems leads to
increased refrigerant emissions and reduced operating efficiency
Figure 3-4 Cooling Systems – Energy Operating Costs
Haverford College Climate Action Plan | Mitigation Strategies 15
since the cooling systems are not operating at peak load most of the summer. Figure 3-4 on
previous page shows the cost per 1000 ton-hour for different cooling system technologies. The
largest chiller system on campus is located in the Science Center and is the most efficient system,
Centrifugal Water Cooled chillers operating at $64 per 1000 ton-hour. The campus also has a
number of air cooled screw and reciprocating chillers, direct cooling (DX) rooftop equipment and
window air conditioning units. Haverford’s gross square footage has steadily grown over the years
and with the growth came an immediate requirement for additional cooling capacity. The expansion
has resulted in individual cooling systems scattered throughout campus and the de-centralized
strategy for campus
cooling.
Additionally, there
have been many
older buildings
which have been
retrofitted for
cooling with smaller
air-cooled and/or
direct expansion
(DX) systems and
window air-
conditioning units.
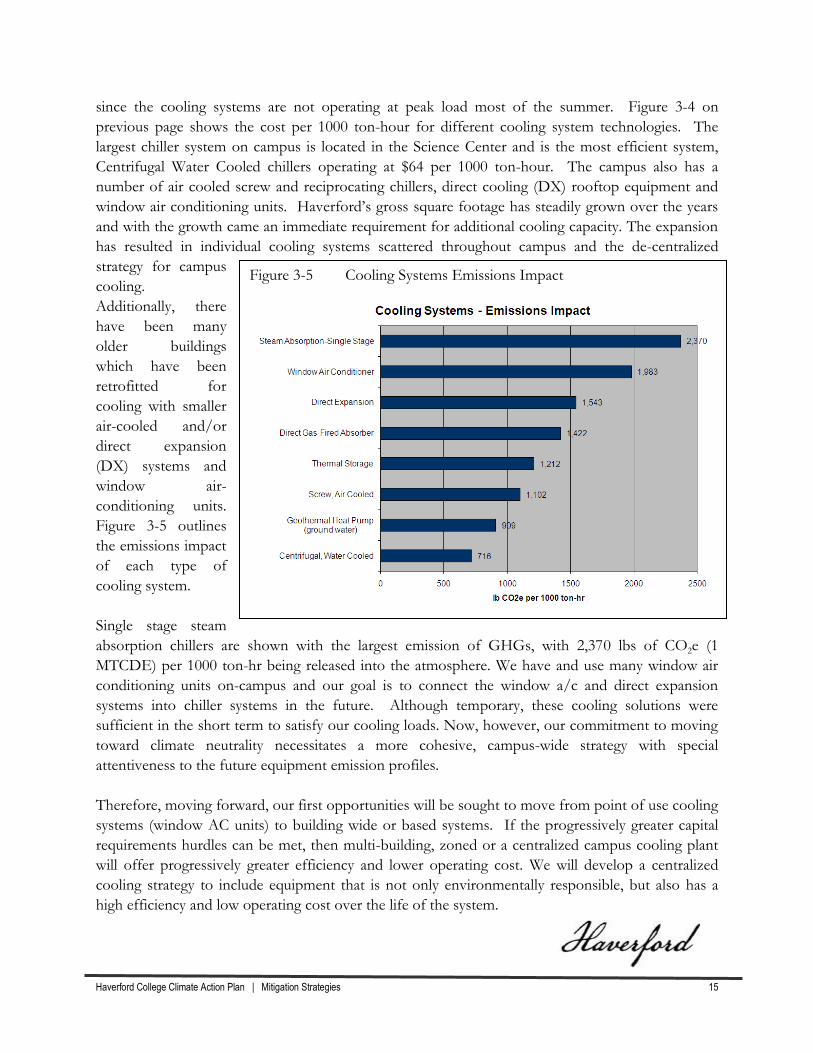
Figure 3-5 outlines
the emissions impact
of each type of
cooling system.
Single stage steam
absorption chillers are shown with the largest emission of GHGs, with 2,370 lbs of CO2e (1
MTCDE) per 1000 ton-hr being released into the atmosphere. We have and use many window air
conditioning units on-campus and our goal is to connect the window a/c and direct expansion
systems into chiller systems in the future. Although temporary, these cooling solutions were
sufficient in the short term to satisfy our cooling loads. Now, however, our commitment to moving
toward climate neutrality necessitates a more cohesive, campus-wide strategy with special
attentiveness to the future equipment emission profiles.
Therefore, moving forward, our first opportunities will be sought to move from point of use cooling
systems (window AC units) to building wide or based systems. If the progressively greater capital
requirements hurdles can be met, then multi-building, zoned or a centralized campus cooling plant
will offer progressively greater efficiency and lower operating cost. We will develop a centralized
cooling strategy to include equipment that is not only environmentally responsible, but also has a
high efficiency and low operating cost over the life of the system.
Figure 3-5 Cooling Systems Emissions Impact

Haverford College Climate Action Plan | Mitigation Strategies 16
We anticipate that multiple zoned or district cooling plants will be developed on the main campus.
These plants would be zoned by geographic location and would provide flexibility and redundancy
for the campus cooling systems. By connecting buildings to a district cooling plant the installed
capacity (tons of cooling) can be reduced through the benefit of system diversity. This strategy will
reduce emissions by reducing the tons of refrigeration capacity on campus and the district chiller
systems will be energy efficient cooling systems that operate within a peak range of efficiency.
3.3.2 Central Steam Plant Opportunities
Currently, the central steam plant at Haverford provides low pressure steam (22-35 psig) for building
heat (winter season) and domestic hot water generation (year-round). There are four steam boilers
(3x350BHP and one 100BHP) which run on dual fuel (natural gas and #2 fuel oil). The 100BHP
steam boiler is non-functional and abandoned in place. Approximately 69,419 MMBTU of fuels
were consumed at the central steam plant during FY 10/11, totaling nearly $554,000 in energy costs
and generating approximately 3,746 MTCDE in greenhouse gas emissions.
3.3.2.1 Reduction in Steam Distribution Pressures
Our central steam plant currently operates year-round providing 22-35 psi steam throughout
campus. Typically, central plants tend to deliver steam at higher pressures, so that when pressure
reduction strategies are employed, an energy and associated environmental benefit are realized. In
our case, this has already been done, so no further reduction in delivery pressures can be made.
3.3.2.2 Summer Shut-down of Central Steam Plant
Our non-heating season steam profile
was analyzed to determine the
approximate boiler and distribution
system losses which occur while
operating the central steam plant
during summer months, as shown in
Figure 3-6. The analysis revealed
approximately 60% of the energy
consumed by the summer operation
of the steam plant was lost through
distribution and/or boiler operation.
We are evaluating the de-
centralization of summer processes,
process and domestic hot use to
facilitate a shut-down of the steam
plant operation during summer
months. Localized domestic hot
water, kitchen and VAV reheat
Figure 3-6 Non-Heating Season Steam Profile

Haverford College Climate Action Plan | Mitigation Strategies 17
equipment would be installed at each building. Use of heat recovery chillers would be made at
certain locations to supplement building re-heating demands during summertime.
With moving forward with the decentralization of the heating plant for summer operation, we
estimate that 8,700 MMBTU’s, or approximately 462 MTCDE emissions, would be avoided
annually.
3.3.3 Evaluation of Fuel Alternatives
Fuel selection can be a key component to the reduction of our carbon footprint. For each fuel
source used to generate energy on-campus, the CDE released per MMBTU varies greatly. In
addition, the unit costs of fuels are market driven and can fluctuate daily if a long term purchasing
agreement is not in place.
Figure 3-7 summarizes
both unit cost and
emissions per MMBTU
of energy for each fuel
source. Both of these
factors can greatly
influence our decision
with regard to fuel
selection. Fuel oil (#2)
and natural gas are used
as a thermal energy
source for our main
steam plant as well as at
other independent
locations throughout
campus. Other than
coal, fuel oil has the
highest emissions profile
of the fossil fuel sources primarily available. Fuel oil #2 and #6 emit approximately 161 and 174 lbs
of CO2, respectively, for each MMBTU consumed.
In the United States, 70% of our fuel oil is imported. That percentage is likely to continue to
increase and along with world-wide demand increases, cause rising costs and market volatility in the
future. The use of fuel oil as an energy source for steam boilers often requires emissions to be
closely monitored and, in many cases, emission control equipment to be installed. Throughout
FY10/11 Haverford paid an estimated $22.68/MMBTU for #2 fuel oil at the steam plant and
$23.78/MMBTU for #2 fuel oil at the independent locations. Fuel oil selection at many institutions
is a continuous trade-off between emissions reduction and cost. As we move toward climate
neutrality, we will pursue the reduction and eventual elimination of use of #2 fuel oil as a fuel source
Figure 3-7 Unit Cost & Emissions per MMBTU

Haverford College Climate Action Plan | Mitigation Strategies 18
to reduce greenhouse gas emissions per MMBTU of energy consumed.
Natural gas is the cleanest fossil fuel available, with approximately 117 lbs of CO2 being emitted for
each MMBTU consumed. Current pricing and availability have recently made this the most
attractive fossil fuel source for many institutions, including Haverford. Haverford College has in
place long term contracts for both its electric and natural gas commodities. Haverford College
utilizes natural gas as the thermal energy source for the main steam plant, accounting for 96% of
campus heating load and oil is only used in rare instances as a back up at the main steam plant and in
a handful of small building boilers. The drawback to using natural gas as a primary fuel source is
that, similar to fuel oil, natural gas is non-renewable. The quantity of natural gas available is fixed
and the amount being consumed throughout the world is rapidly increasing. Throughout FY10/11
Haverford paid an estimated $8.04/MMBTU for natural gas; however, as history has shown, this
unit cost can dramatically fluctuate with market conditions.
There are many options available as alternatives to fossil fuels, including biomass fuels. The most
beneficial advantage of switching to a renewable fuel source is the dramatic reduction in greenhouse
gas emissions as compared to fossil fuels. Fossil fuels, when burned during the combustion process,
give off large amounts of carbon
dioxide, along with carbon
monoxide, nitrogen oxides, sulfur
dioxide and particulate matter.
These emissions contribute to the
diminishment of the earth’s ozone
layer, increased acidic soil and
water, and many other destructive
environmental factors. Biomass
fuels are organic materials made
from plants and animals and include
wood, crops, manure and some
garbage. The biomass contains
stored energy and when burned, the
chemical energy is released as heat.
Direct combustion of biomass
works very well for generation of
thermal energy (steam or hot
water). The emissions from burning waste wood products is far less (and more environmentally
friendly) than fossil fuels. Limited amounts of sulfur and nitrogen oxides are released and the
carbon that is emitted to the atmosphere is generally absorbed by photosynthesis in new wood
growth.
We recognized the potential opportunity to significantly reduce our climate or environmental
footprint with the utilization of biomass as an alternative fuel.
Therefore, we evaluated biomass alternatives for both the thermal
and electric applications at the central steam plant. Results from

Haverford College Climate Action Plan | Mitigation Strategies 19
the analysis indicated the support infrastructure for biomass (woody biomass chips) in the area
surrounding Haverford was good and the cost of biomass on a BTU basis was comparable to
hydrocarbon fuels, although more expensive then natural gas. As shown in Figure 3-7 (above), it is
estimated the biomass fuel could be purchased for a cost of $10/MMBTU (based on $25 per
delivered ton).
The biggest challenge to switching to a biomass fuel source is the logistics due to the location of the
existing boiler plant. Taking into account the transportation challenges with the location of the
existing boiler plant, it was determined that at this time switching our central plant to a biomass
facility was not feasible. The increase in truck traffic on-campus is deemed to be a safety issue, as
well as a nuisance, and would burden our transportation infrastructure.
3.3.4 On-Campus Electricity Generation
Our regional electric grid utility asset mix is moderately carbon intensive. Coal, with the highest
emissions profile of any fossil fuel, is the number one fuel source for power plants in Pennsylvania
(45%). The carbon intensity of the grid supplied electricity in the PJM/RFCE zone averages 1.15
pounds of CO2e per kWh. Through a strategy of generating our own power with zero or lower
carbon intensity, we can significantly reduce our carbon footprint when compared to buying grid
power. The reduction of purchased grid power will ultimately play a major role in the College’s
move toward carbon neutrality. During our analysis, we primarily focused on two power generation
strategies for the College’s campus: co-generation and renewable energy opportunities.
3.3.4.1 Co-Generation
Co-generation involves the simultaneous production of electricity and thermal energy, which allows
for high efficiency in fuel conversion when concurrent thermal and electrical loads exist. Co-
generation of steam and electricity is far more efficient than separate production of either on a
stand-alone basis. An increasingly common co-generation
technology is the integration of a steam turbine into a
steam boiler and distribution system. Steam turbines are
commonly utilized as pressure reducing stations in systems
where steam is generated at a high pressure and distributed
at a lower pressure. The steam system at Haverford is rated
to generate high pressure steam (150psi); however, it is
currently generated and delivered at low pressure (22-35
psig) to be utilized for the building heat and/or domestic hot water application.
We have investigated the installation of a small pressure reducing steam turbine into the steam main
to extract electrical power. Preliminary analysis predicted that a steam turbine installed at the central
plant could generate approximately 700,000 kWh annually when the boilers are operated at a higher
pressure. This would result in a GHG emissions reduction of 365 MTCDE annually, but had a
payback period of 15+ years. Although the electrical generation of this system will be reduced by
the non-heating season decentralization of the plant we believe this
system is still viable for the campus as the campus expands. We
recommend this project is considered in the future as the campus

Haverford College Climate Action Plan | Mitigation Strategies 20
heating (steam) load increases due to the planned growth of the Master Plan.
In addition to the steam back pressure turbine proposed
for the central plant, we also evaluated opportunities for
Combined Heat & Power (CHP) and Combined Cooling
Heat & Power (CCHP) for the campus. In order for
these systems to be cost effective they need to have a
constant base load where the heat that is reclaimed from
the engine jacket and exhaust stack is put into the
building heat system, domestic hot water (DHW) or
cooling applications. Based upon the results of the
building evaluations, the best opportunities for Combined Heat & Power and CCHP exist at the
Marian E. Koshland Integrated Natural Sciences Center (CCHP) and the Dining Center (CHP).
Overall we anticipate that a 250 kW CCHP and a 65 kW CHP system could be installed to reduce
the long term operating costs and resulting emissions for the College. The projects identified would
yield a reduction of approximately 1060 MTCDE annually.
3.3.4.2 Renewable Energy Opportunities
Renewable energy is energy generated from natural resources such as sunlight, wind, water and
geothermal heat. ‘Renewables’ are undoubtedly the next generation in source energy because, unlike
the earth’s limited supply of fossil fuels, natural resources are readily available and naturally
replenished. In the past, the transition to renewable energy versus fossil fuels has been slowed by
high first costs to install the infrastructure. Many commercial and institutional customers were
deterred by the low return on investment and 50+ year payback projections. Today, however, the
economics of installing and operating these unique renewable energy systems has changed. Local,
state and federal grants along with wide-spread tax incentives and depreciation benefits have
inspired many organizations to take a second look at the renewable energy alternatives to purchasing
grid power. Additionally, the de-regulation of Pennsylvania’s electric markets will indisputably
reduce the payback period of installing renewable energy systems. With the incentives listed above,
and our commitment to climate neutrality, the evaluation of renewable energy opportunities was
inevitable.
The first and most promising renewable energy technology
that was evaluated was photovoltaic or solar electricity. The
sun's energy has the ability to produce electricity without
emissions, moving parts or fuel. Photovoltaic (PV) cells,
made of very pure semiconductor grade silicon, are used to
generate an electrical current when photons of sunlight knock
loose electrons on the PV cell. The photovoltaic effect
produces DC (Direct Current) electricity, which is converted
to AC (Alternating Current) by an inverter. The PV arrays are interconnected with the electrical grid
in order to allow for net metering when the quantity of electricity
produced does not match the demand required.
Solar Thermal Solar Thermal
CollectorCollector
Control Room Control Room
ElectronicsElectronics
Natural Gas Natural Gas
Engine/GeneratorEngine/Generator
250kW250kW
Absorption ChillerAbsorption Chiller
80 Tons (optional)80 Tons (optional)
Solar Solar
PanelsPanels

Haverford College Climate Action Plan | Mitigation Strategies 21
A consultant was retained to evaluate the most effective locations to install photovoltaic arrays on-
campus. The analysis yielded three locations which would serve as ideal candidates for installation
of PV arrays. The recommendation was to install a 250kW array on the Alumni Field House roof, a
122kW array on the Douglas B. Gardner Integrated Athletic Center, and a 1MW ground mounted
array in the open space of the Ryan Pinetum. In total, the campus would have 1.472 MW of
photovoltaic panels connected for electrical generation. It is estimated, based on regional weather
data, that these arrays would produce approximately 1.685 million kWh annually. This translates into
a reduction in greenhouse gas emissions of approximately 931 MTCDE annually. Additional PV
opportunities exist on campus, as well as the potential for future installation on new construction
projects. The three presented here are the best opportunities that were identified.
Wind and solar thermal technologies were also evaluated for implementation into existing campus
buildings. Wind energy is the conversion of airflow into electricity by use of a wind turbine. Wind
turbines generally range anywhere from 600kW to 5MW in size and electricity generation is a direct
function of wind speed and volume in a region. Therefore, prior to installation of a wind turbine,
careful analysis of the wind power density of the specific location is crucial to establishing
effectiveness of wind turbine placement. It was determined from preliminary analysis of
Haverford’s campus location that a wind turbine was not a viable option for renewable energy at the
current time due to lack of a consistent wind resource on the campus. In addition, the aesthetic
impacts of turbines are a concern when considering this option.
Solar thermal applications use radiation from the
sun to produce heat energy. The most common
applications of solar thermal energy are heating
swimming pools, domestic water heating, and space
heating for buildings. A solar hot-water panel uses
the sun's energy to heat the fluid, which is then
transferred to a storage vessel. Solar thermal
applications would be viable at Haverford, and will
be considered for incorporation in any new
construction and/or major renovations going
forward.

Haverford College Climate Action Plan | Mitigation Strategies 22
3.4 End-Use Mitigation Strategies
3.4.1 Lighting
Our total electric consumption for FY 10/11 was 15.1 million kWh. Due to the limited building
electrical sub-metering, it is difficult to determine exactly how much of the total campus electrical
consumption can be attributed to lighting. However, we estimate that approximately 25 - 30% of
our overall electrical consumption, or approximately 3.78 million kWh of electricity at a cost of
$354,850 per year, is attributable to campus lighting. The STONE HOUSE GROUP conducted a
careful analysis during building walkthroughs of the
existing lighting technologies, hours of operation,
daylighting opportunities, lighting controls,
maintenance strategies, and lighting power
densities. It was determined that the lighting
technologies currently installed at Haverford vary
greatly from building to building; however, most of
the observed fixtures were already relatively energy
efficient. Two buildings, Chase Hall and Ryan
Gymnasium, were identified as having T-12 and
metal halide fixtures, and a recommendation to
upgrade those fixtures immediately was made. In a
majority of the academic, administrative and residential spaces the lighting has switched control and
no occupancy sensors had been retrofitted to the space. Campus-wide installation of occupancy
sensors for lighting and heating controls will be pursued. It was estimated that as a result of the
occupancy sensor retrofit approximately $15,000 will be saved annually, resulting in a greenhouse
gas emissions reduction of approximately 84 MTCDE.
3.4.2 Heating Ventilation and Air-Conditioning
The HVAC systems installed throughout campus
vary greatly from building to building. A majority
of the academic and administrative buildings are
mechanically heated and cooled through a variety of
systems including, steam and hot water perimeter
radiation, variable air volume and fan coil terminal
reheat units, air-handling and rooftop units for
ventilation with steam, hot water, and chiller water
coils and some direct expansion cooling. Heating is
provided by steam or hot water perimeter radiation
in most cases.
Haverford College Climate Action Plan | Mitigation Strategies 23
3.4.3 Retro-Commissioning
Although in most cases, the buildings on Haverford’s campus are not individually metered, it is
estimated that the Athletic Center and the Science Center are the most energy consuming buildings
on campus. The high energy consumption is due to the large amounts of outside air being brought
in for required ventilation in the laboratory spaces. Review of the HVAC systems for these
buildings indicated a number of systems that were not operating properly therefore increasing
energy use in the buildings. Retro-commissioning is the process of inspecting and testing the
sequences of operation of the HVAC systems to ensure they are operating as designed and intended.
Through the retro-commissioning process control enhancements can be made to optimize energy
performance and to implement new technologies that were not available when the buildings were
constructed. The College plans to re-commission all of the energy intensive buildings / systems on
the campus over the next 10 years to ensure the systems are operating at their peak efficiency.
3.4.4 Building Automation System Upgrades
The College does a very good job of controlling the energy use in the buildings through aggressive
equipment scheduling and temperature setbacks during unoccupied periods. However, there are a
number of limitations with the existing Automatrix BAS and there are control enhancements that
can be made to the HVAC systems to allow for more optimized control of our energy use. The
energy projects identified during the audit are detailed in the Energy Capital Investment Plan and
include the following:
Occupancy sensors to control HVAC systems
Variable frequency drives for constant flow pumps and fans
Improved sequences of operation for systems via demand controlled ventilation of
outdoor air or morning warm-up / cool-down cycles.
Cooling plant optimization through lead / lag chiller staging and condenser water
optimization
Installation of programmable thermostats
Optimization of heat recovery wheel operation
Installation of variable geometry dampers on exhaust stacks in Science Building to save
exhaust fan energy
Many of the control projects identified have very quick payback periods and are important to reduce
the base load energy consumption of the campus. The projects are described more fully in Appendix
B.
3.4.5 Holiday Curtailment and Scheduling Initiatives
Holiday Curtailment Programs or rollback programs occur when we aggressively reduce building
temperatures during holidays (e.g. Winter & Spring Breaks). Greenhouse gas emissions reductions
are estimated at 15 - 20 percent during the curtailment period. Analysis of our energy consumption
for FY 10/11 reveals that approximately 50 MTCDE emissions could be avoided via holiday
curtailment programs.

Haverford College Climate Action Plan | Mitigation Strategies 24
Campus Wide Temperature Reductions and Building Scheduling may result in additional reduction
in GHG emissions. While not exact, a rule of thumb is that for every degree a thermostat is lowered
in the heating season results in a fuel savings of approximately one percent. We at Haverford have
instituted a fairly aggressive scheduling and temperature control program however we will evaluate
those areas where improvements could be made. Estimates of emissions reductions are
approximately 2.5%, or approximately 350 MTCDE depending on how aggressively we choose to
schedule buildings while balancing the need for access.
3.4.6 Geothermal Heat Pumps
Geothermal heat sources, more correctly known as ground source heat pumps, were evaluated as
part of our net climate neutral strategy. Consideration was given to the current costs of fuels (both
electricity and fossil fuels on an energy equivalency [MMBTU] basis), risks associated with open well
systems verses efficiency losses of closed loop systems, as
well as to efficiencies that are created by an ability to
connect to the central physical plant. Using calculation
methodology set forth by J Hanova and H Dowlatabadi in
their study entitled Strategic GHG reduction through the use of
ground source heat pump technology and published by the
Institute of Physics in its Environmental Research Letters
(Environ. Res. Lett. 2 (2007) 044001 (8pp)), it was
concluded that at current fuels costs, with the ability to
connect to the physical plant, the installation of ground
source heat pump systems are not a financially attractive
option. However, at stand alone small buildings that are not able to connect to the central heating
plant, it may well prove advantageous to install ground source heat pump technology at some or all
of these structures as they need to be renovated, as deferred or cycle maintenance dictates, or as a
study/research opportunity. Efficacy of ground source heat pumps will continue to be evaluated
going forward, as continued cost escalation of fuels could make this technology more financially
attractive.
3.5 Other Campus Related Greenhouse Gas Mitigation Strategies
3.5.1 Fugitive Emissions Refrigerant Fluids
Haverford College, like most Colleges, has a substantial cooling load on campus. These refrigeration
and cooling demands have their attendant quantities of HFC (hydro fluorocarbon) refrigerants
installed on campus and their resulting emissions. Future growth on-campus will require additional
cooling capacity consistent with campus standards. As demonstrated in the functional distribution
chart in Section 2, emissions from this source comprise 1 percent, or 127 MTCDE, of overall GHG
emissions. It is anticipated that if and when additional chilled water capacity is needed/added, that
equipment efficiency, longer equipment life cycles, and decreased fugitive emission rates would
result in a zero net increase of GHG emissions from this source. Further, we are committed to the
procurement of air conditioning equipment with environmentally
responsible refrigerants, those with the lowest possible global

Haverford College Climate Action Plan | Mitigation Strategies 25
warming and ozone depleting potentials possible. At this time, we anticipate that the emissions from
refrigeration sources to be de minimus and will be neutralized via the purchase of offsets.
3.5.2 Faculty/Staff and Student Commuters
Emissions from faculty, staff and student commuting to and from campus fall within our GHG
inventory boundaries, and such commuting is part of the current way of life. We also recognize that
changing the way we view commuting and how we approach changing habits and lifestyles with
regard to this issue may be one of the most difficult challenges we face. Our emissions with regard
to commuting are a factor in our environmental footprint. As demonstrated in the functional
distribution chart in Section 2, emissions from this source comprise 6 percent or 821 MTCDE of
overall GHG emissions.
Currently we have access to two (2) different SEPTA rail lines and one (1) SEPTA bus line.
Additionally, the Blue Bus, a free campus shuttle available to all faculty, staff, and students provides
transport between Haverford, Bryn Mawr and Swathmore College. As an incentive to encourage the
use of public transportation, the College has in place a TransitChek commuter benefit program that
the College offers to employees to help with the cost of commuting on public transportation.
Additional mitigation strategies to be considered include the following: adding more stops to the
Blue Bus schedule that provide access to conveniences such as malls, pharmacies, and grocery
stores, partner with car share programs (i.e. Zip Car) or rental car agencies to reduce the number of
vehicles on-campus, work with SEPTA to provide discount fares for Haverford staff faculty and
students to encourage ridership, create incentives for carpooling, vanpooling and local bus use, and
create a web-based tool to facilitate carpooling. Additional strategies include reserving desirable
parking spaces for hybrids, electric vehicles and/or carpools, encourage telecommuting and/or
compressed work schedules where appropriate, and develop a “parking diet” to phase out parking
spaces needed on campus. The estimate
of GHG emissions avoided through
implementation of some or all of the
above strategies is estimated at 10
percent or 82 MTCDE over the next ten
years based upon 2009 mileage and fuel
economy figures. We expect that future
regulatory actions with regard to vehicle
fuel economy, changes in how we live
and commute, as well as other as yet
unforeseen technological advances may
well drive the avoided emissions up
another 5 to 10 percent.

Haverford College Climate Action Plan | Mitigation Strategies 26
3.5.3 Institutionally Sponsored Air Travel
As is demonstrated by the functional distribution chart in Section 2, our GHG emissions from
institutionally sponsored air travel comprises 3 percent of overall GHG emissions, or 398 MTCDE.
Institutionally sponsored air travel is part of the campus life here at Haverford, and is directly tied to
our sports programs, our encouragement of faculty in their continuing education via attendance of
conferences and seminars, and as a way we stay connected to research, projects, colleagues and other
colleges and universities. As we recognize that air travel has a greater effect on global warming as
high altitude emissions have a greater effect
with radiative forcing, cleaner fuel sources and
technologies will be developed. We will also
further investigate attending meeting and
seminars on the world-wide-web as means of
reducing our air travel while staying
connected. However, at this time, we
anticipate that emissions attributable to air
travel will be neutralized via the purchase of
offsets.
3.5.4 Solid Waste
We generated 1,175 short tons of waste in FY 10/11. Sixty seven percent (67%) of the waste is
disposed of at a waste to energy (WTE) plant for incineration. A waste to energy plant convert’s
waste to energy; which then produces electricity. Because the waste is not landfilled, it does not
generate methane and thus GHG emissions are avoided. Thirty-three percent (33%) of our waste is
landfilled and does generate GHGs in the form of methane. We were unable at the time of this
writing to determine whether or not that methane is flared or otherwise recovered, so we assumed
that the gas was untreated and eventually vented to atmosphere. Because of its beneficial re-use, our
waste disposed of at the WTE plant generates an offset or reduction in emissions, which reduces
our emissions from solid waste disposal to 252 MTCDE. We remain committed to minimize our
overall waste generation to reduce our broader environmental footprint.
Our grounds department conducts a composting program, which diverts approximately 277 tons per
year of lawn/grounds waste to the composting stream as opposed to disposal at a landfill or WTE.
This activity generates an emissions avoidance of 106 MTCDE. The College is currently studying
the logistics of potentially composting Dining Center food waste. The challenge of food
composting is an issue the college hopes to address in the future.
3.5.5 Transmission and Distribution Losses
As noted in Section 2, this sector is a subset of electricity and is generally not accounted for in the
electricity sector. The purchase of green power or RECs does not mitigate emissions associated
with transmission and distribution losses, as regardless of the type of electricity consumed, there are
losses inherent in the process of conveying electricity to the College. GHG emissions for this sector
are 761 MTCDE, or 5 percent of our overall GHG emissions.
Transmission and distribution (T&D) losses are generally

Haverford College Climate Action Plan | Mitigation Strategies 27
estimated at nine percent of the end use consumption of electricity. Due to the employment of
mitigation strategies above, we estimate an overall electrical emissions reduction of approximately
1,631 MTCDE. The concurrent reduction in emissions attributable to T&D losses will be
approximately 147 MTCDE.
3.5.6 Campus Fleet
Haverford, like any institution of higher education, has need of a fleet of vehicles, a necessity for
maintenance of lawns, buildings, and roads. Our fleet includes different pieces of equipment from
trucks to lawn care and snow removal implements. As demonstrated in the functional distribution
chart in Section 2, campus fleet emissions are 143 MTCDE and comprise one percent of our
greenhouse gas emissions. Mitigation strategies include increasing the number of electric vehicles in
the fleet, the use of B-20 biodiesel fuel where applicable for at least six months of the year, increase
the fuel economy of gas-powered vehicles, simplify/combine delivery and trash/recycling routes on
campus, centralize vehicle purchasing to maximize capital for “greener” vehicles, develop a vehicle
sharing system across departments to reduce rentals, develop a transportation purchasing policy to
set “greener” standards, and encourage the president to purchase a hybrid vehicle as a means of
demonstrating Haverford’ commitment to the environment. Emissions avoidance estimates are 10
percent or 14 MTCDE.
3.5.7 Agricultural Sources
Very little agriculture activity that has emissions implications takes place on-campus, and is limited
to the application of fertilizers on athletic fields. Emissions associated with this agricultural activity
totals 14 MTCDE. While the potential exists that an alternate fertilizing strategy could be employed,
or that all athletic fields could be converted to a synthetic substitute such as an infill field, we
anticipate that this de minimus source of emissions will be neutralized via the purchase of offsets, as
this is economically the more attractive solution to a comparatively small issue with regard to GHG
emissions.
3.5.8 Green Building
Haverford has implemented a green building policy for all new construction and renovation on
campus. This policy states that all new and renovated projects shall achieve the equivalency of a
LEED Gold certification. Typically, LEED-like projects result in a 30 percent energy reduction as
compared to a baseline model as set forth by ASHRAE. As of this
writing, the campus energy consumption per GSF at Haverford is 96
MBTU or 96,000 British Thermal Units (BTU) per GSF. We
acknowledge that newer buildings with code required outdoor air
minimums may use more energy than some of the older buildings on
campus. In light of that, we anticipate that green building measures
would reduce energy consumption to 80 MBTU/GSF on an average.
Over the course of the next 40 years, we anticipate that a majority of

Haverford College Climate Action Plan | Mitigation Strategies 28
the existing building stock at the campus will be renovated to LEED standards as well. This would
result in a reduction of approximately 2,170 MTCDE by 2050.

Haverford College Climate Action Plan | Mitigation Strategies 29
3.5.9 Offsets
As stated in sections above, we do anticipate the purchase of offsetting products to manage those
items we cannot reduce to climate neutral via technological, behavioral, and policy changes we will
implement. With that said, it is our goal to reduce our emissions through all other means before the
purchase of additional offsets, whether they are verified emissions reductions (VER) or certified
emissions reductions (CER).
Our mitigation project reductions, assuming the implementation of the above referenced GHG
reduction strategies, is presented in Figure 3-9, Emissions Profile: Post CAP Strategies
Implementation.
As stated above, we desire to reduce, reuse and recycle, as well as implement other identified
mitigation strategies, prior to undertaking the use of offset instruments to attain a climate neutral
status. Understanding this, we also realize that at some point we must purchase offset instruments
in order to attain net climate neutrality. When considering offsetting, we must consider the type and
quality of offset instrument we purchase. We must take into consideration the following factors:
Figure 3-9 Emissions Profile: Post CAP Strategies Implementation

Haverford College Climate Action Plan | Mitigation Strategies 30
• Additional- Non BAU or wouldn’t have otherwise occurred.
• Not Cause Leakage: when action is taken for a particular project it does not cause an
increase in emissions elsewhere.
• Must pass a Barriers Analysis, which is where it must be proved that a significant
impediment to a project (financial, regulatory, etc.) has been surmounted.
Real - Sourced from Tangible Projects that have occurred or will imminently occur
• Measurable - Reductions are Objectively Quantifiable
• Permanent – Reductions unlikely to be reversed, with reversals immediately replaced
• Verifiable – Third Party Verified to a set Standard
• Enforceable – Backed by Legal Instruments; Defines Creation, Transparency, Exclusive
Credit Ownership
At the time of this writing, the United States is a voluntary compliance market for offsets, meaning
that there is no regulatory mechanism in place to date. An excellent example of a regulated market
is that of the European Union; which is a signatory to the Kyoto Protocol. Under the regulatory
scheme of the Kyoto Protocol and the European Trading System (ETS), emissions limits are set,
and offsets may be purchased to meet emissions reduction goals. The available type and quality of
offsetting instruments is regulated by the Kyoto Protocol and its governing bodies. Basically there
are two types of available offsets: Clean Development Mechanism (CDM) and Joint
Implementation (JI) projects. These two products are known in climate change parlance as Certified
Emissions Reduction (CER) offsets. Because the United States is a voluntary compliance
marketplace, other offsetting products are available and are known as Verified Emissions Reduction
(VER) offsets. All of the VERs are considered to meet the above listed bulleted items, however,
there are varying verification standards in use which may allow variance in what offsetting products
are verifiable, which may lead to some variability in quality of the offsetting instrument.
Costs of offsetting instruments also vary. The basic unit of tradable offset is the MTCDE. Cost
variance of offsets is dependent on the offset project type, location, verification standard and upon
market forces of supply and demand. At this time, costs of offsets range from about $4.50 per
MTCDE to approximately $16.00 per MTCDE. The following table provides a comparison
amongst RECs, VERs, and CERs:

Haverford College Climate Action Plan | Mitigation Strategies 31
Table 3-1 Offsetting Matrix

Haverford College Climate Action Plan | Educational, Research and Community Outreach Efforts 32
4. Educational, Research, and Community Outreach Efforts
This section of the CAP describes educational, research, and community outreach efforts aimed at
making climate neutrality and sustainability a part of the curriculum and/or other educational
experience for all students. It also documents efforts to expand research, community outreach
and/or other efforts toward achievement of climate neutrality.
4.1 Curriculum and other Educational Experiences
4.1.1 Current Offerings and Programs
Haverford College is committed to making sustainability an essential component of the educational
experience for all students. The College has already implemented a number of programs that
provide environmental educational experiences at many levels from academic majors to one-time
seminars. Haverford College, in collaboration with Bryn Mawr and Swarthmore Colleges,
established a Tri-College Environmental Studies program in the Fall 2011. Students are introduced
to concepts of sustainability in the introductory course to the minor, which is co-taught with a
scientist and non-scientist. Additional coursework addressing sustainability is also offered in the
physics, chemistry, anthropology and political science departments. The three colleges are actively
working to expand offerings in other department by providing funding for faculty course
development grants.
4.1.2 Service Learning Opportunities and Student Organizations
Several service learning opportunities exist at Haverford. Haverford is among the top colleges in the
nation regarding the proportion of students who participate in such experiences. While most have a
social and/or religious theme, some have explicitly environmental themes. For example, various
service learning volunteer opportunities exist which introduce engineering students to particular
projects. International volunteer experiences provide students with an opportunity to apply
engineering principles to assist low-income developing communities worldwide. These projects
often entail working directly with local community members for the design and construction of
schools, water supply systems and small-scale electrification projects using renewable resources.
Issues in sustainability are introduced during these projects and include the concept of the triple-
bottom-line. This includes understanding the need for protecting natural resources (environmental-
sustainability), using appropriate technology to solve local problems (socio-cultural-sustainability)
and building the capacity of local stakeholders for operation and management of infrastructure
projects (financial-sustainability).
4.1.3 Student Organizations
A number of student organizations have also been created around areas of interest generally tied to
sustainability. The Committee for Environmental Responsibility (CER) is a group of student
activists who participate in projects on campus, locally, and globally. Some examples include
conducting several petitions throughout the year to achieve
sustainability both on campus and in the State of Pennsylvania,

Haverford College Climate Action Plan | Educational, Research and Community Outreach Efforts 33
campus-wide initiatives such as a light bulb exchange, and participating in the annual Earth Day.
4.1.4 Student Orientation and Other College-wide Initiatives
All students are also exposed to issues of climate neutrality and sustainability through College-wide
initiatives. Over a 10-week period, schools report recycling and trash data which are then ranked
according to who collects the largest amount of recyclables per capita, the largest amount of total
recyclables, the least amount of trash per capita, or have the highest recycling rate. With each week’s
reports and rankings, participating schools watch how their results fluctuate against other schools
and use this to rally their campus communities to reduce and recycle more. Students helped draft
and promote the Green Office Program, an initiative designed to help departments reduce their
carbon footprint. The college also collected abandoned student bikes and donated them to the
Devereux Foundation for refurbishing. Devereux's bike program focuses on assisting
developmentally disabled individuals in the acquisition of the skills needed to secure successful
competitive employment in the community. Refurbished bikes are resold to students during the first
week of classes in September.
4.1.5 Planned Future Actions
Efforts are underway to make sustainability part of curriculum for all students and to increase the
variety of ways in which students can become involved in these issues.
4.2 Research
4.2.1 On-going Research
Haverford faculty and students in all four undergraduate colleges are involved in a wide range of
projects relating directly or indirectly to sustainability and climate change. For example, faculty
member Joshua Schrier received external funding for his research examining the nanostructure of
materials used in alternative energy devices and Helen White received funding to examine the fate of
oil from the Deepwater Horizon oil spill. With this and internal support, faculty are able to fund
research experiences for students during the semester and summer term.
4.3 Community Outreach
4.3.1 Planned Future Efforts
Future plans include continuing to develop pieces on climate neutrality and sustainability for the
College website and possibly printed media to inform and educate the Haverford community about
the initiatives on campus. These pages will be updated often to include a schedule of upcoming
events and to feature progress being made on campus to reduce carbon footprint.

Haverford College Climate Action Plan | Tracking Changes 34
5. Tracking Changes
5.1 Policy & Technical Changes
We anticipate that the future will hold changes that affect not only how we use energy, but how it is
generated and distributed. One area where we anticipate future change is the establishment of a
nationwide Renewable Portfolio Standard (RPS). It is anticipated that the Federal government will
require electrical generation utilities to ensure that a certain percentage of their generation assets are
from renewable sources such as wind, solar, or hydropower facilities. This RPS is a means to
encourage the development and use of renewable energy technologies on a commercial scale, and
will help reduce the carbon intensity of our electrical grid. As of today, many states have established
an RPS, and have targets that require greater percentages of renewable energy generation assets over
a given time period.
A second area of anticipated change is the implementation of GHG emissions standards and
limitations by the U.S. EPA, or the adoption of Cap and Trade legislation by the Federal
government. It is apparent that the EPA’s recent endangerment finding with regard to GHGs
would allow the six principle GHGs to be regulated under the Clean Air Act Amendments. This
would set emissions standards for GHGs on a nationwide basis, barring the adoption of Cap-and-
Trade legislation, which many would deem less of an economic burden than implementation of new
standards under the CAAA by the EPA.
Another anticipated development is the move toward distributed generation systems and the
development of a “smart grid”. Distributed generation is where smaller, more numerous, yet closer
to end user sources of electrical generation are used. This effectively puts the generation asset closer
to the end user, thereby reducing the T&D losses associated with our current grid system. Smart
Grid technologies are currently being researched and developed. It is hoped that the outcome of the
this process would be the intercommunication amongst generation and distribution points to better
allocate the use and availability of grid based assets, providing greater efficiencies and economy of
use.
Technological changes will likely have a great impact in the future. Bio-based photovoltaic cells and
fuels, carbon capture and sequestration technologies, advanced fuel cell technologies and efficiency
improvements of heating, cooling, electrical, and transportation equipment are likely to provide
sustainable alternatives to our energy needs. What form or within what timeframe these
technological changes will occur in is a matter for great anticipation and speculation.

Haverford College Climate Action Plan | Tracking Changes 35
5.2 Tracking Progress
The purpose of this section is to define, subsequent to the adoption of this Climate Action Plan
(CAP), a process by which we can track progress toward our goal of achieving net climate neutrality,
as defined in the ACUPCC Implementation Guide, Page 29, v1.0, dated September, 2007.
Assessment of progress toward this goal is not limited to the achievement of net climate neutrality
alone; it also includes a method by which we can determine our success integrating sustainability into
the fabric of the College and the community’s collective knowledge.
In order to follow our progress on our journey to net climate neutrality it is important that we have
a method by which to measure progress. As Peter Drucker has ingrained into our conventional
wisdom the paradigm that, what gets measured gets managed, this too holds true for our emissions
inventory. We endeavor to update our greenhouse gas emission inventory every other year. It is our
intention that with each new report the accuracy of the data contained in the inventory will be
subsequently improved. Along with the updated inventory, we will prepare a narrative reporting the
following:
Mitigation strategies undertaken
Campus emissions
A comparison of emissions with emission projections contained in the CAP
Explanations for significant difference between emissions and projections, and possible
remedies
Every five years the CAP will be reviewed more holistically to evaluate progress to date, but more
importantly to verify assumptions contained in the previous edition of the CAP are still valid. This
more detailed review of the CAP will also provide an opportunity for a review of changes in
technology, energy & environmental markets, and financing mechanisms. Most importantly this
review will allow for a re-evaluation of our ability to achieve our milestones and targets. Revisions
to the CAP including any modifications to milestones (to either earlier or later dates) will be
reported to the ACUPCC as part of this process.
5.3 Target Dates for Emissions Reductions
Based upon the implementation of the Campus Master Plan and upon the implementation of the
mitigation strategies as detailed above, Haverford will have reduced its emissions by 9 percent over
2011 emissions levels by the year 2017. Throughout this process, we anticipate beginning the
purchase of offset instruments to further our goal of net climate neutrality.
The Campus Master Plan projects increasing the size of the campus to 2.18 million GSF, and
provides housing, academic and campus life spaces that ensure that Haverford College remains a
premier facility and recognized leader for higher education. With this growth also comes the need
for increases in infrastructure and physical plant capacity. We understand the relationship between
energy consumption, campus growth, and greenhouse gas emissions continues to evolve, and will
further investigate energy conservation and reduction strategies. We also understand that in order to
achieve net climate neutrality, we assume that future technological
changes will help us attain our goal without excessive purchase of

Haverford College Climate Action Plan | Tracking Changes 36
offsetting instruments. In order to allow sufficient time to investigate our alternatives, and sufficient
time for technological and societal changes to take place, we have not set a date for net climate
neutrality at this time.

Haverford College Climate Action Plan | Assumptions 36
6. Assumptions
The following is a listing of assumptions and a priori conclusions that were used in the collection of
data, analysis of data, projection of future campus greenhouse gas emissions, and effects of
mitigation strategies, all of which have been included in the preceding climate action plan.
Assumptions are organized by section of this report.
6.1 Campus Emissions
College owned faculty housing were not included in the GHG emissions inventory, nor in the
energy audits conducted as part of this CAP.
Our business as usual and mitigation strategies as presented in this CAP reflect the fuel mix in use for FY 2011 at the central plant.
Air Travel is reported for student travel only, and does not reflect institutionally sponsored air
travel for faculty and or staff attendance at conferences, etc.
Commuting data was not collected for student to and from school and incidental personal travel
while living on-campus.
Commuting data for faculty and staff was calculated from home address zip code for each
faculty or staff member. Using the center of zip code to campus distance was determined to be
the most efficient method of calculating the commuter mileage. The average over all distance
commuted per trip was used in the CACP calculator.
Commuter travel was assumed to be 50 weeks per year.
Window unit air conditioners were assumed to have a per unit charge of 0.75 pounds of R-22
refrigerant.
Air conditioners and chiller systems were assumed to have a leakage rate of five percent per year.
Haverford College Climate Action Plan | Assumptions 37
6.2 Mitigation Strategies
Major mitigation strategies are estimated at full cost, inclusive of design and construction fees.
All mitigation strategy costs are figured in 2011 dollars and estimated annual savings are based
on FY 2011 unit cost of energy savings.
The emissions projection for on-campus stationary sources does reflect the potential remaining
emissions from faculty housing.
Each kW of proposed solar project is assumed to produce 1,100 kWh.
Installation costs for the proposed 1MW solar system is assumed to be $3.50/W and for the
smaller proposed projects is assumed to be $4.00/W.
We assume that the value of SRECs for the proposed solar systems to be $50/REC in years 1-15
of operation, and that the SRECs provided by Pennsylvania Alternative Energy Portfolio
Standard will be extended beyond its current life cycle.
Paybacks and benefits of solar projects assume a 3% energy cost escalation and a 0.5% panel
degradation rate.
For CHP and CCHP projects we assumed a cost of $2,000/kW installed, and operating up time
of 8,500 hrs/year.
6.3 Other/Miscellaneous
The presented Business as Usual Case set forth in Section Two utilizes the 2011 regional fuel
mix and electrical grid region as default values (eGrid Region RFCE). The associated emissions
values for these two items were subsequently normalized to MBTU per Gross Square Foot for
each of the two commodities, and projected growth in square footage and year was then applied
to generate the emissions growth model/projection of both on-campus stationary sources and
purchased electricity.
The presented Business as Usual Case as set forth in Section Two and the associated projection
that shows the effects of mitigation strategies in Section 3 has not been normalized for student
and faculty/staff growth. These numbers remain constant as we do not anticipate growing the
institution in term of these two factors. The FY 2011 values used are 1,177 full time students,
3,137 summer school students, 148 faculty and 394 staff.

Haverford College Climate Action Plan | Appendix A
Appendix A Greenhouse Gas Emissions Inventory
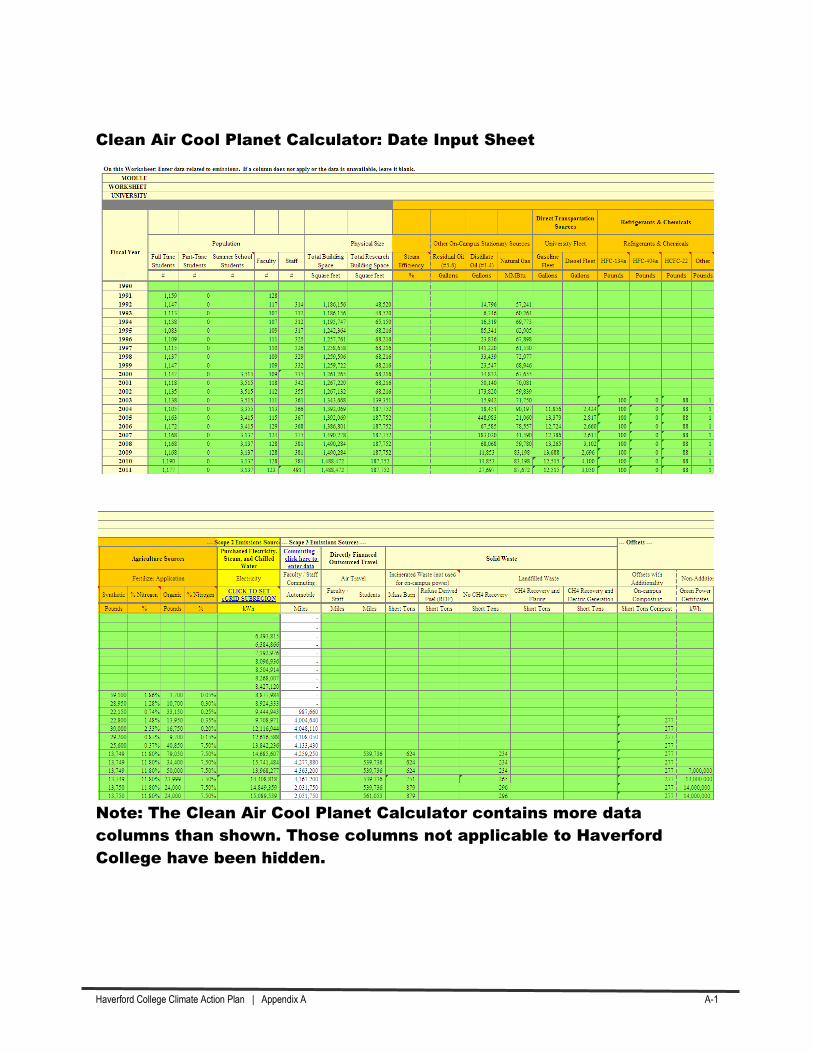
Haverford College Climate Action Plan | Appendix A A-1
Clean Air Cool Planet Calculator: Date Input Sheet
Note: The Clean Air Cool Planet Calculator contains more data
columns than shown. Those columns not applicable to Haverford
College have been hidden.

Haverford College Climate Action Plan | Appendix A A-2
Clean Air Cool Planet Calculator: Carbon Dioxide Equivalent Summary
Sheet
Note: The Clean Air Cool Planet Calculator contains more data columns than
shown. Those columns not relating to Haverford College have been hidden.

Haverford College Climate Action Plan | Appendix B
Appendix B Energy Capital Investment Plan
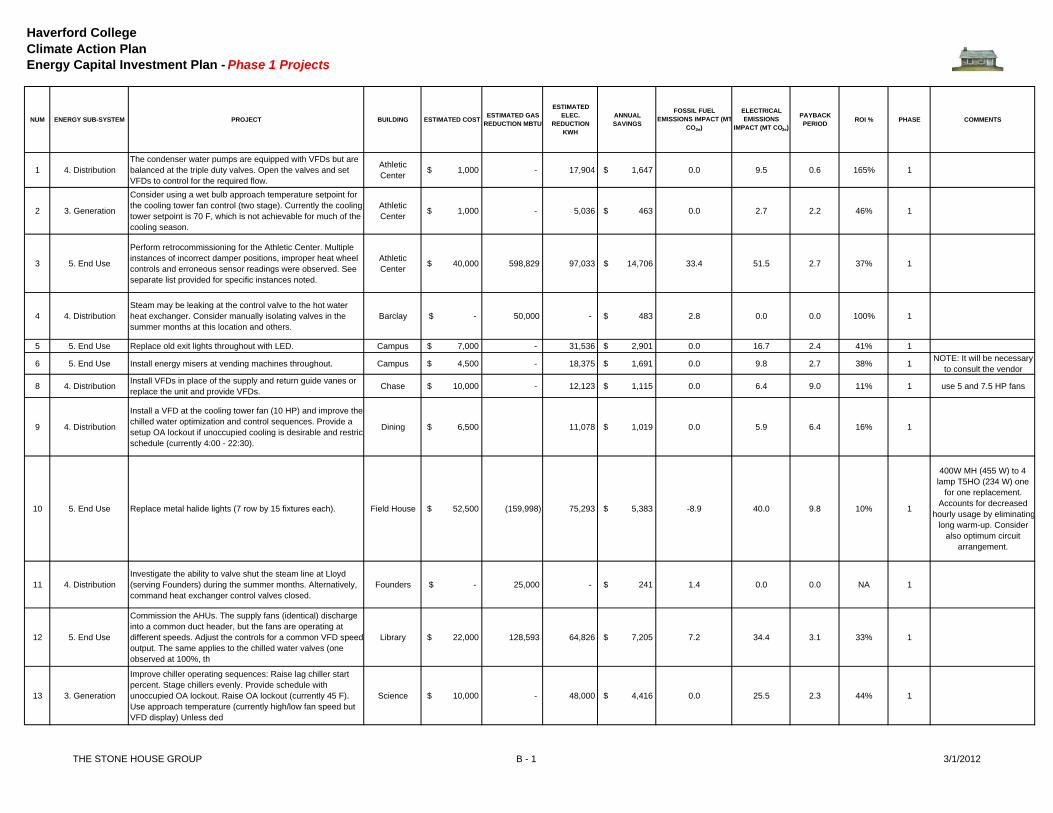
Haverford College
Climate Action Plan
Energy Capital Investment Plan - Phase 1 Projects
NUM ENERGY SUB-SYSTEM PROJECT BUILDING ESTIMATED COSTESTIMATED GAS
REDUCTION MBTU
ESTIMATED
ELEC.
REDUCTION
KWH
ANNUAL
SAVINGS
FOSSIL FUEL
EMISSIONS IMPACT (MT
CO2e)
ELECTRICAL
EMISSIONS
IMPACT (MT CO2e)
PAYBACK
PERIODROI % PHASE COMMENTS
1 4. Distribution
The condenser water pumps are equipped with VFDs but are
balanced at the triple duty valves. Open the valves and set
VFDs to control for the required flow.
Athletic
Center $ 1,000 - 17,904 $ 1,647 0.0 9.5 0.6 165% 1
2 3. Generation
Consider using a wet bulb approach temperature setpoint for
the cooling tower fan control (two stage). Currently the cooling
tower setpoint is 70 F, which is not achievable for much of the
cooling season.
Athletic
Center $ 1,000 - 5,036 $ 463 0.0 2.7 2.2 46% 1
3 5. End Use
Perform retrocommissioning for the Athletic Center. Multiple
instances of incorrect damper positions, improper heat wheel
controls and erroneous sensor readings were observed. See
separate list provided for specific instances noted.
Athletic
Center $ 40,000 598,829 97,033 $ 14,706 33.4 51.5 2.7 37% 1
4 4. Distribution
Steam may be leaking at the control valve to the hot water
heat exchanger. Consider manually isolating valves in the
summer months at this location and others.
Barclay $ - 50,000 - $ 483 2.8 0.0 0.0 100% 1
5 5. End Use Replace old exit lights throughout with LED. Campus $ 7,000 - 31,536 $ 2,901 0.0 16.7 2.4 41% 1
6 5. End Use Install energy misers at vending machines throughout. Campus $ 4,500 - 18,375 $ 1,691 0.0 9.8 2.7 38% 1NOTE: It will be necessary
to consult the vendor
8 4. DistributionInstall VFDs in place of the supply and return guide vanes or
replace the unit and provide VFDs.Chase $ 10,000 - 12,123 $ 1,115 0.0 6.4 9.0 11% 1 use 5 and 7.5 HP fans
9 4. Distribution
Install a VFD at the cooling tower fan (10 HP) and improve the
chilled water optimization and control sequences. Provide a
setup OA lockout if unoccupied cooling is desirable and restrict
schedule (currently 4:00 - 22:30).
Dining $ 6,500 11,078 $ 1,019 0.0 5.9 6.4 16% 1
10 5. End Use Replace metal halide lights (7 row by 15 fixtures each). Field House $ 52,500 (159,998) 75,293 $ 5,383 -8.9 40.0 9.8 10% 1
400W MH (455 W) to 4
lamp T5HO (234 W) one
for one replacement.
Accounts for decreased
hourly usage by eliminating
long warm-up. Consider
also optimum circuit
arrangement.
11 4. Distribution
Investigate the ability to valve shut the steam line at Lloyd
(serving Founders) during the summer months. Alternatively,
command heat exchanger control valves closed.
Founders $ - 25,000 - $ 241 1.4 0.0 0.0 NA 1
12 5. End Use
Commission the AHUs. The supply fans (identical) discharge
into a common duct header, but the fans are operating at
different speeds. Adjust the controls for a common VFD speed
output. The same applies to the chilled water valves (one
observed at 100%, th
Library $ 22,000 128,593 64,826 $ 7,205 7.2 34.4 3.1 33% 1
13 3. Generation
Improve chiller operating sequences: Raise lag chiller start
percent. Stage chillers evenly. Provide schedule with
unoccupied OA lockout. Raise OA lockout (currently 45 F).
Use approach temperature (currently high/low fan speed but
VFD display) Unless ded
Science $ 10,000 - 48,000 $ 4,416 0.0 25.5 2.3 44% 1
THE STONE HOUSE GROUP B - 1 3/1/2012

Haverford College
Climate Action Plan
Energy Capital Investment Plan - Phase 1 Projects
NUM ENERGY SUB-SYSTEM PROJECT BUILDING ESTIMATED COSTESTIMATED GAS
REDUCTION MBTU
ESTIMATED
ELEC.
REDUCTION
KWH
ANNUAL
SAVINGS
FOSSIL FUEL
EMISSIONS IMPACT (MT
CO2e)
ELECTRICAL
EMISSIONS
IMPACT (MT CO2e)
PAYBACK
PERIODROI % PHASE COMMENTS
14 4. DistributionConvert the MAU supply fans to VFD control from inlet guide
vane control (equipped with both VFDs and vanes).Science $ 40,000 245,061 $ 22,546 0.0 130.0 1.8 56% 1
15 4. Distribution Convert the hot water pumps to variable flow. Science $ 7,000 - 39,210 $ 3,607 0.0 20.8 1.9 52% 1
16 Retro-commission the Science Building (all wings). Science $ 75,000 1,102,267 198,454 $ 28,895 61.5 105.3 2.6 39% 1
17 4. DistributionInstall variable geometry discharge dampers at the exhaust
fans and close the bypasses.Science $ 80,000 156,839 $ 14,429 0.0 83.2 5.5 18% 1
19 4. Distribution Convert the chilled water pumps to variable flow. Science $ 10,000 - 16,114 $ 1,482 0.0 8.6 6.7 15% 1
FCUs have 2-way valves,
but AHUs have 3-way
valves (w valves at
bypasses). Currently,
chilled water pumps may
be indexed with chiller.
ChW 20 HP, condenser
15, booster 20
20 4. DistributionProvide VFDs at the condenser water pumps. Control for
condenser water dT and minimum flow.Science $ 12,500 - 20,422 $ 1,879 0.0 10.8 6.7 15% 1
21 4. Distribution Convert the domestic booster pumps to variable flow. Science $ 8,000 13,070 $ 1,202 0.0 6.9 6.7 15% 1
22 5. End Use
Provide demand controlled ventilation at the Auditorium unit
(AHU-4). Note: A CO2 sensor is already installed, but it does
not appear to limit the OA when conditions are satisfied. Fur
further savings, implement a fan cycling sequence.
Stokes $ 1,500 95,000 1,750 $ 1,078 5.3 0.9 1.4 72% 1
23 5. End Use Commission the large systems. Stokes $ 23,000 231,903 60,123 $ 7,769 12.9 31.9 3.0 34% 1
24 5. End Use
Improve the operating parameters at AHU-1 (see further detail
in Scheduling/Setpoint log). Implement an unoccupied
dehumidification sequence (units will cycle without OA and in
full cooling; further sensors required) and leaving the AHUs
unoccupied for th
Union $ 1,000 - 12,000 $ 1,104 0.0 6.4 0.9 110% 1
25 4. Distribution
AHU-3 exhibits a small temperature increase over the coils,
with only the chilled water valve open (100%). Review steam
valve control and manually isolate steam valves at units during
warmer months.
Whitehead $ - 17,500 2,500 $ 399 1.0 1.3 0.0 100% 1
26 4. Distribution Install a VFD at the cooling tower fan. Whitehead $ 8,000 20,052 $ 1,845 0.0 10.6 4.3 23% 1 40 HP
27 4. Distribution Provide VFDs at the AHUs and remove the inlet guide vanes. Whitehead $ 11,000 15,316 $ 1,409 0.0 8.1 7.8 13% 1
28 5. End UseInstall occupancy sensors for increased control of HVAC
equipment (standby mode when no occupancy)Campus $ 50,000 647,668 66,489 $ 12,500 36.1 35.3 4.0 25%
29 5. End Use
Install occupancy sensors for the bathrooms, and vacancy
sensors for the storage areas adjoining the shop area (wall
mounted at current light switch locations).
Facilities $ 375 619 $ 57 0.0 0.3 6.6 15%
30 5. End UseInstall occupancy sensor to control lighting (and potentially
HVAC) at offices, conference areas and bathrooms.Stokes $ 3,750 4,641 $ 427 0.0 2.5 8.8 11%
31 5. End Use Install occupancy sensors for lighting control. Sharpless $ 9,000 10,920 $ 1,005 0.0 5.8 9.0 11%
32 5. End Use Install occupancy sensors at the classrooms and offices. Gest $ 1,000 1,092 $ 100 0.0 0.6 10.0 10%
THE STONE HOUSE GROUP B - 2 3/1/2012
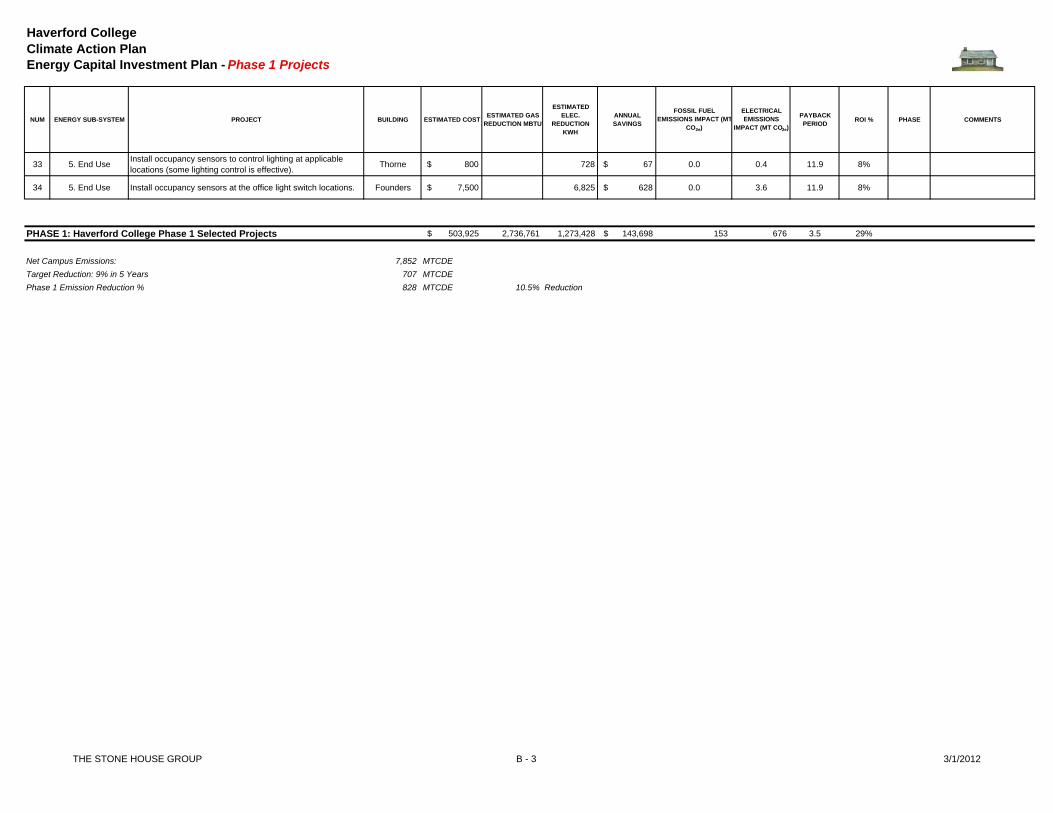
Haverford College
Climate Action Plan
Energy Capital Investment Plan - Phase 1 Projects
NUM ENERGY SUB-SYSTEM PROJECT BUILDING ESTIMATED COSTESTIMATED GAS
REDUCTION MBTU
ESTIMATED
ELEC.
REDUCTION
KWH
ANNUAL
SAVINGS
FOSSIL FUEL
EMISSIONS IMPACT (MT
CO2e)
ELECTRICAL
EMISSIONS
IMPACT (MT CO2e)
PAYBACK
PERIODROI % PHASE COMMENTS
33 5. End UseInstall occupancy sensors to control lighting at applicable
locations (some lighting control is effective).Thorne $ 800 728 $ 67 0.0 0.4 11.9 8%
34 5. End Use Install occupancy sensors at the office light switch locations. Founders $ 7,500 6,825 $ 628 0.0 3.6 11.9 8%
PHASE 1: Haverford College Phase 1 Selected Projects $ 503,925 2,736,761 1,273,428 $ 143,698 153 676 3.5 29%
Net Campus Emissions: 7,852 MTCDETarget Reduction: 9% in 5 Years 707 MTCDEPhase 1 Emission Reduction % 828 MTCDE 10.5% Reduction
THE STONE HOUSE GROUP B - 3 3/1/2012

Haverford College
Climate Action Plan
Energy Capital Investment Plan - Phase 2 Projects
NUM ENERGY SUB-SYSTEM PROJECT BUILDING ESTIMATED COSTESTIMATED GAS
REDUCTION MBTU
ESTIMATED
ELEC.
REDUCTION
KWH
ANNUAL
SAVINGS
FOSSIL FUEL
EMISSIONS IMPACT (MT
CO2e)
ELECTRICAL
EMISSIONS
IMPACT (MT CO2e)
PAYBACK
PERIODROI % PHASE COMMENTS
7 3. Generation
Turn off the steam system during the summer. Install
independent systems at buildings served (domestic hot water
heaters, hot water boilers).
Campus $ 350,000 6,566,150 - $ 57,027 366.3 0.0 6.1 16% 2
18 3. Generation Install 250 kW CCHP unit for cooling, heating and electric Science $ 450,000 (7,400,287) 2,082,500 $ 99,352 -412.8 1105.0 4.5 22% 2
See separate CHP
analysis. Analysis includes
50% ACE grant & 10%
FITC funding
PHASE 2: Haverford College Phase 2 Projects $ 800,000 (834,137) 2,082,500 $ 156,379 (47) 1,105 5.1 20%
THE STONE HOUSE GROUP B - 4 3/1/2012

Haverford College Climate Action Plan | Appendix C
Appendix C Calculations and Conversions
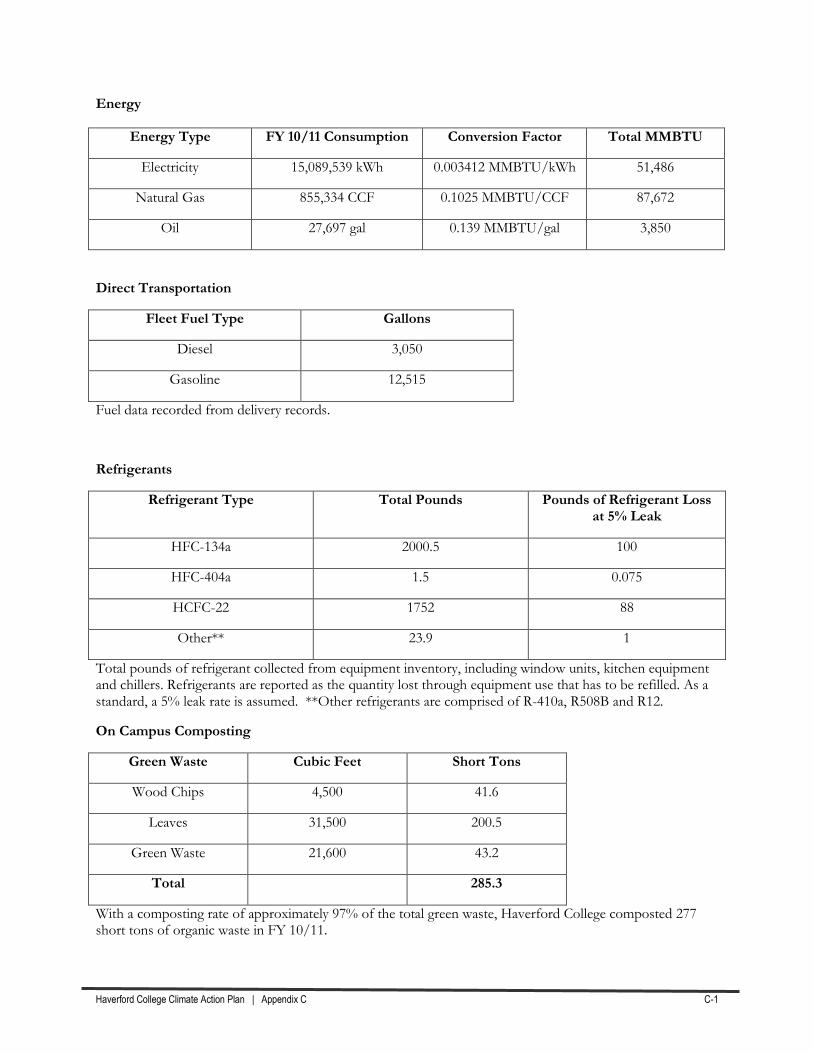
Haverford College Climate Action Plan | Appendix C C-1
Energy
Energy Type FY 10/11 Consumption Conversion Factor Total MMBTU
Electricity 15,089,539 kWh 0.003412 MMBTU/kWh 51,486
Natural Gas 855,334 CCF 0.1025 MMBTU/CCF 87,672
Oil 27,697 gal 0.139 MMBTU/gal 3,850
Direct Transportation
Fleet Fuel Type Gallons
Diesel 3,050
Gasoline 12,515
Fuel data recorded from delivery records.
Refrigerants
Refrigerant Type Total Pounds Pounds of Refrigerant Loss at 5% Leak
HFC-134a 2000.5 100
HFC-404a 1.5 0.075
HCFC-22 1752 88
Other** 23.9 1
Total pounds of refrigerant collected from equipment inventory, including window units, kitchen equipment and chillers. Refrigerants are reported as the quantity lost through equipment use that has to be refilled. As a standard, a 5% leak rate is assumed. **Other refrigerants are comprised of R-410a, R508B and R12.
On Campus Composting
Green Waste Cubic Feet Short Tons
Wood Chips 4,500 41.6
Leaves 31,500 200.5
Green Waste 21,600 43.2
Total 285.3
With a composting rate of approximately 97% of the total green waste, Haverford College composted 277 short tons of organic waste in FY 10/11.

Haverford College Climate Action Plan | Appendix D
Appendix D Peer Institution Comparison
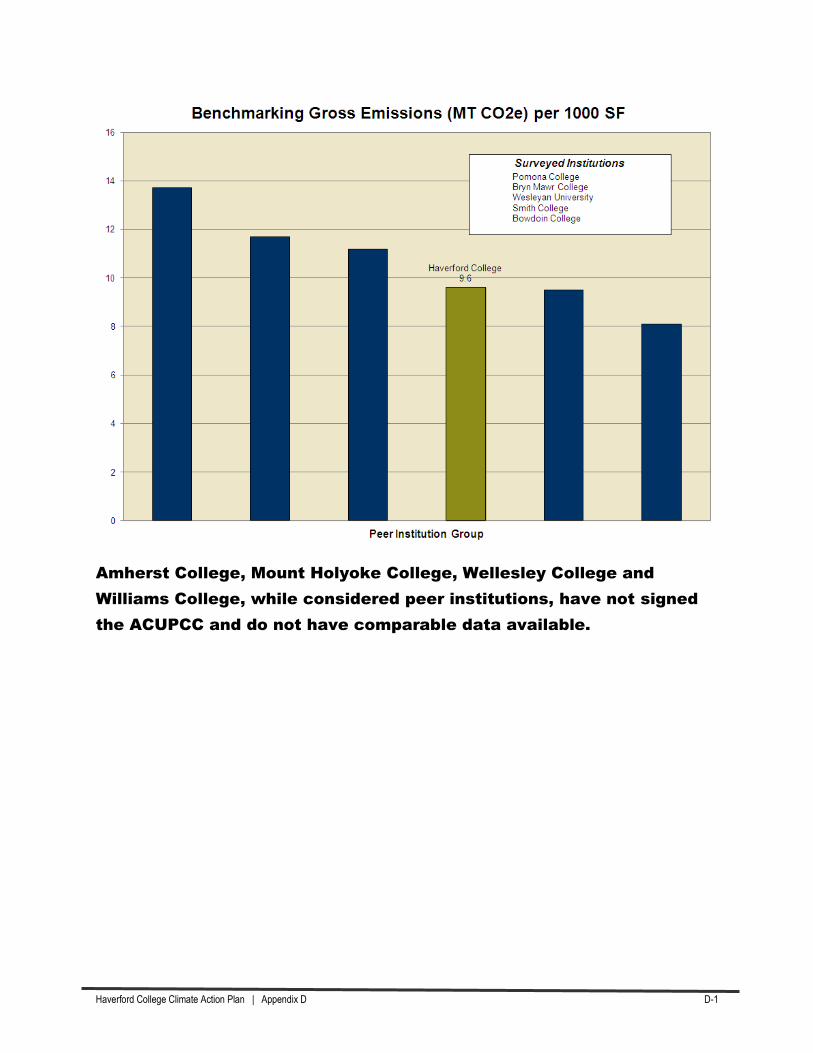
Haverford College Climate Action Plan | Appendix D D-1
Amherst College, Mount Holyoke College, Wellesley College and
Williams College, while considered peer institutions, have not signed
the ACUPCC and do not have comparable data available.


