Embed Size (px)
Citation preview

Financial OverviewGil BorokChief Financial Officer

CBRE | Page 2
Forward Looking Statements
This presentation, and those immediately following, contain statements thatare forward looking within the meaning of the Private Securities LitigationReform Act of 1995, including statements regarding our future growthmomentum, operations, financial performance, and business outlook. Thesestatements should be considered as estimates only and actual results mayultimately differ from these estimates. Except to the extent required byapplicable securities laws, we undertake no obligation to update or publiclyrevise any of the forward-looking statements that you may hear today. Pleaserefer to our third quarter earnings report, filed on Form 8-K, our current annualreport on Form 10-K and our current quarterly report on Form 10-Q, inparticular any discussion of risk factors or forward-looking statements, whichare filed with the SEC and available at the SEC’s website (www.sec.gov), for afull discussion of the risks and other factors that may impact any estimatesthat you may hear today. We may make certain statements during the courseof this presentation, which include references to “non-GAAP financialmeasures,” as defined by SEC regulations. As required by these regulations,we have provided reconciliations of these measures to what we believe arethe most directly comparable GAAP measures, which are attached heretowithin the appendix.
CBRE | Page 3
Global Market Leader
1. Includes affiliate offices.2. On a combined basis, including the acquisition of ING CRES which closed July 1, 2011, ING’s Real Estate Investment Management
business in Asia (ING REIM) which closed October 3, 2011 and ING REIM Europe, which closed on October 31, 2011.3. As of September 30, 2011.4. Based on 2010 revenues versus Jones Lang LaSalle.
Scale and Diversity
1.7x nearest competitor4
Thousands of clients; nearly 80% of the Fortune 100 $128.1 billion of transaction activity in 2010
Broad Capabilities
#1 leasing #1 investment sales #1 outsourcing #1 appraisal and valuation #1 commercial mortgage brokerage #1 commercial real estate investment management2
$6.6 billion of development projects in process/pipeline3
Leading Global Brand
100+ years
400+ offices in over 60 countries1
#1 in virtually every major global business center
Recognized Leadership
S&P 500 Only commercial real estate services company in the S&P 500 FORTUNE Only commercial real estate services company in the Fortune 500 The Lipsey Company #1 brand for ten consecutive years IAOP #1 real estate outsourcing firm Newsweek #1 real estate company in “green” rankings

CBRE | Page 4
Our Objectives
Provide a complete suite of market leading services to property owners and occupiers through a fully integrated global business platform and a managed account strategy
Our Strategy
Establish and maintain the leading position in every major world city. Establish and maintain the leading position in each service we provide. Maintain the most admired, highest quality brand. Recruit, hire and retain the finest people in our industry. Foster and maintain a culture of integrity, excellence and continuous improvement. Lead the industry in revenue and profit growth and retain the industry’s highest operating
margins.
Our VisionBe the preeminent, vertically integrated, globally capable commercial real estate services firm

CBRE | Page 5
Corporations, 44%
Insurance Co's/Banks, 19%
Pensions Funds/P F Advisors, 10%
Individuals/Partnerships, 7%
Government, 5%
REITs, 4%
Opportunity Funds, 4%
Conduits/Wall Street Firms, 1%
Offshore Investors, 1%Other, 5%
Diversified revenue spread across broad base of clients Diverse Client Base
2010 Revenue by Client Type

CBRE | Page 6
Geographic Diversification #1 commercial real estate services firm in each of the major
regions of the world
Americas 63%
EMEA 18%
Asia Pacific 13%
Global Investment Management 5%
Development Services 1%
1. LTM 9/30/11 revenue of $5.8 billion includes $4.6 million of revenue related to discontinued operations.
LTM 9/30/11 Revenue1

CBRE | Page 7
Service Line Diversity - Revenue Breakdown
LTM 9/30/11
1. Includes revenue from discontinued operations of $4.6 million and $1.7 million for twelve months ended September 30, 2011 and 2010, respectively.
34%
33%
16%
6%4% 4% 1% 2%
($ in millions) 20111 2010 1 % Change
Property & Facilities Management 1,972.0 1,727.4 14Leasing 1,932.3 1,585.3 22Sales 925.7 687.3 35Appraisal & Valuation 366.7 312.3 17Investment Management 222.4 139.8 59Commercial Mortgage Brokerage 214.0 123.7 73Development Services 64.3 77.1 -17Other 100.3 109.3 -8Total 5,797.7 4,762.2 22
Twelve months ended September 30,
CBRE | Page 8
Contractual 47%Non-
Contractual 53%
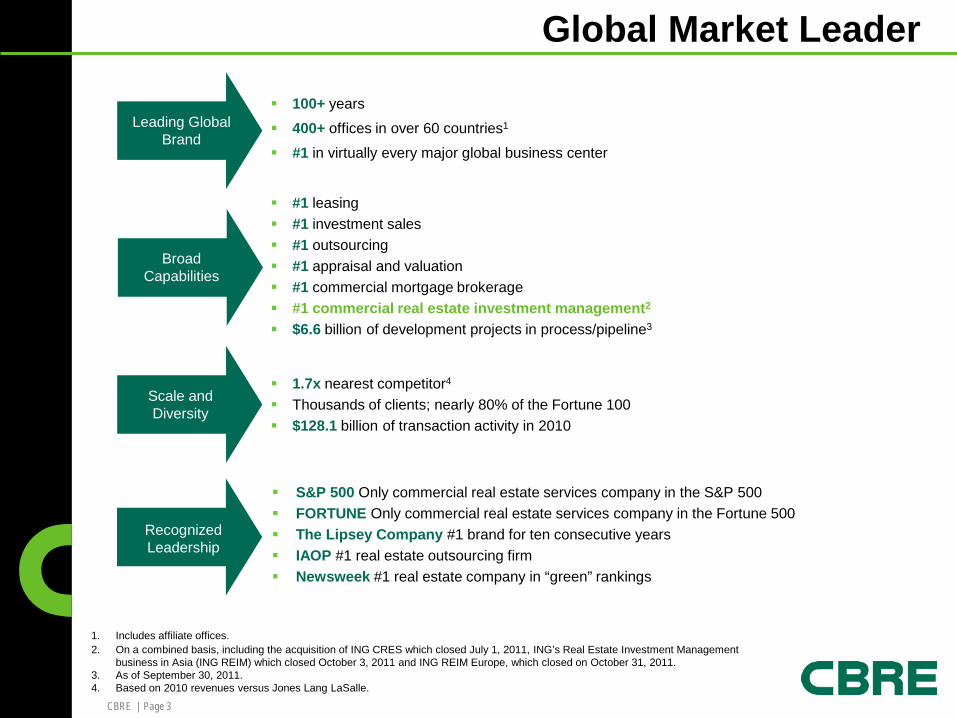
Revenue Diversification
1. Contractual revenue includes: Property & Facilities Management (14% in 2006 and 34% in LTM 9/30/11), Appraisal & Valuation (7% in 2006 and 6% in LTM 9/30/11), Investment Management (6% in 2006 and 4% in LTM 9/30/11), Development Services (1% in both 2006 and LTM 9/30/11) and Other (1% in 2006 and 2% in LTM 9/30/11). Non-contractual revenue includes: Sales (31% in 2006 and 16% in LTM 9/30/11), Leasing (37% in 2006 and 33% in LTM 9/30/11) and Commercial Mortgage Brokerage (3% in 2006 and 4% in LTM 9/30/11).
2. Reflects Trammell Crow Company’s revenue contributions beginning on December 20, 2006.3. LTM 9/30/11 revenue includes $4.6 million of revenue related to discontinued operations.
Contractual revenues1 represented 47% of LTM 9/30/11 revenue, up from 29% in 2006
Contractual 29%
Non-Contractual
71%
LTM 9/30/11 Revenue32006 Revenue2

CBRE | Page 9
YTD Q2 2011 CBRE vs. Global Competitors - Global Results
1. Based on 6/30/11 exchange rate of 1£ = $1.6057.2. Six months ended 4/30/11; based on 4/30/11 exchange rate of 1£ = $1.66648.3. Excludes discontinued operations
Source: Company public filings
$2,609.7
$1,533.2
$884.0
$539.2$441.3 $303.3
$0
$500
$1,000
$1,500
$2,000
$2,500
$3,000
CBRE JLL C & W Savills DTZ G & E
Revenue Operating Income
$203
$78
($11)
$29
$4
($26)-$50
$0
$50
$100
$150
$200
$250
CBRE JLL C & W Savills DTZ G & E
Margin 7.8% 5.1% 1.4%
$ millions
1
1
N/A
2
2
N/A 5.4%
3
3

CBRE | Page 10
20 26 34 42 62 90 127 117 151 115 131183
300
461
653
970
601
454
681741
5.6%6.6%
7.9%8.9%
10.6%11.9%
10.7%
8.4%
9.9%
8.4%9.6% 10.1%
11.3%
14.4%
16.2%16.1%
11.7%
10.9%
13.3% 12.8%
1992 1993 1994 1995 1996 1997 1998 1999 2000 2001 2002 2003 2004 2005 2006 2007 2008 2009 2010 LTM Q3
2011
Normalized EBITDA Normalized EBITDA Margin
360 392 429 469 583 759 1,187 1,403 1,518 1,362 1,362
1,810
2,647 3,194
4,032
6,036
5,130
4,166
5,119 5,798
1992 1993 1994 1995 1996 1997 1998 1999 2000 2001 2002 2003 2004 2005 2006 2007 2008 2009 2010 LTM Q3
2011
Organic Revenue Revenue From Acquisitions
($ in Millions)
1. No reimbursements are included for the period 1992 through 1996, as amounts were immaterial. Reimbursements for 1997 through 2001 have been estimated. For 2002 and forward, reimbursements are included.
2. Includes Trammell Crow Company activity for the period December 20, 2006 through December 31, 2006.
3. Includes revenue from discontinued operations, which totaled $2.1 million for the year ended December 31, 2007, $1.3 million for the year ended December 31, 2008, $3.9 million for the year ended December 31, 2010 and $4.6 million for the twelve months ended September 30, 2011.
4. Normalized EBITDA excludes merger-related and other non-recurring costs, integration and other costs related to acquisitions, cost containment expenses, one-time IPO-related compensation expense, gains/losses on trading securities acquired in the Trammell Crow Company acquisition and the write-down of impaired assets.
5. Includes EBITDA related to discontinued operations of $6.5 million for the year ended December 31, 2007, $16.9 million for the year ended December 31, 2008, $16.4 million for the year ended December 31, 2010 and $3.0 million for the twelve months ended September 30, 2011.
($ in Millions)
Revenue 1
Normalized EBITDA and Margin 4
Historical Performance
555
33 32
2
3
5
CBRE | Page 11
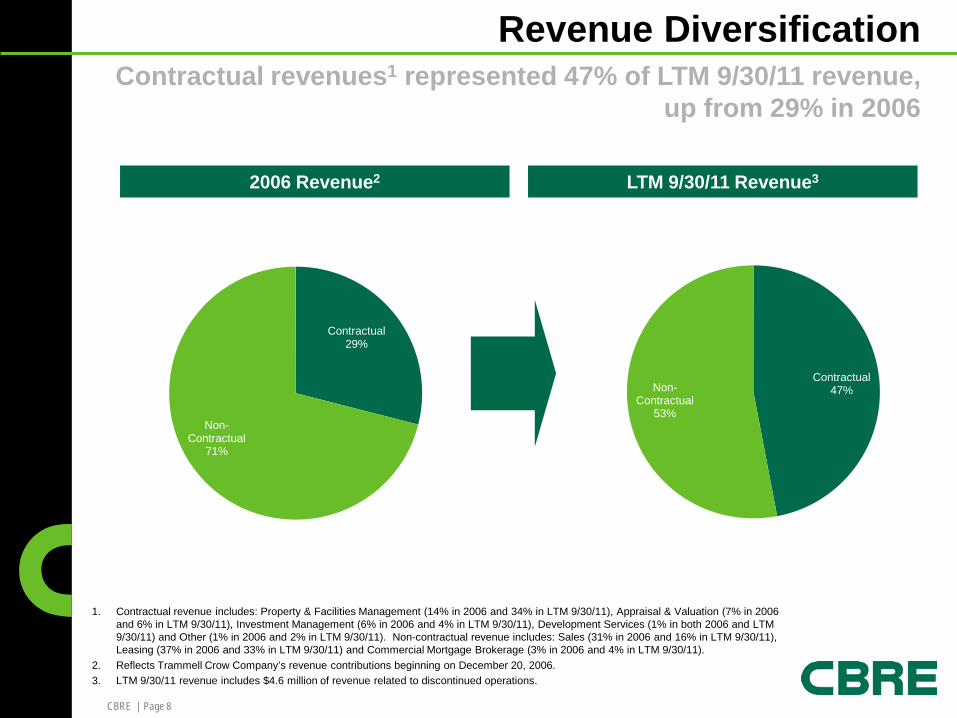
17
68 70 76
340
422458
378 370350
0.0
250.0
500.0
2011 2012 2013 2014 2015 2016 2017 2018 2019 2020Term Loan A Term Loan A-1 Term Loan B
Term Loan C Term Loan D Sr. Subordinated Notes
Sr. Unsecured Notes Revolver
Mandatory Amortization and Maturity Schedule
$ millions
1. Represents new senior secured sterling tranche A-1 term loan of GBP 187 million, which closed on November 10, 2011. Term Loan A-1 assumes a $1.6/₤ exchange rate.
2. $700.0 million revolver facility matures in May 2015. As of September 30, 2011 the outstanding revolver balance was $41.3 million.
Pro forma as of September 30, 2011
1
2

CBRE | Page 12
Capitalization
1. Excludes $210.7 million and $26.1 million of cash in consolidated funds and other entities, but not available for company use at September 30, 2011 and December 31, 2010, respectively.
2. Term loan A-1 assumes a $1.6/£ exchange rate.3. Net of original issue discount of $11.3 million and $12.3 million at September 30, 2011 and December 31, 2010, respectively.4. Represents notes payable on real estate in Development Services that are recourse to the Company. Excludes non-recourse notes payable on
real estate of $485.7 million and $623.8 million at September 30, 2011 and December 31, 2010, respectively.5. Excludes $676.8 million and $453.8 million of aggregate non-recourse warehouse facilities at September 30, 2011 and December 31, 2010,
respectively.
($ in millions)Proforma 9/30/2011 9/30/2011 12/31/2010
Cash1 576.1 451.9 480.5
Cash in Escrow - 335.0 -
Total cash 576.1 786.9 480.5
Revolving credit facility 81.3 41.3 17.5
Senior secured term loan A 315.0 315.0 341.3
Senior secured term loan A-12 299.2 - -
Senior secured term loan B 297.0 297.0 299.2
Senior secured term loan C 399.0 399.0 -
Senior secured term loan D 399.0 399.0 -
Senior subordinated notes3 438.7 438.7 437.7
Senior unsecured notes 350.0 350.0 350.0
Notes payable on real estate4 13.6 13.6 3.7
Other debt5 0.1 0.1 0.2
Total debt 2,592.9 2,253.7 1,449.6
Stockholders' equity 1,082.4 1,082.4 908.2
Total capitalization 3,675.3 3,336.1 2,357.8 Total net debt 2,016.8 1,466.8 969.1
As of

CBRE | Page 13
Business Outlook
Early-stage cyclical recovery in commercial real estate continues despite
sovereign debt challenges in Europe and economic uncertainty in the
U.S.
Outsourcing fundamentals remain very strong and we continue to expect
solid double digit growth
Investment sales are expected to continue growing as capital remains
available and investors continue to search for yield
Leasing growth rates should revert to historical norms as the economy
stabilizes
We remain focused on cost containment balanced with selective
strategic recruiting
We continue to expect full year 2011 earnings to be in the range of
$0.95 to $1.05 per share

CBRE | Page 14
Appendix

CBRE | Page 15
Reconciliation of Normalized EBITDA to EBITDA to Net Income (Loss)
Notes:1. Includes EBITDA related to discontinued operations of $3.0 million for the twelve months ended September 30, 2011, $16.4 million for the year ended December 31,
2010, $16.9 million for the year ended December 31, 2008 and $6.5 million for the year ended December 31, 2007.2. Includes interest income related to discontinued operations of $0.1 million for the year ended December 31, 2008 and $0.01 million for the year ended December 31,
2007.3. Includes depreciation and amortization related to discontinued operations of $0.9 million for the twelve months ended September 30, 2011, $0.6 million for the year
ended December 31, 2010, $0.1 million for the year ended December 31, 2008 and $0.4 million for the year ended December 31, 2007.4. Includes interest expense related to discontinued operations of $1.9 million for the twelve months ended September 30, 2011, $1.6 million for the year ended December
31, 2010, $0.6 million for the year ended December 31, 2008 and $1.8 million for the year ended December 31, 2007.5. Includes provision for income taxes related to discontinued operations of $0.4 million for the twelve months ended September 30, 2011, $5.4 million for the year ended
December 31, 2010, $6.0 million for the year ended December 31, 2008 and $1.6 million for the year ended December 31, 2007.6. Includes revenue related to discontinued operations of $4.6 million for the twelve months ended September 30, 2011, $3.9 million for the year
ended December 31, 2010, $1.3 million for the year ended December 31, 2008 and $2.1 million for the year ended December 31, 2007.
($ in millions) LTM Q3 2011 2010 2009 2008 2007 2006
Normalized EBITDA1 740.9$ 681.3$ 453.9$ 601.2$ 970.1$ 652.5$
Less:Integration and other costs related to acquisitions 28.0 7.2 5.7 16.4 45.2 7.6 Write-down of impaired assets 10.3 11.3 32.5 100.4 - - Cost containment expenses 3.5 15.3 43.6 27.4 - - Merger-related charges - - - - 56.9 - Loss (gain) on trading securities acquired in the Trammell Crow Company acquisition - - - - 33.7 (8.6)
EBITDA1 699.1 647.5 372.1 457.0 834.3 653.5
Add:
Interest income2 9.2 8.4 6.1 17.9 29.0 9.8
Less:
Depreciation and amortization3 109.8 109.0 99.5 102.9 113.7 67.6
Interest expense4 150.2 192.7 189.1 167.8 164.8 45.0
Write-off of financing costs 18.1 18.1 29.3 - - 33.8
Goodwill and other non-amortizable intangible asset impairments - - - 1,159.4 - -
Provision for income taxes5 175.7 135.8 27.0 56.9 194.3 198.3
Net income (loss) attributable to CBRE Group, Inc. 254.5$ 200.3$ 33.3$ (1,012.1)$ 390.5$ 318.6$ Revenue6 5,797.7 5,119.2 4,165.8 5,130.1 6,036.3 4,032.0 Normalized EBITDA Margin 12.8% 13.3% 10.9% 11.7% 16.1% 16.2%
Year Ended December 31,
1

CBRE | Page 16
$68.0 $93.8
First Quarter
$214.3 $232.1$864.6 $1,174.6
Sales, Leasing and Outsourcing Revenue - Americas
38%
8%
$271.6 $435.4
Full Year60%
36%
2009 2010 2011
($ in millions)
Out
sour
cing
Sal
esLe
asin
g
$305.6 $344.4$1,224.0 $1,288.6
13%5%
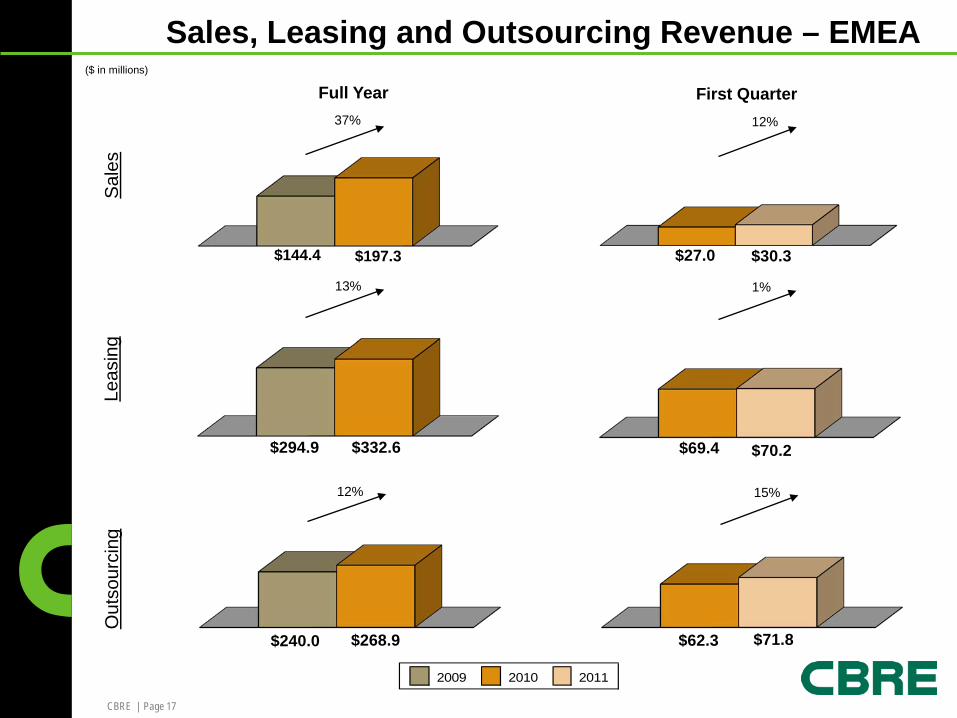
CBRE | Page 17
$294.9 $332.6
$144.4 $197.3
Full Year
$69.4 $70.2
Sales, Leasing and Outsourcing Revenue – EMEA
$27.0 $30.3
First Quarter12%37%
1%13%
2009 2010 2011
($ in millions)
Out
sour
cing
Sal
esLe
asin
g
$240.0 $268.9 $62.3 $71.8
15%12%

CBRE | Page 18
$89.4 $134.6
Full Year
Sales, Leasing and Outsourcing Revenue – Asia Pacific
$21.2 $33.1
First Quarter
$43.9 $50.6$187.6 $233.5
57%51%
15%24%
2009 2010 2011
($ in millions)
Out
sour
cing
Sal
esLe
asin
g
$52.3 $60.3$166.6 $211.7
15%27%

CBRE | Page 19
$314.6 $351.3
$85.0 $142.9
Second Quarter
$253.4 $311.5
$153.1 $236.6
YTD Second Quarter
$467.7 $543.6
Sales, Leasing and Outsourcing Revenue - Americas
55%
16%
68%
23%
($ in millions)
Out
sour
cing
Sal
esLe
asin
g
$620.2 $695.7
12%12%
2010 2011

CBRE | Page 20
$147.5 $165.9
$70.0 $80.7
$78.1 $95.7
$46.3 $50.4
Second Quarter
$73.4 $80.8
YTD Second Quarter
Sales, Leasing and Outsourcing Revenue - EMEA
10%
12%
9%
23%
($ in millions)
Out
sour
cing
Sal
esLe
asin
g
$132.4 $152.5
15%15%
2010 2011

CBRE | Page 21
$56.0 $65.3
$54.4 $63.7 $98.3 $114.3
$27.1 $34.6
Second Quarter
$48.3 $67.7
YTD Second Quarter
Sales, Leasing and Outsourcing Revenue – Asia Pacific
40%
16%
28%
17%
($ in millions)
Out
sour
cing
Sal
esLe
asin
g
$108.3 $125.6
16%17%
2010 2011