Embed Size (px)
Citation preview

94 COMMUNICATIONS OF THE ACM | MARCH 2020 | VOL. 63 | NO. 3
research highlights
DOI:10.1145/3378933
Pivot Tracing: Dynamic Causal Monitoring for Distributed SystemsBy Jonathan Mace, Ryan Roelke, and Rodrigo Fonseca
AbstractMonitoring and troubleshooting distributed systems are notoriously difficult; potential problems are complex, var-ied, and unpredictable. The monitoring and diagnosis tools commonly used today—logs, counters, and metrics—have two important limitations: what gets recorded is defined a priori, and the information is recorded in a component- or machine-centric way, making it extremely hard to correlate events that cross these boundaries. This paper presents Pivot Tracing, a monitoring framework for distributed sys-tems that addresses both limitations by combining dynamic instrumentation with a novel relational operator: the happened-before join. Pivot Tracing gives users, at runtime, the ability to define arbitrary metrics at one point of the sys-tem, while being able to select, filter, and group by events meaningful at other parts of the system, even when crossing component or machine boundaries. Pivot Tracing does not correlate cross-component events using expensive global aggregations, nor does it perform offline analysis. Instead, Pivot Tracing directly correlates events as they happen by piggybacking metadata alongside requests as they execute. This gives Pivot Tracing low runtime overhead—less than 1% for many cross-component monitoring queries.
1. INTRODUCTIONMonitoring and troubleshooting distributed systems are hard. The potential problems are myriad: hardware and soft-ware failures, misconfigurations, hot spots, aggressive ten-ants, or even simply unrealistic user expectations. Despite the complex and unpredictable nature of these problems, most of the monitoring and diagnosis tools commonly used today—logs, counters, and metrics—have at least two fundamental limitations: what gets recorded is defined a priori, at develop-ment or deployment time, and the information is captured in a component- or machine-centric way, making it extremely difficult to correlate events that cross these boundaries.
While there has been great progress in using machine learning techniques and static analysis to improve the qual-ity of logs and their use in troubleshooting,16 logs carry an inherent tradeoff between recall and overhead, as what gets logged must be defined a priori.
Addressing this limitation, dynamic instrumentation sys-tems such as Fay7 and DTrace4 enable the diagnosis of unan-ticipated performance problems in production systems3 by providing the ability to select, at runtime, which of a large number of tracepoints to activate. Dynamic instrumenta-tion, however, is still limited when it comes to correlating
events that cross address-space or OS-instance boundaries. This limitation is fundamental, as neither Fay nor DTrace can affect the monitored system to propagate the monitor-ing context across these boundaries.
In this paper, we present Pivot Tracing, a monitoring framework that combines dynamic instrumentation with causal tracing techniques8, 23 to fundamentally increase the power and applicability of either technique. Pivot Tracing gives operators and users, at runtime, the ability to obtain an almost arbitrary metric at one point of the system, while selecting, filtering, and grouping by causally preceding events from other parts of the system, even when crossing compo-nent or machine boundaries. Pivot Tracing exposes these features by modeling system events as the tuples of a stream-ing, distributed data set. Users can write relational queries about system events using Pivot Tracing’s LINQ-like query language. Pivot Tracing compiles queries into efficient instru-mentation code and dynamically installs the code at the sources of events specified in the query, returning a stream-ing data set of results to the user.
The key contribution of Pivot Tracing is the “happened-before join” operator, →, that enables queries to be con-textualized by Lamport’s happened-before relation, →.15 Using →, queries can group and filter events based on proper-ties of any events that causally precede them in an execution.
To track the happened-before relation between events, Pivot Tracing borrows from causal tracing techniques, and utilizes a generic metadata propagation mechanism for passing partial query execution state along the execu-tion path of each request. This enables inline evaluation of joins during request execution, drastically mitigating query overhead and avoiding the scalability issues of global evaluation.
We have implemented and open-sourced a prototype of Pivot Tracing for Java-based systems, and instrumented a variety of distributed systems including HDFS, HBase, MapReduce, Tez, YARN, and Spark. In our full evaluation,16 we show that Pivot Tracing can effectively identify a diverse range of root causes such as software bugs, misconfigura-tion, and limping hardware. We show that Pivot Tracing is dynamic, extensible to new kinds of analysis, and enables cross-tier analysis between inter-operating applications with low execution overhead.
The original version of this paper was published in Proceedings of the 25th Symposium on Operating Systems Principles (2015), ACM. New York, NY, 378–393.

MARCH 2020 | VOL. 63 | NO. 3 | COMMUNICATIONS OF THE ACM 95
2. MOTIVATION2.1. Pivot Tracing in actionIn this section, we motivate Pivot Tracing with a monitoring task on the Hadoop stack. Our goal here is to demonstrate some of what Pivot Tracing can do, and we leave details of its design and implementation to Sections 3 and 4, respectively.
Suppose we are managing a cluster of eight machines and want to know how disk bandwidth is being used across the cluster. On these machines, we are simultaneously running clients with workloads in HBase, HDFS, and MapReduce. It suffices to know that HBase is a distributed database that accesses data through HDFS, a distributed file system. MapReduce, in addition to accessing data through HDFS, also accesses the disk directly to perform external sorts and to shuffle data between tasks. Figure 1 depicts this scenario along with the following client applications:
FSread4m Random closed-loop 4MB HDFS readsFSread64m Random closed-loop 64MB HDFS readsHget 10kB row lookups in a large HBase tableHscan 4MB table scans of a large HBase tableMRsort10g MapReduce sort job on 10GB of input dataMRsort100g MapReduce sort job on 100GB of input data
By default, the systems expose a few metrics for disk consumption, such as disk read throughput aggregated by
each HDFS DataNode. To reproduce this metric with Pivot Tracing, we define a tracepoint for the DataNodeMetrics class, in HDFS, to intercept the incrBytesRead(int delta) method. A tracepoint is a location in the application source code where instrumentation can run, cf. Section 3. We then run the fol-lowing query, in Pivot Tracing’s LINQ-like query language17:
Q1 : From incr In DataNodeMetrics.incrBytesReadGroupBy incr.hostSelect incr.host, SUM(incr.delta)
This query causes each machine to aggregate the delta argu-ment each time incrBytesRead is invoked, grouping by the host name. Each machine reports its local aggregate every second, from which we produce the time series in Figure 2a.
Things get more interesting, though, if we wish to mea-sure the HDFS usage of each of our client applications. HDFS only has visibility of its direct clients, and thus an aggre-gate view of all HBase and all MapReduce clients. At best, applications must estimate throughput client side. With Pivot Tracing, we define tracepoints for the client protocols of HDFS (DataTransferProtocol), HBase (ClientService), and MapReduce (ApplicationClientProtocol), and use the name of the client process as the group by key for the query. Figure 2b shows the global HDFS read throughput of each client appli-cation, produced by the following query:
Q2 : From incr In DataNodeMetrics.incrBytesReadJoin cl In First(ClientProtocols) On cl -> incrGroupBy cl.procNameSelect cl.procName, SUM(incr.delta)
The -> symbol indicates a happened-before join. Pivot Tracing’s implementation will record the process name the first time the request passes through any client protocol method and propagate it along the execution. Then, whenever the exe-cution reaches incrBytesRead on a DataNode, Pivot Tracing will emit the bytes read or written, grouped by the recorded name. This query exposes information about client disk throughput that cannot currently be exposed by HDFS.
Figure 2c demonstrates the ability for Pivot Tracing to group metrics along arbitrary dimensions. It is generated
Disk
HBase MapReduce
HDFS
HGET
HSCAN
FSREAD4M
FSREAD64M
MRSORT10G
MRSORT100G
Machines
Figure 1. Six client workloads access the disks on eight cluster machines indirectly via HBase, a distributed database; HDFS, a distributed file system; and MapReduce, a data processing framework.
Time (min)
0
50
100
150
200
0 5 10 15
HD
FS t
hrou
ghpu
t (M
B/s
)
Host A Host EHost B Host FHost C Host GHost D Host H
Time (min)
HD
FS t
hrou
ghpu
t (M
B/s
)
0
50
100
150
200
0 5 10 15
MRSORT100G HSCANMRSORT10G HGET
FSREAD4MFSREAD64M
(a) (b) (c)Disk write throughputDisk read throughput
Host AHost BHost CHost DHost EHost FHost GHost H
Σcluster
HDFS Map Shuffle Reduce Σmachine
Figure 2. In this example, Pivot Tracing exposes a low-level HDFS metric grouped by client identifiers from other applications. Pivot Tracing can expose arbitrary metrics at one point of the system, while being able to select, filter, and group by events meaningful at other parts of the system, even when crossing component or machine boundaries. (a) HDFS DataNode throughput per machine from instrumented DataNodeMetrics. (b) HDFS DataNode throughput grouped by high-level client application. (c) Pivot table showing disk read and write sparklines for MRsort10g. Rows group by host machine; columns group by source process. Bottom row and right column show totals, and bottom-right corner shows grand total.

research highlights
96 COMMUNICATIONS OF THE ACM | MARCH 2020 | VOL. 63 | NO. 3
by two queries similar to Q2 that instrument Java’s FileInput-Stream and FileOutputStream, still joining with the client pro-cess name. We show the per-machine, per-application disk read and write throughput of MRSORT10G from the same experiment. This figure resembles a pivot table, where summing across rows yields per-machine totals, summing across columns yields per-system totals, and the bottom right corner shows the global totals. In this example, the cli-ent application presents a further dimension along which we could present statistics.
Query Q1 above is processed locally, while query Q2 requires the propagation of information from client pro-cesses to the data access points. Pivot Tracing’s query opti-mizer installs dynamic instrumentation where needed, and determines when such propagation must occur to pro-cess a query. The out-of-the box metrics provided by HDFS, HBase, and MapReduce cannot provide analyses like those pre-sented here. Simple correlations—such as determining which HDFS datanodes were read from by a high-level client applica-tion—are not typically possible. Metrics are ad hoc between systems; HDFS sums IO bytes, while HBase exposes opera-tions per second. There is very limited support for cross-tier analysis: MapReduce simply counts global HDFS input and output bytes; HBase does not explicitly relate HDFS metrics to HBase operations.
2.2. Pivot Tracing overviewFigure 3 presents a high-level overview of how Pivot Tracing enables queries such as Q2. We refer to the numbers in the fig-ure (e.g., ①) in our description. Full support for Pivot Tracing in a system requires two basic mechanisms: dynamic code injection and causal metadata propagation.
Queries in Pivot Tracing refer to variables exposed by one or more tracepoints—places in the system where Pivot Tracing can insert instrumentation. Tracepoint defini-tions are not part of the system code, but are rather instruc-tions on where and how to change the system to obtain the exported identifiers. Tracepoints in Pivot Tracing are similar to pointcuts from aspect-oriented programming,14 and can refer to arbitrary interface/method signature combinations. Tracepoints are defined by someone with knowledge of the system, maybe a developer or expert operator, and define the vocabulary for queries (①). They can be defined and installed at any point in time, and can be shared and disseminated.
Pivot Tracing models system events as tuples of a stream-ing, distributed dataset. Users submit relational queries over this dataset (②), which get compiled to an intermediate repre-sentation called advice (③). Advice uses a small instruction set to process queries, and maps directly to code that local Pivot Tracing agents install dynamically at relevant tracepoints (④). Later, requests executing in the system invoke the installed advice each time their execution reaches the tracepoint.
We distinguish Pivot Tracing from prior work by support-ing joins between events that occur within and across pro-cess, machine, and application boundaries. The efficient implementation of the happened before join requires advice in one tracepoint to send information along the execu-tion path to advice in subsequent tracepoints. This is done through a new baggage abstraction, which uses causal meta-data propagation (⑤). In query Q2, for example, cl.procName is packed in the first invocation of the ClientProtocols tra-cepoint, to be accessed when processing the incrBytesRead tracepoint.
Advice in some tracepoints also emit tuples (⑥), which get aggregated locally and then finally streamed to the client over a message bus (⑦ and ⑥).
2.3. Monitoring and troubleshooting challengesPivot Tracing addresses two main challenges in monitor-ing and troubleshooting. First, when the choice of what to record about an execution is made a priori, there is an inher-ent tradeoff between recall and overhead. Second, to diag-nose many important problems one needs to correlate and integrate data that crosses component, system, and machine boundaries.
One size does not fit all. Problems in distributed systems are complex, varied, and unpredictable. By default, the infor-mation required to diagnose an issue may not be reported by the system or contained in system logs. Current approaches tie logging and statistics mechanisms into the development path of products, where there is a mismatch between the expectations and incentives of the developer and the needs of operators and users. Panelists at SLAML2 discussed the important need to “close the loop of operations back to de-velopers.” According to Yuan et al.,25 regarding diagnosing failures, “(. . .) existing log messages contain too little infor-mation. Despite their widespread use in failure diagnosis, it is still rare that log messages are systematically designed to support this function.”
This mismatch can be observed in the many issues raised by users on Apache’s issue trackers16 requesting new met-rics, changes to aggregation methods, or new breakdowns of existing metrics. Many issues remain unresolved due to developer pushback or inertia.
Eventually, applications may be updated to record more information, but this has effects both in performance and information overload. Users must pay the performance over-heads of any systems that are enabled by default, regard-less of their utility. For example, HBase SchemaMetrics were introduced to aid developers, but all users of HBase pay the 10% performance overhead they incur.10 The HBase user guide carries the following warning for users wishing to integrate with Ganglia: “By default, HBase emits a large
Tracepoint Tracepoint w/ advice
Execution path Baggage propagation
PT Agent
PT Agent
Pivot TracingFrontend
Instrumented System
Query {
Message busAdvice Tuples
1
2
3
45
4 6
7
8
Figure 3. Pivot Tracing overview (Section 2.2).

MARCH 2020 | VOL. 63 | NO. 3 | COMMUNICATIONS OF THE ACM 97
level, it aims to enable flexible runtime monitoring by corre-lating metrics and events from arbitrary points in the system. The challenges outlined in Section 2 motivate the following high-level design goals:
1. Dynamically configure and install monitoring at runtime.
2. Low system overhead to enable “always on” monitoring.3. Capture causality between events from multiple pro-
cesses and applications.
Tracepoints. Tracepoints provide the system-level entry point for Pivot Tracing queries. A tracepoint typically corre-sponds to some event: a user submits a request, a low-level IO operation completes, an external RPC is invoked, etc. A tracepoint identifies one or more locations in the system code where Pivot Tracing can install and run instrumenta-tion, such as the name of a method. Since Pivot Tracing uses dynamic instrumentation to install queries, tracepoints do not need to be defined a priori, nor do they require a priori modification of system code; they are simply references to locations in the source code. A tracepoint is only material-ized once a query is installed that references it. Tracepoints export named variables that can be accessed by instrumen-tation, such as method arguments or local variables, as well as several default variables: host, timestamp, process id, process name, and the tracepoint definition.
Whenever execution of the system reaches a tracepoint, any instrumentation configured for that tracepoint will be invoked, generating a tuple with its exported variables. These are then accessible to any instrumentation code installed at the tracepoint.
Query language. Pivot Tracing enables users to express high-level queries about the variables exported by one or more tracepoints. We abstract tracepoint invocations as streaming datasets of tuples; Pivot Tracing queries are therefore rela-tional queries across the tuples of several such datasets.
To express queries, Pivot Tracing provides a parser for LINQ- like text queries such as those outlined in Section 2. Table 1 outlines the query operations supported by Pivot Tracing. Pivot Tracing supports several typical operations including projection (Π), selection (σ), grouping (G), and aggregation (A). Pivot Tracing aggregators include Count, Sum, Max, Min, and Average. Pivot Tracing also defines the temporal filters MostRecent, MostRecentN, First, and FirstN, to take the 1 or N most or least recent events. Finally, Pivot Tracing introduces the happened-before join query operator (→).
Happened-before joins. A key contribution of Pivot Tracing is the happened-before join query operator. Happened- before join enables the tuples from two Pivot Tracing queries to be joined based on Lamport’s happened before relation, →.15 For events a and b occurring anywhere in the system, we say that a happened before b and write a → b if the occurrence of event a causally preceded the occurrence of event b and they occurred as part of the execution of the same request.a If a
number of metrics per region server. Ganglia may have dif-ficulty processing all these metrics. Consider increasing the capacity of the Ganglia server or reducing the number of metrics emitted by HBase.”
The glut of recorded information presents a “needle-in-a-haystack” problem to users21; while a system may expose infor-mation relevant to a problem, for example, in a log, extracting this information requires system familiarity developed over a long period of time. For example, Mesos cluster state is exposed via a single JSON endpoint and can become massive, even if a client only wants information for a subset of the state.16
Dynamic instrumentation frameworks such as Fay,7 DTrace,4 and SystemTap20 address these limitations, by allow-ing almost arbitrary instrumentation to be installed dynam-ically at runtime, and have proven extremely useful in the diagnosis of complex and subtle system problems.3 Because of their side-effect-free nature, however, they are limited in the extent to which probes may share information with each other. In Fay, only probes in the same address space can share information, while in DTrace the scope is limited to a single operating system instance.
Crossing boundaries. This brings us to the second challenge Pivot Tracing addresses. In multi-tenant, multi-application stacks, the root cause and symptoms of an issue may appear in different processes, machines, and application tiers, and may be visible to different users. A user of one application may need to relate information from some other dependent application in order to diagnose problems that span multiple systems. For example, HBASE-41459 outlines how MapRe-duce lacks the ability to access HBase metrics on a per-task basis, and that the framework only returns aggregates across all tasks. MESOS-194918 outlines how the executors for a task do not propagate failure information, so diagnosis can be dif-ficult if an executor fails. In discussion the developers note: “The actually interesting/useful information is hidden in one of four or five different places, potentially spread across as many different machines. This leads to unpleasant and repetitive searching through logs looking for a clue to what went wrong. (. . .) There’s a lot of information, that is, hidden in log files and is very hard to correlate.”
Prior research has presented mechanisms to observe or infer the relationship between events and studies of logging practices conclude that end-to-end tracing would be helpful in navigating the logging issues they outline.16
A variety of these mechanisms have also materialized in production systems, for example, Google’s Dapper,23 Apache’s HTrace,1 and Twitter’s Zipkin.24 These approaches can obtain richer information about particular executions than component- centric logs or metrics alone, and have found uses in troubleshooting, debugging, performance analysis and anomaly detection, for example. However, most of these systems record or reconstruct traces of execution for offline analysis, and thus share the problems above with the first challenge, concerning what to record.
3. DESIGNWe now detail the fundamental concepts and mechanisms behind Pivot Tracing. Pivot Tracing is a dynamic monitoring and tracing framework for distributed systems. At a high
a This definition does not capture all possible causality, including when events in the processing of one request could influence another, but could be extended if necessary.
research highlights
98 COMMUNICATIONS OF THE ACM | MARCH 2020 | VOL. 63 | NO. 3
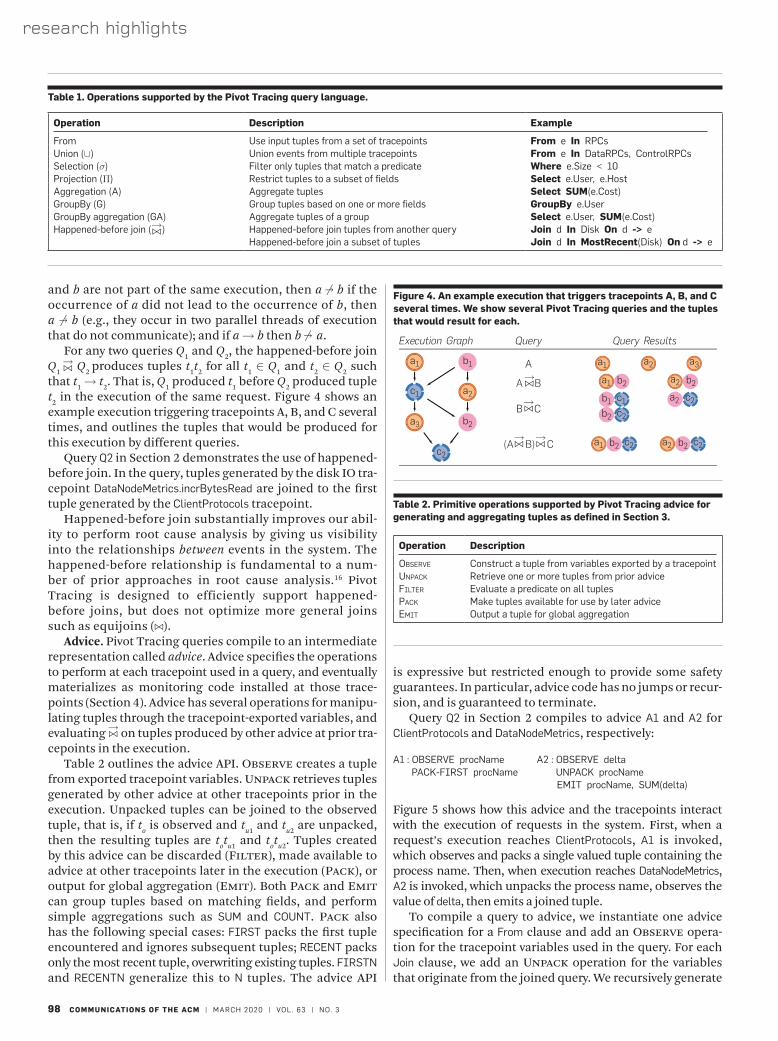
and b are not part of the same execution, then a b if the occurrence of a did not lead to the occurrence of b, then a b (e.g., they occur in two parallel threads of execution that do not communicate); and if a → b then b a.
For any two queries Q1 and Q2, the happened-before join Q1 → Q2 produces tuples t1t2 for all t1 ∈ Q1 and t2 ∈ Q2 such
that t1 → t2. That is, Q1 produced t1 before Q2 produced tuple t2 in the execution of the same request. Figure 4 shows an example execution triggering tracepoints A, B, and C several times, and outlines the tuples that would be produced for this execution by different queries.
Query Q2 in Section 2 demonstrates the use of happened-before join. In the query, tuples generated by the disk IO tra-cepoint DataNodeMetrics.incrBytesRead are joined to the first tuple generated by the ClientProtocols tracepoint.
Happened-before join substantially improves our abil-ity to perform root cause analysis by giving us visibility into the relationships between events in the system. The happened-before relationship is fundamental to a num-ber of prior approaches in root cause analysis.16 Pivot Tracing is designed to efficiently support happened-before joins, but does not optimize more general joins such as equijoins ( ).
Advice. Pivot Tracing queries compile to an intermediate representation called advice. Advice specifies the operations to perform at each tracepoint used in a query, and eventually materializes as monitoring code installed at those trace-points (Section 4). Advice has several operations for manipu-lating tuples through the tracepoint-exported variables, and evaluating → on tuples produced by other advice at prior tra-cepoints in the execution.
Table 2 outlines the advice API. Observe creates a tuple from exported tracepoint variables. Unpack retrieves tuples generated by other advice at other tracepoints prior in the execution. Unpacked tuples can be joined to the observed tuple, that is, if to is observed and tu1 and tu2 are unpacked, then the resulting tuples are totu1 and totu2. Tuples created by this advice can be discarded (Filter), made available to advice at other tracepoints later in the execution (Pack), or output for global aggregation (Emit). Both Pack and Emit can group tuples based on matching fields, and perform simple aggregations such as SUM and COUNT. Pack also has the following special cases: FIRST packs the first tuple encountered and ignores subsequent tuples; RECENT packs only the most recent tuple, overwriting existing tuples. FIRSTN and RECENTN generalize this to N tuples. The advice API
is expressive but restricted enough to provide some safety guarantees. In particular, advice code has no jumps or recur-sion, and is guaranteed to terminate.
Query Q2 in Section 2 compiles to advice A1 and A2 for ClientProtocols and DataNodeMetrics, respectively:
A1 : OBSERVE procName A2 : OBSERVE deltaPACK-FIRST procName UNPACK procName
EMIT procName, SUM(delta)
Figure 5 shows how this advice and the tracepoints interact with the execution of requests in the system. First, when a request’s execution reaches ClientProtocols, A1 is invoked, which observes and packs a single valued tuple containing the process name. Then, when execution reaches DataNodeMetrics, A2 is invoked, which unpacks the process name, observes the value of delta, then emits a joined tuple.
To compile a query to advice, we instantiate one advice specification for a From clause and add an Observe opera-tion for the tracepoint variables used in the query. For each Join clause, we add an Unpack operation for the variables that originate from the joined query. We recursively generate
Operation Description Example
From Use input tuples from a set of tracepoints From e In RPCsUnion (∪) Union events from multiple tracepoints From e In DataRPCs, ControlRPCsSelection (σ) Filter only tuples that match a predicate Where e.Size < 10Projection (Π) Restrict tuples to a subset of fields Select e.User, e.HostAggregation (A) Aggregate tuples Select SUM(e.Cost)GroupBy (G) Group tuples based on one or more fields GroupBy e.UserGroupBy aggregation (GA) Aggregate tuples of a group Select e.User, SUM(e.Cost)Happened-before join (→) Happened-before join tuples from another query Join d In Disk On d -> e
Happened-before join a subset of tuples Join d In MostRecent(Disk) On d -> e
Table 1. Operations supported by the Pivot Tracing query language.
Operation Description
Observe Construct a tuple from variables exported by a tracepointUnpack Retrieve one or more tuples from prior adviceFilter Evaluate a predicate on all tuplesPack Make tuples available for use by later adviceEmit Output a tuple for global aggregation
Table 2. Primitive operations supported by Pivot Tracing advice for generating and aggregating tuples as defined in Section 3.
Execution Graph
a1
c2
b2
a2
b1
a3
c1
Query Query Results
A
B C→
(A B) C→ →
A B→
a2
a2
c2
c2
a2 b2b2
c1
c2
c2
b2
b2 b2
a3a2a1
a1
a1
b1
Figure 4. An example execution that triggers tracepoints A, B, and C several times. We show several Pivot Tracing queries and the tuples that would result for each.

MARCH 2020 | VOL. 63 | NO. 3 | COMMUNICATIONS OF THE ACM 99
their source query. Agents publish partial query results back to the user at a configurable interval—by default, 1 s.
Dynamic instrumentation. Our prototype weaves advice at runtime, providing dynamic instrumentation similar to that of DTrace4 and Fay.7 Java version 1.5 onwards supports dynamic method body rewriting via the java.lang.instrument package. The Pivot Tracing agent pro-grammatically rewrites and reloads class bytecode from within the process using Javassist.5 To weave ad-vice, we rewrite method bodies to add advice invocations at the locations defined by the tracepoint. Our prototype supports tra-cepoints at the entry, exit, or exceptional return of any method. Tracepoints can also be inserted at specific line numbers.
To define a tracepoint, users specify a class name, method name, method signature, and weave location. Pivot Tracing also supports pattern matching, for example, all methods of an interface on a class. This feature is modeled after pointcuts from AspectJ.13 Pivot Tracing supports instrumenting privi-leged classes (e.g., FileInputStream in Section 2) by providing an optional agent that can be placed on Java’s boot classpath.
Pivot Tracing only makes system modifications when advice is woven into a tracepoint, so inactive tracepoints incur no overhead. Executions that do not trigger the tracepoint are unaffected by Pivot Tracing. Pivot Tracing has a zero-probe effect: methods are unmodified by default, so trace-points impose truly zero overhead until advice is woven into them.
Baggage. Our implementation of baggage uses thread-local variables for storing per-request baggage instances. At the beginning of a request, we instantiate empty baggage in the thread-local variable; at the end of the request, we clear the baggage from the thread-local variable. The baggage API can get or set tuples for a query and at any point in time bag-gage can be retrieved for propagation to another thread or serialization onto the network. To support multiple queries simultaneously, queries are assigned unique IDs and tuples are packed and unpacked based on this ID.
Hadoop instrumentation. Pivot Tracing relies on devel-opers to implement Baggage propagation when a request crosses thread, process, or asynchronous execution bound-aries. We have implemented this propagation in several open-source systems that are widely used in production today: HDFS, HBase, MapReduce, Tez, YARN, and Spark. To propagate baggage across remote procedure calls, we manually extended the protocol definitions of the systems. To propagate baggage across execution boundaries within individual processes we implemented AspectJ13 instrumen-tation to automatically modify common interfaces (Thread, Runnable, Callable, and Queue). Each system required between 50 and 200 lines of manual code modification. Once modi-fied, these systems could support arbitrary Pivot Tracing queries without further modification.
5. EVALUATIONIn this section, we evaluate Pivot Tracing with a case study in the context of the Hadoop Distributed FileSystem22 (HDFS).c HDFS is a distributed file system comprising a central NameNode process that manages filesystem metadata, and
advice for the joined query, and append a Pack operation at the end of its advice for the variables that we unpacked. Where directly translates to a Filter operation. We add an Emit operation for the output variables of the query, restricted according to any Select clause. Aggregate, GroupBy, and GroupByAggregate are all handled by Emit and Pack.
Baggage. Pivot Tracing enables inexpensive happened- before joins by providing the baggage abstraction. Baggage is a per-request container for tuples, that is, propagated alongside a request as it traverses thread, application, and machine boundaries. Pack and Unpack store and retrieve tuples from the current request’s baggage. Tuples follow the request’s execution path and therefore explicitly capture the happened-before relationship.
Baggage is a generalization of end-to-end metadata prop-agation techniques outlined in prior work such as X-Trace8 and Dapper.23 Using baggage, Pivot Tracing efficiently evalu-ates happened-before joins in situ during the execution of a request.
Tuple aggregation and query optimization. To reduce the volume of emitted tuples, Pivot Tracing performs intermedi-ate aggregation for queries containing Aggregate or GroupBy-Aggregate. Pivot Tracing aggregates the emitted tuples within each process and reports results globally at a regular interval, for example, once per second. Process-level aggregation sub-stantially reduces traffic for emitted tuples; Q2 from Section 2 is reduced from approximately 600 to 6 tuples per second from each DataNode. Pivot Tracing also rewrites queries to minimize the number of tuples that are packed during a request’s execu-tion, using the same query rewriting rules described by Fay7 that push projection, selection, and aggregation terms as close as possible to source tracepoints. We extend these query rewriting rules16 to add further optimizations for happened-before joins.
4. IMPLEMENTATIONWe have implemented a Pivot Tracing prototype in Java and applied Pivot Tracing to several open-source systems from the Hadoop ecosystem. Pivot Tracing source code and the instrumented systems are publicly available from the Pivot Tracing project website.b
Agent. A Pivot Tracing agent thread runs in every Pivot Tracing-enabled process and awaits instruction via central pub/sub server to weave advice to tracepoints. Tuples emitted by advice are accumulated by the local Pivot Tracing agent, which performs partial aggregation of tuples according to
ClientProtocolsTracepoint
DataNodeMetricsTracepoint
Request Execution
Client Processes HDFS DataNode
A1OBSERVE PACK
UNPACK OBSERVE
A2 EMIT
Figure 5. Advice generated for Q2 from Section 2: A1 observes and packs procName; A2 unpacks procName, observes delta, and emits (procName, SUM(delta) ).
b http://pivottracing.io.
c We refer the reader to the full evaluation16 for other case studies and evaluation of Pivot Tracing overheads.

research highlights
100 COMMUNICATIONS OF THE ACM | MARCH 2020 | VOL. 63 | NO. 3
multiple DataNode processes running across a cluster that store replicated file blocks. We describe our discovery of a replica selection bug in HDFS that resulted in uneven dis-tribution of load to replicas. After identifying the bug, we found that it had been recently reported and subsequently fixed in an upcoming HDFS version.11
HDFS provides file redundancy by decomposing files into blocks and replicating each block onto several machines (typically 3). A client can read any replica of a block and does so by first contacting the NameNode to find replica hosts (invoking GetBlockLocations), then selecting the closest rep-lica as follows: (1) read a local replica, (2) read a rack-local replica, and (3) select a replica at random. We discovered a bug whereby rack-local replica selection always follows a global static ordering due to two conflicting behaviors: the HDFS client does not randomly select between replicas; and the HDFS NameNode does not randomize rack-local repli-cas returned to the client. The bug results in heavy load on some hosts and near zero load on others.
In this scenario, we ran 96 stress test clients on an HDFS cluster of eight DataNodes and one NameNode. Each machine has identical hardware specifications; 8 cores, 16GB RAM, and a 1Gbit network interface. On each host, we ran a pro-cess called StressTest that used an HDFS client to perform closed-loop random 8kB reads from a dataset of 10,000 128MB files with a replication factor of 3. Our queries use tracepoints from both client and server RPC protocol imple-mentations of the HDFS DataNode DataTransferProtocol and NameNode GetBlockLocations client protocol.
Our investigation of the bug began when we noticed that the stress test clients on hosts A and D had consistently lower request throughput than clients on other hosts, shown in Figure 6a, despite identical machine specifications and setup. We first checked machine level resource utilization on each host, which indicated substantial variation in the network throughput (Figure 6b). We began our diagnosis with Pivot Tracing by first checking to see whether an imbalance in HDFS load was causing the variation in network throughput. The following query installs advice at a DataNode tracepoint, that is, invoked by each incoming RPC:
Q3 : From dnop In DN.DataTransferProtocolGroupBy dnop.hostSelect dnop.host, COUNT
Figure 6c plots the results of this query, showing the HDFS request throughput on each DataNode. It shows that DataNodes on hosts A and D in particular have substantially higher request throughput than others—host A has on aver-age 150 ops/s, while host H has only 25 ops/s. This behavior was unexpected given that our stress test clients are sup-posedly reading files uniformly at random. Our next query installs advice in the stress test clients and on the HDFS NameNode, to correlate each read request with the client that issued it:
Q4 : From getloc In NN.GetBlockLocationsJoin st In StressTest.DoNextOp On st -> getlocGroupBy st.host, getloc.srcSelect st.host, getloc.src, COUNT
(a)
(d) (e) (f) (g)
(b) (c)
0
20
40
60
80
0 1 2 3 4 5
Clie
nt th
roug
hput
(req
/s)
Time (min)
Client AClient BClient CClient D
Client EClient FClient GClient H
Host G Host HHost E Host F
Time (min)
Dat
aNod
e th
roug
hput
(ops
/s) 200
150
100
50
00 1 2 3 4 5
Client AClient BClient CClient DClient EClient FClient GClient H
Hos
t AH
ost B
Hos
t CH
ost D
Hos
t GH
ost H
Hos
t EH
ost F
Hos
t AH
ost B
Hos
t CH
ost D
Hos
t GH
ost H
Hos
t EH
ost F
Host AHost BHost CHost D
Host GHost H
Host EHost F
Hos
t AH
ost B
Hos
t CH
ost D
Hos
t GH
ost H
Hos
t EH
ost F
0
0.5
1
1.5
2
2.5
0 1 2 3 4 5
Host A Host BHost C Host D
Net
wor
k tr
ansf
er (M
B/s
)
Time (min)
Figure 6. Pivot Tracing query results leading to our discovery of HDFS-6268.11 Faulty replica selection logic led clients to prioritize the replicas hosted by particular DataNodes: host A was always preferred over other hosts if it held a replica; host D was always preferred, except if host A held a replica; etc. The increased load to host A DataNode reduced the throughput of co-located client A. (a) Clients on Hosts A and D experience reduced workload throughput. (b) Network transfer is skewed across machines. (c) HDFS DataNode throughput is skewed across machines. (d) Observed HDFS file read distribution (row) per client (col). (e) Frequency each client (row) sees each DataNode (col) as a replica location. (f) Frequency each client (row) subsequently selects each DataNode (col). (g) Observed frequency of choosing one replica host (row) over another (col).

MARCH 2020 | VOL. 63 | NO. 3 | COMMUNICATIONS OF THE ACM 101
At this point in our analysis, we concluded that this behavior was quite likely to be a bug in HDFS. HDFS clients did not randomly select between replicas, and the HDFS NameNode did not randomize the rack-local replicas. We checked Apache’s issue tracker and found that the bug had been recently reported and fixed in an upcoming version of HDFS.11
Application-level overhead. To estimate the impact of Piv-ot Tracing on application-level throughput and latency, we ran benchmarks from HiBench,12 YCSB,6 and HDFS DFSIO and NNBench benchmarks. Many of these benchmarks bottleneck on network or disk and we noticed no significant performance change with Pivot Tracing enabled.
To measure the effect of Pivot Tracing on CPU bound requests, we stress tested HDFS using requests derived from the HDFS NNBench benchmark: Read8k reads 8kB from a file; Open opens a file for reading; Create creates a file for writing; Rename renames an existing file. Read8kB is a DataNode operation and the others are NameNode opera-tions. We compared the end-to-end latency of requests in unmodified HDFS to HDFS modified in the following ways: (1) with Pivot Tracing enabled, (2) propagating baggage con-taining one tuple but no advice installed, (3) propagating baggage containing 60 tuples (≈1kB) but no advice installed, and (4) with queries Q3—Q7 installed.
Table 3 shows that the application-level overhead with Pivot Tracing enabled is at most 0.3%. This overhead includes the costs of empty baggage propagation within HDFS, bag-gage serialization in RPC calls, and to run Java in debug-ging mode. The most noticeable overheads are incurred when propagating 60 tuples in the baggage, incurring 15.9% overhead for Open. Since this is a short CPU-bound request (involving a single read-only lookup), 16% is within reason-able expectations. RENAME does not trigger any advice for queries Q3–Q7, reflected by an overhead of just 0.3%.
6. DISCUSSIONDespite the advantages over logs and metrics for trouble-shooting (Section 2), Pivot Tracing is not meant to replace all functions of logs, such as security auditing, forensics, or debugging.19
Pivot Tracing is designed to have similar per-query over-heads to the metrics currently exposed by systems today. It is feasible for a system to have several Pivot Tracing queries on by default; these could be sensible defaults provided by develop-ers, or custom queries installed by users to address their spe-cific needs. We leave it to future work to explore the use of Pivot Tracing for automatic problem detection and exploration.
This query counts the number of times each client reads each file. In Figure 6d, we plot the distribution of counts over a 5-min period for clients from each host. The distribu-tions all fit a normal distribution and indicate that all of the clients are reading files uniformly at random. The distribu-tion of reads from clients on A and D are skewed left, consis-tent with their overall lower read throughput.
Having confirmed the expected behavior of our stress test clients, we next checked to see whether the skewed datanode throughput was simply a result of skewed block placement across datanodes:
Q5 : From getloc In NN.GetBlockLocationsJoin st In StressTest.DoNextOp On st -> getlocGroupBy st.host, getloc.replicasSelect st.host, getloc.replicas, COUNT
This query measures the frequency that each DataNode is hosting a replica for files being read. Figure 6e shows that, for each client, replicas are near-uniformly distributed across DataNodes in the cluster. These results indicate that clients have an equal opportunity to read replicas from each DataNode, yet, our measurements in Figure 6c clearly show that they do not. To gain more insight into this inconsistency, our next query relates the results from Figure 6e to those from Figure 6c:
Q6 : From DNop In DN.DataTransferProtocolJoin st In StressTest.DoNextOp On st -> DNopGroupBy st.host, DNop.hostSelect st.host, DNop.host, COUNT
This query measures the frequency that each client selects each DataNode for reading a replica. We plot the results in Figure 6f and see that the clients are clearly favoring particular DataNodes. The strong diagonal is consistent with HDFS cli-ent preference for locally hosted replicas (39% of the time in this case). However, the expected behavior when there is not a local replica is to select a rack-local replica uniformly at ran-dom; clearly these results suggest that this was not happening.
Our final diagnosis steps were as follows. First, we checked to see which replica was selected by HDFS clients from the locations returned by the NameNode. We found that clients always selected the first location returned by the NameNode. Second, we measured the conditional probabilities that DataNodes precede each other in the locations returned by the NameNode. We issued the following query for the latter:
Q7 : From DNop In DN.DataTransferProtocolJoin getloc In NN.GetBlockLocations
On getloc -> DNopJoin st In StressTest.DoNextOp On st -> getlocWhere st.host != DNop.hostGroupBy DNop.host, getloc.replicasSelect DNop.host, getloc.replicas, COUNT
This query correlates the DataNode, that is, selected with the other DataNodes also hosting a replica. We remove the interference from locally hosted replicas by filtering only the requests that do a non-local read. Figure 6g shows that host A was always selected when it hosted a replica; host D was always selected except if host A was also a replica, and so on. This should not have been the case; due to random replica selec-tion, no host should have been preferred over any other host.
Read8k (%) Open (%) Create (%) Rename (%)
Unmodified 0 0 0 0PivotTracing Enabled 0.3 0.3 <0.1 0.2Baggage—1 Tuple 0.8 0.4 0.6 0.8Baggage—60 Tuples 0.82 15.9 8.6 4.1Queries Q3–Q7 1.5 4.0 6.0 0.3
Table 3. Latency overheads for HDFS stress test with Pivot Tracing enabled, baggage propagation enabled, and queries enabled.

research highlights
102 COMMUNICATIONS OF THE ACM | MARCH 2020 | VOL. 63 | NO. 3
While users are restricted to advice comprised of Pivot Tracing primitives, Pivot Tracing does not guarantee that its queries will be side-effect free, due to the way exported vari-ables from tracepoints are currently defined. We can enforce that only trusted administrators define tracepoints and require that advice be signed for installation, but a compre-hensive security analysis, including complete sanitization of tracepoint code is beyond the scope of this paper.
Even though we evaluated Pivot Tracing on an 8-node clus-ter in this paper, initial runs of the instrumented systems on a 200-node cluster with constant-size baggage being propa-gated showed negligible performance impact. It is ongoing work to evaluate the scalability of Pivot Tracing to larger clusters and more complex queries. Sampling at the advice level is a further method of reducing overhead that we plan to investigate.
We opted to implement Pivot Tracing in Java in order to easily instrument several popular open-source distrib-uted systems written in this language. However, the compo-nents of Pivot Tracing generalize and are not restricted to Java—a query can span multiple systems written in different programming languages due to Pivot Tracing’s platform-independent baggage format and restricted set of advice operations. In particular, it would be an interesting exercise to integrate the happened-before join with Fay or DTrace.
7. CONCLUSIONPivot Tracing is the first monitoring system to combine dynamic instrumentation and causal tracing. Its novel happened-before join operator fundamentally increases the expressive power of dynamic instrumentation and the appli-cability of causal tracing. Pivot Tracing enables cross-tier analysis between any interoperating applications, with low execution overhead. Ultimately, its power lies in the uniform and ubiquitous way in which it integrates monitoring of a heterogeneous distributed system.
Copyright held by authors/owners.
Jonathan Mace, Ryan Roelke, and Rodrigo Fonseca, Brown University Department of Computer Science, Providence, RI, USA.
12. Huang, S., Huang, J., Dai, J., Xie, T., Huang, B. The hibench benchmark suite: Characterization of the mapreduce-based data analysis. In New Frontiers in Information and Software as Services (2010). IEEE, pp. 41–51. (Section 5).
13. Kiczales, G., Hilsdale, E., Hugunin, J., Kersten, M., Palm, J., Griswold, W.G. An Overview of AspectJ. In European Conference on Object-Oriented Programming (London, UK, 2001). Springer-Verlag, pp. 327–353. (Section 4).
14. Kiczales, G., Lamping, J., Mendhekar, A., Maeda, C., Lopes, C.V., Loingtier, J.-M., Irwin, J. Aspect-oriented programming. In European Conference on Object-Oriented Programming, LNCS 1241 (June 1997), Springer-Verlag. (Section 2.2).
15. Lamport, L. Time, clocks, and the ordering of events in a distributed system. Commun. ACM 21, 7 (1978), 558–565. (Sections 1 and 3).
16. Mace, J., Roelke, R., Fonseca, R. Pivot tracing: Dynamic causal monitoring for distributed systems. In Proceedings of the 25th Symposium on Operating Systems Principles (2015). ACM, pp. 378–393. (Sections 1, 2.5, and 3).
17. Meijer, E., Beckman, B., Bierman, G. Linq: Reconciling object, relations and xml in the.net framework. In Proceedings of the 2006 ACM SIGMOD International Conference on Management of Data, SIGMOD’06 (New York, NY, USA, 2006). ACM, pp. 706–706. (Section 2.1).
18. MESOS-1949 All log messages from master, slave, executor, etc. should be collected on a per-task basis. https://issues.apache.org/jira/browse/MESOS-1949. [Online; accessed 25 February 2015]. (Section 2.3).
19. Oliner, A., Ganapathi, A., Xu, W. Advances and challenges in log analysis. Commun. ACM 55, 2 (2012), 55–61. (Section 6).
20. Prasad, V., Cohen, W., Eigler, F.C., Hunt, M., Keniston, J., Chen, B. Locating system problems using dynamic instrumentation. In 2005 Ottawa Linux Symposium (2005). (Section 2.3).
21. Rabkin, A., Katz, R.H. How hadoop clusters break. IEEE Softw. 30, 4 (2013), 88–94. (Section 2.3).
22. Shvachko, K., Kuang, H., Radia, S., Chansler, R. The Hadoop distributed file system. In 2010 IEEE 26th Symposium on Mass Storage Systems and Technologies (MSST) (2010). IEEE, pp. 1–10. (Section 5).
23. Sigelman, B.H., Barroso, L.A., Burrows, M., Stephenson, P., Plakal, M., Beaver, D., Jaspan, S., Shanbhag, C. Dapper, a large-scale distributed systems tracing infrastructure. Google Technical Report (2010). (Sections 1, 2.3, and 3).
24. Twitter Zipkin. http://twitter.github.io/zipkin/. [Online; accessed March 2015]. (Section 2.3).
25. Yuan, D., Zheng, J., Park, S., Zhou, Y., Savage, S. Improving software diagnosability via log enhancement. ACM Trans Comput Syst 30, 1 (2012), 4. (Section 2.3).
1. Apache HTrace. http://htrace.incubator.apache.org/. [Online; accessed March 2015]. (Section 2.3).
2. Bodik, P. Overview of the workshop of managing large-scale systems via the analysis of system logs and the application of machine learning techniques (SLAML’11). SIGOPS Oper. Syst. Rev. 45, 3 (2011), 20–22. (Section 2.3).
3. Cantrill, B. Hidden in plain sight. ACM Queue 4, 1 (Feb. 2006), 26–36. (Sections 1 and 2.3).
4. Cantrill, B., Shapiro, M.W., Leventhal, A.H. Dynamic instrumentation of production systems. In USENIX Annual Technical Conference, General Track (2004), pp. 15–28. (Sections 1, 2.3, and 4).
5. Chiba, S. Javassist: Java bytecode engineering made simple. Java Developer’s Journal 9, 1 (2004). (Section 4).
6. Cooper, B.F., Silberstein, A., Tam, E., Ramakrishnan, R., Sears, R. Benchmarking cloud serving systems with ycsb. In Proceedings of the 1st ACM Symposium on Cloud Computing (2010). ACM, pp. 143–154. (Section 5).
7. Erlingsson, Ú., Peinado, M., Peter, S., Budiu, M., Mainar-Ruiz, G. Fay: Extensible distributed tracing from kernels to clusters. ACM Trans. Comput. Syst. (TOCS) 30, 4 (2012), 13. (Sections 1, 2.3, 3, and 4).
8. Fonseca, R., Porter, G., Katz, R.H., Shenker, S., Stoica, I. X-trace: A pervasive network tracing framework. In Proceedings of the 4th USENIX Conference on Networked Systems Design & Implementation (Berkeley, CA, USA, 2007), NSDI’07, USENIX Association. (Sections 1 and 3).
9. HBASE-4145 Provide metrics for HBASE client. https://issues.apache.org/jira/browse/HBASE-4145. [Online; accessed 25 February 2015]. (Section 2.3).
10. HBASE-8370 Report data block cache hit rates apart from aggregate cache hit rates. https://issues.apache.org/jira/browse/HBASE-8370. [Online; accessed 25 February 2015]. (Section 2.3).
11. HDFS-6268 Better sorting in NetworkTopology.pseudoSortByDistance when no local node is found. https://issues.apache.org/jira/browse/HDFS-6268. [Online; accessed 25 February 2015]. (Sections 1 and 3).
References