Embed Size (px)
Citation preview

EMEP/EEA air pollutant emission inventory guidebook 2019 1
Category Title
NFR: 1.A.3.a, 1.A.5.b * Aviation
SNAP: 080501
080502
080503
080504
080100
Domestic airport traffic (LTO cycles — ≤ 3000 ft (914.4 m))
International airport traffic (LTO cycles — ≤ 3000 ft (914.4 m))
Domestic cruise traffic (> 3000 ft (914.4 m))
International cruise traffic (> 3000 ft (914.4 m))
Military aviation
ISIC:
Version Guidebook 2019
Lead authors
Morten Winther, Kristin Rypdal
Contributing authors (including to earlier versions of this chapter)
Lene Sørensen, Manfred Kalivoda, Monica Bukovnik, Niels Kilde, Riccardo De Lauretis, Robert Falk,
Daniela Romano, Robin Deransy, Laurent Box, Laura Carbo, Nuria Torres Meana, Mark Whiteley.
1.A.3.a, 1.A.5.b Aviation
EMEP/EEA air pollutant emission inventory guidebook 2019 2
Contents
1 Overview .......................................................................................................... 3
1.1 Reporting ....................................................................................................................................... 3
2 Description of sources .................................................................................... 4
2.1 Aircraft engine emissions ............................................................................................................ 4
2.2 Techniques .................................................................................................................................... 5
2.3 Activities related to flight movements ....................................................................................... 9
2.4 Categories of flights included in aviation inventory activities ..............................................10
2.5 Contribution from aviation to the combustion emissions from mobile sources ...............11
2.6 Controls .......................................................................................................................................11
2.7 Contribution of air traffic to total emissions ..........................................................................13
3 Methods .......................................................................................................... 14
3.1 Choice of method .......................................................................................................................14
3.2 Tier 1 fuel-based methodology ................................................................................................19
3.3 Tier 2 method .............................................................................................................................21
3.4 Tier 3 flight- and aircraft-type methodology ...........................................................................25
3.5 Emission species profiles ..........................................................................................................31
4 Data quality ................................................................................................... 33
4.1 Completeness .............................................................................................................................33
4.2 Double counting with other sectors ........................................................................................34
4.3 Verification ..................................................................................................................................34
4.4 Uncertainty assessment ............................................................................................................34
4.5 Inventory quality assurance/quality control (QA/QC) ............................................................35
4.6 Gridding .......................................................................................................................................35
4.7 Reporting and documentation .................................................................................................35
4.8 Areas for improvements in current methodology .................................................................35
5 Glossary and acronyms ................................................................................ 36
6 References ..................................................................................................... 37
7 Point of enquiry ............................................................................................. 40
Annex 1 Projections ......................................................................................... 41
Annex 2 Additional comments on emission factors ................................... 45
Annex 3 Black carbon (BC) fractions of particulate matter emissions from
aviation ............................................................................................................ 46
Annex 4 EUROCONTROL fuel burn and emissions inventory system ....... 49
Annex 5 Emission calculator accompanying files ........................................ 51
................................................................ (see separate files online)

1.A.3.a, 1.A.5.b Aviation
EMEP/EEA air pollutant emission inventory guidebook 2019 3
1 Overview
The emissions to be included comprise the civil aviation portion of combustion emissions from
mobile sources related to the movement of people and/or freight by air. The activities comprise:
international airport traffic (LTO cycles (1) 3 000 ft (914.4 m))
international cruise traffic (> 3 000 ft (914.4 m))
domestic airport traffic (LTO cycles 3 000 ft (914.4 m))
domestic cruise traffic (> 3 000 ft (914.4 m)).
The emissions to be included comprise emissions from the civil commercial use of aeroplanes,
including scheduled and charter traffic for passengers and freight, air taxiing and general aviation.
The distinction between international and domestic air traffic should be determined on the basis of
departure and landing locations for each flight stage and not by the nationality of the airline. Fuel
used at airports for ground transport should be excluded from these NFR (Nomenclature for
Reporting) codes, and reported under 1.A.5.b, Other Mobile. Fuel for stationary combustion at
airports should also be excluded and reported under the appropriate stationary combustion
category.
The importance of this sector ranges from negligible to quite significant for some pollutants’
contribution to the inventories for many countries. Importantly, many emissions from this sector are
increasing at a higher rate than from many other sources. The major pollutants generated by these
activities are carbon dioxide (CO2) and nitrogen oxides (NOx), but with important contributions from
carbon monoxide (CO), hydrocarbons (HCs) and sulphur oxides (SOx).
1.1 Reporting
Inventory compilers should note that differences exist for the reporting of domestic landing/take-off
(LTO) and climb/cruise/descent (CCD) (SNAP codes 080501 and 080503, respectively) and
international LTO and CCD (SNAP codes 080502 and 080504, respectively) between (1) the
Convention on Long-Range Transboundary Air Pollution (CLRTAP) and the National Emission Ceilings
(NEC) Directive, and (2) the EU greenhouse gas Monitoring Mechanism Regulation (MMR) for
greenhouse gases and the United Nations Framework Convention on Climate Change (UNFCCC).
Specifically, these instruments use different definitions with regard to whether the domestic and
international LTO/CCD elements should be included within the reported national totals, or should
be reported as additional ‘memo items’. The United Nations Economic Commission for Europe
(UNECE) Reporting Guidelines (2) provide the definitions for the reporting of emissions to the CLRTAP.
Any questions concerning the reporting of emissions to the Convention should be addressed to the
European Monitoring and Evaluation Programme (EMEP) Centre on Emission Inventories and
Projections (CEIP).
(1) ‘LTO cycles’ refer to landing and take-off cycles. The International Civil Aviation Organization (ICAO) defines
an LTO cycle as those activities occurring up to 3 000 ft (914.4 m) above ground level — see ICAO (2011).
(2) Available at http://www.ceip.at

1.A.3.a, 1.A.5.b Aviation
EMEP/EEA air pollutant emission inventory guidebook 2019 4
2 Description of sources
2.1 Aircraft engine emissions
The pollutants produced by aviation mainly come from the combustion of jet fuel and aviation
gasoline (the latter is produced by only small aircraft and helicopters equipped with piston engines)
that are used as fuel for the aircraft. The main emission species produced are:
CO2
NOx
H2O vapour
CH4
CO
sulphur oxides (SOx)
non-methane volatile organic compounds (NMVOCs)
particulate matter (PM).
Figure 2.1 depicts the air flow through an aircraft engine and the species that result from the
combustion process. The lower part of Figure 2.1 gives an indication of the proportions of each input
and output gas.
Figure 2.1 Aircraft fuel combustion
Source: Based on Wuebbles et al., (2007).

1.A.3.a, 1.A.5.b Aviation
EMEP/EEA air pollutant emission inventory guidebook 2019 5
2.2 Techniques
2.2.1 Aircraft engines
As shown in Figure 2.2, the main types of aircraft engines are:
reciprocating (piston) engines
gas turbine engines.
A reciprocating (piston) engine uses piston and crank mechanisms to extract the energy from fuel
burnt in a combustion chamber. This drives the propellers to give the aircraft momentum.
A gas turbine engine compresses air before burning fuel in a combustion chamber, thereby heating
it. The major part of the energy produced is used for propelling the aircraft, while a minor portion is
used to drive the turbine, which drives the compressor. There are three main types of gas turbine
engine: jet engines, which include turbojet and turbofan engines; turboprop engines; and turboshaft
engines.
Turbojet engines use only energy from the expanding exhaust stream for propulsion, whereas
turbofan and turboprop engines use energy from the turbine to drive a fan or propeller, respectively,
for propulsion. Turboshaft engines are a form of gas turbine engine that is optimised to produce
shaft power rather than thrust. Turboshaft engines are commonly used in applications, such as in
helicopters and aircraft auxiliary power units that require a sustained and high power output, a high
degree of reliability, a small size and a low weight.
Note that emissions from aircraft auxiliary power units (APU) are not included in the calculation
methodologies described in this chapter.
Figure 2.2 Aircraft engine types

1.A.3.a, 1.A.5.b Aviation
EMEP/EEA air pollutant emission inventory guidebook 2019 6
Table 2.1 presents the most-used engine types for each of the most-used aircraft types flying under
Instrument Flight Rules (IFR) (3) in the European airspace in 2015. It shows that 80 % of IFR flight
movements in Europe were performed by only 31 different types of aircraft, which represents only
a small percentage of the 546 different types of aircraft identified by EUROCONTROL-STATFOR
(Statistics and Forecasts) (EUROCONTROL, 2016d). Each aircraft is of a type that is designated by an
International Civil Aviation Organization (ICAO) code, as defined in ICAO ‘DOC 8643 — Aircraft Type
Designators’ (ICAO, 2016a). For example, B738 designates a Boeing 737-800 (amongst others models
of the same type), which is an aircraft with two jet engines. In Europe in 2015, the B738 aircraft fleet
was mainly equipped with the following engines: the CFM56-7B26, the CFM56–7B24 and the CFM56–
7B22. B738 flights accounted for 16.7 % of a total of 9 888 590 IFR flight movements in the European
airspace in 2015.
Table 2.1 Flight movements in Europe per aircraft type, 2015
ICAO
code
Aircraft name Number
of engines
Engine
type
Move-
ments
(%)
Cumulative
% move-
ments
Most-common engine types
for the specified aircraft
B738 Boeing 737-800 2 J 16.7 16.7 CFM56–7B26, CFM56–7B22,
CFM56–7B27
A320 Airbus A-320 2 J 16.3 33.0 CFM56–5B4/P, V2527-A5
A319 Airbus A-319 2 J 9.6 42.7 CFM56–5B5/P, CFM56–5B6/P
A321 Airbus A-321 2 J 5.5 48.2 V2533-A5, CFM56–5B3/P
E190 Embraer ERJ-190 2 J 3.4 51.6 CF34–10E
DH8D DHC-8-400 Dash 8 2 TP 3.2 54.8 PW150A
B737 Boeing 737-700 2 J 2.1 56.8 CFM56–7B24, CFM56–7B22,
CFM56–7B20
A332 Airbus A-330-200 2 J 1.6 58.4 TRENT 772B-60, CF6–80E1A3,
PW4168A
CRJ9 CRJ-900 Regional
Jet
2 J 1.6 60.0 CF34–8C5
B77W Boeing 777-300ER 2 J 1.5 61.5 GE90–115B, GE90–115BL2
E170 Embraer 170 2 J 1.4 62.9 CF34–8E5
AT75 ATR-72-500 2 TP 1.3 64.2 PW127F, PW127
A333 Airbus A-330-300 2 J 1.3 65.4 TRENT 772B-60, PW4168A, CF6–
80E1A2
B763 Boeing 767-300 2 J 1.3 66.7 PW4060, CF6–80C2B7F, CF6–
80C2B6
B733 Boeing 737-300 2 J 1.2 67.9 CFM56–3B1, CFM56–3C1,
CFM56–3B2
B752 Boeing 757-200 2 J 1.2 69.1 RB211–535E4, RB211–535E4-B,
RB211–535C
AT72 ATR-72-200 2 TP 1.0 70.1 PW124B
B772 Boeing 777-200 2 J 1.0 71.1 GE90–94B, GE90–85B, TRENT 892
B744 Boeing 747-400 4 J 1.0 72.1 CF6–80C2B1F, RB211–524H2,
PW4056
DH8A DHC-8-100 Dash 8 2 TP 0.9 73.0 PW120A
(3) Flights flying under civil Instrument Flight Rules (IFR).

1.A.3.a, 1.A.5.b Aviation
EMEP/EEA air pollutant emission inventory guidebook 2019 7
E145 Embraer EMB-145 2 J 0.8 73.8 AE3007A, AE3007A1
B734 Boeing 737-400 2 J 0.8 74.6 CFM56–3C1
B736 Boeing 737-600 2 J 0.7 75.3 CFM56–7B20
RJ1H RJ-100 Avroliner 4 J 0.7 76.0 LF507–1F
AT76 ATR-72-600 2 TP 0.6 76.6 PW127M
B788 Boeing 787-8
Dreamliner
2 J 0.6 77.2 GENX-64B, TRENT 1000
B735 Boeing 737-500 2 J 0.6 77.8 CFM56–3B1, CFM56–3C1
BE20 Super King Air 200 2 TP 0.6 78.4 PT6A-42, PT6A-41
C56X Citation XLS 2 J 0.6 78.9 PW545B
F100 Fokker 100 2 J 0.5 79.4 TAY 650–15
SB20 SAAB 2000 2 TP 0.5 80.0 GMA2100A
A388 Airbus A-380-800 4 J 0.5 80.5 TRENT 970–84, GP7270
J, turbofan or turbojet; TP, turboprop.
Source: EUROCONTROL, 2016d.
2.2.2 Phases of flight
As illustrated in Figure 2.3, a typical aircraft flight includes several phases of flight; these are:
taxi-out
take-off
climb-out
climb
cruise
descent
final approach
landing
taxi-in.

1.A.3.a, 1.A.5.b Aviation
EMEP/EEA air pollutant emission inventory guidebook 2019 8
Figure 2.3 Typical phases of flight
Source: EUROCONTROL
‘Taxi-out’ is the controlled movement of an aircraft on the ground, under its own power, between its
parking area and the point of the runway from which its taking-off operations will occur.
‘Take-off’ is the phase of flight in which an aircraft moves from the runway to flying in the air.
‘Climb’ — which in Figure 2.3 is divided into ‘climb-out’ and ‘climb’ — is the phase of flight during
which the aircraft ascents to a predetermined cruising altitude after take-off. Although a single climb
phase is typical, multiple-step climb phases may also occur.
‘Cruise’ occurs between the climb and descent phases and is usually the longest part of a journey. It
ends as the aircraft approaches its destination and the descent phase of the flight commences in
preparation for landing. During the cruise phase, because of operational or air traffic control (ATC)
reasons, aircraft may climb or descend from one flight level to a higher or lower flight level. During
very long flights, aircraft are able to fly higher as the weight of the fuel aboard decreases. Usually,
pilots ask ATC to allow them to fly at the optimum flight level for the aircraft they are operating. This
optimum flight level is dependent on, for example, the type of aircraft, its operating weight and the
length of the flight. ATC generally accept this request if it does not jeopardise safety. For most
commercial passenger aircraft, the cruise phase of a flight consumes the majority of the fuel.
‘Descent’ is the phase of flight during which the aircraft decreases its altitude in preparation for
landing and is the opposite of the climb phase. As for the climb, descent can be continuous or
stepped as a result of operational or ATC reasons; continuous descent is the most fuel-efficient
option.
‘Final approach’ is the last leg of an aircraft’s approach to landing, when the aircraft is in line with the
runway and descending for landing.
‘Landing’ is the part of a flight when an aircraft returns to the ground up to the point at which taxi-in
starts.

1.A.3.a, 1.A.5.b Aviation
EMEP/EEA air pollutant emission inventory guidebook 2019 9
‘Taxi-in’ is the movement of an aircraft on the ground, under its own power, that occurs from the
point that the aircraft turns off the landing runway (after returning to normal taxi speed) to the point
at which it parks on the ground and shuts down its engines.
2.3 Activities related to flight movements
For the purposes of this document, a ‘flight movement’ starts when an aircraft begins taxiing out and
finishes when the aircraft comes to a stop after taxiing in.
Exhaust emissions from aviation arise from the combustion of jet fuel and aviation gasoline. They
arise during all activities related to flight movements and can be grouped into groups of activities as
shown in Figure 2.4 and listed below:
pre-departure activities
departure activities
CCD activities
emergency activities
arrival activities
post-arrival activities
maintenance activities.
Figure 2.4 Activities related to flight movements (source: EUROCONTROL)
Of the activities related to flight movements listed above, the three main activities for which global
fuel usage and emissions inventories are possible are:
departure activities
CCD activities
arrival activities.
As illustrated in Figure 2.5, the different activities related to flight movements are described below.
Departure includes activities near the airport that take place below a height of
3 000 ft (914.4 m). It includes taxi-out, take-off and climb-out.

1.A.3.a, 1.A.5.b Aviation
EMEP/EEA air pollutant emission inventory guidebook 2019 10
CCD is defined as all activities that take place above 3 000 ft (914.4 m). No upper limit of
height is given. CCD includes the climb from the end of the climb-out phase up to the cruise
altitude, the cruise and the descent from the cruise altitude to the start of the arrival phase.
Arrival includes activities near the airport that take place below a height of 3 000
ft (914.4 m). It includes the final approach, landing and taxi-in phases of the flight.
Note
In the aviation inventory domain, activities that take place during the departure and arrival phases
of a flight are added and reported together as ‘landing and take-off’ (LTO) activities, while activities
that take place during the CCD phases of a flight are added and reported together as ‘Cruise’
activities.
Figure 2.5 Aviation inventory activities versus the typical phases of a flight
Source: EUROCONTROL
2.4 Categories of flights included in aviation inventory activities
In principle, there are four categories of flight movements that should be included in aviation
activities in a country. These categories are:
category 1 — IFR flights;
category 2 — Civil visual flight rule (VFR) flights, also called general aviation;
category 3 — Civil helicopters;
category 4 — Operational military flights.
However, for some categories, a country’s aviation activity data might be scarce or confidential and
therefore cannot be included or accounted for as thoroughly as for the other categories. The
different categories are described below.
Category 1 — Civil IFR flights. This is the category from which most emissions originate.
Flight movement data are often recorded for this category of aircraft, and methods for
estimating the amount of fuel burnt and emissions generated by this category are quite
mature. Aircraft in category 1 can be classified according to the type of engine they are
equipped with: turbojet, turboprop or piston.

1.A.3.a, 1.A.5.b Aviation
EMEP/EEA air pollutant emission inventory guidebook 2019 11
Category 2 — Civil VFR flights. This category concerns small aircraft used for leisure,
agriculture, taxi flights, etc. Aircraft used for civil VFR flights are generally equipped with
turboprop or piston engines.
Category 3 — Helicopters. This category concerns all types of rotorcraft. Helicopters are
often operated under VFR and rarely under IFR. Therefore, it might be difficult to collect
precise information on helicopter movements in a country. At present, most helicopters use
turboshaft engines to power their rotors, but some small helicopters still use piston engines.
It should be noted that the phases of flight schematically represented in Figure 2.3 and
Figure 2.5 do not apply to the way in which helicopters manoeuvre.
Category 4 — Military aircraft. In principle, this category is included in national inventories
but the reporting of the emissions from military aircraft is under NFR code 1.A.5, and not
1.A.3.a. However, there may be some difficulties in estimating these activities because of
scarce and often confidential military data. Some movements of military aircraft, such as
non-operational activities, might be included in category 1.
2.5 Contribution from aviation to the combustion emissions from mobile
sources
Figure 2.6 summarises the contribution of aviation to the combustion emissions from mobile
sources.
Figure 2.6 Contribution from aviation to the combustion emissions from mobile sources
Aviation exhaust emissions are categorised as being ‘International’ or ‘Domestic’ depending on
whether the arrival airport is, or is not, in the same state as the departure airport (see Table 3.2).
2.6 Controls
Current environmental activities of the ICAO are largely undertaken through the Committee on
Aviation Environmental Protection (CAEP). CAEP assists the ICAO Council with the formulation of new

1.A.3.a, 1.A.5.b Aviation
EMEP/EEA air pollutant emission inventory guidebook 2019 12
policies and the adoption of new Standards and Recommended Practices (SARPs) related to aircraft
noise and emissions, and, more generally, the environmental impact of aviation.
So far, the emission species for which there are ICAO standards are:
NOx (most recently updated in 2005);
CO (most recently updated in 1997);
unburned HCs (most recently updated in 1984);
engine smoke.
The standards published by ICAO, against which engines are certificated, are given in the form of the
total quantity of pollutants (Dp) emitted in an LTO cycle, divided by the maximum sea level thrust
(Foo) and plotted against the engine pressure ratio at maximum sea level thrust.
Table 2.2 shows engine power settings and times-in-mode for the LTO cycle specified by ICAO (ICAO,
2008a).
Table 2.2 Default ICAO LTO cycle engine thrust settings and times-in-mode
Operating mode Thrust setting Time in operating mode
(minutes)
Take-off 100 % Foo 0.7
Climb-out 85 % Foo 2.2
Approach-landing 30 % Foo 4.0
Taxi/ground idle 7 % Foo 26.0
The ICAO Aircraft Engine Emissions Databank is maintained by the European Aviation Safety Agency
(EASA) on behalf of the ICAO and contains information on exhaust emissions (provided by engine
manufacturers) for turbojet and turbofan engines that have entered production (ICAO, 1995).
For turboprop engines, the Swedish Defence Research Agency (FOI) maintains a confidential
database of emission indices of NOX, HCs and CO with corresponding fuel flows. The datasheets in
this database have been supplied by turboprop engine manufacturers, originally for the purposes
of calculating emissions-related landing charges. Access to the database can be requested via a
dedicated webpage (FOI, 2016).
The only source for emissions data for piston engine aircraft is provided by the Federal Office of Civil
Aviation (FOCA), which is responsible for aviation development and the supervision of civil aviation
activities in Switzerland (FOCA, 2007).
Note: Standards that are expected to be accepted by ICAO in the near future
CO2 standard
In February 2016, under CAEP recommendations, a new CO2 emissions standard was established,
and was unanimously recommended by the 170 international experts on the ICAO CAEP, paving
the way for its ultimate adoption by the United Nations (UN) agency’s Governing Council. The
standard will not be applicable to only new aircraft type designs as of 2020, but also to new
deliveries of current in-production aircraft types from 2023. A cut-off date of 2028 for production
of aircraft that do not comply with the standard was also recommended. In its current form, the
1.A.3.a, 1.A.5.b Aviation
EMEP/EEA air pollutant emission inventory guidebook 2019 13
standard acknowledges CO2 reductions arising from a range of possible technological innovations,
whether structural, aerodynamic or propulsion based. The proposed standard addresses the full
range of sizes and types of aircraft used in international aviation, and covers technological
feasibility, emissions reduction potential and cost considerations (based on ICAO, 2016b).
‘Non-volatile’ PM
Aircraft engines burning fuels produce gaseous and PM emissions as by-products of combustion.
At the engine exhaust, particulate emissions mainly consist of ultrafine soot or black carbon
emissions. Such particles are called ‘non-volatile’ PM (nvPM). They are present at the high
temperatures of the engine exhaust. Compared with traditional diesel engines, gas turbine engine
non-volatile particles are typically smaller in size. In February 2016, CAEP recommended the first
nvPM standard for aircraft engines with thrust rated greater than 26.7 kN.
The reader is advised to regularly check the ICAO website (http://www.icao.int/env) for the most
recent information about ICAO standards.
2.7 Contribution of air traffic to total emissions
The total contribution of aircraft emissions to total global anthropogenic CO2 emissions is considered
to be about 2 % (IPCC, 1999). This relatively small contribution to global emissions should be seen in
relation to the fact that most aircraft emissions are injected almost directly into the upper free
troposphere and lower stratosphere. The Intergovernmental Panel on Climate Change (IPCC) has
estimated that the contribution to radiative forcing is about 3.5 %. The importance of this source is
growing as the volume of air traffic steadily increases.
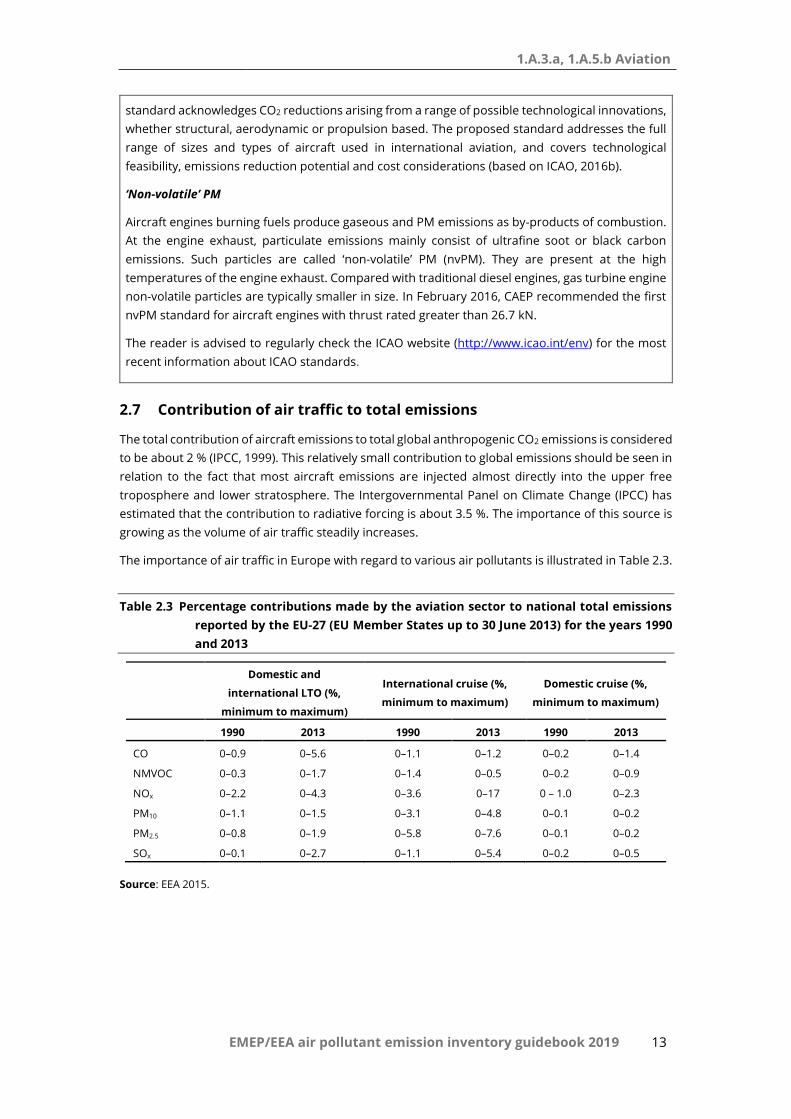
The importance of air traffic in Europe with regard to various air pollutants is illustrated in Table 2.3.
Table 2.3 Percentage contributions made by the aviation sector to national total emissions
reported by the EU-27 (EU Member States up to 30 June 2013) for the years 1990
and 2013
Domestic and
international LTO (%,
minimum to maximum)
International cruise (%,
minimum to maximum)
Domestic cruise (%,
minimum to maximum)
1990 2013 1990 2013 1990 2013
CO 0–0.9 0–5.6 0–1.1 0–1.2 0–0.2 0–1.4
NMVOC 0–0.3 0–1.7 0–1.4 0–0.5 0–0.2 0–0.9
NOx 0–2.2 0–4.3 0–3.6 0–17 0 – 1.0 0–2.3
PM10 0–1.1 0–1.5 0–3.1 0–4.8 0–0.1 0–0.2
PM2.5 0–0.8 0–1.9 0–5.8 0–7.6 0–0.1 0–0.2
SOx 0–0.1 0–2.7 0–1.1 0–5.4 0–0.2 0–0.5
Source: EEA 2015.

1.A.3.a, 1.A.5.b Aviation
EMEP/EEA air pollutant emission inventory guidebook 2019 14
3 Methods
3.1 Choice of method
3.1.1 Overview
Figure 3.1 presents the decision tree to follow to determine the appropriate tier method for
estimating the total fuel consumption and emissions from aviation. This decision tree is applicable
to all nations. When estimating aviation emissions, the following should be considered:
use as detailed information as is available;
if the source category is a key source, then a Tier 2 or Tier 3 method must be used to
estimate the emissions.
Figure 3.1 Decision tree for determining the appropriate tier method to apply
Note: EF – emission factor.

1.A.3.a, 1.A.5.b Aviation
EMEP/EEA air pollutant emission inventory guidebook 2019 15
The three tiers are harmonised with those specified in the IPCC 2006 Guidelines (IPCC, 2006).
Table 3.1 summarises the data required for use of the three tiers in terms of activity measures. It will
often be the case that the overall emissions for category 2 and 3 flights are sufficiently small and that
the statistics available are so poor that a Tier 1 approach for these portions of aviation is appropriate.
Table 3.1 Summary of input data required for the three tiers of inventory methodology
Tier Activity Data and tools used
Tier 1 Fuel sales sub-divided into domestic
and international usage
Total LTO numbers for domestic and
international
Use average fleet mix (i.e. generic aircraft EFs) and average
factors for LTO and CCD
Tier 2 Fuel sales sub-divided into domestic
and international use, as for Tier 1
LTO numbers for domestic and
international, per aircraft type
Use of aircraft-specific LTO EFs and average EFs for CCD
Tier 3 Data for each flight containing
aircraft type and flight distance, sub-
divided into domestic and
international
Tier 3A: Use specific aircraft type/engine data from the
spreadsheet accompanying this chapter, available from the
2016 EMEP/EEA air pollutant emission inventory guidebook
(EEA, 2016) website
Tier 3B: Use EUROCONTROL Advanced Emission Model
(AEM) US/Federal Aviation Administration (FAA) Aviation
Environmental Design Tool (AEDT) or similar tools with
specific airport taxi times
The Tier 1 and Tier 2 methodologies are based on LTO data and the quantity of fuel sold or used, as
illustrated in Figure 3.2. It is assumed that fuel used equals fuel sold. From the total fuel sold for
aircraft activities, allocations are made according to the requirements for IPCC and UNECE reporting.
The emissions estimation can be made following either the Tier 1 or Tier 2 methodology outlined
below.
To estimate the total emissions of CO2, SO2 and heavy metals, the Tier 1 methodology is sufficient,
as the emissions of these pollutants are dependent on the fuel only and not on the technology. The
emissions of PM10 or PM2.5 are aircraft and payload dependent. Therefore, when estimating the total
emissions of these pollutants, it may be appropriate to consider the aircraft activity in more detail
using the Tier 2 methodology. The Tier 3 methodology may be used to get an independent estimate
of fuel and CO2 emissions from domestic and international air traffic.

1.A.3.a, 1.A.5.b Aviation
EMEP/EEA air pollutant emission inventory guidebook 2019 16
Figure 3.2 Estimation of aircraft emissions using the Tier 1 and Tier 2 methodologies
3.1.2 Choice of activity data
The way in which the activity statistics are derived is critical to the difference between Tier 1 and 2.
Since emissions from domestic aviation are reported separately from international aviation and for
LTO and CCD, it is necessary to disaggregate the activity data for these components. This section lays
out options regarding how this should be done — this is also consistent with the approach used to
estimate greenhouse gases. The basic starting points are national statistics on fuel consumption and,
for Tier 2, data on take-offs and landings with more detailed information about aircraft
types/engines.

1.A.3.a, 1.A.5.b Aviation
EMEP/EEA air pollutant emission inventory guidebook 2019 17
3.1.3 Domestic and international split
To disaggregate between domestic and international activity data, the definitions outlined in
Table 3.2 should be applied irrespective of the nationality of the carrier. For consistency, it is good
practice to use similar definitions for domestic and international aviation activities. In some cases,
the national energy statistics may not provide data consistent with this definition. It is good practice
for countries to separate the activity data, consistent with this definition. In any case, a country must
clearly define the methodologies and assumptions used.
Table 3.2 Criteria for defining international or domestic aviation (applies to individual legs of
journeys with more than one take-off and landing)
Flight between two airports Domestic International
Departs and arrives in the same state Yes No
Departs from one state and arrives in another No Yes
Note
Based on past experience of compiling aviation emissions inventories, difficulties have been
identified regarding the international/domestic split, particularly with obtaining the information on
passenger and freight drop-off and pick-up at stops in the same country that was required by the
IPPC GHG Guidelines (IPCC 1997, 2006). Most flight data are collected on the basis of individual flight
segments (from one take-off to the next landing) and do not distinguish between different types of
intermediate stops (as called for in GPG2000). Basing this distinction on flight segment data
(origin/destination) is therefore simpler and is likely to reduce uncertainties. It is very unlikely that
this change would make a significant change to the emission estimates (4). This does not change the
way in which emissions from international flights are reported as a memo item that are not included
in national totals.
Improvements in technology and optimisation of airline operating practices have significantly
reduced the need for intermediate technical stops. An intermediate technical stop would also not
change the definition of a flight as being domestic or international. For example, if explicit data are
available, countries may define flight segments as international if they depart from one country with
a destination in another country and make an intermediate technical stop. A technical stop is solely
for the purpose of refuelling or solving a technical difficulty, and not for the purpose of passenger
or cargo exchange.
If national energy statistics do not already provide data consistent with this definition, countries
should then estimate domestic and international fuel consumption according to the definition, using
the approaches set out below.
Top-down data can be obtained from taxation authorities in cases in which fuel sold for domestic
use is subject to taxation, but fuel sold for international use is not taxed. Airports or fuel suppliers
may have data on the delivery of aviation kerosene and aviation gasoline for domestic and
international flights. In most countries tax and custom dues are levied on fuels for domestic
consumption, and fuels for international consumption (bunkers) are free of such dues. In the
absence of more direct sources of data, information about domestic taxes may be used to
distinguish between domestic and international fuel consumption.
(4) It is good practice to clearly state the reasoning and justification if any country opts to use the GPG2000
definitions.

1.A.3.a, 1.A.5.b Aviation
EMEP/EEA air pollutant emission inventory guidebook 2019 18
Bottom-up data can be obtained from surveys of airline companies for fuel used for domestic and
international flights, or estimates from aircraft movement data and standard tables of fuel
consumed or both. Fuel consumption factors for aircraft (fuel used per LTO and per nautical mile
cruised) can be used for estimates and may be obtained from the airline companies.
Examples of sources for bottom-up data, including aircraft movements, are:
● statistical offices or transport ministries as a part of national statistics;
● airport records;
● ATC records, for example EUROCONTROL statistics;
● air carrier schedules published monthly by independent providers of travel;
● information which contains worldwide timetable passenger and freight aircraft movements,
as well as regular scheduled departures of charter operators.
Some of these sources do not cover all flights (e.g. charter flights may be excluded). On the other
hand, airline timetable data may include duplicate flights because of code shares between airlines
or duplicate flight numbers. Methods have been developed to detect and remove these duplicates
(Baughcum et al., 1998; Sutkus et al., 2001).
3.1.4 Military aircraft
Although military aviation is not reported here, it makes sense to include a basic description of the
methodology in this chapter, appropriately cross-referenced from the chapter on NFR code 1.A.5.
Military activities are defined here as those activities using fuel purchased by or supplied to the
military authorities of the country. Emissions from aviation fuel use can be estimated using the Tier 1
algorithm and the same calculation approach recommended for civilian aviation. Some types of
military transport aircraft and helicopters have fuel and emissions characteristics similar to civil
types. Therefore, default emission factors for civil aircraft should be used for military aviation unless
better data are available. Alternatively, fuel use may be estimated from the hours in operation.
Default fuel consumption factors for military aircraft are given in Tables 3.9 and 3.10.
Military aircraft (transport planes, helicopters and fighters) may not have a civilian equivalent, so a
more detailed method of data analysis is encouraged if data are available. Inventory compilers
should consult military experts to determine the most appropriate emission factors for a country’s
military aviation.
Because of confidentiality issues, many inventory compilers may have difficulty obtaining data on
the quantity of fuel used by the military. Military activities are defined here as those activities using
fuel purchased by or supplied to the military authorities in the country. Countries can apply the rules
used to define civilian, national and international aviation operations to military operations if the
data necessary to apply those rules are comparable and available. In this case, the international
military emissions may be reported under ‘International Aviation’ (‘International Bunkers’), but must
then be shown separately. Data on military fuel use should be obtained from government military
institutions or fuel suppliers. If data on the international–domestic fuel split are unavailable, all the
fuel sold for military activities should be treated as domestic.
Emissions resulting from multilateral operations pursuant to the Charter of the United Nations
should not be included in national totals; other emissions related to operations shall be included in
the national emissions totals of one or more parties involved. The national calculations should take
into account fuel delivered to the country’s military, as well as fuel delivered within that country but
used by the military of other countries. Other emissions related to operations (e.g. off-road ground

1.A.3.a, 1.A.5.b Aviation
EMEP/EEA air pollutant emission inventory guidebook 2019 19
support equipment) shall be included in the national emissions totals in the appropriate source
category.
National circumstances may vary, and in particular, distances travelled and fuel consumption may
be affected by national route structures, airport congestion and air-traffic control practices.
3.2 Tier 1 fuel-based methodology
3.2.1 Algorithm
The Tier 1 approach for aviation is based on fuel consumption data for aviation divided by LTO and
for domestic and international flights separately. The method uses a simple approach to estimate
the division of fuel use between CCD and LTO, as shown schematically in Figure 3.2.
The Tier 1 approach for aviation emissions uses the following general equation:
pollutantnconsumptiofuelpollutant EFARE (1)
where
Epollutant is the annual emission of pollutant for each of the LTO and CCD phases of domestic and
international flights;
ARfuel consumption is the activity rate by fuel consumption for each of the flight phases and flight types;
and
EFpollutant is the emission factor of pollutant for the corresponding flight phase and flight type.
This equation is applied at the national level, using annual national total fuel use data disaggregated
for domestic and international flights. Information on fuel consumption for domestic and
international flights should be available from national statistics, as described above, or is widely
available from UN statistical yearbooks or national statistics. Aircraft emissions estimates according
to the Tier 1 approach can be obtained by following the steps detailed in sub-section 3.2.3.
3.2.2 Default emission factors
Tier 1 emission factors (EFPollutant, fuel type) assume an averaged technology for the fleet, and
knowledge of the number of domestic and international LTO cycles for the nation. Default fuel and
emissions values are presented in the Annex 5 accompanying spreadsheets (‘1.A.3.a Aviation – Annex
5 - Master emission calculator 2016’ and ‘1.A.3.a Aviation – Annex 5 - LTO emissions calculator 2016’)
– a representative aircraft type can be selected if detailed flight movement data are not available. If
statistics are available for fuel use and the number of LTOs for domestic and international flights,
the assumptions on LTO fuel consumption below can be used to divide these data into LTO and CCD
data using equation 1.
Total fuel = LTO fuel + CCD fuel (equation 1)
Where:
LTO fuel = number of LTOs fuel consumption per LTO
CCD fuel = total fuel consumption – LTO fuel consumption

1.A.3.a, 1.A.5.b Aviation
EMEP/EEA air pollutant emission inventory guidebook 2019 20
Jet kerosene
Using the relationships above and the data in the accompanying spreadsheets (Annex 5), the
emissions for the four different NFR codes can be calculated.
Aviation gasoline
Aviation gasoline is assumed to be used for only domestic aviation. Table 3.3 provides the Tier 1
emission factors for NFR 1.A.3.a.ii.(i): Civil aviation (domestic, LTO) for gasoline-fuelled aircraft. The
95 % confidence limits quoted are 50 % and 200 % of the mean values.
Table 3.3 Tier 1 emission factors for NFR 1.A.3.a.ii.(i): Civil aviation (domestic, LTO)
Tier 1 emission factor
Code Name
NFR Source Category 1.A.3.a.ii.(i) Civil aviation (domestic, LTO)
Fuel Jet Gasoline and Aviation Gasoline
Not applicable HCH, PCB, HCB
Not estimated NH3, TSP, PM10, PM2.5, Pb, Cd, Hg, As, Cr, Cu, Ni, Se, Zn, PCDD/F, Benzo(a)pyrene,
Benzo(b)fluoranthene, Benzo(k)fluoranthene, Indeno(1,2,3-cd)pyrene
Pollutant Value Unit 95% confidence
interval
Reference
Lower Upper
NOx 4 kg/tonne fuel 2 8 Calculated using Tier 2 method
CO 1200 kg/tonne fuel 600 2400 Calculated using Tier 2 method
NMVOC 19 kg/tonne fuel 9.5 38 Calculated using Tier 2 method
SOx 1 kg/tonne fuel 0.5 2 Assuming 0.05% S by mass
Note: If national PM emission factors are available, a BC fraction of PM (f-BC) equal to 0.15 is
suggested (for further information see Annex 3).
3.2.3 Calculation steps of the Tier 1 approach
The Tier 1 approach is based on the premise that data on the quantities of fuel sold for aviation use
are available, most probably from nationally collected data. It also assumes that the annual quantity
of fuel used is the same as that sold.
Information on the country’s total number of LTOs must be available, preferably also the destination
(long and short distance) for international LTOs, together with a general knowledge about the aircraft
types carrying out aviation activities.
Aircraft emissions estimates according to the Tier 1 methodology can be obtained by following the
steps outlined below.
1. Obtain the total amount of fuel sold for all aviation (in ktonnes).
2. Obtain the amount of fuel used for domestic aviation only (in ktonnes).
3. Calculate the total amount of fuel used for international aviation by subtracting the domestic
aviation (step 2) from the total fuel sold (step 1).
4. Obtain the total number of LTOs carried out for domestic aviation.

1.A.3.a, 1.A.5.b Aviation
EMEP/EEA air pollutant emission inventory guidebook 2019 21
5. Calculate the total fuel use for LTO activities for domestic aviation by multiplying the number
of domestic LTOs by the domestic fuel use factors for one representative aircraft (see Annex 5:
‘1.A.3.a Aviation – Annex 5 - LTO emissions calculator 2016’) (quantity obtained in step 4
multiplied by fuel use for representative aircraft).
6. Calculate the fuel used for CCD activities for domestic aviation by subtracting the fuel used for
domestic LTO (step 5) from the total domestic fuel used (step 2).
7. Estimate the emissions related to domestic LTO activities by multiplying the emission values
(per LTO) for domestic traffic with the number of LTOs for domestic traffic. Emission values are
suggested for old and average-aged fleet by representative aircraft (see Annex 5: ‘1.A.3.a
Aviation – Annex 5 - LTO emissions calculator).
8. Estimate the emissions related to domestic CCD activities by multiplying the corresponding
emission values (in emissions/fuel used) in 1.A.3.a Aviation – Annex 5 - LTO emissions calculator’
with the domestic CCD fuel use. Emission factors are suggested for an old and an average-aged
fleet by representative aircraft.
9. Repeat steps 4 to 8 but substitute domestic activities with international activities. For
international flights, it is preferable to distinguish between short- (< 1 000 nm (5)) and long-
distance (> 1 000 nm) flights. The latter is normally performed by large fuel-consuming aircraft
compared with the shorter distance flights (e.g. within Europe). If this distinction cannot be
made, the LTO emissions are expected to be largely overestimated in most countries.
3.3 Tier 2 method
3.3.1 Algorithms
The Tier 2 approach can be applied if it is possible to obtain information on LTOs per aircraft type
but there is no information available on CCD distances. Information on the aircraft types used for
both domestic and international aviation, together with the number of LTOs carried out by the
various aircraft types, is necessary for this methodology.
Apart from this level of further detail according to aircraft type, the algorithms are the same as for
the Tier 1 approach:
typeaircraftpollutanttypeaircraftnconsumptiofuel
typesAircraft
pollutant EFARE ,, (2)
where, as before, Epollutant is the annual emission of pollutant for each of the LTO and CCD phases of
domestic and international flights; ARfuel consumption, aircraft type is the activity rate by fuel consumption for
each of the flight phases and flight types, for each aircraft type; and EFpollutant, aircraft type is the
emission factor of pollutant for the corresponding flight phase and flight type, for each aircraft type.
3.3.2 Aircraft-specific fuel used and emission values
Table 3.4 is an extract from the Annex 5 of the aviation chapter “1.A.3.a Aviation – Annex 5 - Master
emissions calculator 2016” that lists LTO fuel consumption and emission factors for certain aircraft
types with their most frequent engine types. Note that the values provided in Table 3.4 for LTO are
based on standard ICAO taxi times and these may differ significantly from average taxi times at
European airports. In addition, the Annex 5 of the aviation chapter “1.A.3.a Aviation – Annex 5 - LTO
(5) Where nm = nautical miles, 1 nm = 1 852 km.

1.A.3.a, 1.A.5.b Aviation
EMEP/EEA air pollutant emission inventory guidebook 2019 22
emissions calculator 2016”, provides a means to easily estimate the amount of fuel used and
emissions exhausted during the LTO cycles of a large range of aircraft at a particular European
airport for a particular year between 2005 and 2015 based on average taxi times. The average taxi
time has been provided by EUROCONTROL’s Central Office of Delay Analysis (CODA). The fuel burnt
and emission data in both of these spreadsheets have been provided by EUROCONTROL with the
aim of supporting the European Union and EU Member States in the maintenance and provision of
European and national emission inventories. These fuel burn and emission data are modelled
estimates and not 'absolute' values and should not be used for comparing fuel efficiency and
emission data between aircraft models and manufacturers. The engine associated to each aircraft
type is the most common type of engine used for each aircraft type in 2015.
Table 3.4 Examples of aircraft types and emission values for LTO cycles as well as fuel
consumption per aircraft type, in kg/LTO (ICAO default LTO duration: 32 minutes
and 54 seconds)
Notes: * Denotes engine types that have been updated or changed from the previous version of the table.
UID – Unique identifier.
3.3.3 Calculation steps for Tier 2
The Tier 2 methodology is predominantly a top-down (fuel-sold) methodology that uses statistics on
aviation fuel consumption (split by domestic and international). To split the fuel use by LTO and CCD,
detailed LTO activity data and knowledge of aircraft fleet composition are needed to provide a more
accurate inventory as opposed to using only average emission factors per mass of fuel used (the
Tier 1 approach). The Tier 2 methodology should include all types of aircraft frequently used for

1.A.3.a, 1.A.5.b Aviation
EMEP/EEA air pollutant emission inventory guidebook 2019 23
domestic and international aviation. The two accompanying spreadsheets (Annex 5) available from
the 2016 EMEP/EEA air pollutant emission inventory guidebook (EEA, 2016) website (‘1.A.3.a Aviation –
Annex 5 - Master emission calculator 2016’ and ‘1.A.3.a Aviation - Annex 5 - LTO emissions calculator
2016) provide a way of mapping actual aircraft to representative aircraft types in the database.
The approach involves the steps outlined below.
1. Obtain the total amount of fuel sold for all aviation (in ktonnes).
2. Obtain the total amount of fuel used for domestic aviation (in ktonnes).
3. Calculate the amount of fuel used for international aviation by subtracting the domestic
aviation (step 2) from the total fuel sold (step 1) (in ktonnes).
4. Obtain the total number of LTOs carried out per aircraft type for domestic aviation. As
mentioned above in this chapter, the spreadsheet ‘1.A.3.a Aviation annex 2 2016’ contains data
on most aircraft types.
5. Calculate the fuel use for LTO activities per aircraft type for domestic aviation. For each aircraft
type, multiply the fuel use factor in the spreadsheet accompanying this chapter (Annex 5 ‘1.A.3.a
Aviation – Annex 5 - LTO emissions calculator 2016’). The calculations are carried out for all types
of generic aircraft. Calculate the total fuel use for LTO activities by summing all contributions
found under step 5 for domestic aviation. If some types of national aircraft in use are not found
in the table, use a similar type taking into account size and age. For LTOs for smaller aircraft and
turboprops, also see section 3.4.1 that includes information on non-IFR flights.
6. Calculate the total fuel use for domestic CCD by subtracting the total amount of fuel for LTO
activities found in step 6 from the total in step 2 (estimated as for the Tier 1 methodology).
7. Estimate the emissions from domestic LTO activities per aircraft type. The number of LTOs
for each aircraft type is multiplied by the emission factor related to the particular aircraft type
and pollutant. This is done for all generic aircraft types. Relevant fuel use and emission values
can again be found in the spreadsheet accompanying this chapter (Annex 5 ‘1.A.3.a Aviation –
Annex 5 - LTO emissions calculator 2016’). If some types of national aircraft in use are not found
in this spreadsheet, use a similar type taking into account size and age. For LTOs for smaller
aircraft, also see the section on non-IFR flights. Their emissions will have to be estimated
separately by a simpler method.
8. Estimate the emissions from domestic CCD activities. Use the domestic CCD fuel use and the
corresponding emission factor for the most common aircraft type used for domestic CCD
activities (the Tier 1 or Tier 3 methodology). Relevant fuel use and emission values can be found
in the accompanying spreadsheet for the Tier 3 methodology (‘Annex 5 ‘1.A.3.a Aviation – Annex
5 - LTO emissions calculator 2016’).
9. Calculate the total emissions for LTO activities for domestic aviation. Add all contributions
from the various aircraft types as found under step 7. The summations shall take place for each
of the pollutants for which emissions are to be estimated (for CO2, NOx, SO2, etc.).
10. Calculate the total emissions for CCD activities for domestic aviation. Add all contributions
from the various aircraft types as found under step 8. The summations shall take place for each
of the pollutants for which emissions are to be estimated (for CO2, NOx, SO2, etc.).
11. Repeat the calculation (steps 4–10) for international aviation.

1.A.3.a, 1.A.5.b Aviation
EMEP/EEA air pollutant emission inventory guidebook 2019 24
3.3.4 Abatement
The technology abatement approach is not relevant for this methodology.
3.3.5 Military aircraft
The Tier 2, that is, aircraft type-specific, methodology is also applicable to the calculation of the
emissions from military aircraft. However, it should be noted that the reporting of emissions from
military aircraft is under NFR code 1.A.5, not 1.A.3.a.
There are two potential activity indicators:
total fuel used by military aircraft;
number of flight hours per aircraft type, multiplied by average fuel consumption in
kg/hour.
The accompanying Annex 5 spreadsheets ‘1.A.3.a Aviation – Annex 5 - Master emission calculator
2016’ and ‘1.A.3.a Aviation - Annex 5 - LTO emissions calculator 2016’ provide some generic and
aircraft-specific fuel consumption data for military aircraft. The emission factors given in the
abovementioned spreadsheets (which are per unit of fuel combusted) can then be used with the
fuel-used data to calculate emissions.
Table 3.5 Fuel consumption factors for generic military aircraft
Group Sub-group Representative type Fuel flow (kg/hour)
1. Combat Fast jet — high thrust
Fast jet — low thrust
F16
Tiger F-5E
3 283
2 100
2. Trainer Jet trainers
Turboprop trainers
Hawk
PC-7
720
120
3. Tanker/transport Large tanker/transport
Small transport
C-130
ATP
2 225
499
4. Other MPAs, maritime patrol C-130 2 225
Source: ANCAT, British Aerospace/Airbus.
Table 3.6.Fuel consumption per flight hour for specific military aircraft
Aircraft Type Aircraft description Fuel use
(litres per hour)
A-10A Twin engine light bomber 2 331
B-1B Four engine long-range strategic bomber; used by USA only 13 959
B-52H Eight engine long-range strategic bomber; used by USA only 12 833
C-12J Twin turboprop light transport; Beech King Air variant 398
C-130E Four turboprop transport; used by many countries 2 956
C-141B Four engine long-range transport; used by USA only 7 849
C-5B Four engine long-range heavy transport; used by USA only 13 473
C-9C Twin engine transport; military variant of DC-9 3 745
E-4B Four engine transport; military variant of Boeing 747 17 339
F-15D Twin engine fighter 5 825
F-15E Twin engine fighter-bomber 6 951
F-16C Single engine fighter; used by many countries 3 252

1.A.3.a, 1.A.5.b Aviation
EMEP/EEA air pollutant emission inventory guidebook 2019 25
KC-10A Three engine tanker; military variant of DC-10 10 002
KC-135E Four engine tanker; military variant of Boeing 707 7 134
KC-135R Four engine tanker with newer engines. Boeing 707 variant 6 064
T-37B Twin engine jet trainer 694
T-38A Twin engine jet trainer; similar to F-5 262
3.4 Tier 3 flight- and aircraft-type methodology
The Tier 3 methodologies are based on actual flight movement data, either for Tier 3A origin and
destination (OD) data or for Tier 3B full flight trajectory information. These methodologies are
bottom-up, flight-based, rather than top-down calculation-based, on the fuel consumed. An example
of a system implementing a Tier 3 methodology is provided in Annex 4.
Tier 3A takes into account CCD emissions for different flight distances. Consequently, details on the
origin (departure) and destination (arrival) airports and aircraft type are needed to use this approach,
for both domestic and international flights. In Tier 3A, inventories are modelled using average fuel
consumption and emissions data for the LTO phase and various CCD phase lengths, for an array of
representative aircraft categories.
The Tier 3A methodology takes into account that the quantity of emissions generated varies between
phases of flight. It also takes into account that fuel burn is related to flight distance, while recognising
that this fuel burn can be comparably higher over relatively short distances than on longer routes.
This is because aircraft use more fuel per distance for the LTO cycle compared with the ‘en-route’
phase.
The Tier 3B methodology is distinguished from the Tier 3A methodology by the calculation of fuel
burnt and emissions throughout the full trajectory of each flight segment using aircraft- and engine-
specific aerodynamic performance information. To use Tier 3B, sophisticated computer models are
required to address all the equipment, performance and trajectory variables and calculations for all
flights in a given year.
Models used for Tier 3B calculations can generally specify output in terms of the aircraft, engine,
airport, region and global totals, as well as by latitude, longitude, altitude and time, for fuel burnt
and emissions of CO, HCs, CO2, H2O, NOx and SOx. To be used in preparing annual inventory
submissions, a Tier 3B model must calculate aircraft emissions from input data that take into
account air-traffic changes, aircraft equipment changes or any input-variable scenario.
Ideally, the components of Tier 3B models should be designed to be readily updated so that the
models are dynamic and can remain current with evolving data and methodologies. A list of Tier 3B
models can be found on the ICAO CAEP Modelling and Databases Group (MDG) web page (6).
The Tier 3 methodology described in this chapter only relates to Tier 3A.
3.4.1 Tier 3A fuel use and emission values
As for Tier 2 emissions, the values for CO2, SO2 and heavy metals are based on the fuel used, and PM
values are calculated from the PM2.5 emissions. The emissions of NOx, HC, CO and smoke, as well as
the fuel used, are calculated on a flight-by-flight basis using emission values available from the
accompanying Annex 5 spreadsheets to the chapter, which are available from the 2016 EMEP/EEA air
pollutant emission inventory guidebook (EEA, 2016) website.
(6) http://www.icao.int/environmental-protection/Pages/modelling-and-databases.aspx

1.A.3.a, 1.A.5.b Aviation
EMEP/EEA air pollutant emission inventory guidebook 2019 26
Instrument flight rules (IFR) flights
The fuel used and emission values for the Tier 3 methodology for more than 250 jets and turboprop
engines and for different flight distances are provided in the spreadsheet accompanying this
chapter; this spreadsheet is available from the 2016 EMEP/EEA air pollutant emission inventory
guidebook (EEA, 2016) website.
Note: The fuel burnt and emissions data provided in the accompanying Annex 5 spreadsheets are
for supporting the EU and EU Member States in the maintenance and provision of European and
national homogeneous emissions inventories. These data should not be used to compare fuel
efficiency and emissions data between aircraft models and manufacturers.
Note: The updated fuel burnt and emissions values provided in the spreadsheet accompanying
this chapter were calculated by using the EUROCONTROL Impact noise and emissions model to
derive/generate the ‘more fuel efficient’ trajectory for each couple (aircraft airframe/engine(s))
selected for a selection of stage lengths within maximum observed stage length for this aircraft
airframe, then by processing the trajectories obtained with the EUROCONTROL Advanced
Emission Model (AEM) (version 2.5.3) in stand-alone mode, for calculating the fuel burnt and
emissions values. These values are significantly different from the values obtained previously with
the older ‘PIANO’ model. A detailed description of how these data were calculated is provided in
the spreadsheet itself, as well as the exact list of the aircraft airframe and engine(s) pairs covered.

1.A.3.a, 1.A.5.b Aviation
EMEP/EEA air pollutant emission inventory guidebook 2019 27
Table 3.7 Illustrative spreadsheet output for a Boeing 737-400 equipped with two 8CM051
engines.
Note: The values provided for LTO in Table 3.10 are based on standard ICAO taxi times. These may
differ significantly from average taxi times at European airports. The Annex 5 spreadsheet ‘1.A.3.a
Aviation 2 LTO emissions calculator 2016 available from the 2016 EMEP/EEA air pollutant emission
inventory guidebook (EEA, 2016) website provides the means to calculate fuel used and emissions
LTO values for all European airports from 2005 to 2015.
Non-Instrument Flight Rules (non-IFR) flights
There is little information available on emission factors for non-IFR flights and it is, at present, not
possible to recommend default emission factors. Generally, the NOx emission factors will be lower
than for IFR flights and the CO and VOC factors substantially higher.
Fuel consumption factors are given for two categories of aircraft (Cessna and others) and these
should be used if other information on fuel used is not available (Table 3.8 and Table 3.9). Please

1.A.3.a, 1.A.5.b Aviation
EMEP/EEA air pollutant emission inventory guidebook 2019 28
note that the tables apply to single-engine aircraft only. If the aircraft is fitted with two engines (e.g.
Cessna 500), then the fuel consumption should be doubled. Ranges of emission factors are shown
in MEET (1997). A summary is given in Table 3.10.
Some emission factors and fuel-use factors for helicopters and military flights are given in Table 3.11,
Table 3.12 and Table 3.13. Also note that many types of military aircraft may have civil equivalents.
Table 3.8 Fuel consumption for piston-engined aircraft
Cessna C 152, C 172 and C 182
(single engine)
Altitude
0 ft 2 000 ft 4 000 ft
75 % power (= 135 horsepower (HP) 41 litre/hour 42 litre/hour No data
70 % power (= 126 HP) 37 litre/hour 38 litre/hour 39 litre/hour
65 % power (= 117 HP) 33.5 litre/hour 34 litre/hour 34.5 litre/hour
Note: For an average, use 36 litre/hour.
Table 3.9 Fuel consumption for non-Cessna aircraft
Robin (French aircraft), various Piper types (single
engine)
Altitude
0 ft 4 000 ft
70 % power 36.5 litre/hour No data
64 % power 34 litre/hour 33.5 litre/hour
58 % power 31 litre/hour 31 litre/hour
Note: For an average, use 33 litre/hour.
Table 3.10 Examples of emission factors for piston-engined aircraft in g/kg fuel
Piston-engine aircraft type NOx HC CO SO2
Netherlands FL 0–30 2.70 20.09 1 054 0.21
FL 30–180 4.00 12.50 1 080 0.17
Germany 3.14 18.867 798 0.42
Note: Multiply FL by 100 to obtain the altitude in ft .
Source: MEET (1997).
Table 3.11 Examples of emission factors for helicopters and military flights in selected
countries g/kg fuel
Country Nature of flights NOx HC CO SO2
Germany LTO cycle 8.3 10.9 39.3 1.1
Helicopter CCD 2.6 8.0 38.8 1.0
Combat jet 10.9 1.2 10.0 0.9
Cruise 0.46–3 km 10.7 1.6 12.4 0.9
Cruise > 3 km 8.5 1.1 8.2 0.9
Netherlands Average 15.8 4.0 126 0.2
F-16 15.3 3.36 102 0.2
Switzerland LTO cycle 4.631 2.59 33.9 1.025
CCD 5.034 0.67 14.95 0.999
Notes: If national PM emission factors are available, a BC fraction of PM (f-BC) of 0.48 is suggested (for further
information see Annex 3).
Source: MEET (1997).

1.A.3.a, 1.A.5.b Aviation
EMEP/EEA air pollutant emission inventory guidebook 2019 29
Table 3.12 Emission factors for helicopters of selected countries in g/kg fuel
Country NOx HC CO SO2
Germany: CCD 2.6 8.0 38.8 0.99
Netherlands: CCD 3.1 3.6 11.1 0.20
Switzerland 13.3 0.3 1.1 0.97
Source: MEET (1997).
Table 3.13 Fuel consumption factors for military aircraft
Group Sub-group Representative type Fuel flow kg/hour
1. Combat Fast jet — high thrust
Fast jet — low thrust
F16
Tiger F-5E
3 283
2 100
2. Trainer Jet trainers
Turboprop trainers
Hawk
PC-7
720
120
3. Tanker/transport Large tanker/transport
Small transport
C-130
ATP
2 225
499
4. Other MPAs, maritime patrol C-130 2 225
Source: ANCAT, British Aerospace/Airbus.
3.4.2 Tier 3A algorithm
The Tier 3A methodology is based on actual flight movement data.
The amount of fuel used and emission species are calculated using the emission values described in
sub-section 3.4, and the flight movement data obtained nationally or through organisations
collecting such information.
Instrument flight rules (IFR) flights
The total emissions from aircraft are given by the sum of emissions from various technologies of
aircraft in a continuous set of flying modes. In this methodology, the calculations are simplified by
classifying the aircraft into a representative set of generic aircraft types and into two classes of flying
modes: LTO and CCD. However, the methodology allows adjustment for actual times-in-mode of LTO
at individual airports. This method also permits the use of individual aircraft/engine combinations if
data are available.
The methodology involves the steps outlined below.
1. Collect flight details from national data, for example civil aviation records, airport records, from
the EUROCONTROL agency in Europe or the schedule timetable. This will identify the aircraft
that were used in the inventory period, the number of LTOs for each and the distance flown.
2. For the aircraft actually flying, select the aircraft used to represent these aircraft from the table
of equivalent aircraft (‘1.A.3.a Aviation annex 1 2016’ and ‘1.A.3.a Aviation annex 2 2016’). This is
called the ‘representative aircraft’. See also sub-section 0 on ‘Non-Instrument Flight Rules flights’
below. Their emissions will have to be estimated separately by a simpler method.
1.A.3.a, 1.A.5.b Aviation
EMEP/EEA air pollutant emission inventory guidebook 2019 30
3. See sub-section 3.1.2 ‘Choice of activity data’ for a description of how activity data can be
determined.
4. From the attached spreadsheet (available from the 2016 EMEP/EEA air pollutant emission
inventory guidebook (EEA, 2016) website), select an aircraft type. The spreadsheet will
automatically provide the fuel used and the emissions data corresponding to the LTO phase for
the representative aircraft, as well as the fuel used and the amount of emissions data for the
CCD portion of the flight for a series of pre-determined stage lengths.
5. For a specific distance not listed in the pre-determined stage lengths, simply enter the distance
in the ‘CCD stage length box’ and the spreadsheet will automatically perform a linear
interpolation to calculate the corresponding amount of fuel used and the emissions.
6. The total quantity of fuel used for the flight is the sum of the fuel used for LTO plus the fuel used
for the CCD portion of the flight.
7. The total level of pollutants emitted during the flight is the sum of the pollutants emitted in the
LTO phase plus the quantity emitted in the CCD portion of the flight.
The use of energy, and therefore emissions, depends on the aircraft operations and the time spent
at each stage. Table 2.2 shows engine power settings and times-in-mode for the LTO cycle, as
specified by ICAO (2008a). The actual operational time-in-mode might vary from airport to airport
depending on the traffic, environmental considerations, aircraft types and topographical conditions.
The proportion of fuel used in a flight which is attributed to LTO decreases as the flight distance
increases. Thus, a substantial part of the fuel consumption takes place outside the LTO cycle. Studies
indicate that the majority of NOx (60–80 %), SO2 and CO2 (80–90 %) is emitted at altitudes above
1 000 m: for CO it is about 50 %, and for VOC it is about 20–40 % (Olivier, 1991).
If times-in-modes are different from the assumptions made in this report, corrections may be made
from basic data in the accompanying spreadsheets.
Please note that the total estimated fuel use for domestic aviation must be compared with sales
statistics or direct reports from the airline companies. If the estimated fuel use deviates from the
direct observations, the main parameters used for estimating the fuel must be adjusted in
proportion to ensure that the mass of fuel estimated is the same as the mass of fuel sold.
Non-Instrument Flight Rules (non-IFR) flights
For some types of military or pleasure aircraft, the number of hours in flight is a better activity
indicator for estimating the fuel used and the emissions produced than the number of LTOs. In some
cases, data on the quantity of fuel used may be directly available.
Information on fuel used should be compiled by aircraft category. The fuel types, kerosene and
aviation gasoline, should be reported separately. If data are not directly available, estimate the fuel
used from the hours of operation and fuel consumption factors.
The appropriate emission factors and fuel use factors should be selected from Table 3.9 to Table
3.13.
To obtain an annual emissions estimate, the fuel consumption data in tonnes should be multiplied
by the fuel-based emission factors.

1.A.3.a, 1.A.5.b Aviation
EMEP/EEA air pollutant emission inventory guidebook 2019 31
3.5 Emission species profiles
Since very few experiments that have analysed the exhaust gas from aircraft turbines in detail have
been reported, it is not possible to give a specific emission species profile. In terms of NOx and VOCs,
the profiles vary with the thrust setting of the aircraft and therefore depend on the activity. In terms
of aircraft CCD, it is not possible to obtain accurate estimates for emission factors.
In terms of the LTO activity, the situation is similar. Attempts have been made to estimate the
composition of the VOC profile. The USEPA (2009) reports a VOC profile for aircraft equipped with
turbofan, turbojet and turboprop engines, based on Knighton et al. (2009). This composition is
presented in Table 3.14.
Please note that the thrust setting during the landing and the take-off of the aircraft are different
(see Table 2.2). Therefore, it is likely that the species profile will be different for these two situations.

1.A.3.a, 1.A.5.b Aviation
EMEP/EEA air pollutant emission inventory guidebook 2019 32
Table 3.14 Speciated gas phase profile for aircraft equipped with turbofan, turbojet and
turboprop engines
CAS CAS
Registry No.a Registry No.a
1,2,3-trimethylbenzene 526-73-8 0.00106 glyoxal 107-22-2 0.01816
1,2,4-trimethylbenzene 95-63-6 0.0035isobutene/1-
butene106-98-9 0.01754
1,3,5-trimethylbenzene 108-67-8 0.00054isopropylbenzen
e d98-82-8 0.00003
1,3-butadiened 106-99-0 0.01687isovaleraldehyd
e590-86-3 0.00032
1-decene 872-05-9 0.00185 methacrolein 78-85-3 0.00429
1-heptene 25339-56-4 0.00438 methanol d 67-56-1 0.01805
1-hexene 592-41-6 0.00736 methylglyoxal 78-98-8 0.01503
1-methyl naphthalene 90-12-0 0.00247 m-ethyltoluene 620-14-4 0.00154
1-nonene 124-11-8 0.00246 m-tolualdehyde 620-23-5 0.00278
108-38-3 /
106-42-3
1-pentene 109-67-1 0.00776 naphthalene d 91-20-3 0.00541
2-methyl-1-butene 563-46-2 0.0014 n-decane 124-18-5 0.0032
2-methyl-1-pentene 763-29-1 0.00034 n-dodecane 112-40-3 0.00462
2-methyl-2-butene 513-35-9 0.00185 n-heptadecane 629-78-7 0.00009
2-methyl-naphthalene e 91-57-6 0.00206 n-heptane 142-82-5 0.00064
2-methylpentane 107-83-5 0.00408 n-hexadecane 544-76-3 0.00049
3-methyl-1-butene 563-45-1 0.00112 n-nonane 111-84-2 0.00062
4-methyl-1-pentene 691-37-2 0.00069 n-octane 111-65-9 0.00062
acetaldehyde d 75-07-0 0.04272 n-pentadecane 629-62-9 0.00173
acetone 67-64-1 0.00369 n-pentane 109-66-0 0.00198
acetylene 74-86-2 0.03939n-
propylbenzene103-65-1 0.00053
acrolein d 107-02-8 0.02449 n-tetradecane 629-59-4 0.00416
benzaldehyde e 100-52-7 0.0047 n-tridecane 629-50-5 0.00535
benzene d 71-43-2 0.01681 n-undecane 1120-21-4 0.00444
butyraldehyde 123-72-8 0.00119 o-ethyltoluene 611-14-3 0.00065
c14-alkane No CAS 0.00186 o-tolualdehyde 529-20-4 0.0023
c15-alkane No CAS 0.00177 o-xylene d 95-47-6 0.00166
c16-alkane No CAS 0.00146 p-ethyltoluene 622-96-8 0.00064
c18-alkane No CAS 0.00002 p-tolualdehyde 104-87-0 0.00048
108-95-2 0.00726
c5-benzene + c4-aroald No CAS 0.00324 propane 74-98-6 0.00078
cis-2-butene 590-18-1 0.0021propionaldehyd
e d123-38-6 0.00727
cis-2-pentene 627-20-3 0.00276 propylene 115-07-1 0.04534
crotonaldehyde 4170-30-3 0.01033 styrene d 100-42-5 0.00309
dimethylnapthalenes 28804-88-8 0.0009 toluene d 108-88-3 0.00642
ethane 74-84-0 0.00521 trans-2-hexene 4050-45-7 0.0003
ethylbenzene d 100-41-4 0.00174 trans-2-pentene 646-04-8 0.00359
ethylenef 74-85-1 0.15461 valeraldehyde 110-62-3 0.00245
formaldehyde d,f 50-00-0 0.1231 unidentified b NA 0.29213
Sum of all compounds 1
0.00282
c4-benzene + c3-aroald No CAS 0.00656 phenol d
1-octene 25377-83-7 0.00276m-xylene and p-
xylene d
Compound Mass Fraction Compound Mass Fraction
Notes: Values in this table may be revised in the future as additional engine data become available.

1.A.3.a, 1.A.5.b Aviation
EMEP/EEA air pollutant emission inventory guidebook 2019 33
(a) CAS, Chemical Abstracts Service.
(b) See discussion of unidentified species in section 2.1 of this report.
(c) For commercial, military, general aviation and air taxi aircraft equipped with turbofan, turbojet and
turboprop engines.
(d) Identified as a hazardous air pollutant in Section 112 of the U.S. Clean Air Act (shaded above).
(e) Identified in US EPA’s Integrated Risk Information System (IRIS) as having toxic characteristics (shaded
above).
(f) Values were adjusted from those shown in knoghton et al. (2009) to account for rounding and to
facilitate inclusion of the data in the US EPA’s Speciate database (where the required sum of the values
is 1.00000).
Source: USEPA (2009).
4 Data quality
4.1 Completeness
Regardless of method, it is important to account for all fuel used for aviation in the country. The
methods are based on total fuel use, and should completely cover CO2 emissions. However, the
allocation between LTO and CCD will not be complete for the Tier 2 method if the LTO statistics are
not complete. In addition, the Tier 2 method focuses on passenger- and freight-carrying scheduled
and charter flights, and thus not all aviation. Furthermore, the Tier 2 method does not automatically
include non-scheduled flights and general aviation such as that involving agricultural aeroplanes,
private jets or helicopters, which should be added if the quantity of fuel is significant. Completeness
may also be an issue if military data are confidential; in this situation, it is good practice to aggregate
military fuel use with another source category.
Other aviation-related activities that generate emissions include fuelling and fuel handling in general,
maintenance of aircraft engines and fuel jettisoning to avoid accidents. In addition, in the wintertime,
anti-ice and de-ice treatment of wings and aircraft is a source of emissions at airport complexes.
Many of the materials used in these treatments flow off the wings when planes are idling, taxiing
and taking off, and then evaporate. These emissions are, however, very minor and specific methods
to estimate them are not included.
There are additional challenges with regard to distinguishing between domestic and international
emissions. As each country’s data sources are unique for this category, it is not possible to formulate
a general rule regarding how to make an assignment in the absence of clear data. It is good practice
to clearly specify the assumptions made so that the completeness can be evaluated.
In addition, the following sub-sections provide additional information on what is not included in the
methods.
4.1.1 Emissions from start-up of engines
There is currently little information available for the estimation of emissions from the start-up of
engines, and these are not included in the LTO cycle. This is not of great importance for total national
emissions, but they may have an impact on air quality in the vicinity of airports.
4.1.2 Auxiliary power operations
Auxiliary power units (APUs) are used when no other power source is available for the aircraft, and
may vary from airport to airport. This is the case, for example, if the aircraft is not parked in the
vicinity of the terminal building. The APU fuel use and the related emissions should be allocated on
1.A.3.a, 1.A.5.b Aviation
EMEP/EEA air pollutant emission inventory guidebook 2019 34
the basis of aircraft operations (number of landings and take-offs). However, no methodology for
this has yet been developed. The use of APUs is severely restricted at some airports to maintain high
levels of air quality, and therefore this source of fuel use and emissions may be declining. In total
terms, the fuel consumption and emissions contribution from this source is regarded as very small
(Winther et al., 2006).
4.1.3 Fuel dumping in emergencies
From time to time, aircraft will have to dump fuel before landing so that they do not exceed a certain
maximum landing weight. This is done at a location and altitude at which there will be no local impact
at ground level. Only large long-range aircraft will dump fuel. NMVOC emissions might become
significant at very large airports with frequent long-distance flights. However, since the most
probable altitude of these emissions will be above 1 000 m, these are currently not relevant for
UNECE reporting. The airport authorities and airline companies might give information on the extent
(frequency and amount) of dumping and the altitude at particular airports.
4.2 Double counting with other sectors
Emissions and fuel burnt from over-flights are excluded from these calculations to avoid double
counting of emissions.
4.3 Verification
The methodology presented here could be used with international flight statistics (e.g. ATC
providers) to provide a crosscheck against estimates made by individual national experts on the
basis of national fuel and flight statistics.
National estimates may be checked against scientific or central inventories.
Estimated emissions and fuel use per available seat per kilometre travelled may also be compared
between countries and aircraft types to ensure the credibility of the data that have been collected.
4.4 Uncertainty assessment
The uncertainties related to the estimated aircraft emissions are closely associated with the emission
factors assigned to the estimations.
The emissions of CO2 (and fuel use) are generally determined with a higher accuracy than the other
pollutants.
4.4.1 Tier 1 approach
The accuracy of the distribution of fuel between domestic and international will depend on the
national conditions.
The use of ‘representative’ emission factors may contribute significantly to the uncertainty. In terms
of the factors relating to the LTO activities, the accuracy is better than for CCD (because of the origin
of the factors from which the average values are derived). It would be hard to calculate a quantitative
uncertainty estimate. The uncertainty may however lie between 20 and 30 % for LTO factors and 20
and 45 % for the CCD factors.

1.A.3.a, 1.A.5.b Aviation
EMEP/EEA air pollutant emission inventory guidebook 2019 35
4.4.2 Tier 2 approach
The accuracy of the distribution of fuel between domestic and international will depend on the
national conditions. The uncertainties lie mainly in the origin of the emission factors. There is a high
uncertainty associated with the CCD emission factors.
4.4.3 Tier 3 approach
Uncertainties lie in the emission factors for the engines. ICAO (1995) estimated that the uncertainties
of the different LTO factors are approximately 5–10 %. For CCD, the uncertainties are assumed to be
15–40 %.
4.5 Inventory quality assurance/quality control (QA/QC)
There are no specific issues relating to inventory quality assurance/quality control.
4.6 Gridding
Airports and emissions should be associated with the appropriate territorial unit (e.g. country). The
airports can be divided into territorial units in the following way.
The fuel and emissions from specific airports can be identified, and then summed to show the
emissions from the region, which in turn can be summed for a country as a whole. Airports
located in the various territorial areas should be identified.
From the total national emissions estimate, emissions can be distributed to the territorial areas
and airports using a key to reflect the aviation activity (e.g. the number of LTO cycles) between
territorial areas and airports.
4.7 Reporting and documentation
There are no specific issues relating to reporting and documentation.
4.8 Areas for improvements in current methodology
The sub-sections below summarise causes for concern and areas in which further work may be
required.
4.8.1 Landing and take-off (LTO)
A key priority is to update the fuel consumption and emission factors with data from the ICAO Aircraft
Engine Emissions Databank maintained by EASA, in order to better reflect the emissions
performance of the aircraft in use today.
Estimates of fuel used and emissions based on ICAO cycles (ICAO, 2008a) may not reflect accurately
the situation of aircraft and airport operations in Europe.
The relationship between the minor pollutants and the regulated pollutants (HC, CO and NOx) may
need to be investigated in more detail.
4.8.2 Emissions above 3 000 ft (914.4 m)
A key priority is to update the fuel consumption and emission factors in order to better reflect the
emissions performance of aircraft in use today. The proposed EUROCONTROL fuel burn and
emissions calculation tool (AEM) uses EUROCONTROL’s Base of Aircraft Data (BADA) for calculating

1.A.3.a, 1.A.5.b Aviation
EMEP/EEA air pollutant emission inventory guidebook 2019 36
fuel burnt and emissions above 3 000 ft (EUROCONTROL, 2016a and 2016b). This database contains
altitude- and attitude-dependent performance and fuel burn data for more than 200 types of
aircraft.
It should be noted that the emission factors and fuel use for short distances (125 and 250 nm) are
difficult to model and the suggested values are highly uncertain.
4.8.3 Particulate matter emissions, including PM2.5
There is are inconsistencies between PM emission fractions (i.e. total suspended particulate matter
(TSP), PM10 and PM2.5) reported by CLRTAP Parties to the EMEP CEIP, evident by there being variable
ratios of PM2.5 to TSP and PM2.5 to PM10. The most common value reported is 1.00, that is, it is
assumed that all PM emissions from aircraft can be viewed as PM10. This is the relationship assumed
in this guidebook.
5 Glossary and acronyms
AEDT Aviation Environmental Design Tool of FDA
AEED Aircraft Engine Emissions DataBank of ICAO
AEM Advanced Emission Model
ANCAT Abatement of Nuisance Caused by Air Transport, a technical committee of the
European Civil Aviation Conferences (ECAC)
APU auxiliary power unit
ATC Air traffic control
ATM Air traffic management
BADA Base of Aircraft Data of EUROCONTROL
BFFM2 Boeing Fuel Flow Method 2
CAEP Committee on Aviation Environmental Protection of ICAO
CCD Climb/cruise/descent phases of flights, also referred to as ‘Cruise’ or ‘En route’
EASA European Aviation Safety Agency
EECCA Eastern Europe, Caucasus and Central Asia
FAA U.S. Federal Aviation Administration
FEIS Fuel Burn and Emissions Inventory System of EUROCONTROL
FOA3 First Order Approximation version 3
FOCA Swiss Federal Office of Civil Aviation
FOI Swedish Defence Research Agency
ICAO International Civil Aviation Organization
IFR Instrument Flight Rules
LTO Landing/take-off
MDG Modelling and Databases Group of ICAO CAEP
OD Origin and destination
SARP Standards and Recommended Practice
STATFOR Statistics and Forecasts of EUROCONTROL
VFR Visual flight rules
UID Engine Unique Identification Number

1.A.3.a, 1.A.5.b Aviation
EMEP/EEA air pollutant emission inventory guidebook 2019 37
6 References
Agrawal, H., Sawant, A. A, Jansen, K., Miller, J. W. and Cocker III, D. R., 2008, ‘Characterization of
chemical and particulate emissions from aircraft engines’, Atmospheric Environment, (42) 4380–4392
(https://www.sciencedirect.com/science/article/pii/S1352231008000319) accessed 18 September
2016.
ANCAT, 1998, ANCAT/EC2 global aircraft emission inventories for 1991/1992 and 2015, Report by the
ECAC/ANCAT and EC working group, Gardner, R. (ed.).
Baughcum, S., Tritz, T.G., Henderson, S.C. and Pickett, D.C. 1996, Scheduled aircraft emission
inventories for 1992: Database development and analysis, NASA contract report No 4700, NASA
Langley Research Centre, Hampton, VA,
(https://ntrs.nasa.gov/archive/nasa/casi.ntrs.nasa.gov/19960038445.pdf) accessed 18 September
2016.
Baughcum, S. L., Sutkus Jr., D. J. and Hendersonm, S. C., 1998, Year 2015 aircraft emission scenario
for scheduled air traffic, NASA-CR-1998-207638.
(https://ntrs.nasa.gov/archive/nasa/casi.ntrs.nasa.gov/19980055200.pdf) accessed 18 September
2016.
Döpelheuer, A., og M. Lecht (1998): Influence of engine performance on emission characteristics.
RTO AVT Symposium on ‘Gas Turbine Engine Combustion, Emissions and Alternative Fuels’. NATO
Research and Technology Organization. RTO meeting proceedings.
EASA, EEA and EUROCONTROL, 2016, European aviation environmental report 2016
(http://ec.europa.eu/transport/modes/air/aviation-strategy/documents/european-aviation-
environmental-report-2016-72dpi.pdf), accessed 18 September 2016.
EEA, 2016, EMEP/EEA air pollutant emission inventory guidebook, European Environment Agency
(http://www.eea.europa.eu/themes/air/emep-eea-air-pollutant-emission-inventory-guidebook),
accessed 19 July 2019.
EEA, 2016, European Union emission inventory report 1990–2013 under the UNECE Convention on
Long-range Transboundary Air Pollution (LRTAP), European Environment Agency,
(https://www.eea.europa.eu//publications/lrtap-emission-inventory-report) accessed 15 September
2016.
EUROCONTROL, 2016a, ‘Advanced Emission Model (AEM)’
(https://www.eurocontrol.int/model/advanced-emission-model), accessed 3 August 2016.
EUROCONTROL, 2016b, ‘Base of Aircraft Data (BADA)’ (https://www.eurocontrol.int/node/10065)
accessed 3 August 2019.
EUROCONTROL, 2016c, ‘Central Office for Delay Analysis (CODA)’
(https://www.eurocontrol.int/network-performance) accessed 3 August 2019.
EUROCONTROL, 2016d, ‘Statistics and forecasts’ (https://www.eurocontrol.int/forecasting), accessed
3 August 2019.
FOCA, 2007, Aircraft piston engine emissions — Appendix 4: Nanoparticle measurements and
research for cleaner AVGAS, Swiss Federal Office of Civil Aviation
(https://www.bazl.admin.ch/dam/bazl/de/dokumente/Fachleute/Regulationen_und_Grundlagen/ap

1.A.3.a, 1.A.5.b Aviation
EMEP/EEA air pollutant emission inventory guidebook 2019 38
pendix_4_nanoparticlemeasurementsandresearchforcleaneravgas.pdf.download.pdf/appendix_4_n
anoparticlemeasurementsandresearchforcleaneravgas.pdf), accessed 19 July 2019.
FOI, 2016, ‘FOI:s Confidential database for turboprop engine emissions’
(https://www.foi.se/en/foi/research/aeronautics-and-space-issues/environmental-impact-of-
aircraft.html), accessed 19 July 2019.
ICAO, 1995, ICAO Engine Exhaust Emissions Databank, first edition, Doc 9646-AN/943, currently
hosted and maintained as a website version, International Civil Aviation Organization,
(https://www.easa.europa.eu/node/15672) accessed 19 July 2019.
ICAO, 2008a, ‘Annex 16, Volume II: Environmental protection — Aircraft engine emissions’, in:
International standards and recommended practices, third edition.
ICAO, 2008b, FOA3.0 Guidance manual for use by MODTF, CAEP8-WG3-WP08 (FOA3.0 guidance
manual), Working paper of the ICAO Committee on Aviation Environmental Protection Working
Group 3 — Emissions Technical, 4th Meeting, 20–24 May 2008, Montreal, Canada..
ICAO, 2010, ICAO environmental report: Chapter 1: Aviation’s contribution to climate change
(http://www.icao.int/environmental-protection/Documents/EnvironmentReport-
2010/ICAO_EnvReport10-Ch1_en.pdf) accessed 18 September 2016
ICAO, 2011, Airport Air Quality Manual’, Doc 9889, International Civil Aviation Organization
(http://www.icao.int/environmental-
protection/Documents/Publications/FINAL.Doc%209889.1st%20Edition.alltext.en.pdf), accessed 19
July 2019.
ICAO, 2016a, ‘DOC 8643 — Aircraft type designators’, last updated March 2016, International Civil
Aviation Organization(http://www.icao.int/publications/DOC8643/Pages/default.aspx), accessed 19
July 2019.
ICAO, 2016b, ‘New ICAO aircraft CO2 standard one step closer to final adoption’ International Civil
Aviation Organization, (http://www.icao.int/Newsroom/Pages/New-ICAO-Aircraft-CO2-Standard-
One-Step-Closer-To-Final-Adoption.aspx), accessed 19 July 2019.
IPCC, 1997, Revised 1996 IPCC guidelines for national greenhouse gas inventories (https://www.ipcc-
nggip.iges.or.jp/public/gl/invs1.html), accessed 19 July 2019.
IPCC, 1999, IPCC special report: Aviation and the global atmosphere. Summary for policymakers,
IPCC-XV/Doc. 9a (https://www.ipcc.ch/report/aviation-and-the-global-atmosphere-2/), accessed 18
July 2019.
IPCC, 2000, IPCC Good Practice Guidance and Uncertainty Management in National Greenhouse Gas
Inventories (https://www.ipcc-nggip.iges.or.jp/) accessed 23 September 2016
IPCC, 2006, IPCC Guidelines for National Greenhouse Gas Inventories, Intergovernmental Panel on
Climate Change (https://www.ipcc-nggip.iges.or.jp/public/2006gl/) accessed 18 September 2016.
Kinsey, J. S., Dong, Y., Williams, D. C. and Logan, R., 2010, ‘Physical characterization of the fine particle
emissions from commercial aircraft engines during the Aircraft Particle Emissions eXperiment (APEX)
1–3’, Atmospheric Environment, (44) 2147–2156.
Knighton, W. B., Herndon, S.C., and Miake-Lye, R.C. (2009). Aircraft Engine Speciated Organic Gases:
Speciation of Unburned Organic Gases in Aircraft Exhaust, US Environmental Protection Agency,
(https://nepis.epa.gov/Exe/ZyPURL.cgi?Dockey=P1003YXT.TXT), accessed 19 July 2019.

1.A.3.a, 1.A.5.b Aviation
EMEP/EEA air pollutant emission inventory guidebook 2019 39
Kupiainen, K. and Klimont, Z., 2004, Primary emissions of submicron and carbonaceous particles in
Europe and the potential for their control, Interim Report IR-04-079, IIASA, Austria, 115 pp.
MEET, 1997, Kalivoda, M. T. and Kudrna, M., Methodologies for estimating emissions from air traffic,
MEET Deliverable No 18, the European Commission.
Petzold, A., Ström, J., Schröder, F.P. and Kärcher, B., 1999, Carbonaceous aerosol in jet engine
exhaust: emission characteristics and implications for heterogeneous chemical reactions,
Atmospheric Environment (https://www.sciencedirect.com/science/article/pii/S1352231098003148)
accessed 18 September 2016.
Petzold, A., Stein, C., Nyeki, S., Gysel, M., Weingartner, E., Baltensperger, U., Giebl, H., Hitzenberger,
R., Döppelheuer, A., Vrchoticky, S., Puxbaum, H., Johnson, M., Hurley, C. D., Marsh, R. and Wilson, C.
W., 2003, ‘Properties of jet engine combustion particles during the PartEmis experiment:
Microphysics and Chemistry’, Geophysical Research Letters, (30) 1719.
Petzold, A., Marsh, R., Johnson, M., Miller, M., Sevcenco, Y., Delhaye, D., Vancassel, X., Ibrahim, A.,
Veira, A., Williams, P., Bauer, H., Crayford, A., Morris, S., Kay, P., Bowen, P., Bachalo, W. D. and Raper,
D., 2009, Study on sampling and measurement of aircraft particulate emissions SAMPLE — Final
Report, Research project EASA.2008/OP13, EASA, Cologne, Germany, 46 pp.
Olivier, J. G. J., 1991, Inventory of aircraft emissions: A review of recent literature, Report
No 736 301 008, National Institute of Public Health and Environmental Protection, Bilthoven, the
Netherlands.
Rogers, F., Arnott, P., Zielinska, B., Sagebiel, J., Kelly, K. E., Wagner, D. Lighty, J. S. and Sarofim, A. F.,
2005, ‘Real-time measurements of jet aircraft engine exhaust’, Journal of Air and Waste Management
Association, (55) 583–593.
Shah, S.D., Cocker, D.R. Miller, J.W. and Norbeck, J.M., 2004a, Emission rates of particulate matter
and elemental and organic carbon from in-use diesel engines, Environmental Science and
Technology, 38 (9) (2004), pp. 2544–2550.
Shah, S.D., Temitope, A., Ogunyoku, J., Miller, W. and Cocker D.R, 2004b, On-road emission rates of
PAH and n-Alkane compounds from heavy-duty diesel vehicles, Environmental Science and
Technology, 39 (14) (2004), pp. 5276–5284.
Sutkus Jr., D. J., Baughcum, S. L., and DuBois, D. P., 2001, Scheduled civil aircraft emission inventories
for 1999: database development and analysis, NASA-CR-2001-211216
(https://ntrs.nasa.gov/archive/nasa/casi.ntrs.nasa.gov/20020012699.pdf), accessed 18 September
2016.
USEPA, 2009, Recommended best practice for quantifying speciated organic gas emissions from
aircraft equipped with turbofan, turbojet, and turboprop engines, Version 1.0, Assessment and
Standards Division, Office of Transportation and Air Quality, US Environmental Protection Agency,
and AEE-300 — Emissions Division Office of Environment and Energy, Federal Aviation
Administration (https://nepis.epa.gov/Exe/ZyPURL.cgi?Dockey=P1003YX3.TXT), accessed 19 July
2019.
Winther, M., Kousgaard, U. and Oxbøl, A., 2006, ‘Calculation of odour emissions from aircraft engines
at Copenhagen Airport’, Science of the Total Environment, (366) 218–232.

1.A.3.a, 1.A.5.b Aviation
EMEP/EEA air pollutant emission inventory guidebook 2019 40
Winther, M. and Nielsen, O.,-K., 2011, ‘Technology dependent BC and OC emissions for Denmark,
Greenland and the Faroe Islands calculated for the time period 1990–2030’, Atmospheric
Environment, (45) 5880–5895.
Winther, M., Kousgaard, U., Ellermann, T., Ketzel, M., Løfstrøm, P., Massling, A. and Nøjgaard, J. K.,
2012, Emissions from aircraft and handling equipment in Copenhagen Airport, Paper presented at
19th International Transport and Air Pollution Conference 2012, Thessaloniki, Greece.
Wuebbles, D., Gupta, M. and Ko, M., 2007, ‘Evaluating the impacts of aviation on climate change’, EOS
Transactions of the American Geophysical Union, (88) 157–168.
7 Point of enquiry
Enquiries concerning this chapter should be directed to the relevant leader(s) of the Task Force on
Emission Inventories and Projection’s (TFEIP’s) expert panel on Transport. Please refer to the TFEIP
website (www.tfeip-secretariat.org/) for the contact details of the current expert panel leaders.

1.A.3.a, 1.A.5.b Aviation
EMEP/EEA air pollutant emission inventory guidebook 2019 41
Annex 1 Projections
Future aircraft emissions will be determined by the volume of air traffic, air traffic management
(ATM) improvements, new aircraft technologies and the rate at which the aircraft fleet changes.
Following the publication of the European Aviation Environmental Report 2016, published by EASA,
the European Environment Agency (EEA) and EUROCONTROL, a series of projections are included in
this annex. These projections focus on air traffic growth, noise and emissions increases, and the
overall change in the environmental aspects of aviation due to future technological developments,
social changes and climate change. This annex is mainly based on the European aviation
environmental report 2016 (EASA et al., 2016).
The environmental impacts of European aviation have increased as a result of the growth in air
traffic. Between 1990 and 2005, both air traffic and emissions of CO2 have increased by about 80 %.
However, because of technological improvements, fleet renewal, increased ATM efficiency and the
2008 economic downturn, in 2014 both emissions and noise exposure were at approximately 2005
levels. Future improvements are not expected to be sufficient to prevent an overall growth in
emissions over the next 20 years, but noise exposure may stabilise by 2035. Figure A1.1 depicts the
forecasted European air traffic from 2005 to 2035, with different scenarios beyond 2014 depending
on a traffic growth higher or lower than expected. According to the base traffic forecast, after
remaining stable between 2005 and 2014, air traffic is expected to increase by a further 45 %
between 2014 and 2035.
Figure A1.1 European air traffic forecast
Source: EASA et al., 2016
As seen in Figure A1.2, CO2 emissions have followed the same trend as air traffic: from 1990 to 2014,
CO2 emissions increased by 80 %, remaining stable between 2005 and 2014; they are, however, also
expected to increase by a further 45 % between 2014 and 2035. NOx emissions doubled between
1990 and 2014, but technological developments are expected to increase at a lower rate than in
previous years, and a further 43 % increase is expected between 2014 and 2035, considering the air
traffic growth forecast.

1.A.3.a, 1.A.5.b Aviation
EMEP/EEA air pollutant emission inventory guidebook 2019 42
Figure A1.2 Forecast of traffic growth and CO2 and NOx emission increases depending on
traffic growth (
Source: EASA et al., 2016
In 2015, 92 European airports participated in the Airport Carbon Accreditation programme, and 20
of these airports were carbon neutral. Around 80 % of passengers in Europe were handled via an
airport with a certified environmental or quality management system. However, by 2035, in the
absence of continuing efforts, it is anticipated that some 20 major European airports will face
significant congestion and related environmental impacts because of air traffic growth.
Aircraft and their engines must meet international standards for noise and pollutant emissions.
Pollutant emissions from engines have been significantly reduced by technological developments.
This has been promoted by more stringent NOx limits which have been introduced to avoid potential
trade-offs due to the demand for more fuel-efficient engines. The average NOx margin to the ICAO
CAEP/6 limit for in-production engine types has increased by about 15 % over the last five years.
Additional standards for CO2 and PM are currently being developed and are expected to enter into
force in the near future.

1.A.3.a, 1.A.5.b Aviation
EMEP/EEA air pollutant emission inventory guidebook 2019 43
Table A1.1 summarises the different aviation emission species and their change between 2005 and
2014. It also includes the change forecasted up to 2035.
Table A1.1 Summary of emission indicators based on IMPACT data
Parameter
2005 2014 (change
since 2005)
Base forecast for 2035, range
for advanced to low technology
(change since 2005)
Average fuel burn (kg) per
passenger km 0.0388 0.0314 (–19 %) 0.0209–0.0222 (–46 % to –43 %)
CO2 (Mt) 144 151 (+5 %) 207–219 (+44 % to +53 %)
NOx (1 000 t) 650 732 (+13 %) 920–1049 (+42 % to +61 %)
NOx below 3 000 ft (1 000 t) 53.3 58.8 (+10 %) 73.3–83.1 (+37 % to +56 %)
HC (1 000 t) 20.8 17.0 (–18 %) 22.9 (+10 %)
HC below 3 000 ft (1 000 t) 7.8 6.4 (–18 %) 11.0 (+40 %)
CO (1 000 t) 143 133 (–7 %) 206 (+44 %)
CO below 3 000 ft (1 000 t) 52.4 48.2 (–8 %) 85.5 (+63 %)
Volatile PM (1 000 t) 4.18 4.47 (+7 %) 6.93 (+66 %)
Volatile PM below 3 000 ft (1 000
t) 0.27 0.27 (–1 %) 0.41 (+50 %)
Non-volatile PM (1 000 t) 2.67 2.38 (–11 %) 3.16 (+18 %)
Non-volatile PM below 3 000 ft
(1 000 t) 0.15 0.13 (–14 %) 0.17 (+11 %)
Source: EASA et al., 2016.
Slower growth results in a more slowly ageing fleet. Newer aircraft and engines are more
environmentally efficient, so the age of the European aircraft fleet is an important indicator. The
mean aircraft age (weighted by the number of flights made by each aircraft) has crept up from 9.6
to 10.3 years, with only 2009 and 2010 seeing reductions (Figure A1.2). These reductions were driven
by the rapid expansion of the low-cost fleet, which is younger than average, and retirements of less
fuel efficient older aircraft by the traditional scheduled operators in response to higher fuel prices
and falling demand (retirements jumped to over 6 % of the fleet per year in 2008 and 2009). In more
recent years, the fleet began to age again as a result of slower low-cost carrier growth, and very
limited fleet renewal by the traditional scheduled carriers. In 2014, about half of all flights were by
aircraft built in 2005 or later. This figure increases to three-quarters if only low-cost carriers are
considered. The mean age of the non-scheduled charter fleet has increased most rapidly, reflecting
the decline of this segment and the switch to scheduled operations. The rapid expansion of business
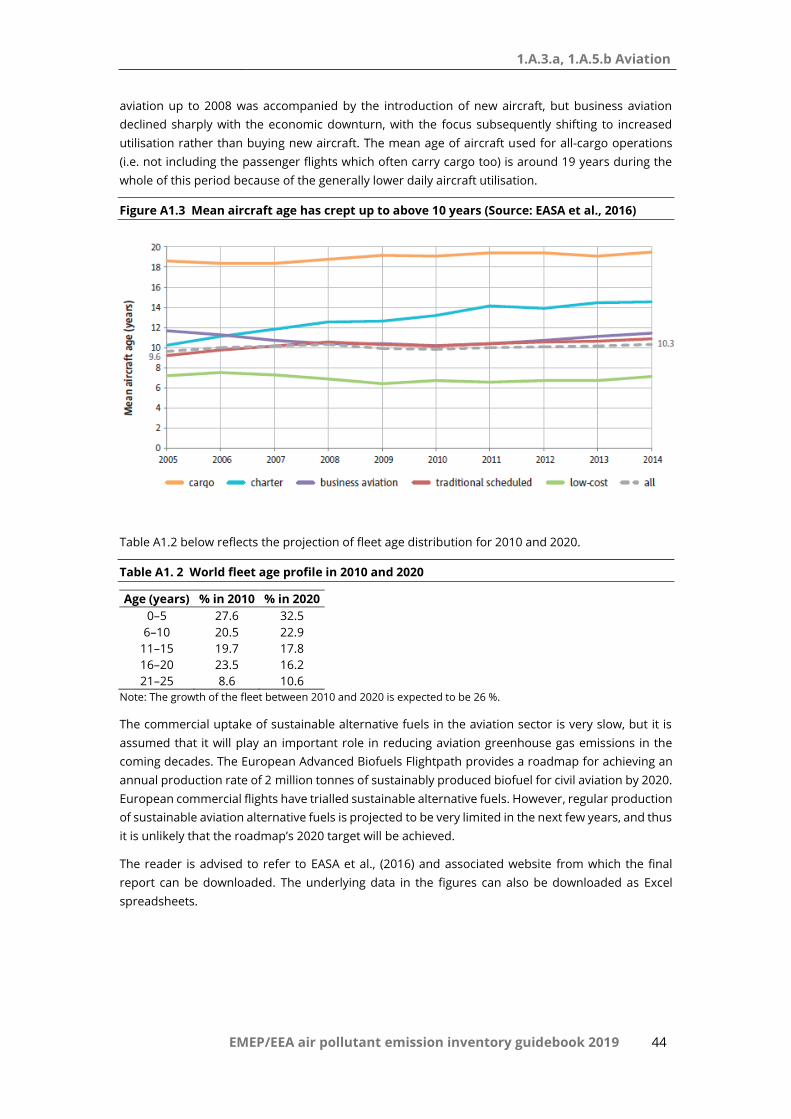
1.A.3.a, 1.A.5.b Aviation
EMEP/EEA air pollutant emission inventory guidebook 2019 44
aviation up to 2008 was accompanied by the introduction of new aircraft, but business aviation
declined sharply with the economic downturn, with the focus subsequently shifting to increased
utilisation rather than buying new aircraft. The mean age of aircraft used for all-cargo operations
(i.e. not including the passenger flights which often carry cargo too) is around 19 years during the
whole of this period because of the generally lower daily aircraft utilisation.
Figure A1.3 Mean aircraft age has crept up to above 10 years (Source: EASA et al., 2016)
Table A1.2 below reflects the projection of fleet age distribution for 2010 and 2020.
Table A1. 2 World fleet age profile in 2010 and 2020
Age (years) % in 2010 % in 2020
0–5 27.6 32.5
6–10 20.5 22.9
11–15 19.7 17.8
16–20 23.5 16.2
21–25 8.6 10.6
Note: The growth of the fleet between 2010 and 2020 is expected to be 26 %.
The commercial uptake of sustainable alternative fuels in the aviation sector is very slow, but it is
assumed that it will play an important role in reducing aviation greenhouse gas emissions in the
coming decades. The European Advanced Biofuels Flightpath provides a roadmap for achieving an
annual production rate of 2 million tonnes of sustainably produced biofuel for civil aviation by 2020.
European commercial flights have trialled sustainable alternative fuels. However, regular production
of sustainable aviation alternative fuels is projected to be very limited in the next few years, and thus
it is unlikely that the roadmap’s 2020 target will be achieved.
The reader is advised to refer to EASA et al., (2016) and associated website from which the final
report can be downloaded. The underlying data in the figures can also be downloaded as Excel
spreadsheets.

1.A.3.a, 1.A.5.b Aviation
EMEP/EEA air pollutant emission inventory guidebook 2019 45
Annex 2 Additional comments on
emission factors
ICAO (1995) (exhaust emissions databank) provides basic aircraft engine emissions data for
certificated turbojet and turbofan engines covering the rate of fuel used and the emission factors
for HC, CO and NOx at the different thrust settings used. Other relevant emissions data are derived
from other sources. The exhaust emissions databank is now accessible via the internet (ICAO, 1995).
In addition to HC, CO and NOx, this version also contains emission factors for smoke at the different
thrust settings (columns BL to BO of the databank). PM emission factors can be derived from those
for smoke, and the methodology used for this conversion (the so-called First Order Approximation
version 3 (FOA3)) is published in ICAO, 2007.
The heavy metal emissions are, in principle, determined from the metal content of kerosene or
gasoline. Thus, general emission factors for the stationary combustion of kerosene and the
combustion of gasoline in cars may be applied. The only exception is lead. Lead is added to aviation
gasoline to increase the octane number. The lead content is higher than in leaded car gasoline, and
the maximum permitted levels in the UK are shown below. A value of 0.6 g of lead per litre of gasoline
should be used as the default value if there is an absence of more accurate information. Actual data
may be obtained from oil companies.
Table A2.1 Lead content of aviation gasoline in the UK
AVGAS designation Maximum lead content (as tetra ethyl lead)
AVGAS 80 0.14 g/l
AVGAS low lead 100 0.56 g/l
AVGAS 100 0.85 g/l
There is little information on PM from aircraft. In Petzold et al. (1999) and Döpelheuer et al. (1998),
data are published for various aircraft types. Petzold (1999) also describes the particle size. For newer
aircraft, the size distribution is dominated by particles with a diameter between 0.025 and 0.15 m.
For newer aircraft (certified after 1976), such as A300, B737 and DC10, the emission factor is about
0.01 g/kg fuel. Döpelheuer and Lecht (1998) also provide data for different phases of the flight for
A300. The factor is higher at take-off (0.05 g/kg) and lower at cruise (0.0067 g/kg), while the factor for
climb and descent is about 0.01 g/kg. From combustion science principles, it is anticipated that the
PM2.5 to PM10 ratio for aircraft engines will be similar to, or higher than, that for internal combustion
engines. Given that the ratio for internal combustion engines is estimated to be 94 %, it is reasonable
to assume that for aircraft their PM emissions can be considered as PM2.5. The PM2.5 to PM10 ratio
most commonly used when reporting values within EMEP is 1.0. This is the relationship assumed in
this Guidebook.
Little information is currently available about possible exhaust emissions of persistent organic
pollutants (POPs) from aircraft engines. Emissions of H2O may be derived from the fuel consumption
at the rate of 1.237 kg H2O/kg fuel. Using the emission factors, special emphasis should be put on
the assumptions of the weight per cent of sulphur (assumed to be 0.05 %). If the percentage of
sulphur in the fuel used is different, this should be taken into account. If the sulphur per cent used
is, for example, 0.01 % instead of 0.05 %, the emission factor should be divided by five to show the
true factor.

1.A.3.a, 1.A.5.b Aviation
EMEP/EEA air pollutant emission inventory guidebook 2019 46
Annex 3 Black carbon (BC) fractions
of particulate matter emissions from
aviation
In order to maintain consistency throughout the guidebook, it should be noted that the literature
emission factor values used here directly represent elemental carbon (EC), and that these values are
assumed to be equal to BC.
Table A3.1 presents an overview of the five studies that have been regarded as relevant sources for
BC fractions of PM emissions (f-BC) from aviation. Apart from f-BC, for each study the engine type
and emission test modes are listed, as well as the PM emission sampling conditions, as far as
information is available. Some of the following references also report figures for organic carbon (OC)
which can be input for the further assessment of OC fractions of PM (f-OC).
Petzold et al. (2009) carried out test rig measurements of the emissions from four engine operational
conditions in the Sample (study on sampling and measurement of aircraft particulate emissions)
Project. The measurements of PM were adjusted to include the particulate emissions in the form of
water-bound sulphate. BC and EC values were also measured. Petzold et al. (2009) found that BC
equals EC. No trend in emissions could be observed for variations in engine test modes.
Petzold et al. (2003) simulated, in a test rig for cruise power settings, the emissions influence from
fuel with low, medium and high sulphur content used by old and new engine technologies. BC and
TC (total carbon) emissions are measured. Subsequently, the TC emissions are adjusted by 30 % in
an upwards direction (compared with Petzold et al. (2009)) in order to calculate the total mass of PM
and determine the f-BC fraction. No trend in emissions could be observed for variations in engine
test modes.
Rogers et al. (2005) carried out ground-based plume measurements of the emissions from a jet
engine military fighter and a turboshaft engine being used by military helicopters. Rogers et al. (2005)
measured EC, OC and total PM mass emissions, and referred to the measured EC factor as the ‘black
factor’. Based on one test run, they derived BC factors which could be related to the PM mass
emission factors.
Kinsey et al. (2010) reported ground-based plume emissions measurements for nine commercial
aircraft engines in three field campaigns of the Aircraft Particles Emissions eXperiment (APEX) 1–3
study. In the supplementary material provided by Kinsey et al. (2010), EC emissions were interpreted
as BC and, furthermore, it was noted that volatile PM emissions consist of sulphur and organic PM.
In Kinsey et al. (2010), for five aircraft engines, the total PM mass emissions were split into volatile
(PMvol) and non-volatile (PMnon-vol) fractions. For the present note, the non-volatile share of total PM
is assumed to be equivalent to the f-BC fraction.
Agrawal et al. (2008) measured the emissions of, for example, PM, EC and OC from four commercial
aircraft. No trends in emissions could be observed for variations in engine test modes. For the
present discussion, EC values were used for BC, in accordance with the assumptions made by, for
example, Rogers et al. (2005) and Kinsey et al. (2010).
Winther et al. (2012) calculated the emissions of PM for aircraft engines in Copenhagen Airport,
based on actual flight operational data and aircraft–engine combinations. The FOA3 method (ICAO,

1.A.3.a, 1.A.5.b Aviation
EMEP/EEA air pollutant emission inventory guidebook 2019 47
2008b) was used to estimate the PM emissions, split into volatile PM coming from the sulphur in the
fuel and exhaust VOC, and non-volatile PM from soot. Subsequently, a fuel-weighted f-BC fraction
(non-volatile share of total PM) was derived taking into account the landing, take off and taxi engine
power modes. The f-BC fraction for Copenhagen Airport was similar to the f-BC fraction calculated
for LTO for Schiphol Airport in Amsterdam also using the FOA3 method (Andreas Petzold, DLR, 2012,
personal communication).
The f-BC and f-OC (if available) fractions derived from the abovementioned studies are listed in Table
A3.1.
Table A3.1 BC and OC fractions (%) of PM emissions from relevant studies
Study Aircraft/Engine types Test conditions f-BC
f-
OC (a)
Petzold et al. (2003) Old engine Cruise, low sulphur 61
Cruise, medium sulphur 44
Cruise, high sulphur 50
New engine Cruise, low sulphur 75
Cruise, medium sulphur 31
Cruise, high sulphur 40
Agrawal et al. (2008) CFM56-7B22 Mode 1 (4 and 7 %) 31 91.2
Mode 2 (30 and 40 %) 8 14
Mode 3 (65 %) 59 16
Mode 4 (85 %) 59 24
CFM56-3B1 Mode 1 (4 and 7 %) 48 67
Mode 2 (30 and 40 %) 60 60
Mode 3 (65 %) 26 44
Mode 4 (85 %) 85 12
CFM56-3B2 Mode 1 (4 and 7 %) 55 79
Mode 2 (30 and 40 %) 69 33
Mode 3 (65 %) 74 19
Mode 4 (85 %) 79 19
CFM56-7B22 Mode 1 (4 and 7 %) 47 189
Mode 2 (30 and 40 %) 72 127
Mode 3 (65 %) 86 15
Mode 4 (85 %) 68 35
Rogers et al. (2005) Military F404-GE-400, T700-GE-401 65 %–80 %, 67 %–98 % 56 19
Kinsey et al. (2010) CFM56-2C1 Various power modes 38 62
CFM56-3B1 Various power modes 21 79
AE3007A1E Various power modes 38 62
P&W4158 Various power modes 46 54
RB211-535E4B Various power modes 59 41
Petzold et al. (2009) Test rig Condition1 66
Condition2 33
Condition3 54
Condition4 36
Winther et al. (2012) Copenhagen Airport fleet/engine Landing 33

1.A.3.a, 1.A.5.b Aviation
EMEP/EEA air pollutant emission inventory guidebook 2019 48
Take off 54
Taxi 30
Petzold et al. (2003) Average 50
Agrawal et al. (2008) Average 58
Rogers et al. (2005) Average 56
Kinsey et al. (2010) Average 40
Petzold et al. (2009) Average 47
Winther et al. (2012) Average 39
Average (all) Average 48
(a) If f-OC values are > 100, the literature indicates that this could be because the sampling methods
produce a positive artefact. In this case, the OC positive artefact was assumed to offset the hydrogen and oxygen
content of the organic mass, based on previous research (Shah et al., 2004a and 2004b; Agrawal et al., 2008).
Conclusion
The data available are regarded as being too scarce to propose different f-BC fractions for different
tiers and explicitly for LTO and CCD in the guidebook’s chapter on aviation. Hence, the same average
f-BC fraction (f-BC = 0.48) will be proposed for the simple LTO and CCD methodology in Tier 1, the
aircraft type-specific Tier 2 methodology, the Tier 3 methodology based on aircraft type city-pairs
and for military aircraft. For piston-engined aircraft, data from Winther and Nielsen (2011) will be
used (f-BC = 0.15) based on information from Kupiainen and Klimont (2004).
Table A3.2 lists the tables in the guidebook chapter on aviation which contain f-BC fraction
information. These fractions must then be combined with the existing PM factors in GB in order to
establish the final BC emission factor in each case.
Table A3.2 Tables in this chapter of the guidebook which contain f-BC fraction data
Table No Tier Detail f-BC source
3.3 1
Old/average fleet; LTO and CCD emission
factor. Present note; f-BC = 0.48
3.5 2 LTO emf. per aircraft type Present note; f-BC = 0.48
3.4 1 Piston-engined aircraft Winther et al. (2011); f-BC = 0.48
3.15 2 Military Present note; f-BC = 0.48
Acknowledgements
Andreas Petzold, DLR, is thanked for technical discussions.

1.A.3.a, 1.A.5.b Aviation
EMEP/EEA air pollutant emission inventory guidebook 2019 49
Annex 4 EUROCONTROL fuel burn
and emissions inventory system
EUROCONTROL has developed a Fuel Burn and Emissions Inventory System (FEIS) that produces
estimates of the total masses of jet fuel (for aircraft powered by turbojet, turbofan or turboprop
engines) and aviation gasoline (for aircraft powered by piston engines) burnt by all the aircraft that,
during the year before, made relevant flights that departed from, or arrived at, or both, an airport
(or aerodrome) that is located in a relevant part of the territory of one of the 28 EU Member States.
The total masses of certain gaseous species and types of PM that were emitted because of the
burning of this jet fuel and aviation gasoline are also estimated. This work is done in support of the
EEA member countries, including those Member states of the EU.
The purpose of this annex is to provide a high-level description of both the procedure by which these
estimates are produced and the tools that are used to do the calculations.
The system developed by EUROCONTROL concerns only the aircraft movement information that is
available within the EUROCONTROL zone of coverage; it also concerns only IFR flights (no VFR flights),
and all flights operated as military or special operations are excluded. For aircraft movements for
which the trajectory is partly or completely outside of the EUROCONTROL zone of coverage,
trajectories are completed or generated for aircraft movements identified in commercial aircraft
schedule databases.
Currently, FEIS relies mainly on the capability of the EUROCONTROL AEM to process a large amount
of data in a reasonable time.
In the context of FEIS, the AEM is used as outlined below.
The AEM processes flight movements to estimate the amount of fuel burnt, and then
estimates the emissions that result from the combustion of this fuel in the engines. A flight
movement is the movement on the ground and in the air of an aircraft (an airframe plus its
engine(s)) following a 4D path (or profile).
Above 3 000 ft, this profile is described in terms of a sequence of straight-line segments that
are retrieved from the updated flight plan data managed by the EUROCONTROL Network
Manager Operations Centre or partly or completely generated for flight movements outside
of the EUROCONTROL zone of coverage. The fuel burn is calculated for each segment of a
flight profile thanks to the aircraft performance information provided by EUROCONTROL’s
BADA (EUROCONTROL, 2016b). This database provides altitude- and attitude-dependent
performance and fuel burn data for more than 200 aircraft types. Once the amount of fuel
burnt is calculated for each segment, the Boeing Fuel Flow Method 2 (BFFM2) is used to
correct the amount of fuel that is burnt before multiplying by the EFs.
Below 3 000 ft, because information about flight profiles is not sufficiently accurate, the AEM
calculates the amount of fuel burnt according to the ICAO LTO cycle methodology, which
was defined by the ICAO Engine Certification specifications, and models flight movements
(below 3 000 ft) as a series of defined thrust levels for defined lengths of time associated
with each LTO cycle flight phase. The fuel burn is calculated thanks to the ICAO Aircraft
Engine Emissions DataBank (AEED), which provides EIs and fuel flow for a very large number
of aircraft engines. As EUROCONTROL has developed a table that lists a large range of

1.A.3.a, 1.A.5.b Aviation
EMEP/EEA air pollutant emission inventory guidebook 2019 50
aircraft models and the engines with which they are generally equipped, the AEM can link
each flight movement processed by the AEM to a specific engine as identified by its Unique
Identification Number (UID), as listed in the ICAO Engine Exhaust Emissions Databank. A
‘standard’ LTO cycle lasts for a total of 32 minutes and 54 seconds, of which the engines are
in idle mode for 26 minutes while taxiing out before taking off and taxiing in after landing
(19 minutes and 7 minutes, respectively). But for many airports in Europe, the time spent
with the engine thrust set to idle is different from the 26 minutes of the ICAO LTO cycle.
Therefore, to improve the accuracy of the system, EUROCONTROL replaces default ICAO
taxi-in and taxi-out times with actual average annual airport taxi-in and taxi-out times, as
calculated by EUROCONTROL’s CODA (EUROCONTROL, 2016c). Once the amount of fuel
burnt in a phase of the LTO cycle is known, the associated emissions can be calculated.
Table A4.2 AEM fuel burnt and corresponding emissions calculation method
Height (feet) Fuel burnt NOx, UHCs and
CO
CO2, H2O and
SOx
VOCs
> 3 000
CCD
BADA BFFM2 Proportional to
the mass of fuel
burnt
Proportional to
the mass of UHCs
generated ≤ 3 000 AEED and other databases
As such, the FEIS developed by EUROCONTROL implements a methodology that lies somewhere
between a Tier 3A and a Tier 3B methodology.
From the fuel burn and emissions calculated from each flight movement in the system,
EUROCONTROL generates reports to assist reported by Parties to the two following conventions:
the UNFCCC;
the LRTAP Convention of the United Nations Economic Commission for Europe.
FEIS is updated on an annual basis with the previous year’s flight movement data and fuel and
emissions estimations; the historical year data, starting from 2005, are maintained and, in the case
of significant methodology changes that would result in a change of more than 5 % from the previous
year’s estimated emissions, recalculated.
A more detailed description of the EUROCONTROL FEIS is available upon request from the EEA.

1.A.3.a, 1.A.5.b Aviation
EMEP/EEA air pollutant emission inventory guidebook 2019 51
Annex 5 Emission calculator accompanying files
The accompanying emission calculator files are available as an electronic annex alongside the main
Guidebook files at http://www.eea.europa.eu/publications/emep-eea-guidebook-2016.
Users will find two files:
- Master emission calculator;
- LTO emission calculator.