Embed Size (px)
Citation preview

Cambodia Development Resource Institute
Chhim Chhun, Tong Kimsun, Ge Yu, Timothy Ensor and Barbara McPake
Working Paper Series No. 103
June 2015
A CDRI Publication
Catastrophic Payments and Poverty in Cambodia: Evidence from
Cambodia Socio-Economic Surveys 2004, 2007, 2009, 2010 and 2011


Catastrophic Payments and Poverty in Cambodia: Evidence from
Cambodia Socio-Economic Surveys 2004, 2007, 2009, 2010 and 2011
Chhim Chhun, Tong Kimsun, Ge Yu, Timothy Ensor and Barbara McPake
CDRI Working Paper Series No. 103
Phnom Penh, June 2015
ii
© 2015 CDRI - Cambodia Development Resource Institute
All rights reserved. No part of this publication may be reproduced, stored in a retrieval system or transmitted in any form or by any means—electronic, mechanical, photocopying, recording, or otherwise—without the written permission of CDRI.
ISBN 978-9924-5000-0-1
Mr Chhim Chhun Research Associate, Cambodia Development Resource Institute ([email protected])
Dr Tong Kimsun Senior research fellow, Cambodia Development Resource Institute ([email protected])
Dr Ge Yu Research Fellow, University of Leeds.
Prof. Tim Ensor Director of the Leeds Institute of Health Sciences, University of Leeds.
Prof. Barbara McPake Director of ReBuild Consortium and Director of Nossal Institute for Global Health, the University of Melbourne
Citation:
Chhim Chhun, Tong Kimsun, Ge Yu, Timothy Ensor and Barbara McPake. 2015. Catastrophic Payments and Poverty in Cambodia: Evidence from Cambodia Socio-Economic Surveys 2004, 2007, 2009, 2010 and 2011. CDRI Working Paper Series No. 103. Phnom Penh: CDRI.
CDRIF 56, Street 315, Tuol Kork, Phnom Penh, Cambodia * PO Box 622, Phnom Penh, Cambodia' (855-23) 881384/881701/881916/8836036 (855-23) 880734 E-mail: [email protected] Website: www.cdri.org.kh
Edited by: Allen MyersLayout and Cover Design: Meas Raksmey and Oum Chantha Printed and Bound in Cambodia by Donbosco printing

iii
Contents
Acronyms ..................................................................................................................................iv
Acknowledgements ....................................................................................................................v
Abstract .....................................................................................................................................vi
1. Introduction ............................................................................................................................1
2. Literature review ....................................................................................................................1
3. Data and methodology ...........................................................................................................3
3.1 Sample selection ..............................................................................................................3
3.2 Methodology ....................................................................................................................4
3.2.1 Catastrophic payments ............................................................................................4
3.2.2 Key determinants of catastrophic payments ...........................................................5
3.2.3 Out-of-pocket health expenditure and poverty .......................................................5
3.2.4 Poverty line .............................................................................................................6
4. Empirical findings ..................................................................................................................7
5. Conclusion and policy implications .....................................................................................11
References ................................................................................................................................12
Appendix 1: Descriptive statistics of dependent and independent variables
for probit model (mean) .....................................................................................14
Appendix 2: Incidence and intensity of catastrophic health payments ....................................15
Appendix 3: Distribution-sensitive catastrophic payments measures .....................................16
Appendix 4: Effects of out-of-pocket health spending on poverty ..........................................17
CDRI working paper series ......................................................................................................18
iv
List of Tables
Table 1: Number of households interviewed, 2004-11 ..............................................................3
Table 2: Proportion of households with health expenditure (percent) .......................................3
Table 3: Overall poverty line (riels per person per day) ............................................................6
Table 4: Consumer price index (Phnom Penh prices=100) .......................................................6
Table 5: Incidence and intensity of catastrophic health payments (percent) ............................7
Table 6: Distribution-sensitive catastrophic payment measures ................................................8
Table 7: Key determinants of catastrophic payments (probit model) ........................................9
Table 8: Effects of out-of-pocket health spending on poverty .................................................10
Acronyms
CSES Cambodia Socio-Economic Survey
ReBUILD Research for Building Pro-poor Health Systems during Recovery from Conflict

v
Acknowledgements
This paper is part of the first component of Research for Building Pro-poor Health Systems during Recovery from Conflict (ReBUILD). The research project is led by the Liverpool School of Tropical Medicine, Liverpool, UK, in partnership with the Institute for International Health and Development, Queen Margaret University, Edinburgh, UK; Makerere University, Kampala, Uganda; College of Medicine and Allied Health Sciences, Freetown, Sierra Leone; Biomedical Research and Training Institute, Harare, Zimbabwe; and Cambodia Development Resource Institute, Phnom Penh, Cambodia. The authors would like to thank Mr Net Neath, Ms Sok Sethea and Ms Huon Chanthrea for their involvement in the first two years of this four-year research project, particularly research design, literature review, secondary data collection, initial national representative household survey data preparation and methodology selection. The authors thank Dr Edoka Ijeoma and Dr Tseng Fu-Min for their technical support. They are also grateful to Dr Chhem Rethy, CDRI executive director, Mr Larry Strange, former CDRI executive director, Dr Srinivasa Madhur, former CDRI director of research, and Mr Ung Sirn Lee, CDRI director of operations, for their support and encouragement. The financial support from the UK Department for International Development (DFID) is greatly appreciated.
vi
Abstract
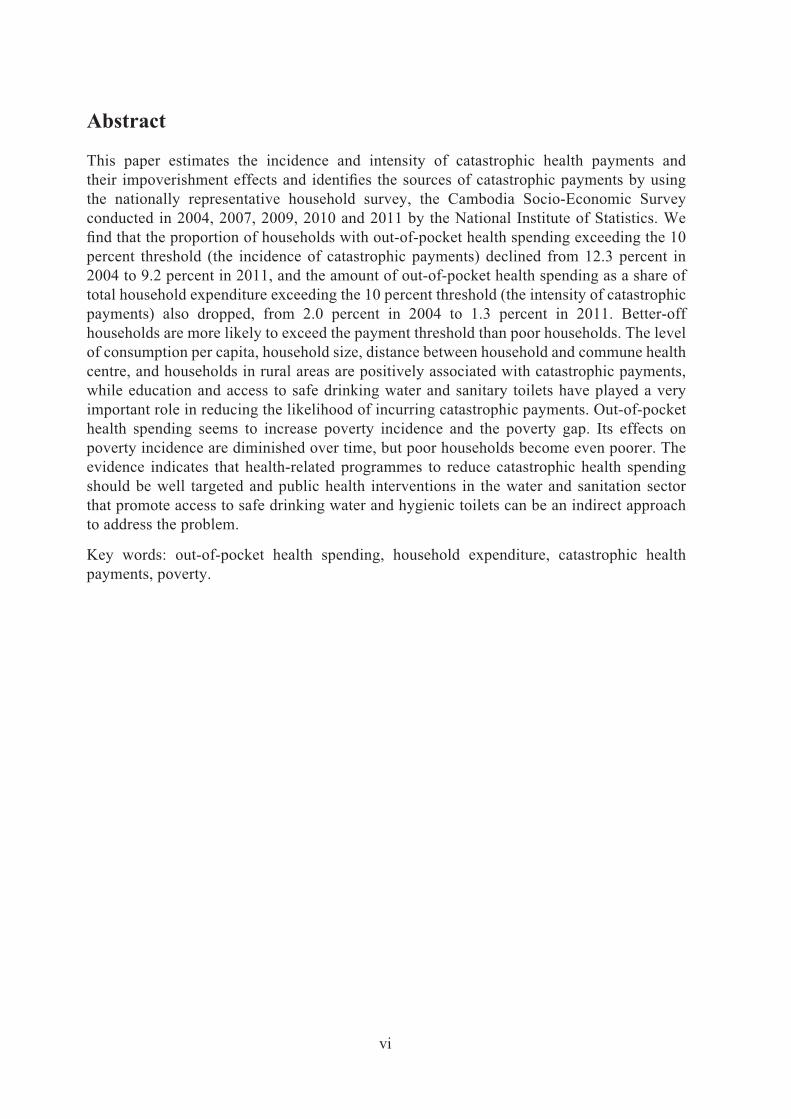
This paper estimates the incidence and intensity of catastrophic health payments and their impoverishment effects and identifies the sources of catastrophic payments by using the nationally representative household survey, the Cambodia Socio-Economic Survey conducted in 2004, 2007, 2009, 2010 and 2011 by the National Institute of Statistics. We find that the proportion of households with out-of-pocket health spending exceeding the 10 percent threshold (the incidence of catastrophic payments) declined from 12.3 percent in 2004 to 9.2 percent in 2011, and the amount of out-of-pocket health spending as a share of total household expenditure exceeding the 10 percent threshold (the intensity of catastrophic payments) also dropped, from 2.0 percent in 2004 to 1.3 percent in 2011. Better-off households are more likely to exceed the payment threshold than poor households. The level of consumption per capita, household size, distance between household and commune health centre, and households in rural areas are positively associated with catastrophic payments, while education and access to safe drinking water and sanitary toilets have played a very important role in reducing the likelihood of incurring catastrophic payments. Out-of-pocket health spending seems to increase poverty incidence and the poverty gap. Its effects on poverty incidence are diminished over time, but poor households become even poorer. The evidence indicates that health-related programmes to reduce catastrophic health spending should be well targeted and public health interventions in the water and sanitation sector that promote access to safe drinking water and hygienic toilets can be an indirect approach to address the problem.
Key words: out-of-pocket health spending, household expenditure, catastrophic health payments, poverty.

1
CDRI Working Paper Series No. 103
1. Introduction
Out-of-pocket spending is the most important source of health financing in most developing countries, including Cambodia. Payments pose considerable challenges for household finances, many households using scarce savings, borrowing from friends, relatives and moneylenders or selling assets. Catastrophic health expenditure can have long-lasting effects on household welfare as indebted households sell productive assets. Ultimately, households may need to reduce essential current consumption.
Given the disadvantages of out-of-pocket health spending, the World Health Organization (2010) encourages pre-payment mechanisms to pool the cost of health care. Programmes including health equity funds, commune-based health insurance and maternal health vouchers have been introduced in Cambodia since 2000. To implement these programmes effectively and efficiently, it is important to know on whom the burden of health payments falls. Catastrophic payments are defined as the share of expenditure on health services in total household expenditure or non-food expenditure (household capacity to pay) in excess of a certain threshold. Evidence on the size of these payments will inform policymakers of which groups are most in need of protection. For example, if the incidence is likely to occur among rural households, there is a need for risk pooling of health financing in rural areas.
In Cambodia there are very few studies of catastrophic payments and their impact on household welfare. These studies mostly rely on small-scale surveys and examine the relationship between catastrophic payments and indebtedness (Kassie 2000; Van Dammer et al. 2004), poverty (Kassie 2000; Wilkinson, Holloway and Fallavier 2001; Van Dammer et al. 2004) and landlessness (Wilkinson, Holloway and Fallavier 2001). In 2014, two papers assessed out-of-pocket and catastrophic expenditure on health in Cambodia (Hanvoravongchai and Fernandes 2014; Hanvoravongchai et al. 2014) using descriptive statistics. They concluded that catastrophic payments are the major cause of indebtedness, poverty and landlessness; however, neither measured the incidence and intensity of catastrophic payments nor identified their causes. This paper aims to measure the incidence and intensity of catastrophic payments and their impoverishment effects, and to identify the key determinants of catastrophic payments in Cambodia by using the nationally representative multipurpose household survey—the Cambodia Socio-Economic Survey—conducted in 2004, 2007, 2009, 2010 and 2011.
Section 2 of the paper reviews previous studies related to catastrophic payments and their impact. Section 3 describes the data used for the analysis and discusses methodologies to define catastrophic payments, assess the impoverishment effects and identify the key underlying factors of catastrophic payments incidence. Section 4 presents the empirical findings. Section 5 concludes.
2. Literature review
Studies on catastrophic health payments and their national impoverishment effects are almost non-existent in Cambodia. Extensive studies have been undertaken elsewhere, including Vietnam (Wagstaff and van Doorslaer 2003), India (Flores et al. 2008; Ghosh 2010), Uganda (Kagarura, Bruno and Ddumba-Ssentamu 2014), Bangladesh, China, Hong Kong, India, Indonesia, Korea Republic, Kyrgyz Republic, Malaysia, Nepal, Philippines, Sri Lanka, Thailand and Vietnam (van Doorslaer et al. 2007; O’Donnell et al. 2005).

2
Catastrophic Payments and Poverty in Cambodia
Wagstaff and van Doorslaer (2003) used the Vietnam Living Standards Surveys in 1993-94 and 1997-98 to measure the incidence and intensity of catastrophic health payments and their impact on poverty in Vietnam. They found that the incidence and intensity were reduced during the study period, and the poor were less likely to suffer from catastrophic health payments in terms of both incidence and intensity. The poverty impact of catastrophic health payments had declined over time. The impact on poverty was largely due to the poor becoming poorer rather than the non-poor becoming poor.
Ghosh (2010) used the 1993-94 and 2004-05 National Sample Survey to measure catastrophic payments and impoverishment due to out-of-pocket health spending in India. Adopting the methodology proposed by Wagstaff and van Doorslaer (2003), Ghosh (2010) defined catastrophic payments as out-of-pocket health payments in excess of 10 percent of total household spending. The results showed that out-of-pocket health expenditure increased over the study period, and the relationship between the share of out-of-pocket health spending in total expenditure and per capita state domestic product was positive. The incidence of catastrophic health payments increased 2.3 percentage points during the study period but was likely to be concentrated more among the better-off households, and approximately 4.4 percent of the total population fell below the poverty line due to out-of-pocket health expenditure. These findings highlight that broad-based risk pooling and prepayment are likely to be a better health financing strategy for Indian households because they limit out-of-pocket health spending, reduce the likelihood of impoverishment and improve the utilisation of health care services by the poor, especially the poorest.
Kagarura, Bruno and Ddumba-Ssentamu (2014) used the 2005-06 Uganda National Household Survey data to examine the effect of catastrophic payments on household poverty. Having defined catastrophic payments as out-of-pocket health spending that exceeded 10 percent of total household income/expenditure, the study found that the incidence of catastrophic payments amounted to 19 percent and tended to occur among all socio-economic groups, but more in rural areas and among the non-poor. Out-of-pocket health spending was likely to increase poverty by 5.8 percent. The authors argued that the government might need to provide free health care for all or to establish prepaid schemes at all levels to protect against catastrophic expenditure should it be unable to expedite the National Social Health Insurance Scheme.
Van Doorslaer et al. (2007) conducted a comprehensive study on catastrophic payments and their impoverishment effects in 14 Asian countries—Bangladesh, China, Hong Kong, India, Indonesia, Republic of Korea, Kyrgyz Republic, Malaysia, Nepal, Philippines, Sri Lanka, Thailand and Vietnam—that together account for 81 percent of the Asian population. They revealed that rich households in the majority of low and middle-income countries are more likely to spend a large proportion of total household income on health care, catastrophic payments tend to concentrate in better-off households in most low-income countries, and out-of-pocket health spending is still the primary cause of poverty.
Unlike other studies that simply measured catastrophic payments and their impoverishment effects, O’Donnell et al. (2005) attempted to identify the key determinants of the incidence of catastrophic payments in Bangladesh, Hong Kong, India, Sri Lanka, Thailand and Vietnam by using probit regression. In general, they found that households with more members or higher per capita consumption were more likely to incur catastrophic payments, and the incidence was higher in rural areas and among households without sanitary toilets and safe drinking water. This evidence suggested a need to develop risk pooling of health financing in rural areas, and that public sanitation interventions can be effective in addressing the high incidence of catastrophic payments.

3
CDRI Working Paper Series No. 103
3. Data and methodology
3.1 Sample selectionWith financial and technical support from various international partners including the Asian Development Bank, United Nations Development Programme, World Bank, United Nations Children’s Fund, International Labour Organization and Swedish International Development Cooperation Agency, the National Institute of Statistics conducted 10 rounds of a nationally representative household survey—the Cambodia Socio-Economic Survey (CSES)—between 1993 and 2011. Not all the rounds are comparable due to questionnaire design, sampling design and survey timing.1 Comparisons between surveys conducted before and after 2004 are particularly problematic and not recommended. It is important to note that the 2004 survey started in November 2003 and lasted until February 2005, with a total sample of 867 villages and 15,000 households, while the remaining surveys were conducted within a calendar year. To be consistent with other surveys, observations collected in 2003 and 2005 were dropped from the study. The 2004 and 2009 surveys sampled around 700 villages while in 2007, 2008, 2010 and 2011, only half the number of villages and about one-third of the households were sampled (Table 1).
Table 1: Number of households interviewed, 2004-11
2004 2007 2008 2009 2010 2011
Phnom Penh 1116 737 729 1113 744 747
Other urban 1710 628 626 1332 640 638
Other rural 8999 2188 2154 9526 2208 2207
Total 11825 3553 3509 11971 3592 3592Source: CSES 2004, 2007-2011
In CSES 2007, 2009, 2010 and 2011, monthly health expenditures for all household members were recorded in the non-food expenditure section and for each member for the last four weeks in the health section. For CSES 2004, health expenditure was recorded only in the health section, while for CSES 2008 health expenditure was recorded only in the non-food section. Having examined the survey data closely, we note that the proportion of households with health expenditure generated from the non-food expenditure section is higher than that from the health section (Table 2). This implies that the interviewed households tended to respond to survey questions on health expenditure in the non-food and health sections differently. To be consistent, this study is based on data from the 2004, 2007, 2009, 2010 and 2011 surveys using information in the health section.
Table 2: Proportion of households with health expenditure (percent)
2004 2007 2008 2009 2010 2011
Non-food section 67 72 78 74 72
Health section 47 42 45 51 45Source: Authors’ calculation
1 See Chhim et al. (forthcoming) for a detailed explanation of the incomparability of CSES.

4
Catastrophic Payments and Poverty in Cambodia
3.2 Methodology
3.2.1 Catastrophic payments
Households are defined as incurring catastrophic payments if the share of out-of-pocket health expenditure in total household income or expenditure exceeds a specific threshold. O’Donnell et al. (2007) noted that income does not always reflect medical spending since some households can sometimes finance health care from their savings rather than from a reduction in current consumption. This will make no difference to the share of out-of-pocket health expenditure in income, but the share in expenditure for households without savings will be larger than for those with savings. This indicates that expenditure could be a better indicator of catastrophic health payments than income. If the measurement of catastrophic payments is based on the expenditure approach, the most common threshold used in the literature is 10 percent on the basis that this is likely to impose great difficulties on household living conditions (Pradhan and Prescott 2002; Rason 2002; Wagstaff and van Doorslaer 2003). Other thresholds are used in other studies, ranging from 5 to 25 percent of expenditure (e.g. O’Donnell et al. 2007), while World Health Organization researchers Xu et al. (2003) used 40 percent of non-food expenditure as the threshold. Following the literature, we will use the thresholds of 5, 10, 15, 20 and 25 percent for our analysis.
Three main indicators are commonly used for catastrophic payments analysis: the incidence of catastrophic payments or headcount; intensity of catastrophic payments or catastrophic payments overshoot; and the mean positive overshoot. The incidence of catastrophic payments is simply the proportion of households with the share of out-of-pocket health expenditure in household expenditure exceeding the chosen threshold.
If we assume that T is out-of-pocket health expenditure, X is total household expenditure, and Z is a threshold, then the incidence of catastrophic payments is
H = 1N
E [ Ti > Z]ΣN Xii=1
where N is the sample size and E[.] is an indicator function that equals 1 if TiXi
> Z and zero if otherwise. However, the incidence of catastrophic payments does not capture the amount of health expenditure exceeding the threshold, Z, as a proportion of total expenditure. To fill this gap, catastrophic payments overshoot is given by
O = 1N
[(Ti ) – Z] E [ Ti > Z]ΣN Xi Xii=1
Having both the incidence of catastrophic payments and catastrophic payments overshoot, the mean positive overshoot is defined as
MPO = OH
O’Donnell et al. (2005) also note that the above measurements are insensitive to household well-being, since the incidence of catastrophic payments simply counts equally all households that have health expenditure exceeding the threshold and the overshoot counts equally all health spending exceeding the threshold. To gain a better understanding of whether the impact

5
CDRI Working Paper Series No. 103
of catastrophic payments falls on the poor or the rich, concentration indices for the incidence (CE) and intensity (CO) of catastrophic payments are estimated using convenience regression or covariance method. The positive (negative) value of CE indicates that the rich (the poor) are likely to pay for health care exceeding the threshold; similarly, the positive (negative) value of CO implies that the intensity of catastrophic payments tends to be greater among the rich (the poor).
3.2.2 Key determinants of catastrophic payments
A dummy variable is defined equal to one if out-of-pocket health spending exceeds the thresholds (a binary dependent variable). Given the limitations of the linear probability model that generates a predicted probability that is less than zero or greater than one and contains heteroskedasticity (Wooldridge 2003), probit regression is used to estimate the key determinants of catastrophic payments. More precisely, we estimate the binary response models taking the form
P (y = 1| x ) = G (β0 + β1x1 + β2x2 + ... + βkxk)
where G is the standard normal cumulative distribution function, which takes a value between zero and one for all real numbers. The independent variables x include total household consumption per capita, household size, household head characteristics (age, educational attainment, gender, main occupation and marital status), sanitation proxied by the availability of a toilet and safe drinking water, the distance to the nearest commune health centre and district referral hospital and the location of the dwelling (urban vs. rural). The descriptive statistics on both dependent and independent variables are presented in Appendix 1.
3.2.3 Out-of-pocket health expenditure and poverty
It is widely noted that large out-of-pocket health expenditures can impoverish households (e.g. O’Donnell et al. 2005). The current standard poverty measurement, which looks at total household expenditure including out-of-pocket health spending, may categorise as non-poor some households with substantial health care spending but with spending on other basic needs below a subsistence level, because total expenditure is still high.
In such an extreme case, spending on health care might be excluded from poverty estimation, or poverty will be underestimated. A problem is that not all health spending, particularly spending that might be classified as discretionary, should be excluded from the estimates of household means. To examine the effects of out-of-pocket health expenditure on poverty, the literature suggests estimating poverty on the basis of total household expenditure with and without out-of-pocket health spending. The difference between the two poverty estimates can indicate the magnitude of the impoverishing effect of health payments (Wagstaff and van Doorslaer 2003).2
2 Flores et al. (2008) argue that the difference between poverty estimation generated from gross consumption and net of out-of-pocket health spending developed by Wagstaff and van Doorslaer (2003) does not capture accurately the impoverishing effect of health payments. They emphasise that household health care financing strategies such as savings, asset sales, borrowing and transfers have important implications for the measurement and interpretation of the impact of health payments on poverty. If households finance a substantial proportion of their health payments from those strategies, the gross consumption of out-of-pocket health spending is not equal to non-medical consumption in the long run. For this reason, the impoverishment effect of health payments proposed by Wagstaff and van Doorslaer (2003) could overestimate the impact on transient poverty and overlook hidden chronic poverty. Using the 1995-96 Indian National Sample Survey, Flores et al. (2008) show that the impact of catastrophic health payments on poverty is seriously overestimated if health financing strategies are not taken into account. Since the sources of health financing are not available in the Cambodia Socio-Economic Survey, we were unable to adopt this approach.

6
Catastrophic Payments and Poverty in Cambodia
If we assume that X is total household expenditure per capita, T is out-of-pocket health expenditure per capita and PL is the poverty line, then the poverty headcount that includes out-of-pocket health expenditure can be written as
H gross = 1N
E [Xi < PL]ΣNi=1
However, poverty headcount does not indicate the intensity of poverty. To address this, the poverty gap, measured as the shortfall in income or expenditure of the poor relative to the poverty line in currency units, is defined as
G gross = 1N
(PL – Xi) E [Xi < PL]ΣNi=1
To express the poverty gap as a proportion of the poverty line, the normalised poverty gap is given by
NG gross = G gross
PL
All poverty measures that exclude out-of-pocket health expenditure could be estimated by replacing X with (X – T).
3.2.4 Poverty line
To estimate the poverty headcount and poverty gap, a poverty line needs to be constructed. In line with the government and international development partners involved in poverty analysis using the Cambodia Socio-Economic Survey, we use the poverty line published by the Ministry of Planning (2006) for 2004, World Bank (2009) for 2007, the Ministry of Planning (2013) for 2009, and updated by the authors for 2008, 2010, and 2011 using the consumer price index released by the World Bank (Table 4) for the remaining poverty line.
Table 3: Overall poverty line (riels per person per day)
2004 2007 2008 2009 2010 2011
Phnom Penh 2351 3092 4210 6347 6684 7167
Other urban 1952 2704 3622 4352 4584 4917
Other rural 1753 2367 3447 3503 3690 3958Sources: Ministry of Planning (2006, 2013), World Bank (2009) and authors’ estimation
Table 4: Consumer price index (Phnom Penh prices=100)
2004 2007 2008 2009 2010 2011
Phnom Penh 63.09 82.49 112.30 100.00 105.30 112.92
Other urban 49.25 64.39 86.26 80.22 84.50 90.64
Other rural 45.20 59.27 86.32 73.48 77.40 83.02Source: World Bank (2012)
7
CDRI Working Paper Series No. 103
4. Empirical findings
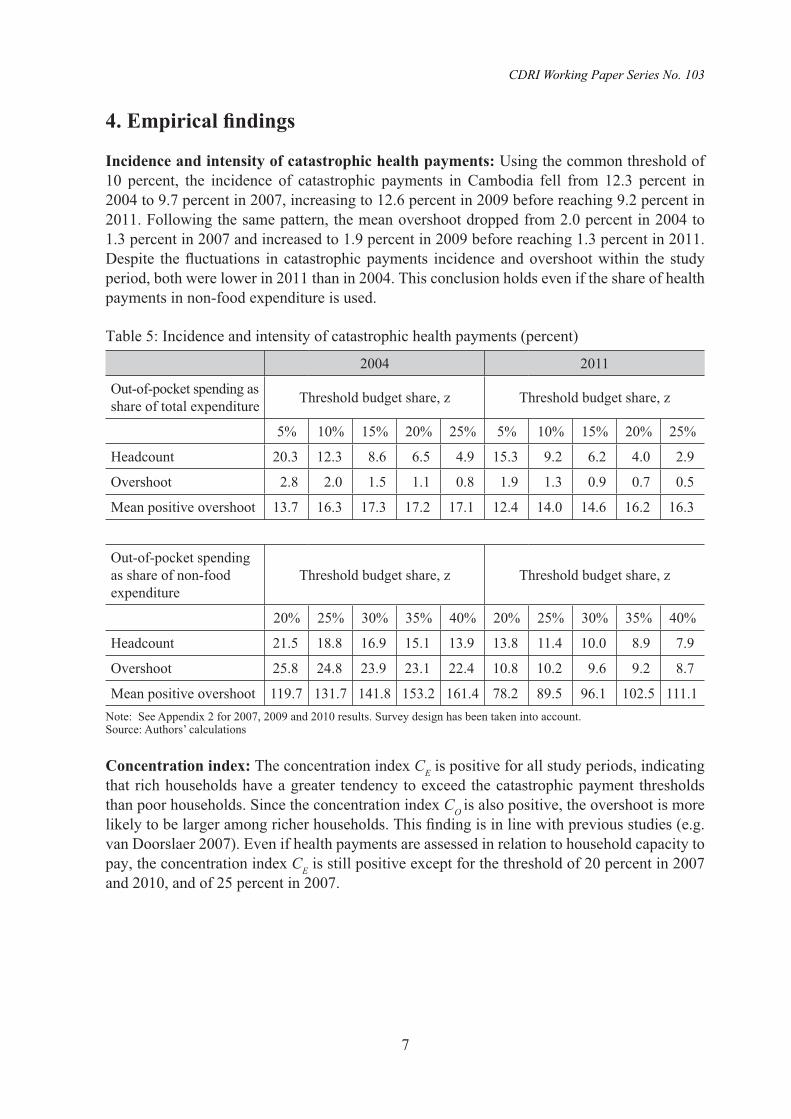
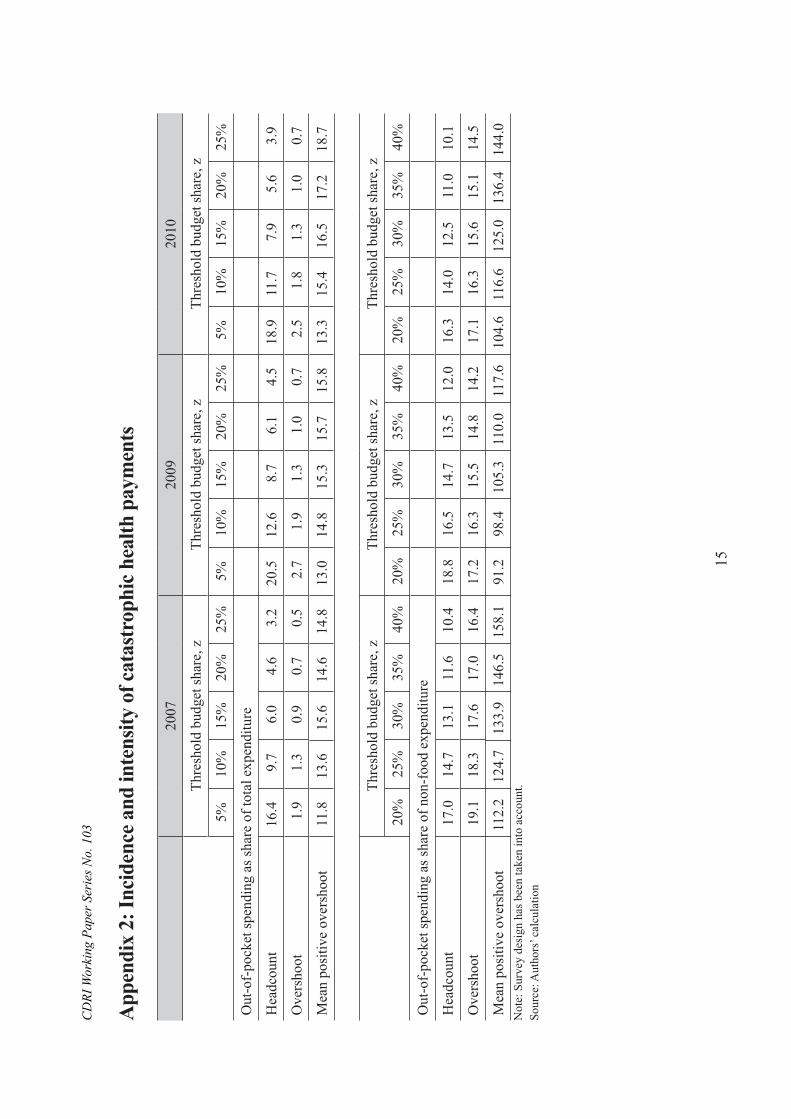
Incidence and intensity of catastrophic health payments: Using the common threshold of 10 percent, the incidence of catastrophic payments in Cambodia fell from 12.3 percent in 2004 to 9.7 percent in 2007, increasing to 12.6 percent in 2009 before reaching 9.2 percent in 2011. Following the same pattern, the mean overshoot dropped from 2.0 percent in 2004 to 1.3 percent in 2007 and increased to 1.9 percent in 2009 before reaching 1.3 percent in 2011. Despite the fluctuations in catastrophic payments incidence and overshoot within the study period, both were lower in 2011 than in 2004. This conclusion holds even if the share of health payments in non-food expenditure is used.
Table 5: Incidence and intensity of catastrophic health payments (percent)
2004 2011
Out-of-pocket spending as share of total expenditure Threshold budget share, z Threshold budget share, z
5% 10% 15% 20% 25% 5% 10% 15% 20% 25%
Headcount 20.3 12.3 8.6 6.5 4.9 15.3 9.2 6.2 4.0 2.9
Overshoot 2.8 2.0 1.5 1.1 0.8 1.9 1.3 0.9 0.7 0.5
Mean positive overshoot 13.7 16.3 17.3 17.2 17.1 12.4 14.0 14.6 16.2 16.3
Out-of-pocket spending as share of non-food expenditure
Threshold budget share, z Threshold budget share, z
20% 25% 30% 35% 40% 20% 25% 30% 35% 40%
Headcount 21.5 18.8 16.9 15.1 13.9 13.8 11.4 10.0 8.9 7.9
Overshoot 25.8 24.8 23.9 23.1 22.4 10.8 10.2 9.6 9.2 8.7
Mean positive overshoot 119.7 131.7 141.8 153.2 161.4 78.2 89.5 96.1 102.5 111.1Note: See Appendix 2 for 2007, 2009 and 2010 results. Survey design has been taken into account.Source: Authors’ calculations
Concentration index: The concentration index CE is positive for all study periods, indicating that rich households have a greater tendency to exceed the catastrophic payment thresholds than poor households. Since the concentration index CO is also positive, the overshoot is more likely to be larger among richer households. This finding is in line with previous studies (e.g. van Doorslaer 2007). Even if health payments are assessed in relation to household capacity to pay, the concentration index CE is still positive except for the threshold of 20 percent in 2007 and 2010, and of 25 percent in 2007.

8
Catastrophic Payments and Poverty in Cambodia
Table 6: Distribution-sensitive catastrophic payment measures2004 2011
Out-of-pocket spending as share of total expenditure Threshold budget share, z Threshold budget share, z
5% 10% 15% 20% 25% 5% 10% 15% 20% 25%
Concentration index, CE 0.12 0.20 0.25 0.32 0.37 0.04 0.10 0.16 0.25 0.36
Rank-weighted headcount, HW 17.9% 9.9% 6.4% 4.4% 3.1% 14.7% 8.2% 5.1% 29.9% 1.9%
Concentration index, CO 0.33 0.39 0.45 0.50 0.56 0.21 0.29 0.35 0.42 0.47
Rank-weighted overshoot, OW 1.8% 1.2% 0.8% 0.6% 0.4% 1.4% 0.9% 0.5% 0.3% 0.2%
Out-of-pocket spending as share of non-food expenditure Threshold budget share, z Threshold budget share, z
20% 25% 30% 35% 40% 20% 25% 30% 35% 40%
Concentration index, CE 0.08 0.10 0.11 0.13 0.15 0.01 0.04 0.06 0.07 0.09
Rank-weighted headcount, HW 19.8% 16.9% 15.0% 13.1% 11.8% 13.7% 10.8% 9.3% 8.3% 7.1%
Concentration index, CO 0.42 0.43 0.45 0.46 0.47 0.28 0.30 0.32 0.33 0.34
Rank-weighted overshoot, OW 0.1% 0.1% 0.1% 0.1% 0.1% 0.1% 0.1% 0.1% 0.1% 0.1%Note: See Appendix 3 for 2007, 2009 and 2010 results. Survey design has been taken into account.Source: Authors’ calculations
Key determinants of catastrophic payments: As shown in Table 7, the coefficient of total household consumption per capita is positive and statistically significant at the 1 percent level, implying that higher consumption per capita is strongly associated with a higher probability of incurring catastrophic payments for health care. This implies that better-off households are more likely to pay for health services in excess of the defined thresholds than poor households, a finding consistent with the results of concentration index CE. If we replace total household consumption per capita by consumption quintiles, the top 20 percent of the total population are more likely to incur catastrophic payments than the bottom 60 percent. The incidence of catastrophic payments is correlated with household size. The coefficient of household members aged 0-4, 15-64 and 64+ are all positive and significant at the 1 percent level, indicating that household spending on health care rises with household size. This implies that households with young or older members have a higher probability of incurring catastrophic payments for health. Education plays a very important role in reducing the likelihood of incurring catastrophic payments. The coefficient of household head with completed primary school or higher is negative and statistically significant at the 1 percent level, suggesting that a household head with higher educational attainments is less likely to incur catastrophic payments than those who have no schooling. It is worth noting that there is no difference between household heads who have not completed primary school and those who have no schooling. This could suggest that education helps maintain the health of household members (Grossman 1972 cited in O’Donnell et al. 2005). Household head characteristics such as gender and marital status are also important determinants of catastrophic payments. Male-headed households are less likely to incur catastrophic payments than female-headed households; households with married heads are more likely to incur catastrophic payments than those with unmarried heads.3
3 The coefficients of male-headed households and head-married households are not statistically significant for thresholds of 15 percent and 25 percent.

9
CDRI Working Paper Series No. 103
Table 7: Key determinants of catastrophic payments (probit model)Threshold budget share, z
5% 10% 15% 20% 25%
Consumption per capita (log) 0.453*** 0.584*** 0.670*** 0.787*** 0.866***
Household members aged 0-4 0.114*** 0.086*** 0.078*** 0.077*** 0.067**
Household members aged 5-9 0.032** 0.030* 0.041** 0.072*** 0.079***
Household members aged 10-14 0.011 0.008 0.017 0.009 -0.017
Household members aged 15-64 (male) 0.044*** 0.042*** 0.034** 0.032* 0.035*
Household members aged 15-64 (female) 0.080*** 0.083*** 0.068*** 0.081*** 0.081***
Household members aged 64+ 0.281*** 0.274*** 0.247*** 0.242*** 0.237***
Household head age 0.001 0.000 0.001 0.002 0.001
Household head gender (1=male) -0.137** -0.156** -0.087 -0.164** -0.087
Household head marital status (1=married) 0.100* 0.112* 0.063 0.115 0.026
Household head education (1=primary incomplete) -0.049 -0.052 -0.061 -0.043 -0.029
Household head education (1=primary completed) -0.087** -0.138*** -0.145*** -0.121** -0.102*
Household head education (1=lower secondary) -0.157*** -0.229*** -0.258*** -0.211*** -0.251***
Household head education (1=upper secondary) -0.260** -0.247** -0.306** -0.184 -0.362**
Household head education (1=technical training) -0.313** -0.335** -0.457** -0.515*** -0.483**
Household head education (1=university and higher) -0.437*** -0.807*** -0.781*** -0.772*** -0.870***
Household head nationality (1=Khmer) 0.191** 0.290*** 0.336*** 0.385*** 0.354***
Household head occupation (1=agriculture) -0.031 0.003 0.003 0.019 -0.003
Household head occupation (1=industry) -0.041 -0.035 -0.008 0.003 -0.01
Housing (1=roof : thatch, palm leaves, plastic sheet) 0.021 0.011 0.017 0.016 0.025
Housing (1=wall : bamboo, thatch, grass) 0.101*** 0.117*** 0.104*** 0.147*** 0.209***
Safe drinking water (1=piped in dwelling) -0.155*** -0.190*** -0.206*** -0.303*** -0.329***
Toilet (1=having toilet) -0.117*** -0.089** -0.099** -0.110** -0.122**
Distance to commune health centre (log) 0.013* 0.019*** 0.019** 0.020*** 0.018**
Region (1=rural) 0.160*** 0.250*** 0.305*** 0.355*** 0.367***
Region (1=Phnom Penh) -0.204** -0.195** -0.14 -0.018 0.077
Region (1=Plains) -0.076 -0.133** -0.144** -0.123** -0.160**
Region (1=Tonle Sap) -0.061 -0.056 -0.025 0.028 0.01
Region (1=Coastal) -0.041 -0.087 -0.099 -0.093 -0.065
Year (1=2007) -0.164*** -0.171*** -0.239*** -0.222*** -0.242***
Year (1=2009) -0.137*** -0.182*** -0.223*** -0.295*** -0.333***
Year (1=2010) -0.172*** -0.208*** -0.252*** -0.314*** -0.368***
Year (1=2011) -0.300*** -0.325*** -0.359*** -0.459*** -0.472***
Constant -5.485*** -7.140*** -8.236*** -9.670*** -10.464***
Sample size 34482 34482 34482 34482 34482Note: Significant at ***1 percent, **5 percent and *10 percent. Survey design has been taken into account. Source: Authors’ calculation.

10
Catastrophic Payments and Poverty in Cambodia
Households that have access to sanitary toilets and safe drinking water are less likely to spend in excess of the defined thresholds of total household expenditure than those without sanitary toilets (p<0.05). The distance between households and health centres also appears important. Households farther from health centres or in rural areas are more likely to incur catastrophic payments—the coefficient is positive and statistically significant at the 10 percent and 1 percent levels.
Impoverishment effects: Based on the national poverty line used by the Ministry of Planning (2006, 2013), the World Bank poverty profile (2009) and the authors’ estimation, out-of-pocket health spending increased the poverty headcount ratio by 3.6 percentage points in 2004 and 2.3 percentage points in 2007, then increased it slightly between 2009 and 2010 before reaching 2.0 percentage points in 2011. The poverty gap rose by 12.0 percent in 2004, declined to 11.2 percent in 2007 and rose to 15.0 percent for 2009-11. The normalised poverty gap followed the same trend as the poverty gap. This evidence suggests that the proportion of poor households declined over the study periods, but poor households seemed to be poorer due to out-of-pocket health spending.
Table 8: Effects of out-of-pocket health spending on poverty
2004 2011
Gross of health
payment (1)
Net of health
payment (2)
Difference
Gross of health
payment (1)
Net of health
payment (2)
Difference
Absolute (3)=(2)-(1)
Relative [(3)/(1)]*100 Absolute
(3)=(2)-(1)Relative [(3)/(1)]*100
Poverty headcount ratio (%)
37.6 41.2 3.6 9.7 17.3 19.3 2.0 11.5
Poverty gap (riels) 178.0 199.3 21.3 12.0 135.5 156.4 20.9 15.4
Normalised poverty gap (%)
10.0 11.2 1.2 11.9 3.2 3.7 0.5 15.4
Note: See Appendix 4 for 2007, 2009 and 2010 results. Survey design has been taken into account.Source: Authors’ calculation

11
CDRI Working Paper Series No. 103
5. Conclusion and policy implications
This paper measures the incidence and intensity of catastrophic payments and their effects on household welfare, particularly poverty, and identifies key sources of catastrophic payments by using the Cambodia Socio-Economic Survey in 2004, 2007, 2009, 2010 and 2011. To the best of our knowledge, this is the first attempt to provide substantial national evidence on those indicators.
Following the methodology proposed by Wagstaff and van Doorslaer (2003) and O’Donnell et al. (2005), we found that the proportion of households with out-of-pocket health spending exceeding the 10 percent threshold declined from 12.3 percent in 2004 to 9.2 percent in 2011. Similarly, the amount of out-of-pocket health spending as a share of total household expenditure exceeding the 10 percent threshold dropped from 2.0 percent in 2004 to 1.3 percent in 2011. Better-off households are more likely to exceed the payment thresholds than poor households.
Catastrophic payments are positively associated with consumption per capita, household size, household head characteristics such as marital status, distance between households and commune health centres, and living in rural areas. They are negatively correlated with household head gender and educational attainments, and access to safe drinking water and a sanitary toilet. The evidence suggests that health-related programmes to reduce catastrophic health expenditure should be well targeted. Public health interventions such as sanitary toilets or safe drinking water can indirectly address catastrophic spending.
Out-of-pocket health spending seems to have increased the poverty headcount ratio by a declining amount and the poverty gap by an increasing amount during the study periods, indicating that the effects of out-of-pocket health spending on poverty incidence diminish over time but that poor households become even poorer.

12
Catastrophic Payments and Poverty in Cambodia
References
Chhim Chhun, Tong Kimsun, Ge Yu, Timothy Ensor and Barbara Mcpake (forthcoming). The Impact of Health Financing Policies on Household Spending: Evidence from Cambodia Socio-Economic Survey 2004 and 2009. Phnom Penh: CDRI.
Eddy van Doorslaer, Owen O’Donnell, Rasindra Rannan-Eliya, Aparnaa Somanathan, Shiva Raj Adhikari, Charu C. Garg, Deni Harbianto et al. 2007. “Catastrophic Payments for Health Care in Asia.” Health Economics 16(11): 1159-1184.
Flores, Gabriela, Jaya Krishnakumar, O’Donnell Owen and Eddy van Doorslaer. 2008. “Coping with Health-care Costs: Implications for the Measurement of Catastrophic Expenditures and Poverty.” Health Economics 17(12): 1393-1412.
Ghosh Soumitra. 2010. Catastrophic Payments and Impoverishment Due to Out-of-pocket Health Spending: The Effects of Recent Health Sector Reforms in India. Asian Health Policy Program Working Paper 15. Stanford, CA: Centre for Health Policy, Planning and Management, Tata Institute of Social Sciences.
Grossman, M. 1972. The Demand for Health: a Theoretical and Empirical Investigation. NBER Occasional Paper 119. New York: National Bureau of Economic Research.
Hanvoravongchai, Piya, and Adelio Fernandes. 2014. Out-of-Pocket and Catastrophic Expenditure on Health in Cambodia: Cambodian Demographic Health Survey 2005 and Socio-Economic Surveys 2004 and 2007 Analysis. Phnom Penh: GIZ.
Kagarura Rwamparagi, Willy, Bruno K. Yawe and John Ddumba-Ssentamu. 2014. “Poverty Impact of Direct Payment for Health Care in Uganda.” Applied Economics and Business Review 1(1): 1-8.
Kassie, A. 2000. Credit and Landlessness: Impact of Credit Access on Landless in Cheung Prey and Battambang Districts, Cambodia. Phnom Penh: Centre for Advanced Studies.
Ministry of Planning. 2006. A Poverty Profile of Cambodia 2004. Phnom Penh: MOP.
Ministry of Planning. 2013. Poverty in Cambodia—A New Approach: Redefining the Poverty Line. Phnom Penh: MOP.
O’Donnell, Owen, Eddy van Doorslaer, Rasindra Rannan-Eliya, Aparnaa Somanathan, Charu C. Garg, Piya Hanvoravongchai, Mohammed Nazmul Huq, et al. 2005. Explaining the Incidence of Catastrophic Expenditures on Health Care: Comparative Evidence from Asia. EQUITAP Project Working Paper 5.
O’Donnell, Owen, Eddy van Doorslaer, Adam Wagstaff and Magnus Lindelow. 2007. Analysing Health Equity Using Household Survey Data: A Guide to Techniques and Their Implementation. Washington, DC: World Bank.
Pradhan, M., and N. Prescott. 2002. “Social Risk Management Options for Medical Care in Indonesia.” Health Economics 11 (5):431-46. doi: 10.1002/hec.689.

13
CDRI Working Paper Series No. 103
Ranson, M.K. 2002. “Reduction of Catastrophic Health Care Expenditures by a Community-based Health Insurance Scheme in Gujarat, India: Current Experiences and Challenges.” Bulletin of the World Health Organization 80(8): 613-621.
Van Dammer, W., L. Van Leemput, Por Ir, W. Hardemand and B. Meessen. 2004. “Out-of-Pocket Health Expenditure and Debt in Poor Households: Evidence from Cambodia.” Tropical Medicine and International Health 9(2): 273-280.
Wagstaff, Adam, and Eddy van Doorslaer. 2003. “Catastrophe and Impoverishment in Paying for Health Care: With Application to Vietnam 1993-1998.” Health Economics 12(11): 921-934.
World Health Organization. 2010. The World Health Report: Health Systems Financing – the Path to Universal Coverage. Geneva: WHO.
Wilkinson, D., J. Holloway and P. Fallavier. 2001. The Impact of User Fees on Access, Equity and Health Provider Practices. Report prepared for the Health Economics Task Force, MOH/WHO Health Sector Reform Phase 3. ReBUILD Consortium.
Wooldridge, J.M. 2003. Introductory Econometrics: A Modern Approach. Cambridge, MA: MIT Press.
World Bank. 2009. Poverty Profile and Trends in Cambodia, 2007: Findings from the Cambodia Socio-Economic Survey (CSES). Phnom Penh: World Bank.
World Bank. 2012. “Consumer Price Index, Memo.” Washington, DC: World Bank.
Xu Ke, David B. Evans, Kei Kawabata, Riadh Zeramdini, Jan Klavus and Christopher J.L. Murray. 2003. “Household Catastrophic Health Expenditure: A Multicountry Analysis.” Lancet 362(1): 1-7.

14
Catastrophic Payments and Poverty in Cambodia
Appendix 1: Descriptive statistics of dependent and independent variables for probit model (mean)
2004 2007 2009 2010 2011
Consumption per capita per day (riels) 9662 9859 12373 12361 11693
Number of household members aged 0-4 0.49 0.47 0.47 0.46 0.43
Number of household members aged 5-9 0.59 0.55 0.52 0.46 0.48
Number of household members aged 10-14 0.72 0.61 0.54 0.51 0.48
Number of household members aged 15-64 (male) 1.39 1.41 1.44 1.38 1.37
Number of household members aged 15-64 (female) 1.58 1.59 1.59 1.55 1.55
Number of household members aged 64+ 0.20 0.21 0.21 0.21 0.22
Household head age 44.91 45.28 45.45 45.93 46.59
Household head gender (1=male) 0.78 0.78 0.78 0.78 0.77
Household head marital status (1= married) 0.79 0.78 0.79 0.77 0.78
Household head education (1=primary incomplete) 0.43 0.48 0.44 0.48 0.47
Household head education (1=primary completed) 0.20 0.19 0.20 0.19 0.21
Household head education (1= lower secondary ) 0.05 0.07 0.08 0.07 0.09
Household head education (1=upper secondary ) 0.01 0.01 0.01 0.02 0.01
Household head education (1=technical training ) 0.01 0.01 0.01 0.01 0.01
Household head education (1= university and higher ) 0.01 0.01 0.01 0.02 0.02
Household head nationality (1=Khmer) 0.96 0.98 0.96 0.96 0.97
Household head occupation (1=agriculture) 0.51 0.52 0.53 0.49 0.53
Household head occupation (1=industry) 0.10 0.12 0.11 0.13 0.11
Housing (1= roof : thatch, palm leaves, plastic sheet) 0.29 0.20 0.16 0.14 0.12
Housing (1= wall : bamboo, thatch, grass) 0.45 0.37 0.34 0.32 0.29
Safe drinking water (1=piped in dwelling) 0.10 0.16 0.16 0.15 0.17
Toilet (1= having toilet) 0.26 0.36 0.39 0.43 0.46
Distance to commune health centre (metres) 5536 4951 4043 3874 3873
Rural (1=rural, 0=urban) 0.81 0.81 0.81 0.80 0.79
Region (1=Phnom Penh) 0.08 0.09 0.09 0.09 0.11
Region (1=Plains) 0.44 0.40 0.41 0.40 0.39
Region (1=Tonle Sap) 0.30 0.34 0.32 0.32 0.32
Region (1=Coastal) 0.08 0.07 0.07 0.07 0.07
Region (1=Plateau and Mountains) 0.10 0.10 0.11 0.11 0.11
Sample size 11808 3553 11970 3592 3592Source: Authors’ calculation
15
CD
RI W
orki
ng P
aper
Ser
ies N
o. 1
03
App
endi
x 2:
Inci
denc
e and
inte
nsity
of c
atas
trop
hic h
ealth
pay
men
ts
2007
2009
2010
Thre
shol
d bu
dget
shar
e, z
Thre
shol
d bu
dget
shar
e, z
Thre
shol
d bu
dget
shar
e, z
5%10
%15
%20
%25
%5%
10%
15%
20%
25%
5%10
%15
%20
%25
%
Out
-of-
pock
et sp
endi
ng a
s sha
re o
f tot
al e
xpen
ditu
re
Hea
dcou
nt
16.4
9.7
6.0
4.6
3.2
20.5
12.6
8.7
6.1
4.5
18.9
11.7
7.9
5.6
3.9
Ove
rsho
ot
1.9
1.3
0.9
0.7
0.5
2.7
1.9
1.3
1.0
0.7
2.5
1.8
1.3
1.0
0.7
Mea
n po
sitiv
e ov
ersh
oot
11.8
13.6
15.6
14.6
14.8
13.0
14.8
15.3
15.7
15.8
13.3
15.4
16.5
17.2
18.7
Thre
shol
d bu
dget
shar
e, z
Thre
shol
d bu
dget
shar
e, z
Thre
shol
d bu
dget
shar
e, z
20%
25%
30%
35%
40%
20%
25%
30%
35%
40%
20%
25%
30%
35%
40%
Out
-of-
pock
et sp
endi
ng a
s sha
re o
f non
-foo
d ex
pend
iture
Hea
dcou
nt
17.0
14.7
13.1
11.6
10.4
18.8
16.5
14.7
13.5
12.0
16.3
14.0
12.5
11.0
10.1
Ove
rsho
ot
19.1
18.3
17.6
17.0
16.4
17.2
16.3
15.5
14.8
14.2
17.1
16.3
15.6
15.1
14.5
Mea
n po
sitiv
e ov
ersh
oot
112.
212
4.7
133.
914
6.5
158.
191
.298
.410
5.3
110.
011
7.6
104.
611
6.6
125.
013
6.4
144.
0N
ote:
Sur
vey
desi
gn h
as b
een
take
n in
to a
ccou
nt.
Sour
ce: A
utho
rs’ c
alcu
latio
n

16
Cat
astro
phic
Pay
men
ts a
nd P
over
ty in
Cam
bodi
a
App
endi
x 3:
Dis
trib
utio
n-se
nsiti
ve c
atas
trop
hic
paym
ents
mea
sure
s
2007
2009
2010
Thre
shol
d bu
dget
shar
e, z
Thre
shol
d bu
dget
shar
e, z
Thre
shol
d bu
dget
shar
e, z
5%10
%15
%20
%25
%5%
10%
15%
20%
25%
5%10
%15
%20
%25
%
Out
-of-
pock
et sp
endi
ng a
s sha
re o
f tot
al e
xpen
ditu
re
Con
cent
ratio
n in
dex,
CE
0.04
0.
08
0.13
0.
14
0.17
0.
080.
150.
220.
310.
3710
0.01
0.06
0.09
0.17
0.26
Rank
-wei
ghte
d he
adco
unt,
HW
15.7
%8.
9%5.
2%3.
9%2.
6%18
.8%
10.6
%6.
7%4.
2%2.
8%18
.8%
10.8
%7.
1%4.
6%2.
9%
Con
cent
ratio
n in
dex,
CO
0.17
0.
22
0.27
0.
33
0.40
0.
29
0.36
0.
43
0.50
0.
56
0.19
0.
25
0.32
0.
39
0.44
Rank
-wei
ghte
d ov
ersh
oot,
OW
1.6%
1.0%
0.6%
0.4%
0.2%
1.8%
1.1%
0.7%
0.4%
0.3%
2.0%
1.3%
0.8%
0.5%
0.4%
Thre
shol
d bu
dget
shar
e, z
Thre
shol
d bu
dget
shar
e, z
Thre
shol
d bu
dget
shar
e, z
20%
25%
30%
35%
40%
20%
25%
30%
35%
40%
20%
25%
30%
35%
40%
Out
-of-
pock
et sp
endi
ng a
s sha
re o
f non
-foo
d ex
pend
iture
Con
cent
ratio
n in
dex,
CE
-0.0
2-0
.01
0.00
0.02
0.04
0.07
0.09
0.10
0.11
0.13
-0.0
10.
010.
030.
030.
04
Rank
-wei
ghte
d he
adco
unt,
HW
17.2
%14
.7%
13.1
%11
.3%
10.0
%17
.4%
15.1
%13
.2%
11.9
%10
.4%
16.4
%13
.8%
12.1
%10
.6%
9.7%
Con
cent
ratio
n in
dex,
CO
0.39
0.41
0.43
0.44
0.46
0.41
0.43
0.44
0.46
0.47
0.34
0.36
0.37
0.39
0.41
Rank
-wei
ghte
d ov
ersh
oot,
OW
0.1%
0.1%
0.1%
0.1%
0.1%
0.1%
0.1%
0.1%
0.1%
0.1%
0.1%
0.1%
0.1%
0.1%
0.1%
Not
e: S
urve
y de
sign
has
bee
n ta
ken
into
acc
ount
.So
urce
: Aut
hors
’ cal
cula
tion

17
CD
RI W
orki
ng P
aper
Ser
ies N
o. 1
03
App
endi
x 4:
Eff
ects
of o
ut-o
f-po
cket
hea
lth sp
endi
ng o
n po
vert
y
2007
2009
2010
Gro
ss o
f he
alth
pa
ymen
t (1
)
Net
of
heal
th
paym
ent
(2)
Diff
eren
ce
Gro
ss o
f he
alth
pa
ymen
t (1
)
Net
of
heal
th
paym
ent
(2)
Diff
eren
ce
Gro
ss o
f he
alth
pa
ymen
t (1
)
Net
of
heal
th
paym
ent
(2)
Diff
eren
ce
Abs
olut
e (3
)=(2
)-(1)
Rel
ativ
e
[(3)/(
1)]*
100
Abs
olut
e (3
)=(2
)-(1)
Rel
ativ
e
[(3)/(
1)]*
100
Abs
olut
e (3
)=(2
)-(1)
Rel
ativ
e
[(3)/(
1)]*
100
Pove
rty h
eadc
ount
ra
tio (%
)31
.934
.22.
37.
221
.223
.92.
612
.218
.120
.82.
714
.8
Pove
rty g
ap (r
iels
)18
8.4
209.
521
.111
.216
4.9
190.
825
.915
.714
4.9
167.
823
.015
.8
Nor
mal
ised
po
verty
gap
(%)
7.9
8.8
0.9
11.2
4.5
5.2
0.7
16.1
3.7
4.3
0.6
16.1
Not
e: S
urve
y de
sign
has
bee
n ta
ken
into
acc
ount
.So
urce
: Aut
hors
’ cal
cula
tion

18
Catastrophic Payments and Poverty in Cambodia
CDRI working paper series
WP 102) Eng Netra, Vong Mun and Hort Navy (June 2015), Social Accountability in Service Delivery in Cambodia
WP 101) Ou Sivhouch (April 2015), A Right-Based Approach to Development: A Cambodian Perspective
WP 100) Sam Sreymom with Ouch Chhuong (March 2015), Agricultural Technological Practices and Gaps for Climate Change Adaptation
WP 99) Phay Sokcheng and Tong Kimsun (December 2014), Public Spending on Education, Health and Infrastructure and Its Inclusiveness in Cambodia: Benefit Incidence Analysis
WP 98) Srinivasa Madhur (August 2014), Cambodia’s Skill Gap: An Anatomy of Issues and Policy Options
WP 97) Kim Sour, Dr Chem Phalla, So Sovannarith, Dr Kim Sean Somatra and Dr Pech Sokhem (August 2014), Methods and Tools Applied for Climate Change Vulnerability and Adaptation Assessment in Cambodia’s Tonle Sap Basin
WP 96) Kim Sean Somatra and Hort Navy (August 2014), Cambodian State: Developmental, Neoliberal? A Case Study of the Rubber Sector
WP 95) Theng Vuthy, Keo Socheat, Nou Keosothea, Sum Sreymom and Khiev Pirom (August 2014), Impact of Farmer Organisations on Food Security: The Case of Rural Cambodia
WP 94) Heng Seiha, Vong Mun and Chheat Sreang with the assistance of Chhuon Nareth (July 2014), The Enduring Gap: Decentralisation Reform and Youth Participation in Local Rural Governance
WP 93) Nang Phirun, Sam Sreymom, Lonn Pichdara and Ouch Chhuong (June 2014), Adaptation Capacity of Rural People in the Main Agro-Ecological Zones in Cambodia
WP 92) Phann Dalis (June 2014), Links between Employment and Poverty in Cambodia
WP 91) Theng Vuthy, Khiev Pirom and Phon Dary (April 2014), Development of the Fertiliser Industry in Cambodia: Structure of the Market, Challenges in the Demand and Supply Sidesand the Way Forward
WP 90) CDRI Publication (January 2014), ASEAN 2030: Growing Together for Economic Prosperity–the Challenges (Cambodia Background Paper)
WP 89) Nang Phirun and Ouch Chhuong (January 2014), Gender and Water Governance: Women’s Role in Irrigation Management and Development in the Context of Climate Change
WP 88) Chheat Sreang (December 2013), Impact of Decentralisation on Cambodia’s Urban Governance
WP 87) Kim Sedara and Joakim Öjendal with the assistance of Chhoun Nareth (November 2013), Gatekeepers in Local Politics: Political Parties in Cambodia and their Gender Policy

19
CDRI Working Paper Series No. 103
WP 86) Sen Vicheth and Ros Soveacha with the assistance of Hieng Thiraphumry (October 2013), Anatomy of Higher Education Governance in Cambodia
WP 85) Ou Sivhuoch and Kim Sedara (August 2013), 20 Years’ Strengthening of Cambodian Civil Society: Time for Reflection
WP 84) Ou Sivhuoch (August 2013), Sub-National Civil Society in Cambodia: A Gramscian Perspective
WP 83) Tong Kimsun, Lun Pide and Sry Bopharath with the assistance of Pon Dorina (August 2013), Levels and Sources of Household Income in Rural Cambodia 2012
WP 82) Nang Phirun (July 2013), Climate Change Adaptation and Livelihoods in Inclusive Growth: A Review of Climate Change Impacts and Adaptive Capacity in Cambodia
WP 81) Hing Vutha (June 2013), Leveraging Trade for Economic Growth in Cambodia
WP 80) Saing Chan Hang (March 2013), Binding Constraints on Economic Growth in Cambodia: A Growth Diagnostic Approach
WP 79) Lun Pidé (March 2013), The Role of Rural Credit during the Global Financial Crisis: Evidence From Nine Villages in Cambodia
WP 78) Tong Kimsun and Phay Sokcheng (March 2013), The Role of Income Diversification during the Global Financial Crisis: Evidence from Nine Villages in Cambodia
WP 77) Saing Chan Hang (March 2013), Household Vulnerability to Global Financial Crisis and Their Risk Coping Strategies: Evidence from Nine Rural Villages in Cambodia
WP 76) Hing Vutha (March 2013), Impact of the Global Financial Crisis on the Rural Labour Market: Evidence from Nine Villages in Cambodia
WP 75) Tong Kimsun (March 2013), Impact of the Global Financial Crisis on Poverty: Evidence from Nine Villages in Cambodia
WP 74) Ngin Chanrith (March 2013), Impact of the Global Financial Crisis on Employment in SMEs in Cambodia
WP 73) Hay Sovuthea (March 2013), Government Response to Inflation Crisis and Global Financial Crisis
WP 72) Hem Socheth (March 2013), Impact of the Global Financial Crisis on Cambodian Economy at Macro and Sectoral Levels
WP 71) Kim Sedara and Joakim Öjendal with Chhoun Nareth and Ly Tem (December 2012), A Gendered Analysis of Decentralisation Reform in Cambodia
WP 70) Hing Vutha, Saing Chan Hang and Khieng Sothy (August 2012), Baseline Survey for Socioeconomic Impact Assessment: Greater Mekong Sub-region Transmission Project
WP 69) CDRI Publication (March 2012), Understanding Poverty Dynamics: Evidence from Nine Villages in Cambodia
WP 68) Roth Vathana (March 2012), Sectoral Composition of China’s Economic Growth, Poverty Reduction and Inequality: Development and Policy Implications for Cambodia
WP 67) Keith Carpenter with assistance from PON Dorina (February 2012), A Basic Consumer Price Index for Cambodia 1993–2009

20
Catastrophic Payments and Poverty in Cambodia
WP 66) TONG Kimsun (February 2012), Analysing Chronic Poverty in Rural Cambodia Evidence from Panel Data
WP 65) Ros Bansok, Nang Phirun and Chhim Chhun (December 2011), Agricultural Development and Climate Change: The Case of Cambodia
WP 64) Tong Kimsun, Sry Bopharath (November 2011), Poverty and Evironment Links: The Case of Rural Cambodia
WP 63) Heng Seiha, Kim Sedara and So Sokbunthoeun (October 2011), Decentralised Governance in Hybrid Polity: Localisation of Decentralisation Reform in Cambodia
WP 62) Chea Chou, Nang Phirun, Isabelle Whitehead, Phillip Hirsch and Anna Thompson (October 2011), Decentralised Governance of Irrigation Water in Cambodia: Matching Principles to Local Realities
WP 61) Ros Bandeth, Ly Tem and Anna Thompson (September 2011), Catchment Governance and Cooperation Dilemmas: A Case Study from Cambodia
WP 60) Saing Chan Hang, Hem Socheth and Ouch Chandarany with Phann Dalish and Pon Dorina (November 2011), Foreign Investment in Agriculture in Cambodia
WP 59) Chem Phalla, Philip Hirsch and Someth Paradis (September 2011), Hydrological Analysis in Support of Irrigation Management: A Case Study of Stung Chrey Bak Catchment, Cambodia
WP 58) Hing Vutha, Lun Pide and Phann Dalis (August 2011), Irregular Migration from Cambodia: Characteristics, Challenges and Regulatory Approach
WP 57) Tong Kimsun, Hem Socheth and Paulos Santos (August 2011), The Impact of Irrigation on Household Assets
WP 56) Tong Kimsun, Hem Socheth and Paulos Santos (July 2011), What Limits Agricultural Intensification in Cambodia? The role of emigration, agricultural extension services and credit constraints
WP 55) Kem Sothorn, Chhim Chhun, Theng Vuthy and So Sovannarith (July 2011), Policy Coherence in Agricultural and Rural Development: Cambodia
WP 54) Nang Phirun, Khiev Daravy, Philip Hirsch and Isabelle Whitehead (June), Improving the Governance of Water Resources in Cambodia: A Stakeholder Analysis
WP 53) Chann Sopheak, Nathan Wales and Tim Frewer (August 2011), An Investigation of Land Cover and Land Use Change in Stung Chrey Bak Catchment, Cambodia
WP 52) Ouch Chandarany, Saing Chanhang and Phann Dalis (June 2011), Assessing China’s Impact on Poverty Reduction In the Greater Mekong Sub-region: The Case of Cambodia
WP 51) Christopher Wokker, Paulo Santos, Ros Bansok and Kate Griffiths (June 2011), Irrigation Water Productivity in Cambodian Rice System
WP 50) Pak Kimchoeun (May 2011), Fiscal Decentralisation in Cambodia: A Review of Progress and Challenges
WP 49) Chem Phalla and Someth Paradis (March 2011), Use of Hydrological Knowledge and Community Participation for Improving Decision-making on Irrigation Water Allocation

21
CDRI Working Paper Series No. 103
WP 48) CDRI Publication (August 2010), Empirical Evidence of Irrigation Management in the Tonle Sap Basin: Issues and Challenges
WP 47) Chea Chou (August 2010), The Local Governance of Common Pool Resources: The Case of Irrigation Water in Cambodia
WP 46) CDRI Publication (December 2009), Agricultural Trade in the Greater Mekong Sub-region: Synthesis of the Case Studies on Cassava and Rubber Production and Trade in GMS Countries
WP 45) CDRI Publication (December 2009), Costs and Benefits of Cross-country Labour Migration in the GMS: Synthesis of the Case Studies in Thailand, Cambodia, Laos and Vietnam
WP 44) Chan Sophal (December 2009), Costs and Benefits of Cross-border Labour Migration in the GMS: Cambodia Country Study
WP 43) Hing Vutha and Thun Vathana (December 2009), Agricultural Trade in the Greater Mekong Sub-region: The Case of Cassava and Rubber in Cambodia
WP 42) Thon Vimealea, Ou Sivhuoch, Eng Netra and Ly Tem (October 2009), Leadership in Local Politics of Cambodia: A Study of Leaders in Three Communes of Three Provinces
WP 41) Hing Vutha and Hossein Jalilian (April 2009), The Environmental Impacts of the ASEAN-China Free Trade Agreement for Countries in the Greater Mekong Sub-region
WP 40) Eng Netra and David Craig (March 2009), Accountability and Human Resource Management in Decentralised Cambodia
WP 39) Horng Vuthy and David Craig (July 2008), Accountability and Planning in Decentralised Cambodia
WP 38) Pak Kimchoeun and David Craig (July 2008), Accountability and Public Expenditure Management in Decentralised Cambodia
WP 37) Chem Phalla et al. (May 2008), Framing Research on Water Resources Management and Governance in Cambodia: A Literature Review
WP 36) Lim Sovannara (November 2007), Youth Migration and Urbanisation in Cambodia
WP 35) Kim Sedara & Joakim Öjendal with the assistance of Ann Sovatha (May 2007), Where Decentralisation Meets Democracy: Civil Society, Local Government, and Accountability in Cambodia
WP 34) Pak Kimchoeun, Horng Vuthy, Eng Netra, Ann Sovatha, Kim Sedara, Jenny Knowles & David Craig (March 2007), Accountability and Neo-patrimonialism in Cambodia: A Critical Literature Review
WP 33) Hansen, Kasper K. & Neth Top (December 2006), Natural Forest Benefits and Economic Analysis of Natural Forest Conversion in Cambodia
WP 32) Murshid, K.A.S. & Tuot Sokphally (April 2005), The Cross Border Economy of Cambodia: An Exploratory Study
WP 31) Oberndorf, Robert B. (May 2004), Law Harmonisation in Relation to the Decentralisation Process in Cambodia

22
Catastrophic Payments and Poverty in Cambodia
WP 30) Hughes, Caroline & Kim Sedara with the assistance of Ann Sovatha (February 2004), The Evolution of Democratic Process and Conflict Management in Cambodia: A Comparative Study of Three Cambodian Elections
WP 29) Yim Chea & Bruce McKenney (November 2003), Domestic Fish Trade: A Case Study of Fish Marketing from the Great Lake to Phnom Penh
WP 28) Prom Tola & Bruce McKenney (November 2003), Trading Forest Products in Cambodia: Challenges, Threats, and Opportunities for Resin
WP 27) Yim Chea & Bruce McKenney (October 2003), Fish Exports from the Great Lake to Thailand: An Analysis of Trade Constraints, Governance, and the Climate for Growth
WP 26) Sarthi Acharya, Kim Sedara, Chap Sotharith & Meach Yady (February 2003), Off-farm and Non-farm Employment: A Perspective on Job Creation in Cambodia
WP 25) Chan Sophal & Sarthi Acharya (December 2002), Facing the Challenge of Rural Livelihoods: A Perspective from Nine Villages in Cambodia
WP 24) Kim Sedara, Chan Sophal & Sarthi Acharya (July 2002), Land, Rural Livelihoods and Food Security in Cambodia
WP 23) McKenney, Bruce & Prom Tola. (July 2002), Natural Resources and Rural Livelihoods in Cambodia
WP 22) Chan Sophal & Sarthi Acharya (July 2002), Land Transactions in Cambodia: An Analysis of Transfers and Transaction Records
WP 21) Bhargavi Ramamurthy, Sik Boreak, Per Ronnås and Sok Hach (December 2001), Cambodia 1999-2000: Land, Labour and Rural Livelihood in Focus
WP 20) So Sovannarith, Real Sopheap, Uch Utey, Sy Rathmony, Brett Ballard & Sarthi Acharya (November 2001), Social Assessment of Land in Cambodia: A Field Study
WP 19) Chan Sophal, Tep Saravy & Sarthi Acharya (October 2001), Land Tenure in Cambodia: a Data Update
WP 18) Godfrey, Martin, So Sovannarith, Tep Saravy, Pon Dorina, Claude Katz, Sarthi Acharya, Sisowath D. Chanto & Hing Thoraxy (August 2001), A Study of the Cambodian Labour Market: Reference to Poverty Reduction, Growth and Adjustment to Crisis
WP 17) Chan Sophal, & So Sovannarith, with Pon Dorina (December 2000), Technical Assistance and Capacity Development at the School of Agriculture Prek Leap
WP 16) Sik Boreak, (September 2000), Land Ownership, Sales and Concentration in Cambodia
WP 15) Godfrey, Martin, Chan Sophal, Toshiyasu Kato, Long Vou Piseth, Pon Dorina, Tep Saravy, Tia Savara & So Sovannarith (August 2000), Technical Assistance and Capacity Development in an Aid-dependent Economy: the Experience of Cambodia
WP 14) Toshiyasu Kato, Jeffrey A. Kaplan, Chan Sophal & Real Sopheap (May 2000), Enhancing Governance for Sustainable Development
WP 13) Ung Bunleng, (January 2000), Seasonality in the Cambodian Consumer Price Index

23
CDRI Working Paper Series No. 103
WP 12) Chan Sophal, Toshiyasu Kato, Long Vou Piseth, So Sovannarith, Tia Savora, Hang Chuon Naron, Kao Kim Hourn & Chea Vuthna (September 1999), Impact of the Asian Financial Crisis on the SEATEs: The Cambodian Perspective
WP 11) Chan Sophal & So Sovannarith (June 1999), Cambodian Labour Migration to Thailand: A Preliminary Assessment
WP 10) Gorman, Siobhan, with Pon Dorina & Sok Kheng (June 1999), Gender and Development in Cambodia: An Overview
WP 9) Teng You Ky, Pon Dorina, So Sovannarith & John McAndrew (April 1999), The UNICEF/Community Action for Social Development Experience—Learning from Rural Development Programmes in Cambodia
WP 8) Chan Sophal, Martin Godfrey, Toshiyasu Kato, Long Vou Piseth, Nina Orlova, Per Ronnås & Tia Savora (January 1999), Cambodia: The Challenge of Productive Employment Creation
WP 7) McAndrew, John P. (December 1998), Interdependence in Household Livelihood Strategies in Two Cambodian Villages
WP 6) Murshid, K.A.S. (December 1998), Food Security in an Asian Transitional Economy: The Cambodian Experience
WP 5) Kato, Toshiyasu, Chan Sophal & Long Vou Piseth (September 1998), Regional Economic Integration for Sustainable Development in Cambodia
WP 4) Chim Charya, Srun Pithou, So Sovannarith, John McAndrew, Nguon Sokunthea, Pon Dorina & Robin Biddulph (June 1998), Learning from Rural Development Programmes in Cambodia
WP 3) Kannan, K.P. (January 1997), Economic Reform, Structural Adjustment and Development in Cambodia
WP 2) McAndrew, John P. (January 1996), Aid Infusions, Aid Illusions: Bilateral and Multilateral Emergency and Development Assistance in Cambodia. 1992-1995
WP 1) Kannan, K.P. (November 1995), Construction of a Consumer Price Index for Cambodia: A Review of Current Practices and Suggestions for Improvement
Cambodia Development Resource InstituteF 56 Street 315, Tuol Kork* PO Box 622, Phnom Penh, Cambodia' (855 23) 881 384/881 701/881 916/883 6036 (855 23) 880 734
E-mail: [email protected]: www.cdri.org.kh
Price: USD2.00