Embed Size (px)
Citation preview

Catalytic Distillation:
Modeling and Process Development
for
Fuels and Chemicals
by
Aashish Gaurav
A thesis
presented to the University of Waterloo
in fulfillment of the
thesis requirement for the degree of
Doctor of Philosophy
in
Chemical Engineering
Waterloo, Ontario, Canada, 2017
©Aashish Gaurav 2017
ii
Examining Committee Membership
The following served on the Examining Committee for this thesis. The decision of the Examining
Committee is by majority vote.
External Examiner Professor Krishnaswamy Nandakumar,
Cain Endowed Chair & Professor,
Cain Department of Chemical Engineering,
Louisiana State University
Supervisor(s) Professor Flora Ng,
University Professor,
Department of Chemical Engineering,
University of Waterloo.
Internal Member Professor Eric Croiset,
Chair and Professor,
Department of Chemical Engineering,
University of Waterloo.
Internal Member Professor Ali Elkamel,
Professor,
Department of Chemical Engineering,
University of Waterloo.
Internal-external Member Professor Gordon Savage
Professor,
Systems Design Engineering,
University of Waterloo
Other Member(s) Professor Peter Douglas
Professor,
Department of Chemical Engineering,
University of Waterloo

iii
AUTHOR'S DECLARATION
I hereby declare that I am the sole author of this thesis. This is a true copy of the thesis, including any
required final revisions, as accepted by my examiners.
I understand that my thesis may be made electronically available to the public

iv
Abstract
Catalytic Distillation (CD) is a hybrid green reactor technology that utilizes the dynamics of
simultaneous reaction and separation in a single process unit to achieve a more compact, economical,
efficient and optimized process design when compared to the traditional multi-unit designs. This thesis
advances CD as a process intensification technique by presenting process design and outlining key
process conditions for improving the productivity, profitability and environmental impacts of 4
chemical systems:
1) Olefin Oligomerization of isobutene to isooctane
2) Aldol condensation of acetone to MIBK
3) Hydrogenation of benzene to cyclohexane
4) Biodiesel production from soybean oil and yellow grease
For optimizing process design or operation over a wide design space and at low cost, a high-fidelity
model of the plant or process that is predictive over the entire range of interest is essential. Such a
model could be used to optimize design or operation, exploring a wide design space rapidly and at low
cost, and applying optimization techniques to determine answers.
The thesis develops the first model to describe fast reactions involving a non-condensable gas such
as hydrogen in a catalytic distillation process. A reaction with a Hatta number greater than one (Hatta
number corresponds to the relative rate of the reaction in a liquid film to the rate of diffusion through
the film) is considered to be a fast reaction. The postulate is that a hydrogenation reaction in the
solid/liquid film enhances mass transfer leading to improved process performance. A reaction
accelerated by “enhanced H2 concentration “via diffusion/reaction could account for the lower
hydrogenation partial pressure observed in various CD systems. Hydrogenation is a reaction of
immense industrial importance, particularly in the petroleum industry and the current distillation
models do not include non-condensable gases. Hydrogenation at lower pressures, is a key CD process
advantage reported in patent literature but a scientific study elucidating the observed phenomena was
absent from literature. A new proposed film model was developed by incorporating the concept of H2
diffusion through a film in the solid /liquid interface in a three-phase non-equilibrium model developed
previously in our laboratory. This film model was validated using three hydrogenation reactions that
have been reported to have hydrogenations in lower hydrogen pressure, namely, the hydrogenation of
benzene, the CD process for the production of isooctane via the dimerization of isooctane and the

v
subsequent hydrogenation of isooctene to isooctane, and the production of methyl-isobutyl- ketone
from acetone and hydrogen .
In recent years, there has been interest to develop efficient processes for the production of biodiesel
from low grade or waste oils with high free fatty acid content. An integrated catalytic distillation process
design for continuous large scale biodiesel production from a feedstock with high free fatty acid and a
solid acid catalyst was developed using ASPEN PLUS. Model predictions indicated that for an annual
biodiesel production of 10 million gallons from vegetable oil, a CD process can result in significant
savings in capital (41.4% lesser cost than the conventional process) and utility requirements (18.1%
less than the conventional process). The cost of biodiesel was found to highly depend on the feedstock
price and hence, in second part of the studies, a new green process for biodiesel production from yellow
grease using CD technology was designed. The CD technology was found to lower capital costs by
22.2 % and utility costs by 32.3 %. The CD process also resulted in an improved catalysis, emission
control and waste minimization.

vi
Acknowledgements
Firstly, I would like to thank my supervisor, Professor Flora Ng for her guidance and support throughout
my academic program. I am enamored and grateful for the trust, confidence opportunities she has given
me to learn and experience new aspects of research, your valuable and thoughtful counsel, and for your
undaunted tenacity in tackling challenging research problems.
I am indebted to Professor Rempel, who has been a huge influence on my development as a
researcher. His course on research topics in chemical kinetics, catalysis and advanced reactor
engineering gave me the opportunity to approach the research from a different angle. I appreciate
greatly his encouragement and guidance throughout my research and his effort in proof-reading several
of my papers and providing valuable insight to different research elements.
To my advisory committee members, I wish to express my sincere thanks and admired gratitude for
their valuable suggestions on my research proposal. In particular, I wish to thank Professor
Krishnaswamy Nandakumar for his valuable suggestions and Professor Ali Elkamel for his instruction
in courses related to numerical methods and optimization that were instrumental in shaping the
modeling work presented in this thesis.
Chau Mai Thi Quynh, Stephan Dumas and Lu Dong were very helpful in conducting the experiments
from which kinetic data has been extracted for the biodiesel simulation studies. Thank You for our
patience and hard work.
Dr. Behnam Goortani and Pieter Schmal deserve special thanks for helping me to unlock the
mysteries of gPROMS. My thanks to Judy Caron, Cathy Logan Dickie and Liz Bevan for help on
administrative matters and Dennis Herman and Ravindra Singh for help on technical problems.
Financial support from the Natural Sciences and Engineering Research Council of Canada (NSERC)
for this research is gratefully acknowledged. I would like to thank the Ontario Government and
University of Waterloo for a Trillium scholarship for Graduate Studies.
My stay in Waterloo was a unique opportunity and experience, which would not have been so joyful
without my friends in University and my hockey and baseball teams. And finally, thank you to my
family for your love, patience, support and encouragement.

vii
Dedication
This Thesis is dedicated to my Dad, Ashok Prasad who has been my role-model for hard work,
persistence and personal sacrifices, and who instilled in me the inspiration to set high goals and the
confidence to achieve them. Time and again, when I have needed help, he has given me his all. I might
have had some hardships but my hardships are nothing against the hardships that my father went
through in order to get me to where I started.

viii
Table of Contents
Examining Committee Membership ...................................................................................................... ii
AUTHOR'S DECLARATION .............................................................................................................. iii
Abstract .................................................................................................................................................. iv
Acknowledgements ................................................................................................................................ vi
Dedication ............................................................................................................................................ vii
List of Figures ........................................................................................................................................ xi
List of Tables ...................................................................................................................................... xiii
List of Abbreviations (in alphabetical order) ........................................................................................ xv
Chapter 1 Introduction ............................................................................................................................ 1
1.1 Catalytic Distillation ........................................................................................................................ 1
1.2 Applications of Catalytic Distillation .............................................................................................. 2
1.3 Background of Research and Thesis Goals ...................................................................................... 3
1.4 Olefin Oligomerization and the Isooctane Process .......................................................................... 5
1.4.1 Conventional Process for Isooctane Production and the scope for CD .......................................... 7
1.4.2 Contributions to the 3 phase NEQ Model developed (C4 Model) and Energy Studies ................. 9
1.5 Organization of the Thesis ............................................................................................................. 25
Chapter 2 Literature Review: Modeling of Catalytic Distillation ......................................................... 27
2.1 Stage-wise Models of Catalytic Distillation .................................................................................. 33
2.1.1 Equilibrium (EQ) Stage Models .................................................................................................. 33
2.1.2 Non-equilibrium Stage (NEQ) Models ........................................................................................ 39
2.2 Appropriate modeling depth for CD .............................................................................................. 50
2.2.1 EQ Models versus NEQ Models .................................................................................................. 51
2.2.2 Phase Equilibrium versus Chemical Equilibrium, Reaction in film/bulk .................................... 52
2.2.3 Pseudo-homogeneous Vs Heterogeneous Models ....................................................................... 54
2.3 Softwares available for CD modeling ............................................................................................ 55
2.4 Conclusions .................................................................................................................................... 56
Chapter 3 A distributed film model for fast reactions in a CD process ................................................ 58
3.1 Background .................................................................................................................................... 58
3.2 Model Overview and Equations ..................................................................................................... 59
3.3 Model results for the Isooctane process ......................................................................................... 72

ix
3.4 More pilot experiments simulated using the film model ................................................................ 81
3.5 Comparison between the film model and the C4 Model for the isooctane process ........................ 83
3.6 Conclusions .................................................................................................................................... 87
Chapter 4 Modeling of benzene hydrogenation and hydrogenation of acetone to methyl isobutyl
ketone in a Catalytic Distillation system using the Film Model ........................................................... 88
4.1 Hydrogenation of Benzene to Cyclohexane ................................................................................... 89
4.1.1 Background ................................................................................................................................. 89
4.1.2 Simulation of a CD process for hydrogenation of benzene to Cyclohexane ............................... 91
4.1.3 Results and Discussion ................................................................................................................ 97
4.1.4 Conclusions ............................................................................................................................... 105
4.2 Production of Methyl Isobutyl Ketone (MIBK) via the Aldol condensation of Acetone in a CD
process ................................................................................................................................................ 106
4.2.1 Background ............................................................................................................................... 106
4.2.2 Model architecture and implementation .................................................................................... 118
4.2.3 Film Model results for the MIBK process and comparison with the C4 model ........................ 123
4.2.4 Conclusions ............................................................................................................................... 133
Chapter 5 Biodiesel Production via Catalytic Distillation .................................................................. 134
5.1 Process Design and Modeling Studies: Catalytic Distillation for production of biodiesel from
soybean (vegetable) oil ....................................................................................................................... 137
5.1.1 Conventional Reactor Separation Configuration ....................................................................... 138
5.1.2 Catalytic Distillation Configuration .......................................................................................... 143
5.1.3 Comparisons (Cost and Energy) ................................................................................................ 147
5.1.4 Conclusions ............................................................................................................................... 153
5.2 Catalytic Distillation for production of biodiesel from waste cooking oil ................................... 154
5.2.1 Configuration A (Conventional Reactor plus Separation Process) ........................................... 159
5.2.2 Configuration B (Catalytic Distillation Process) ....................................................................... 164
5.2.3 Process Comparisons (Cost, Energy, Emissions and Waste Elimination) ................................ 168
5.2.4 Conclusions ............................................................................................................................... 176
Chapter 6 Conclusions and Recommendations .................................................................................. 177
6.1 Elucidation of green engineering aspects of Catalytic Distillation .............................................. 177
6.2 Film Model Application for CD modeling ................................................................................... 178
6.3 Catalytic Distillation for biodiesel process development ............................................................. 178

x
6.4 Recommendations and scope for future work .............................................................................. 179
Bibliography ....................................................................................................................................... 181
Appendix ............................................................................................................................................. 191
Appendix A : CD pilot plant at University of Waterloo ..................................................................... 191
Appendix B : Hatta Number Calculations for reaction systems ......................................................... 193

xi
List of Figures
Figure 1: Schematic of a Catalytic Distillation Unit – A salient example of green engineering ............ 1
Figure 2: Structural Diagram: 2, 2, 4-Trimethylpentane Isooctane (CH3)3CCH2CH (CH3)2……….. 7
Figure 3:Simplified Flowsheet for isooctane production from dimerization of isobutene and
hydrogenation ......................................................................................................................................... 8
Figure 4: 3-phase, Non-equilibrium Model (C4 Model) developed for the isooctane process ........... 10
Figure 5: Catalytic Distillation pilot plant at University of Waterl…………………………………....11
Figure 6: Architecture for the 3-phase, Non-equilibrium Model ........................................................ 12
Figure 7: Temperature profiles, experimental results vs. model predictions for the Isooctane CD
Process run 2 (Table 4) ......................................................................................................................... 18
Figure 8: Quantification of CD process merits for the isooctane process ............................................ 21
Figure 9: Heat Duty as a function of recycle – CD vs conventional process for the isooctane
process .................................................................................................................................................. 23
Figure 10: Cold utility requirements as a function of recycle - CD vs conventional process for the
isooctane process .................................................................................................................................. 24
Figure 11: Intricacies involved in modeling of Reactive Distillation ................................................... 28
Figure 12: Stage concept for distillation modeling (EQ stage) ............................................................ 29
Figure 13: Model for Transport phenomena in a homogeneous CD process ...................................... 30
Figure 14: Model for Transport phenomena in a heterogeneous CD process ..................................... 31
Figure 15: NEQ Stage model for homogeneous liquid-phase reaction…………………………….....40
Figure 16: Framework towards identifying the appropriate modeling depth for studying a CD process
.............................................................................................................................................................. 51
Figure 17: Schematic of a gas-liquid-solid catalytic reaction for hydrogenation of an organic
compound ............................................................................................................................................. 61
Figure 18: Film model : Motivation behind idea and moeling interpretation ...................................... 64
Figure 19: Distributed Film Model for hydrogenation: Reaction in L-S film on the catalyst surface . 66
Figure 20: Distributed Film Model for hydrogenation: Heat equation in the L-S film ........................ 67
Figure 21 : Control volume for mass balance via advection and diffusion .......................................... 69
Figure 22: Simulated temperature profile compared against the actual measured temperature (Film
Model) .................................................................................................................................................. 77
Figure 23: Film model predictions for the concentration profiles along the CD column ..................... 79

xii
Figure 24: Simulated Liquid Temperature Profile in the CD column .................................................. 80
Figure 25: Plots of the simulated liquid phase temperature profiles against experimental data. .......... 85
Figure 26: Benzene Hydrogenation to Cyclohexane ............................................................................ 89
Figure 27 : Schematics of benzene hydrogenation to cyclohexane proposed in literature .................. 92
Figure 28: CD model in gPROMS for hydrogenation of benzene………………………………..…..96
Figure 29: Model prediction for liquid temperature profile along the CD column ............................... 99
Figure 30: Model predictions for vapor composition for benzene, cyclohexane and hydrogen along
the CD column ................................................................................................................................... 100
Figure 31: Mass balance results and process parameters for the film model (Modeling of benzene
hydrogenation)……………………………………………………………………………………. 103
Figure 32: Schematic for the CD apparatus for MIBK synthesis from acetone at University of
Waterloo ............................................................................................................................................. 107
Figure 33: C4 Model Setup in gPROMS environment for the MIBK process .................................. 109
Figure 34: Chemical transformation of acetone to MIBK via aldol condensation and hydrogenation
........................................................................................................................................................... 111
Figure 35: Setup of the Film Model for the MIBK process .............................................................. 119
Figure 36: Film model mass balance results (gPROMS) for run 4 of the experiment CD005 .......... 123
Figure 37: Liquid Phase Molar composition (CD005 – Run 3) .......................................................... 125
Figure 38: Liquid Phase Temperature Profile (CD005 – Run 3)……………………………………126
Figure 39: Predictions for Liquid phase temperature profile (Film model versus the C4 Model) ...... 131
Figure 40: Schematic representation of TG trans-esterification (I) and FFA esterification for biodiesel
production (II) ..................................................................................................................................... 135
Figure 41: Biodiesel production from soybean oil: Conventional reactor separation flow sheet ...... 138
Figure 42: Biodiesel production from soybean oil: Catalytic Distillation flow sheet ......................... 146
Figure 43: Numerous advantages of the solid heteropolyacid catalyst HSiW for biodiesel production
from model yellow grease feed……………………………………………………………………...156
Figure 44: Configuration A (Conventional Reactor Separation Process)…………………………... 163
Figure 45: Configuration B (CD Process)…………………………………………………………...167

xiii
List of Tables
Table 1: Physical Properties of Isooctane............................................................................................... 7
Table 2: Operating variables, parameters and output variables in the 3-phase NEQ
model…….……………………………………………………………………………………………16
Table 3: Model validation results for mass balance of components for dimerization of
isobutene………………………………………………………………………………………………17
Table 4: Operating conditions and Model validation results for CD runs 3 and 4 - simultaneous
dimerization and hydrogenation: Isooctane Process ............................................................................ 17
Table 5: Pounds of CO2 produced by steam-electric generators for different fuels………………….20
Table 6: Comparison of energy requirements, monomer utilization and carbon dioxide emissions with
and without catalytic distillation: Model Predictions for the Isooctane Process .................................. 22
Table 7: Equilibrium Models Vs Non-equilibrium models for Catalytic Distillation .......................... 46
Table 8: Complexities associated with Modeling Approaches for Reaction and Separation in CD
Models .................................................................................................................................................. 50
Table 9: Sensitivity of the film model to varying film thickness for the L-S film (simulation tests for
CD 2-2 experimental runs) ................................................................................................................... 74
Table 10: Reboiler mass composition results: Film Model predictions versus experimental results ... 76
Table 11: Operating conditions in the film model for a total isobutene conversion and an isobutene
free reboiler product ............................................................................................................................. 78
Table 12: Reboiler mass composition results: Film Model predictions versus experimental results for
experiments CD2-5 and CD 2-6 (C8=Isooctene, C8A =Isooctane)…………………………………..82
Table 13: Comparisons of predictions for reboiler composition: Film Model versus the C4 Model ... 86
Table 14: Predicted Hydrogenation Rates: Film Model and the C4 Model ......................................... 86
Table 15: Physical Properties of the components at 1 atm and 25°C ................................................... 91
Table 16: Comparison of processes: Design A has a higher hydrogenation and energy efficiency ..... 93
Table 17: Conditions and results for a CD process for hydrogenation of benzene .............................. 94
Table 18: Input values for getting a near pure cyclohexane in the reboiler ......................................... 97
Table 19: Sensitivity of the film thickness towards cyclohexane productivity (Modeling of benzene
hydrogenation)……………………………………………………………………………………….104
Table 20: Arrhenius parameters employed in the MIBK model ........................................................ 112

xiv
Table 21: Process operating conditions and mass balance results for different steady states in the
experimental run CD005 .................................................................................................................... 114
Table 22: Modified C4 model predictions against data from different steady states in the experimental
run CD005 ......................................................................................................................................... 115
Table 23: Effect of internal reflux on the liquid molar flow rate in the CD model .......................... 121
Table 24: Sample model case study: Distribution of concentration in the L-S film .......................... 124
Table 25: Comparison of the predictions of C4 model and the film model towards experimental data
(CD005) .............................................................................................................................................. 130
Table 26: Sensitivity of the film model results for condenser and reboiler concentrations to the film
thickness. ............................................................................................................................................. 132
Table 27: Physical properties of the components at 1 atm and 25°C .................................................. 136
Table 28: Flow sheet for the reactor separation configuration (A) .................................................... 142
Table 29: Flow sheet for the catalytic distillation configuration (B) ................................................. 145
Table 30: Detailed cost analysis for optimum design and operating conditions for the reactor
separation configuration (Configuration A) ........................................................................................ 148
Table 31: Detailed cost analysis for optimum design and operating conditions for the catalytic
distillation configuration (Configuration B) ...................................................................................... 149
Table 32: Per gallon production cost of biodiesel for configurations A and B .................................. 150
Table 33: Arrhenius Parameters for the biodiesel reactions .............................................................. 156
Table 34: Operational Conditions for major process streams in the conventional reactor separation
configuration flowsheet (A) ............................................................................................................... 162
Table 35: Operational Conditions for major process streams in the Catalytic Distillation (CD)
configuration flowsheet (B) ............................................................................................................... 166
Table 36: Detailed cost analysis for optimum design and operating conditions for the reactor
separation configuration (Configuration A) ....................................................................................... 173
Table 37: Detailed cost analysis for optimum design and operating conditions for the Catalytic
Distillation Configuration (Configuration B) ..................................................................................... 174
Table 38: Per gallon production cost of biodiesel for configurations A, B and C…………………..175
xv
List of Abbreviations (in alphabetical order)
α : relative volatility
at : solid-liquid interfacial area
C : concentration
Cp: heat capacity
d = driving force for diffusion
dp: Diameter of catalyst particle
D : Diffusitivity coefficient
Da = Damkohler number
ε : porosity
eV : Multi-component mass transfer coefficient, vapor phase
eL : Multi-component mass transfer coefficient, liquid phase
eS : Multi-component mass transfer coefficient, solid phase
eVbinary : bi-component mass transfer coefficient, vapor phase
eLbinary : bi-component mass transfer coefficient, liquid phase
eSbinary
: bi-component mass transfer coefficient, solid phase
Ea = Activation Energy of the reaction
f = coefficient of proportionality
hV : vapor-phase heat transfer coefficient
hL: liquid-phase heat transfer coefficient
hV : vapor-phase heat transfer coefficient
Ha : Hatta’s Number
H0 = liquid holdup
i = subscript for component number
kav: Average mass transfer co-efficient
kf /k : Kinetic rate constant
kL : Mass transfer co-efficient
K: equilibrium constant
l : molar flow rate of liquid phase
Le: Lewis Number

xvi
: surface tension
η = absolute viscosity of the liquid
n: order of the reaction
NV : Vapor phase molar flux
NL: Liquid phase molar flux
NS : Solid phase molar flux
NC : number of components present in system
ρ = density of the liquid
P = Pressure
Q = heat of the reaction
rj : Molar rate of the reaction
R = universal gas constant
Re: Reynold’s Number
RR : Reflux ratio for the condenser
Rs = ratio of side-stream to inter-stage flow
Sc: Schmidt’s Number
t = film thickness
u = average velocity of species
μ: Viscosity
T = temperature
ʋ0 = velocity of withdrawal
ʋ : molar flow rate of vapor phase
VB : Vapor boilup ratio
Wt : total (cross sectional) mass flow rate of liquid
x, y : liquid and vapor mole fraction
φ : fugacity coefficient

1
Chapter 1
Introduction
1.1 Catalytic Distillation
Green engineering is the design, commercialization, and use of processes and products in a way that
reduces pollution, promotes sustainability, and minimizes risk to human health and the environment without
sacrificing economic viability and efficiency. It embraces the concept that decisions to protect human health
and the environment can have the greatest impact and cost-effectiveness when applied early, in the design
and development phase of a process or product. In 2003, Paul Anastas and Julie Zimmerman[1] outlined
twelve key principles entailing what would make a greener chemical process or product. These principles
convey that any process that leads to an increased atomic or energy efficiency, reduction of greenhouse gases
or waste or processing steps or introduces an inherently safer chemistry or utilization of renewable
feedstocks would come under the umbrella of green chemistry and green engineering.
Catalytic Distillation (CD) is a salient example of green engineering. CD is a multifunctional hybrid
reactor technology that simultaneously performs chemical reaction and multistage distillation. It comprises
a distillation column (Figure 1) filled with a catalytically active packing [2, 3]. The column could either be
a packed column or a tray column, within which solid catalyst is immobilized within one or more reactive
zones within the column. It hence combines chemical reaction and product refinement in a single unit
operation, leading to significant savings in capital and energy costs.
Figure 1: Schematic of a Catalytic Distillation Unit – A salient example of green engineering
A+B A+B C+DC+DA+B A+B C+DC+D
Strippingsection
ReactiveSection
RectifyingSection
Feed B
Feed A
Overheadproducts
Bottomsproducts
A+B A+B C+DC+DA+B A+B C+DC+D
Strippingsection
ReactiveSection
RectifyingSection
Feed B
Feed A
Overheadproducts
Bottomsproducts

2
The ability of CD to simultaneously carry out chemical reaction and product purification within a single
stage operation significantly reduces operating and capital expenditures due to process intensification [2].
The continuous removal of product from the reactive section via the distillation action can lead to increased
product yield, smaller catalyst requirements for the same conversion and increased productivity, particularly
for reactions that are equilibrium limited. Other potential advantages of CD include azeotropic separations,
improved temperature control and enhanced energy integration due to conduction of an exothermic chemical
reaction in a boiling medium[4-7]. CD is hence a salient example of green engineering, resulting in numerous
process intensification benefits.
There are certain design constraints associated with CD that limit its applicability. First, the reactants and
products must have significantly different boiling points in order for distillation to be a practical separation
method. Moreover, the relative volatilities between reactants and products should be sufficient to ensure a
high concentration of reactants and low concentration of products in the reaction zone. Second, there are an
insufficient number of degrees of freedom to independently specify the reaction temperature and pressure.
Consequently, CD processes will be constrained to those processes which can be carried out at the bubble
point of the reactant mixture at relatively low to moderate pressures resulting in operating conditions that
may not be optimal. Third, it must be practical and desirable to carry out the reaction in the low interaction
regime of trickle flow. Finally, since distillation is energy intensive and expensive, CD is not suitable for
reactions with long residence time requirements, in which case a reactor-separator arrangement would be
more economical. A systematic framework for the feasibility and technical evaluation of catalytic distillation
processes has been discussed in work by Shah et.al[8] where the applicability is decided on an approach
based on dimensionless numbers such as Damkohler and Hatta numbers, as well as the kinetic,
thermodynamic and mass transfer limits. The authors have suggested that CD is viable in conditions when
either the reaction equilibrium constant or the Damkohler number (chemical reaction timescale (reaction
rate) to the transport phenomena rate) occurring in a system is high.
1.2 Applications of Catalytic Distillation
Catalytic distillation has an exceptional position in the intensification of chemical processes because of
the broad application scope of distillation as a separation method. Therefore, the potential to use synergy
effects by combining the distillation and chemical reaction steps into a single apparatus was recognized early
on. In particular, the first patents in this field, which were for the application of homogeneously catalyzed
esterification, date back to the 1920s. However, it took over 60 years from the first patent in the 1920s until
advances in modeling and simulation and impressive experimental examples such as the Eastman-Kodak
process for manufacturing high-purity methyl acetate generated renewed interest in the reactive distillation
technology.

3
The reactive distillation column in the Eastman-Kodak process has become the prime example of the
application of reactive distillation. It should be noted that the term “catalytic distillation” is reserved for
those processes involving a heterogeneous catalyst while “reactive distillation” (RD) is usually reserved for
those processes involving a homogeneous catalyst. However, some use the term “reactive distillation” as a
general term encompassing both processes. Consequently, interest in the design and operation of reactive
distillation processes has grown enormously over the past two decades. For example, 1979 publications and
278 US patents were published between 2000 and 2011.
Current research in the field of CD is very diverse and extensive, and covers various facets of chemical
engineering in fundamental as well as applied research. The group of industrial technologies, in which
catalytic distillation has already been implemented or is offered for commercialization, has expanded in the
last few decades and been summarized in several reviews [4-7]. Possible applications of CD include
alkylation, amination, carbonylation, chlorination, dehydration and hydration, dimerization, esterification
and transesterification, etherification, hydrogenation and dehydrogenation, hydrolysis, metathesis and
disproportionation, polymerization and the synthesis of carbonates. Work by Harmsen [5] has identified the
major business drivers for CD and enlisted the major commercial applications, operation experiences,
column design, technology providers and design methods for the process. Review by Hiwale et al.[7]
comprehensively particularizes recent applications of CD and novel CD configurations housing multiple
reactions as well reports cases of failure. Lutze et al. [6] in his review focuses specifically on patents for
application of heterogeneous CD systems.
1.3 Background of Research and Thesis Goals
Our research group at University of Waterloo has been carrying out CD research including process
development and modeling for a number of chemical processes. Two CD processes (production of isooctane
from isobutene[9], aldol condensation and subsequent hydrogenation of acetone to form methyl isobutyl
ketone (MIBK)[10]) have been developed using our in-house CD pilot plant for process intensification of
these systems and hydrogenation was found to proceed at a much lower hydrogenation pressure than those
carried out in a batch reactor. Details about the pilot plant apparatus at University of Waterloo have been
presented in Appendix A. A three phase non-equilibrium model (referred to as the “C4 model”) to study
these processes on multi-scales was also developed in our laboratory and model predictions were in good
agreement with the experimental CD data for the production of isooctane from isobutene. However, the
three phase non-equilibrium model predictions were found to not be in agreement with the experimental data
for the MIBK system.

4
The main objective of the thesis is to understand why hydrogenation reactions apparently require a lower
hydrogen pressure in CD processes than in a conventional reactor and to develop a robust model for
describing hydrogenation reactions in a CD process .Another objective is to apply catalytic distillation for
biodiesel production by proposing chemical process design, that is finding equipment sizes, configurations
and operating conditions that will allow for the economical, safe and environmental responsible conversion
of specific feed stream(s) into specific product(s).
The reaction systems investigated include the synthesis of isooctane [9] from isobutene and the aldol
condensation of acetone to yield mesityl oxide (MO) and methyl isobutyl ketone (MIBK)[10]. The overall
aim of this thesis is to advance catalytic distillation as a process intensification technique for these reactions
by finding out candidate reactions for application of CD and presenting chemical process design that is
finding equipment sizes, configurations and operating conditions that will allow for the economical, safe and
environmental responsible conversion of specific feed stream(s) into specific product(s). The potential
benefits of CD processes are generally taxed by significant complexities in process development and design.
The potential benefits of CD processes are generally taxed by significant complexities in process
development and design. For optimizing process design or operation over a wide design space and at low
cost, a high-fidelity model of the plant or process that is predictive over the entire range of interest is
essential. Such a model could be used to optimize design or operation, exploring a wide design space rapidly
and at low cost, and applying optimization techniques to determine answers directly rather than by trial and
error simulation. One of the principal aims of this thesis is to develop a robust, predictive model to accurately
describe the relevant phenomena in the CD process to an appropriate level of chemical engineering first
principles representation. This model would be validated using experimental data obtained from CD pilot
plant experiments and would be utilized for simulating CD pilot plant performance for different kinetic
systems. Using this model, CD performance under different conditions will be simulated for various
reactions and based on the simulation results, the effects of main operating variables will be evaluated, the
influence of the kinetic rate and mass transfer resistance will be illustrated and the optimized operating
conditions will be outlined.
Validated models contribute greatly towards analyzing the system and understanding the major process
variables and the underlying phenomena influencing the process productivity. A main goal of this research
is to utilize process modeling to capture knowledge about the process and find answers related to real process
observations. Hydrogenation, for example, is a reaction of great industrial importance. Hydrogenation at lower
pressures, in particular is an advantage observed to be brought by CD in operations. A scientific study elucidating
the phenomena behind this occurrence is absent in the literature. This research aims to identify and present the
fundamental reasons behind this phenomenon, backed by model equations, observed experimental results and

5
process modeling results. An improved understanding of low pressure hydrogenation in CD configurations
would lead to process intensification for numerous reactions and culminate in enormous merits in terms of costs
and safety for the chemical process industry. Hydrogenation at lower pressures is a notable benefit towards
profitability and safety of operations and understanding CD’s applicability towards low pressure hydrogenation
would help in process intensification of numerous hydrogenation reactions of industrial importance.
Exploring the candidate reactions for CD, itself is an area that needs considerable attention to expand the
domain of CD processes and this thesis pursues this goal. CD has recently expanded as a hybrid green technology
towards intensification of biodiesel processes and this thesis contributes in this field by presenting the design
tasks of identification of opportunities, screening of feasibility and design of units.
The final goal is this work is to quantify the merits brought by CD into individual chemical systems by design
equipment configuration to suit the product range and process technologies involved, taking environmental and
economic aspects into account and doing waste reduction and emission cuts and cost calculations. A case study
on savings in energy and carbon dioxide emissions has been presented for the isooctane process system in this
regard.
1.4 Olefin Oligomerization and the Isooctane Process
In order to develop a model for CD, an experimental program is essential to obtain basic data for reaction kinetics
and mass transfer. The reaction system studied in this regard that provided the experimental basis towards the
initial modeling developments is the olefin oligomerization reaction of isobutene to form isooctane and
subsequent hydrogenation to isooctane. Oligomerization is a chemical process that links monomeric compounds
(e.g., alkenes, amino acids, nucleotides, or monosaccharides) to form dimers, trimers, tetramers, or longer chain
molecules (oligomers).
The phase out of MTBE (methyl-tert-butyl ethanol) in North America has increased the demand for middle
distillates (kerosene and diesel) in comparison to gasoline fractions. Implementation of the latest European fuel
specifications and adoption of cleaner and more stringent fuel quality specifications worldwide have necessitated
efforts towards production of greater quantities of high octane, gasoline blending components that do not contain
aromatics, benzene, olefins and sulphur[11-14]. Also, as there are efforts to achieve more uniformity in new
gasoline engines worldwide, there is a general decline in the market for low octane gasoline thus, requiring more
components to be upgraded for high quality fuel. Recent refinery technologies have hence been directed at
producing high octane gasoline-blending components that are essential in raising the compliance of motor
gasolines with quality specifications and projected quantity demand [12, 15].
In regards to recent oil refining developments, oligomerization of alkenes has resurfaced as a very promising
technology for converting light olefinic fractions into aromatic free higher value gasoline fuel and middle

6
distillates[11, 12, 16, 17]. Oligomerization has significant advantages over other conventional solutions
(alkylation) as it has a greater flexibility from the aspect of product composition – it is possible to produce olefins
corresponding to different boiling point ranges (gasoline, JET, diesel gas oil depending on the grade of
oligomerization), which can be converted to paraffins after hydrogenation [12, 16, 18]. Oligomerizing light olefins
results in increased refinery revenues as conversion of light olefins into gasoline blends results in increased
gasoline sales[17]. Oligomerization of alkenes is also a key and extensively studied area of Fischer-Tropsch
refining technologies, considering the large amount of alkenes in synthetic crude [19]. Olefin Oligomerization
will hence be of significant importance in the near future in oil refining technologies.
The oligomerization of olefins (isobutene to isooctane) meets the design criteria of CD because the products
(isooctane C-8) have a significant volatility difference that makes separation by distillation favorable (Properties
listed in Table 1). Secondly, the exothermicity of the oligomerization and hydrogenation reactions favors CD
since the energy liberated can be efficiently converted in situ to drive the distillation process and enhance energy
integration. Thirdly, the constant removal of oligomerization products in a CD column should shift the
equilibrium toward the products[20], preventing production of higher oligomers and hence higher selectivity
towards isooctene could be achieved. Subsequent in-situ hydrogenation would directly result in a paraffinic
stream (isooctane) without the need of any recycling or further downstream separation. Thus, CD hence becomes
a very favorable option for this process.
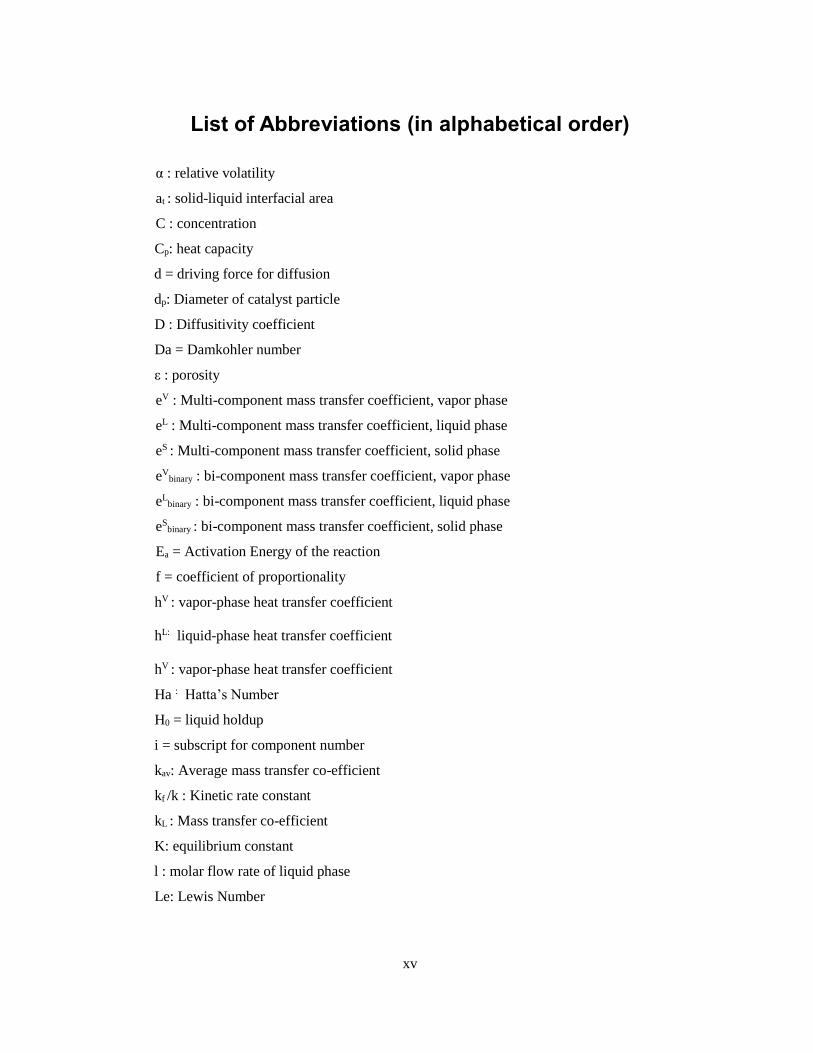
2,2,4-Trimethylpentane, also known as isooctane, is an organic compound with the formula
(CH3)3CCH2CH(CH3)2. A colorless, odorless liquid at room temperature, isooctane is one of several isomers of
octane (C8H18) [21]. The physical properties of isooctane are listed in Table 1. Isooctane is an example of a
branched chain hydrocarbon, and is a five carbon chain with three methyl groups at various points in the chain
(Figure 2).
7
Figure 2: Structural Diagram: 2, 2, 4-Trimethylpentane Isooctane (CH3)3CCH2CH (CH3)2
Table 1: Physical Properties of Isooctane [21]
Isooctane is of heightened importance to the petroleum industry since it holds the standard 100 point on the
octane rating scale (the zero point is n-heptane). The ability to burn smoothly or the quality of the petrol is
indicated by its octane number. A poor fuel has a zero octane number, whereas a good fuel has an octane
number of 100. Isooctane is hence an important component of gasoline, frequently used in relatively large
proportions to increase the knock resistance of the fuel.
1.4.1 Conventional Process for Isooctane Production and the scope for CD
The conventional process for isooctane manufacture in industry involves dimerization of isobutene in a
fixed bed reactor (with a supported acid catalyst), followed by hydrogenation in a continuous stirred tank
reactor on precious metal catalysts such as platinum, palladium, nickel etc. [22-24].
Molecular Weight 114.23 gmol-1
Melting Point -105°C
Boiling Point 95°C
Density 0.692 gcm-3

8
168
1
84HCHC 2
k
Dimerization
1882168HCHHC 2
k
Hydrogenation
There are various isooctane processes commercially available varying in terms of reaction conditions and
catalyst type namely ( CDIsoether, InAlk, Selectopol, SP-Isoether, NExOCTANE etc) [22, 25, 26]. A
detailed process flowhseet diagram for a conventional process is shown in Figure 3.
Figure 3 – Simplified Flowsheet for isooctane production from dimerization of isobutene and
hydrogenation
The conventional scheme for isooctane production has a number of clear disadvantages. In particular, the
process is inherently inefficient and extremely energy intensive. The dimerization reaction is highly
exothermic with a heat of the reaction (∆H = -82.9 KJ/mole [27, 28]). Most conventional processes for
isooctane production run at lower conversions (20% to 60 % - conversions differ according to the catalyst
and reactor design) to prevent catalyst sintering due to the highly exothermic reaction and secondly to
improve product selectivity and avoid the formation of higher oligomers that may result from the increased
concentration of the dimer in the reactor [28-30]. Conversions higher than 60 % are often not feasible and
rare in industry because of these constraints. Maintenance of the reactor temperature involves a tremendous
amount of cold utilities to buffer the exothermicity of the reaction. The products of the reaction are produced

9
in low yield, necessitating further purification of the product streams by distillation which leads to a
significant amount of material recycle. Since distillation is an extremely energy intensive process having a
low thermodynamic efficiency in range 10-20 % [31, 32]`, distillation steps would significantly add to the
operating costs. Furthermore, the hydrogenation reaction to isooctane is also highly exothermic (estimated
around -109.55 KJ/mole by running ASPEN model simulations) which adds to cold utility requirements for
the hydrogenation reactor. The isooctane process hence presents an excellent opportunity for application of
CD technology and goals were set in this Thesis, to present the efficacy of CD and its merits, in terms of
energy savings and reduction of greenhouse gas emissions, for the production of isooctane via modeling
studies.
1.4.2 Contributions to the 3 phase NEQ Model developed (C4 Model) and Energy Studies
The dimerization of isobutene to isooctene and its subquent hydrogenation to isooctane had been studied in a CD
pilot plant in our laboratory[9]. Details of the pilot plant is shown in Appendix A. For a catalyst system consisting
of NiSO4 on γ- Al2O3 for dimerization and Pd/γ- Al2O3 for hydrogenation, a selectivity of 85 wt % towards the
product was observed. The first modeling efforts were directed towards design and optimization of the CD process
to obtain product at desired productivity, concentration and selectivity. To achieve this goal, a rigorous steady
state model was essential. Such a model would be invaluable in a priori evaluations of how a CD column will
behave on different process conditions and kinetic data.
A three-phase, rate-based non-equilibrium steady state model (will be referred to as the C4 model) was developed
in our research group for depicting the CD column performance[33] . The first couple of semesters in my research
were devoted towards learning the integrity of the model architecture and its implementation in gPROMS,
understanding the equations for mass and heat transfer and chemical kinetics and generating and imterpreting
results. This involvement was instrumental in inculcating an understanding of model development and gPROMS
skills which proved fruitful in subsequent contributions (the development of the film model) of this Thesis.
gPROMS is equation oriented software developed by Process Systems Enterprise (London, UK) for modeling,
simulation, optimization, and experimental design studies. Since a rate-based, non-equilibrium approach was
utilized for modeling the CD process, gPROMS was preferred as it offers the added advantage of coding rate
expressions involving mass transfer coefficients and interfacial areas directly into the interface in the exact form
in a Matlab like syntax but with much faster execution time. There is no need to program details of numerical
strategies; just the complete set of equations are needed in any order which are solved by gPROMS solvers.
Furthermore, there are parameter estimation and optimization programs available.
The C4 model was significant as it focused on the mass transfer that took place between the catalyst and the
liquid; such models are rare in the literature. The model was extremely useful as it permitted the use of kinetic

10
data obtained in the absence of external mass transfer. The model was hence applicable in predicting catalyst
activity and reaction selectivity in a CD process with kinetic results obtained from batch experiments by
incorporating equations for mass transfer suited for the distillation packing used. The C4 model if validated for
the CD performance for a particular catalyst and distillation packing, would then be able to predict the CD
performance for various reaction systems for the same catalyst and distillation packing and hence be immensely
useful in studying the effect of various process parameters and optimal design. In the initial stages of this Thesis,
efforts were constituted towards tuning the parameters of the model and to answer the scientific or engineering
questions that were of interest.
Figure 4 shows the three phase non-equilibrium model. The vapor and the liquid bulk phases are assumed to be
perfectly mixed with the vapor – liquid equilibrium taking place only at the vapor- liquid interface. The reaction
rate and the reaction heat on the catalyst are assumed to be equal to the mass transfer rate and heat transfer rate
respectively between liquid and solid phases. The solid catalyst is assumed to be completely wetted.
Figure 4: 3-phase, Non-equilibrium Model (C4 Model) developed for the isooctane process
The C4 model for the CD unit included a condenser, a boiler, two reaction zones (hydrogenation and
dimerization) and three non-reacting zones connected in series. The schematic of the actual CD pilot plant
is shown in Figure 5. The architecture of the model is shown in Figure 6. Each zone of the column was
assumed to be composed of non-equilibrium stages, while models for the condenser and reboiler were

11
assumed to be at thermodynamic equilibrium[34].The model included: 1) Material balances for each phase
2) Vapor-Liquid Equilibrium relationships 3) Rates of mass and energy transfer between phases 4) Energy
balance equations. The material balance and energy balance equations are written for each phase on each
stage. Only at the vapor-liquid interface, does equilibrium exists.
Figure 5: Catalytic Distillation pilot plant at Professor Ng and Rempel’s research laboratory,
University of Waterloo

12
Feed: Isobutene
Feed: Hydrogen
Partial Condenser
Reboiler
Rectifying Zone (Tray 1)
Stripping
Zone (Tray 1)
Dimerization Zone (Tray 2)
Hydrogenation Zone (Tray 2)
Isooctane
Separation Zone (Tray 1)
T1: Tray (Type) 1: No Reaction
T2: Tray (Type) 2: Reaction
Figure 6: Architecture for the 3-phase, Non-equilibrium Model
13
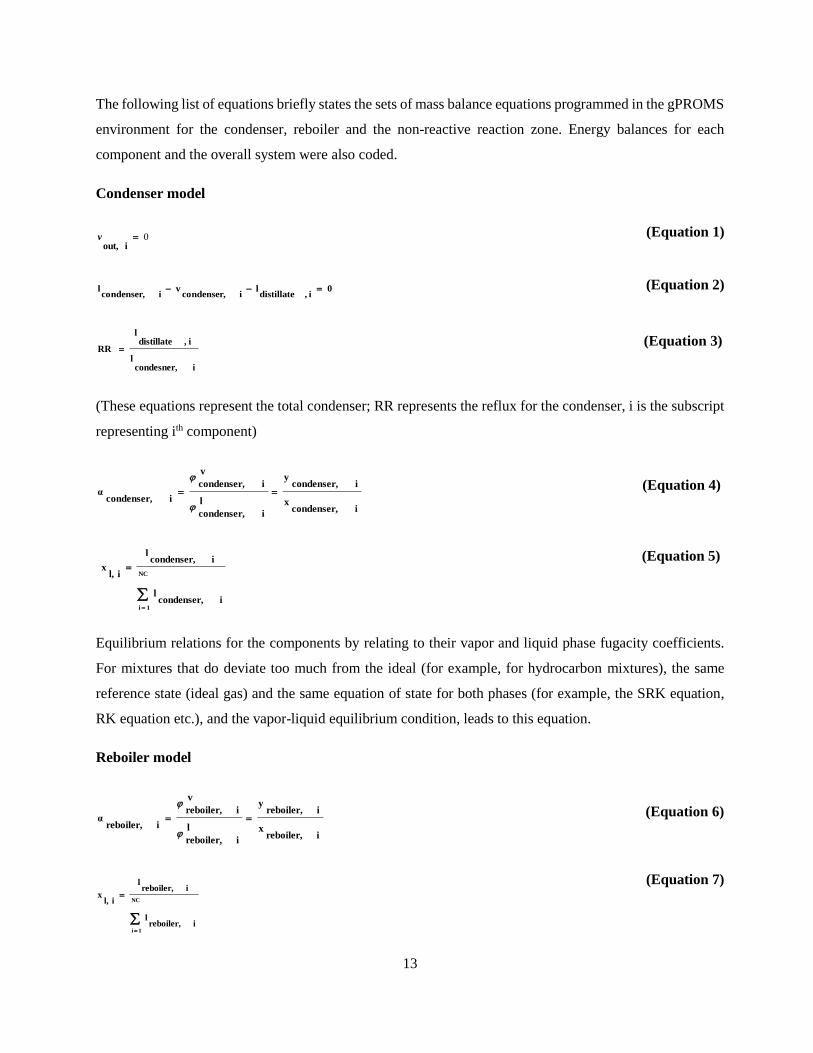
The following list of equations briefly states the sets of mass balance equations programmed in the gPROMS
environment for the condenser, reboiler and the non-reactive reaction zone. Energy balances for each
component and the overall system were also coded.
Condenser model
0iout,
v (Equation 1)
0i,distillate
licondenser,
vicondenser,
l (Equation 2)
icondesner,l
i,distillatel
RR (Equation 3)
(These equations represent the total condenser; RR represents the reflux for the condenser, i is the subscript
representing ith component)
icondenser,x
icondenser,y
l
icondenser,
v
icondenser,
icondenser,α
(Equation 4)
NC
1iicondenser,
l
icondenser,l
il,x
(Equation 5)
Equilibrium relations for the components by relating to their vapor and liquid phase fugacity coefficients.
For mixtures that do deviate too much from the ideal (for example, for hydrocarbon mixtures), the same
reference state (ideal gas) and the same equation of state for both phases (for example, the SRK equation,
RK equation etc.), and the vapor-liquid equilibrium condition, leads to this equation.
Reboiler model
ireboiler,x
ireboiler,y
l
ireboiler,
v
ireboiler,
ireboiler,α
(Equation 6)
NC
1iireboiler,
l
ireboiler,l
il,x
(Equation 7)

14
0lvliout,product ireboiler,ireboiler, (Equation 8)
i out,product
i reboiler,
l
vVB (Equation 9)
(The vapor boil-up ratio is a model parameter for achieving differing product concentrations at varying
condenser and reboiler duties)
Separation (Non-reactive) Zones
eq
ij,
eq
ij,
l
ij,
v
ij,
ij,
x
y
α
(Equation 10)
(j is the subscript representing stage number)
NC
1iij,
ij,
ij,
v
vy
NC
1iij,
ij,
ij,
l
lx (Equation 11)
V
ij,
S
,i1,-jij,NNll
ij (Equation 12)
(Liquid coming down from the top stage is enriched by diffusion from the gas phase and is depleted by mass
transfer to the catalyst surface and pore diffusion within catalyst particles; NS represents the mass transfer
from liquid to solid, NG represents the mass transfer from gas to liquid)
)yy(eNij,
eq
ij,
V
ij,
V
ij, (Equation 13)
)x(xeNij,
eq
ij,
L
ij,
L
ij, (Equation 14)
)x(-xeNij,
S
ij,
S
ij,
S
ij, (Equation 15)
Mass and energy are transferred across the vapor-liquid interface at a rate which depends on the extent to
which the phases are not in equilibrium. The rate of mass transfer across the solid catalyst equals the rate
of the reaction. For the separation zones, rate of reaction R is set to 0)
ij ,
S
ij,rN (Equation 16)

15
Transport properties model
The binary mass transfer coefficients for the liquid L
binarye and vapor
V
binarye films for the random packing
in the non-reaction zones are estimated using the empirical correlations developed by [35]. These co-
relations listed in equations 17-19 are based on the assumption that the wetted surface on the packing pieces
is identical with the gas-liquid interface.
(Equation 17)
L
1/3
L
L
4.0
p
0.5-
L
2/3
Leffective
L
binary)
g(adScReArea0051.0e (Equation 18)
The binary mass transfer coefficient for the solid-liquid film is calculated by the correlations (listed in
Equation 19) developed in our catalytic distillation modeling group by Zheng (2004):
1.160.34
L
0.48
v
2/3
lbinaryl
l
lt
S
binary)
η1
η(ReRe)
ρD
μ(Wa0.02075e
(Equation 19)
The length scale for the Reynolds number calculations in equations 17-19 is the packing particle diameter.
The multicomponent mass transfer coefficients are assumed to be the average of the binary mass transfer
coefficients. The heat transfer coefficients for transport equations for heat balance are calculated using the
Chilton Colburn analogy and are expressed in Equations 20-21. [36].
2/3VV
pm
V
av
V
)(LeCkh (Equation 20)
1/2LL
pm
L
av
L
)(LeCkh (Equation 21)
Component selection and physical properties model
In gPROMS modeling, Multiflash software is used to set the equation of state models and calculate the
physical properties for the pure components and their mixtures in the vapor, liquid, and solid phases.
Multiflash is a sophisticated state-of the-art software product providing physical and thermodynamic
properties, with multiphase and multi-component equilibrium calculations, for a wide range of substances.
)RT
PDa(adScReArea2e
binary
v
t2
p
1/3
v
0.7
veffective
V
binary

16
The component thermophysical properties are selected from the DIPPR databank. To achieve this, a
Multiflash file is constructed in which the DIPPR databank is called and all six components (isobutene,
isopentane, isooctene, dodecene, hydrogen, and isooctane) are selected and the physical property models are
adjusted. Multiflash, which uses the Hayduk-Minhas method for liquid phase diffusion coefficients [37] and
Fuller method for gaseous phase diffusion coefficients[38] ,was directly used for calculation of the diffusion
coefficients in the vapor and liquid phases.
The column is assumed to be composed of 75 non-equilibrium slices for which mass and energy balance
equations are coded for each component in three phases. The total number of equations and corresponding
unknown variables in the model are 24,263. The model calculates implicitly, temperature, pressure, mole
fractions, and molar fluxes for vapor, liquid, and solid phases in each stage in the condenser and reboiler.
Increasing the number of stages caused no observable change in the results; therefore, numerical
convergence, independent from the number of slices, was achieved. The model comprised of 26,438
equations and runs in around 42 seconds on a 4 GB RAM.
Table 2: Operating Variables, Parameters and Output variables in the 3-phase NEQ model
Operating Variables Parameters Output Variables
Feed Rates, Reflux ratio of the
condenser, Vapor boilup ratio,
Column Pressure
Number of NEQ stages,
catalyst particle diameter, kinetic
parameters
Concentrations and flow rates in
the reboiler and condenser,
temperature profile along the
column
Validation of the C4 Model
The gPROMS model was validated against experimental data extracted from the pilot scale CD column in our
laboratory [9, 33] for CD runs on isobutene oligomerization and hydrogenation. Two cases of experimental
runs; case one - dimerization isobutene to isooctane (Runs 1 and 2 listed in Table 3), and case two -
simultaneous dimerization and hydrogenation of isobutene to isooctane (Runs 3 and 4 listed in Table 4), were
used to validate the model. These runs are actual CD experiments. Results for model validation for runs 3 and
4 are also listed in Table 4.

17
Table 3: Model validation results for mass balance of components for dimerization of isobutene
C4 = isobutene, C5 =isopentane, C8=octene, C12=dodecane : Isooctane Process
RUN
P
(psig)
Qb
(W)
Feed rate
(g/h)
Experimental Results ( wt %) Model Predictions ( wt%)
C4 C5 C8 C12 C4 C5 C8 C12
1
60
350
C4: 58.3
C5: 63.25
0
52.5
35.1
12.4
0
51.9
36
12.1
2
80
300
C4: 58.3
C5: 63.25
0
50
32
18
0
52.1
36
11.9
Table 4: Operating conditions and C4 Model validation results for CD runs 3 and 4 - simultaneous
dimerization and hydrogenation: Isooctane Process
RUN P (psig) Qb (W) Dim. Feed rate (g/h) Hydrogen Feed (L/h, STP)
3 125 300 C4: 49.95 , C5: 69.74 8.77
4 125 300 C4: 62.85 , C5: 44.64 9.49
Experimental results
gPROMS model
C4
Conv.
(Wt%)
Dimer.
Select.
(%)
C8
Conv.
(%)
Ni
activity
(g/g/h)
Pd
activity
(g/g/h)
C4
Conv.
(Wt%)
Dimer.
Select.
(%)
C8
Conv.
(%)
Ni
activity
(g/g/h)
Pd
activity
(g/g/h)
Run
3
88.4 87.3 98.3 0.54 0.17
74.4 77.2 87.9 0.63 0.15
Run
4
98.3 82.8 83 0.76 0.19
92.2 76.1 85.2 0.77 0.18

18
As amply demonstrated by the mass balance results in Tables 3 and 4, there is a good agreement between
the model predictions and the CD experimental runs. The predictions for isobutene conversion, Nickel and
Palladium activity, are within 15% error, in agreement with the experimental results. Expressions for
calculation of the catalytic activity of Nickel and palladium metal catalysts are detailed in an earlier research
produced in our laboratory[9]. Therefore, the C4 model results are validated at different operating conditions
of feed rate; H2 feed rate, pressure, and reboiler duty. The error in gPROMS model predictions for
composition of isobutene (C4), isopentane (C5) and isooctene (C4) is less than 6%.
The next step to affirm model’s validation is to investigate the accuracy of the thermal predictions of the
model. Figure 7 compares the temperature profiles of the experimental results with those predicted by model.
The temperature at the condenser starts at 330 K and increases to 347 K above the reaction zone. Then it
increases suddenly (because of reaction heat) to 370 K and then gradually increases to 395 K above the
reboiler. The model predicts well and shows the same trend in temperature in the non-reaction zones and in
the reaction zone and the maximum error in temperature profiles is 10 K ( error <5%) which is acceptable.
The temperature gap between the model predictions and the real experimental runs can be attributed to heat
losses from the column due to non-uniformity in the insulation packing that is not considered in the model.
Figure 7: Temperature profiles, experimental results vs. C4 model predictions for the Isooctane CD
Process run 2 (Table 4)

19
The C4 model validated for predictions of isooctane data was used to quantify the CD process merits in
terms of more efficient energy usage, monomer utilization and greenhouse gas (GHG) emission reductions.
The research, in particular, aimed to calculate the savings of energy and materials obtained when a reactor
and distillation column were replaced with a CD. This was achieved by modeling detailed process flow
sheets for the production of isooctane, with and without CD. Detailed information regarding the comparative
studies conducted were published in a research article in Industrial & Engineering Chemistry Research
journal[39]. The conventional industrial flow sheet (configuration A) in Figure 8 composed of a dimerization
reactor, distillation column, and a hydrogenation reactor is simulated using Aspen Plus. The intensified
process flow sheet comprising a CD column, for the dimerization, hydrogenation, and separation
(configuration B) in Figure 8, is modeled using our non-equilibrium, three-phase gPROMS model. Results
from both models are compared at the same product purity (0.36 mole percent of isooctane) on the basis of
per kg of product and a comparison of the utility requirements and monomer utilization is performed. The
savings in energy requirements and the elimination of monomer waste are then quantified to relate the
effectiveness of CD as compared to the conventional process.
In an actual refinery operation, the recycle ratio is often varied depending on the product requirements in the
conventional process. So the simulation for configuration A in Figure 8 was run under varying recycle ratios
and the results were recorded for comparison with the CD model ( configuration B in Figure 8) The CD
model was run at total recycle ( total condenser) corresponding to our actual CD experimental runs. All cases
for configuration A were set so as to produce isooctane at around 36 percent molar fraction of the
hydrogenated product (iso-octane) in the final product stream. The CD model described in the next section
also produces a 36 percent molar fraction of iso-octane in the reboiler so a comparison of the energy
requirements per kg of product is justified. Table 6 lists the total energy consumption per kilogram of
isooctane produced with and without catalytic distillation at different recycle rates and different conversions.
Since comparisons are made per unit mass of product (per kilogram of isooctane) at the same purity (36 %
isooctane) so varying flow rates between the two configurations ceases to be a factor. The conventional
process (configuration A) is modeled at varying conversions and reflux ratios whereas the CD process
(configuration B) is modeled at total reflux. Results demonstrate that at all conversions and recycle rates,
the CD process needs significantly less cold utilities (up to 7 times savings in cold utilities). This is expected
since there is massive cooling water consumption in a conventional reactor separation process to cool the
reactor and protect the catalyst and products from the exothermic reaction heat before they enter the
separation units. In a CD process, the in situ heat generated from the exothermic reactions is dissipated from
the reaction zones towards separation of products so that minimal cooling energy is required. In the case of
hot utility requirements, CD outperforms conventional configurations by all conversion and recycles

20
scenarios except at very high isobutene conversions of 90 percent and low recycle rates. 90 percent
conversions of isobutene are not feasible in industrial reactor configurations and conversions in isobutene
dimerization processes are typically kept low in range of 20-60 % to increase the life-time of the catalyst
and enhance selectivity of dimer by reducing the formation of the primary byproducts, trimers and higher
oligomers. Results hence establish CD to be a significant reducer of hot and cold utilities for the isobutene
dimerization process. Moreover, Table 6 also depicts that CD leads to significantly better utilization of the
monomer isobutene and a significant reduction in carbon-dioxide emissions, as an added benefit for the
isooctane process. The reductions in carbon dioxide emissions were evaluated via emission factors provided
by the U.S. Energy Information Administration (EIA)[40], that compute the amount of CO2 produced per
kilowatt hour (kWh) for specific fuels and specific types of generators. These indicators are listed in Table
5. Figures 9 and 10 relate the significant energy integration CD brings into the iso-octane production process
via reduction in utility requirements. This research was published in the Industrial & Engineering Chemistry
Research journal[39].
Table 5: Pounds of CO2 produced by steam-electric generators for different fuels [40]
Fuel Lbs of CO2 per Million
Btu
Heat Rate (Btu per
kWh)
Lbs CO2 per kWh
Coal (Bituminous) 205 10,107 2.08
Coal (Sub-Bituminous) 212 10,107 2.16
Coal (Lignite) 215 10,107 2.18
Natural Gas 117.080 10,416 1.22
Distillate Oil 161.386 10,416 1.68
Residual Oil 173.906 10,416 1.81

21
Figure 8: Quantification of CD process merits for the isooctane process
CWIN
MIXED OUT
CWOUT
FEEDIN
RECYCLE
DISTL
PRODUCT
EXIT
HYDROGEN
OCTANE
REACT
MIXER
DISTL
B1
B2
MIXED
FEEDIN
RECYCLE
DISTL
OCTANE
EXIT
MIXER
DISTL
B1
HYDROGEN
Quantification of CD Process Merits for Isooctane
Process
Reduced Operating and capital costs.
Reduced Energy Requirements.
Reduced waste streams
Increased efficiency
Configuration A
Conventional Process Scheme
(Reactor + Distillation)
Configuration B
CD Process

22
Table 6: Comparison of energy requirements, monomer utilization and carbon dioxide emissions with
and without catalytic distillation: Model Predictions for the Isooctane Process
25 percent
Recycle Total Cooling
(KW/kg product)
Total Heating
(KW/kg product)
Non-reacted isobutene
(kg/kg product)
CO2
produced
(kg/kg
product)
0% -5295 5815 0.75 0.895
25% -6450 7174 0.5625 1.105
50% -8201 8123 0.375 1.251
75% -9334 8869 0.175 1.366
100% -11110 10719 0 1.651
50 percent
Recycle Total Cooling
(KW/kg product)
Total Heating
(KW/kg product)
Non-reacted isobutene
(kg/kg product)
CO2
produced
(kg/kg
product) 0% -3795 2480 0.5 0.382
25% -4319 2478 0.375 0.381
50% -4988 3027 0.25 0.466
75% -5304 3420 0.125 0.527
100% -5605 3787 0 0.583
90 percent
Recycle Total Cooling
(KW/kg product)
Total Heating
(KW/kg product)
Non-reacted isobutene
(kg/kg product)
CO2
produced
(kg/kg
product) 0% -2552 944 0.1 0.145
25% -2765 1142 0.075 0.176
50% -4363 2210 0.05 0.340
75% -4970 2614 0.025 0.402
100% -5095 3221 0 0.496
CD 100%
Recycle
-1520 1660 0.00004 0.256

23
Figure 9: Heat Duty as a function of recycle – CD vs conventional process for the isooctane process
0
2000
4000
6000
8000
10000
12000
0% 20% 40% 60% 80% 100% 120%
He
at D
uty
in K
W/k
g o
f is
o-o
ctan
e
Recycle of the unconverted isobutene and inerts
Heat Duty at 90 percent conversion - conventional configuration
Heat Duty at 50 percent conversion - conventional configuration
Heat Duty at 25 percent conversion - conventional configuration
CD Results ( total conversion and total reflux)

24
Figure 10: Cold utility requirements as a function of recycle - CD vs conventional process for the
isooctane process
-16000
-14000
-12000
-10000
-8000
-6000
-4000
-2000
0
0% 20% 40% 60% 80% 100% 120%C
old
Uti
lity
in K
W/k
g o
f is
o-o
ctan
e
Recycle of the unconverted isobutene and inerts
Cold Utility at 90 percent conversion - conventional configuration
Cold Utility at 50 percent conversion - conventional configuration
Cold Utility at 25 percent conversion - conventional configuration
CD Results ( total conversion and total reflux)

25
1.5 Organization of the Thesis
With a perspective to introduce CD into process intensification of reaction systems of interest, a
research methodology has been followed which comprises detailed process design, process modeling
and simulation, analysis of results and validation of simulated results with the experimental outcomes.
The results of the above research are arranged in sections as outlined below:
Chapter 1: This chapter introduces the Catalytic Distillation technology, the advantages of this
integrative technique and its current prominent industrial applications and future directions. It also
discusses the motivation for research by presenting the research background and outlining the research
objectives.
Chapter 2: The available literature on steady state modeling of CD is reviewed. The objective served
is to take cues in improving the C4 model. The chapter also covers and discusses different engineering
packages and software environments that have been employed for mathematical modeling and
simulation of CD systems.
Chapter 3: This chapter introduces the concept of a solid-liquid film into a steady state film model
for the isooctane process where the mathematical principle is that the reaction in the film would aid the
mass transfer leading to improved process performance. The model focused on demonstrating the role
of mass transfer and kinetic limitations on the process performance and pointed reasons to lower
hydrogenation partial pressure observed in various CD systems. The chapter also entailed comparison
of the film model results to the C4 model results.
Chapter 4: Studies conducted to test for the utility and effectiveness of the film model towards
modeling other kinetic systems involving hydrogenation are presented in this chapter. The goal is to
verify if the model can be applied to depict performance of other CD systems involving other chemical
components and different phase and kinetic behavior. The systems studied are hydrogenation of
benzene to cyclohexane and production of methyl-isobutyl ketone (MIBK) from acetone.

Introduction
26
Chapter 5: In this chapter, the feasibility of CD for the continuous production of biodiesel is
investigated. Production of biodiesel from different feedstocks is studied on catalytic systems designed
in our laboratory. The objective is to reduce capital and investment cost of production process and a
detailed process design is presented for implementing a new green process for biodiesel production.
Chapter 6: In this chapter, the thesis is concluded by summarizing the main content of the
dissertation and discussing novel contributions and findings. The chapter also presents suggestions as
to how the research presented in this thesis could be extended in the future, with a focus on directions
that seem potentially most fruitful.
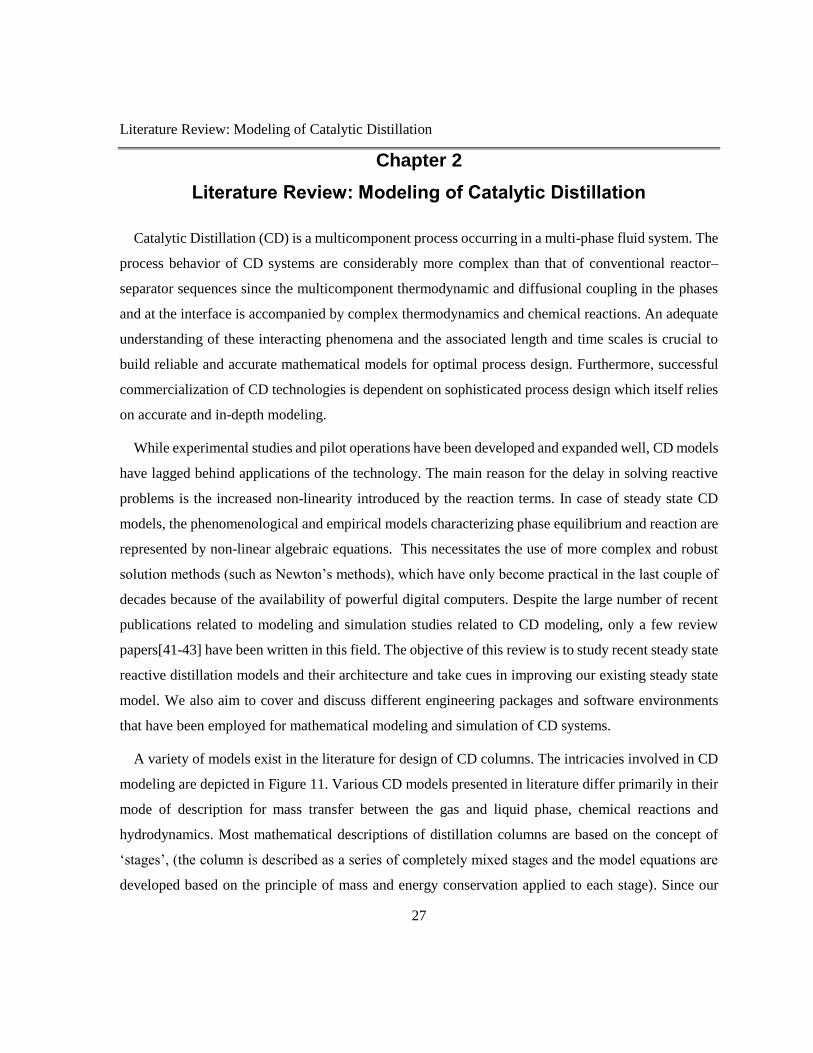
Literature Review: Modeling of Catalytic Distillation
27
Chapter 2
Literature Review: Modeling of Catalytic Distillation
Catalytic Distillation (CD) is a multicomponent process occurring in a multi-phase fluid system. The
process behavior of CD systems are considerably more complex than that of conventional reactor–
separator sequences since the multicomponent thermodynamic and diffusional coupling in the phases
and at the interface is accompanied by complex thermodynamics and chemical reactions. An adequate
understanding of these interacting phenomena and the associated length and time scales is crucial to
build reliable and accurate mathematical models for optimal process design. Furthermore, successful
commercialization of CD technologies is dependent on sophisticated process design which itself relies
on accurate and in-depth modeling.
While experimental studies and pilot operations have been developed and expanded well, CD models
have lagged behind applications of the technology. The main reason for the delay in solving reactive
problems is the increased non-linearity introduced by the reaction terms. In case of steady state CD
models, the phenomenological and empirical models characterizing phase equilibrium and reaction are
represented by non-linear algebraic equations. This necessitates the use of more complex and robust
solution methods (such as Newton’s methods), which have only become practical in the last couple of
decades because of the availability of powerful digital computers. Despite the large number of recent
publications related to modeling and simulation studies related to CD modeling, only a few review
papers[41-43] have been written in this field. The objective of this review is to study recent steady state
reactive distillation models and their architecture and take cues in improving our existing steady state
model. We also aim to cover and discuss different engineering packages and software environments
that have been employed for mathematical modeling and simulation of CD systems.
A variety of models exist in the literature for design of CD columns. The intricacies involved in CD
modeling are depicted in Figure 11. Various CD models presented in literature differ primarily in their
mode of description for mass transfer between the gas and liquid phase, chemical reactions and
hydrodynamics. Most mathematical descriptions of distillation columns are based on the concept of
‘stages’, (the column is described as a series of completely mixed stages and the model equations are
developed based on the principle of mass and energy conservation applied to each stage). Since our
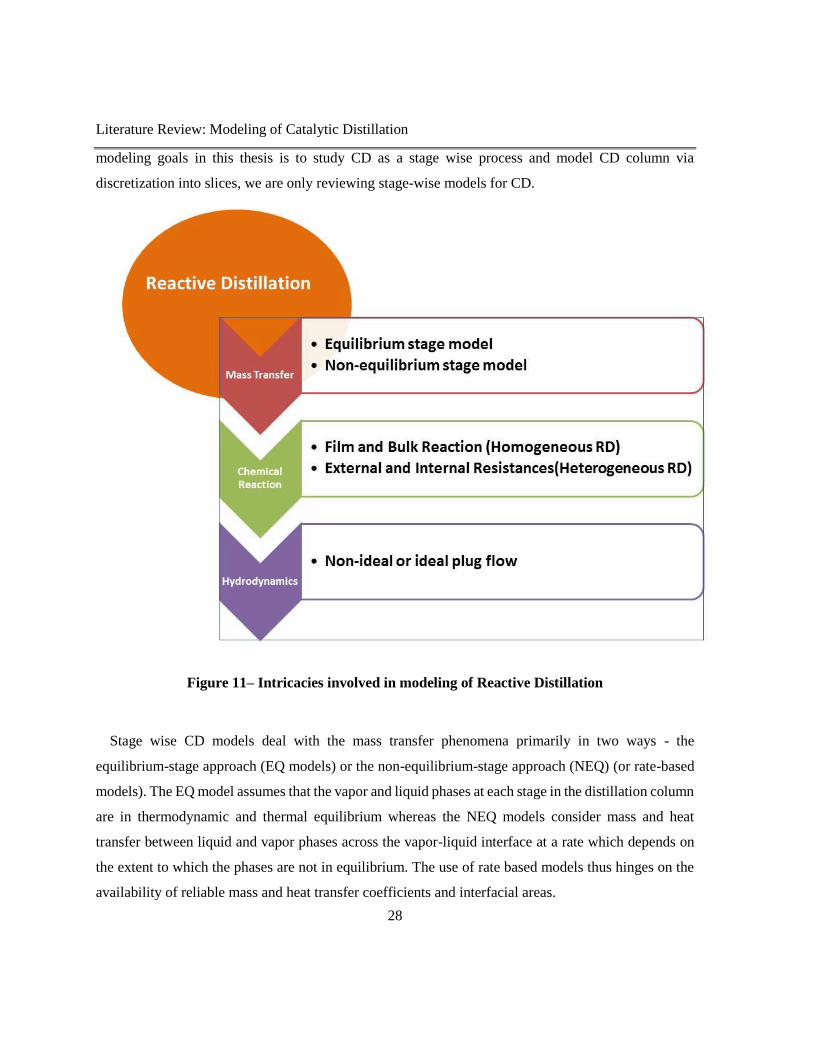
Literature Review: Modeling of Catalytic Distillation
28
modeling goals in this thesis is to study CD as a stage wise process and model CD column via
discretization into slices, we are only reviewing stage-wise models for CD.
Figure 11– Intricacies involved in modeling of Reactive Distillation
Stage wise CD models deal with the mass transfer phenomena primarily in two ways - the
equilibrium-stage approach (EQ models) or the non-equilibrium-stage approach (NEQ) (or rate-based
models). The EQ model assumes that the vapor and liquid phases at each stage in the distillation column
are in thermodynamic and thermal equilibrium whereas the NEQ models consider mass and heat
transfer between liquid and vapor phases across the vapor-liquid interface at a rate which depends on
the extent to which the phases are not in equilibrium. The use of rate based models thus hinges on the
availability of reliable mass and heat transfer coefficients and interfacial areas.
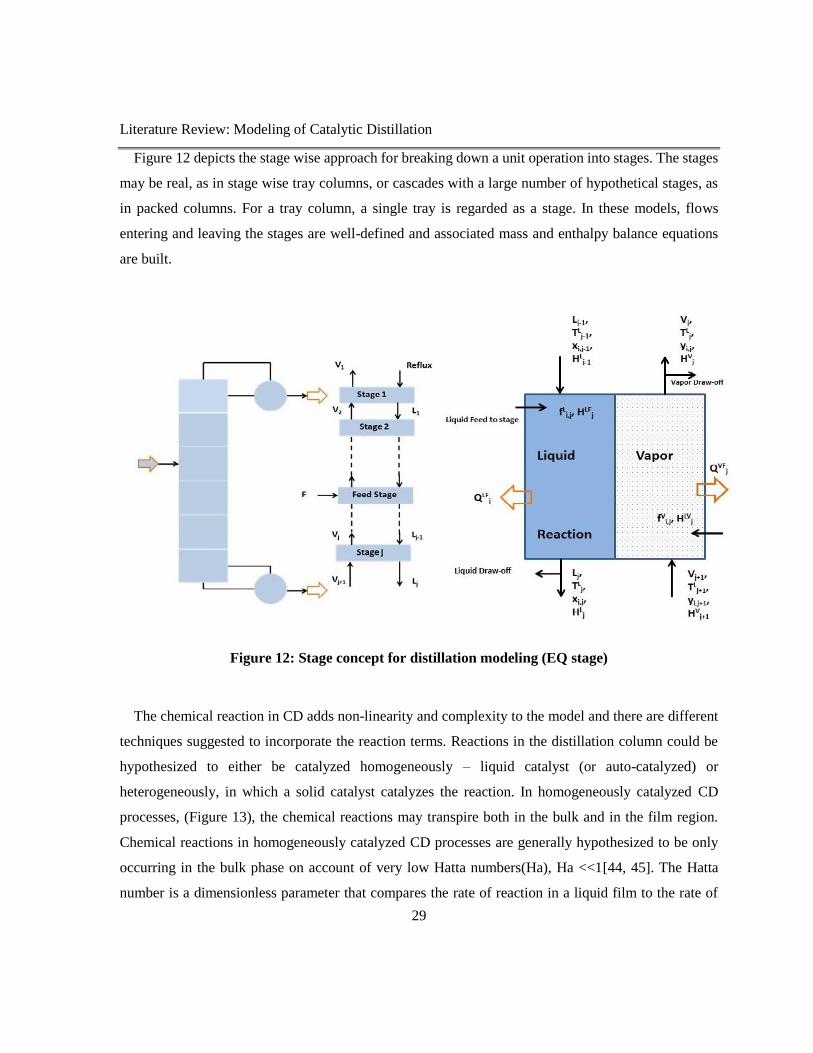
Literature Review: Modeling of Catalytic Distillation
29
Figure 12 depicts the stage wise approach for breaking down a unit operation into stages. The stages
may be real, as in stage wise tray columns, or cascades with a large number of hypothetical stages, as
in packed columns. For a tray column, a single tray is regarded as a stage. In these models, flows
entering and leaving the stages are well-defined and associated mass and enthalpy balance equations
are built.
Figure 12: Stage concept for distillation modeling (EQ stage)
The chemical reaction in CD adds non-linearity and complexity to the model and there are different
techniques suggested to incorporate the reaction terms. Reactions in the distillation column could be
hypothesized to either be catalyzed homogeneously – liquid catalyst (or auto-catalyzed) or
heterogeneously, in which a solid catalyst catalyzes the reaction. In homogeneously catalyzed CD
processes, (Figure 13), the chemical reactions may transpire both in the bulk and in the film region.
Chemical reactions in homogeneously catalyzed CD processes are generally hypothesized to be only
occurring in the bulk phase on account of very low Hatta numbers(Ha), Ha <<1[44, 45]. The Hatta
number is a dimensionless parameter that compares the rate of reaction in a liquid film to the rate of

Literature Review: Modeling of Catalytic Distillation
30
diffusion through the film. For an nth order reaction involving two reactants, the Hatta number [8, 46]
is defined as:
2
Lk
AD
BC
1n
AC
fk
1n
2
Ha
(Equation 22)
where n is the reaction order, kf is the rate constant for the forward reaction (1/s), CA is the
concentration (mol/m3) of the gaseous reactant, CB is the liquid phase reactant, DA is the diffusivity
(m2/s) of the gaseous reactant and kL is the liquid phase mass transfer coefficient (m/s).
Figure 13: Model for Transport phenomena in a homogeneous CD process

Literature Review: Modeling of Catalytic Distillation
31
A hallmark advantage of CD technology is that it provides an optimal configuration of the reaction
and separation zones in a CD column preventing costly liquid catalyst recovery operations. Due to the
presence of the heterogeneous catalyst, a third solid phase and an additional interface is present in the
system and different models go to different depths of complexity to describe the phenomena at the
liquid-solid interface(Figure 14). The complex CD heterogeneous models entail intrinsic kinetics and
the calculation of internal and external mass transfer resistances. Some modelers, based on the
assumption that the catalyst surface is totally exposed to the liquid bulk, lump the surface reaction and
internal diffusion into an overall surface reaction, forming the base for pseudo homogeneous
models[47, 48]. For fast chemical reactions, a chemical equilibrium approximation is valid whether it
is homogeneously or heterogeneously catalyzed.
Figure 14: Model for Transport phenomena in a heterogeneous CD process

Literature Review: Modeling of Catalytic Distillation
32
With respect to hydrodynamics, while most of the CD models assume plug flow patterns for the
vapor and liquid phase, detailed models would require complex portrayals of axial dispersion, liquid
holdup and pressure drop. Intricate CD models depicting non-ideal flow behavior of the liquid phase
have been proposed by numerous researchers. As highlighted in Figure 11, there are different ways to
model CD with different permutations of varied mass transfer, reaction kinetics and hydrodynamics
correlations. However, in general, all these combinations are primarily categorized as equilibrium or
non-equilibrium models, depending on how the mass transfer between the vapor and liquid phase is
described. Following the same convention in this work, we enlist recent inroads in these model
categories and then discuss their empirical and computational representation.
The accuracy of the simulation results is dependent on the applied model parameters. As complex
models are more detailed, they also require more model parameters. Consequently, the highest
modelling depth may not necessarily be the most suitable choice to the modeler on account of the
inaccessibility of all required model parameters for a complex model, when a simpler model could
adequately represent the phenomena with some justified simplifications. Consequently, the possible
costs for the determination of the missing parameters must be considered in the determination of the
optimal modelling depth. The appropriate modeling depth for CD models is discussed in Section 2.2.

33
2.1 Stage-wise Models of Catalytic Distillation
Most mathematical descriptions of distillation columns are based on the idea of ‘stages’; the column
is described as a series of completely mixed stages and the model equations are developed based on the
principle of mass and energy conservation applied to each stage. Figure 12 depicts the stage wise
approach for breaking down a unit operation into stages. The stages may be real, as in stage wise tray
columns, or cascades with a large number of hypothetical stages, as in packed columns. For a tray
column, a single tray is regarded as a stage. In these models, flows entering and leaving the stages are
well-defined and associated mass and enthalpy balance equations are built.
2.1.1 Equilibrium (EQ) Stage Models
Conceptually, ‘Equilibrium stage’ or ‘theoretical plate’ models are the simplest stage-wise models. The
first models for distillation columns were developed using the EQ approach; EQ models are often
credited for introducing computing to chemical engineering and chemical engineers to computers.
Since the first publication in 1893, numerous advancements have since been made towards EQ model
development, application and solution [49]. The major assumptions made in the equilibrium model are
as follows:
- The vapor and liquid streams leaving each stage are in thermodynamic equilibrium
- The vapor and liquid phases are both uniformly mixed
- The vapor stream leaving the stage carries no liquid with it ( No entrainment or axial back
mixing)
The equations that model equilibrium stages are known as the MESH equations. MESH is an acronym
referring to the different types of equations that are used in the model: M stands for material balances
(conservation of mass), E stands for equilibrium relationships (to express the assumption that the
streams leaving the stage are in equilibrium with each other), S stands for summation equations (mole
fractions sum to unity), H stands for heat or enthalpy balances (conservation of energy).

Literature Review: Modeling of Catalytic Distillation
34
MESH Equations:
Mass and Material Balance (M)
r
1m
c
1i
jjm,mi,j
V
jj
V
jj1j1jεRν)Lr(1)Vr(1FLV0
(Equation 23)
r
1m
c
1i
jjm,mi,ji,j
V
jji,j
V
jji,j1ji,1j1ji,1jεRνx)Lr(1y)Vr(1zFxLyV0
(Equation 24)
Equation 24 is the material balance for individual phases, summation of these material balances
yield the net total material balance form in Equation 22.
j
V
jV
j
V
Sr
(Equation 25)
j
L
jL
j
L
Sr (Equation 26)
In Equations 25 and 26, j
r is the ratio of side stream flow to interstage flow, mi,
ν represents the
stoichiometric coefficients of component i in reaction m and jε represents the reaction volume. The

Literature Review: Modeling of Catalytic Distillation
35
total reaction volume on stage j is obtained from the column internals specifications and appropriate
hydrodynamic correlations.
Phase Equilibrium Relationships (E)
ji,ji,ji,xKy (Equation 27)
The equilibrium constant, ji,
K being a complex function itself.
)T,P,y,(xKKjjji,ji,ji,ji,
(Equation 28)
Summation Equations (S)
The sum of the mole fractions on each stage is equal to unity.
1x
c
1m
ji,
(Equation 29)
1y
c
1m
ji,
(Equation 30)
Heat/Enthalpy Balance (H)
j
L
jj
L
j
V
jj
V
j
F
jj
L
1j1j
V
1j1jQH)Lr(1H)Vr(1HFHLHV0
(Equation 31)
Equation 31 represents the total energy balance for an equilibrium stage where H represents the
enthalpy for the appropriate phase and Q (heat of reaction) is the heat rejected from each stage. These
equations have been well-listed in books [44, 49, 50] and several papers [51, 52].
The EQ model for distillation processes is ubiquitous with computer-aided design and simulation of
various multi-component multistage separation processes and commercial simulation software based
on the EQ approach. However, it is a well-known fact that the liquid and vapor phases leaving trays in

Literature Review: Modeling of Catalytic Distillation
36
an actual distillation column are not in equilibrium. The separation actually achieved depends on the
rates of mass transfer across the vapor-liquid interface at rates which depend on the extent to which the
vapor and liquid streams are not in equilibrium with each other. To address this fundamental flaw in
the equilibrium model and to characterize the deviation from ideality, chemical engineers have
primarily adopted two approaches: the concept of ‘efficiency’ of a tray or plate and the ‘Height
Equivalent to a Theoretical Plate’ (HETP) for packings [41, 53]. When using a stage efficiency, it is
assumed that the change in vapor composition on a real tray is a certain fraction of that obtained in an
equilibrium stage. This concept works fairly well for binary separations; the two components there have
equal efficiencies. Also the efficiencies are often fairly constant along a column, and therefore an
efficiency is a useful way of summarizing practical experience. There are many different definitions of
stage efficiency proposed for distillation column modeling and design (overall column efficiency,
Murphree stage efficiency, Murphee point efficiency, Hausen and vaporization efficiencies; their
definition and methods of calculation are well-reviewed in a text by Sinnott[54]. The Murphee stage
efficiency is predominantly used in EQ stage simulations:
iE
*
i
iEiLMV
i
yy
yyE
(Equation 32), where iL
y is the average composition of the vapor leaving
the tray, iE
y is the composition of the vapor entering the tray and *
yi
is composition of the vapor in
equilibrium with the liquid leaving the tray.
For packed columns, an analogous HETP approach (height equivalent to a theoretical plate) is
employed. The composition of the liquid at a certain height in the real column is considered and it is
assumed that further up in the column, a vapor in thermodynamic equilibrium with the liquid is located.
This height difference between the two points is the HETP. The behavior of HETPS in multicomponent
mixtures is closely related to the behavior of stage efficiencies.
The factors that affect distillation efficiencies can be structural (flow patterns, tray types, outlet weirs,
down comers, and tray spacing), functional factors (flow regimes, pressure drop, liquid entrainment,
liquid weeping and channeling, flooding, capacity and turndown ratio, and eddy diffusivity) or system
and physical properties such as surface tension, liquid and vapor density, diffusion coefficients,

Literature Review: Modeling of Catalytic Distillation
37
concentration, viscosity, relative volatility, pressure, and temperature. Efficiencies in reactive
distillation (factors, prediction methods, comparisons between different methods) have been well-
reviewed in the PhD dissertation of Klemola[53]. Most of the prediction methods are invariably
restricted to binary systems; in multicomponent systems; the heavier components usually have lower
efficiencies than the lighter components. While guide rules and prediction methods[53-55] for
multicomponent distillation efficiencies have been proposed, to this date, an accurate, reliable method
is still absent in the literature and most comparative studies have still yielded laboratory or pilot-plant
data as best approximations for multicomponent system efficiencies[53].
Particularly in a CD model, there are several drawbacks to employing efficiencies and HETPs in a
computer simulation based on the EQ stage model. The presence of a chemical reaction in a reactive
distillation process significantly influences the component efficiencies, particularly in multicomponent
mixtures, where efficiencies now vary both from component to component as well as from tray to tray
and could often be unbounded in the range [-∞,∞][53]. These complications limit applicability of stage
efficiencies in CD models. To date, there are no fundamentally sound methods for estimating either
efficiencies or HETPS in CD operations which has instead, motivated efforts to study the interaction
between mass transfer and chemical reactions considered in the NEQ models[41, 53].
Before the advent of powerful computers, initial steady state EQ models for CD were solved by
analytical methods or via graphical approaches [41, 56]. Several classes of computer-based algorithms
(tearing methods, Newton’s methods, relaxation methods, homotopy-continuation methods,
minimization methods, RADFRAC methods and combination of these) have since been developed for
solving EQ stage model equations. Homotopy continuation methods exploit the algebraic structure to
count the number of roots and to construct a start system. By continuation methods the known solutions
of the start system are extended to the desired solutions of the target system. These methods have been
well reviewed [41, 57]. Settling on a generic algorithm applicable to all CD processes is difficult
because the reaction system could be modeled in different ways which would influence the calculations
in varied ways.
The current CD modeling sphere is dominated by NEQ models at the expense of conventional EQ stage
models. There have been little algorithmic developments to existing solution methods, since with
today’s availability of powerful simulation solvers, MESH equations in different forms are easily

Literature Review: Modeling of Catalytic Distillation
38
solved and the chemical engineers’ motivation today is towards improving the reliability of the CD
models (by incorporating improved relations for mass transfer in NEQ models) rather than saving
milliseconds of solution time via new algorithms. Researchers hold more potential for mass transfer
models rather than better efficiency prediction models. Efficiencies, in multicomponent systems, will
be puzzling and much more difficult to predict, regardless of their prediction methods. Nevertheless,
in this research, we will discuss recent CD EQ modeling developments that have added to the state-of-
the-art EQ CD models.
Solution techniques to the EQ stage models for CD problems are extremely sensitive to initial estimates
with solutions becoming notoriously difficult or even impossible in the absence of good estimates; the
non-linear algebraic CD equations could also entail multiple steady states. There is certainly a need for
investigations on detailed methodology towards producing good initial guesses. In recent CD modeling
studies for 2-pentene metathesis and MTBE synthesis [58], Steffen and Da Silva have presented a
sequential algorithm with a methodology towards defining the initial estimates. In particular, the
researchers have tried to address the good initial estimate constraints of Newton’s method by employing
Broyden’s method to solve the equations for modeling the chemical reactions. The algorithm was coded
in FORTRAN and compared against other simulation case studies for the same reaction.
A new proposed algorithm proposed by Baharev and Neumaier[59] overcomes these numerical
difficulties by a new re-parameterization technique that is now no longer reliant on good initial
estimates. This algorithm instead depends on a specific but fairly general block-sparsity pattern. This
algorithm was successfully applied to a numerically challenging CD column with seven steady-states.
Liquid phase splitting in reactive distillations is often encountered (in non-ideal systems such as
heterogeneous azeotropic systems) and the unknown number of phases in these process models
introduces a number of complexities. Recently, an “inside-out” method algorithm for the steady-state
simulation of multistage reactive distillation processes with equilibrium chemical reactions in such
cases has been presented by Khaledi and Bishnoi[60]. The models incorporate a phase stability equation
originally proposed by Gupta and Bishnoi[61], to examine occurrence of multiple liquid states on the
CD stages. The algorithm was coded in C++ and verified against experimental data with good
agreement.

Literature Review: Modeling of Catalytic Distillation
39
Most of the recent steady state EQ modeling studies are carried out using commercial packages.
Equilibrium models are loaded in most commercial packages available such as Aspen, HYSYS,
ChemSep, Pro II and SpeedUp. The inside-out algorithm known as the RADFRAC model first
described by Venkataraman et al [62] is a pioneering technique to handle CD models. The RADRAC
module is now implemented in the well-known chemical engineering simulation environment Aspen
and most recent researchers use the RADRAC model to simulate CD processes. Today’s literature is
replete with a number of RADFRAC EQ models applied towards preliminary design calculations[63-
67]and evaluation of CD process cost[68-70], energy requirements[39, 68-70] and other process
parameters for quantification and comparative studies.
2.1.2 Non-equilibrium Stage (NEQ) Models
As discussed in the preceding sections, the ubiquitous equilibrium stage concept in distillation modeling
is actually fundamentally flawed and actual distillation column design and scale-up from equilibrium
stages incorporating confusing concepts such as component-efficiencies could be difficult and unreliable
for most systems. Specifically in cases of highly nonideal, polar and reactive systems, prediction and use
of efficiencies is particularly diffcult. In such mixtures, mass transfer and non equilibrium conditions often
limits the separation[71]. It is of crucial importance to describe the interfacial mass and energy transfer in
multiphase systems actually encountered in real tray and packed columns.
“Non-Equilibrium” (NEQ) or “Rate-Based” models treat the distillation operation as a mass-transfer
governed process and apply a transport phenomena approach for predicting mass transfer rates (Figure 15).
Here, the bulk vapour and liquid phases are not at equilibrium with each other, mass and energy are
transferred across the vapor-liquid interface at a rate which depends on the extent to which the phases are
not in equilibrium. Only at the vapor-liquid interface, does equilibrium exist.
There are numerous advantages of using the NEQ model over the EQ model. Apart from eliminating the
need for efficiencies and HETPs, the operating strategies for the influence of chemical reactions on
separations are accounted for in a better way. NEQ models are more accurate and provide a more realistic
representation of the actual distillation operations elminating over-design or under-design of processes
thereby reducing the capital and operating costs.

Literature Review: Modeling of Catalytic Distillation
40
Figure 15: NEQ Stage model for homogeneous liquid-phase reaction
The rate-based model equations are commonly abbreviated as MERQ equations ( where the mass transfer
rates are added to the MESH equations)[71-73]. Another common acronym for the rate-based model equations
are the MERSHQ equations[74, 75]:
The MERQ acronym stands for:
M : Material balances for each component – in the bulk vapour, bulk liquid and across the interface.
E : Energy balance - each component in the bulk vapour, bulk liquid and accross the interface.
R : Rate equations for mass transfer of components from the interface to the bulk vapour and
from bulk liquid to the interface and energy transfer rate equation from the liquid to the
vapour.
E : Equilibrium equation at the vapor-liquid interface.
For the MERSHQ acronym,

Literature Review: Modeling of Catalytic Distillation
41
• M represents material balances
• E represents energy balances
• R represents mass- and heat-transfer rate equations
• S represents summation equations
• H represents hydraulic equations for pressure drop
• Q represents equilibrium equations
Material Balance (M) for the components
For a homogeneous CD system, the component molar balance for the liquid phase becomes :
0εRνNfxLxL
r
1m
c
1i
jjm,mi,
L
ji,
L
ji,1ji,1jji,j
(Equation 33)
L
ji,N is the molar flux at the vapor-liquid interface, that may be expressed as :
)x-(xkcNI
i
I
i
L
i
L
i
L
ji, (Equation 34)
Energy Balances (E)
The enthalphy balances for vapor and liquid phases could be written as :
0QEHFHVHVV
j
V
j
VF
j
V
j
V
1j1j
V
jj
(Equation 35)
0QEHFHLHLL
j
L
j
LF
j
L
j
L
1j1j
L
jj
(Equation 36)
The interphase energy transfer rates could be written as a summation of conductive and convective
contributions. For the liquid phase,
L
ji,
L
ji,
c
1i
L
L
j
L
jHN
η
TahE
(Equation 37)

Literature Review: Modeling of Catalytic Distillation
42
whereL
jh is the heat transfer coefficient in the liquid-phase. The conductive contributions are
neglected in many modeling studies, resulting in liquids being superheated and vapor phases being
subcooled.
Summation Equations (S) at the vapor liquid interface
1x
c
1m
I
ji,
(Equation 38)
1y
c
1m
I
ji,
(Equation 39)
Hydralulic Equations (H)
0)p(-p-p1-j1-jj
(Equation 40)
In the NEQ model, the pressure drop across stages is usually considered. The pressure drop over a stage
is considered to be a function of the stage flows, the physcial properties and the hardware design.
Equilibrium Equations (Q)
I
ji,ji,
I
ji,Ky x (Equation 41)
Distillation is essentially a mass transfer operation. Various models have been presented in the literature
to describe the mass transfer mechanism between phases, namely, the film model[76, 77], the
penetration model/surface renewal model[78-80], the film-penetration model[81] etc. The film model
postulates that a stationary film or two stationary films exist at the interface and the mass is transported
only by steady molecular diffusion across the film with a firstpower dependence of the transfer rate on
the diffusivity. The penetration model modifies the film postulate by assuming eddies are constantly
replacing the fluid elements at the interface via unsteady molecular diffusion. The pentration model
predicts a square root dependence on the diffusivity. An improved film-penetration model has been
presented by Toor and Marchello [81] to describe the mass transfer mechanism with one boundary layer

Literature Review: Modeling of Catalytic Distillation
43
at the interface. These researchers demonstrated that the film and penetration models are merely
limiting cases of the more generalized film-penetration model.
Both the film theory and the penetration theory have their own share of limitations in describing
practical mass transfer systems. All these micro models which need appropriate modifications are not
applicable for systems where a liquid bulk is absent such as absorption in a column with structured or
random packing elements but bode well for systems with well mixed liquid bulk(absorption in tray
columns) and hence are very popular in distillation stage models. For the film model, the model
parameters are calculated via experimental correlations and there is a broad spectrum of available
correlations for most internals and systems. For the penetration theory, there is a dearth of correlations
available in the literature which limits their applicability in distillation models. Most mass transfer
models are hence based on film theory, and the review in this work is focused on the film models
proposed.
Equations 42 represents the interfacial mass transfer at the vapor-liquid interface based on Fick’s law
(flux of a chemical component is proportional to the gradient of the concentration of this species,
directed against the gradient) and and is the subject of basic mass transfer in all chemical engineering
handbooks. These equations are valid only for binary systems and under conditions of low mass transfer
rates. Most industrial distillation and absorption processes, however, involve more than two different
chemical species and these equations would fail into those scenarios and also in cases of absorption
with or without reaction.
The most fundamentally sound way to model mass transfer in multicomponent systems is via the
Maxwell-Stefan (MS) theory)[74, 82] which appears prominently in many NEQ distillation models
reported in the literature. There are other approaches such as generalized classical Fick theory or
diffusitivity approaches based on incorporating thermodynamics of irreversible processes that have
been discussed and compared against the MS approach in the literature[74, 83, 84]. Models have also
been coded for CD where ressearchers have simplified the MS approach by averaging MS diffusitivities
(effective diffusitivities)[85].
The MS equation for diffusion in a binary ideal gas mixture is:
)u(uxxfd212112i
(Equation 42)

Literature Review: Modeling of Catalytic Distillation
44
Here id is the driving force for diffusion and i
u is the average velocity of species i. This expression is
based on the assumption that the sum of the forces acting on the molecules of a particular species is
directly proportional to the rate of change of momentum which in turn, is directly proportional to the
concentrations (mole fractions) of the different species and to their relative velocity. 1,2f is the
coefficient of proportionality and is related to a friction factor. Equation 41 can now be transformed as:
12
2121
1
)u(uxxd
D
(Equation 43)
where 12D is the MS diffusion coefficient.
The generalization of this expression to mixtures with any number of different species is:
c
k ikD
1
kiki
i
)u(uxxd
(Equation 44)
Replacing, velocities with molar flux, iiiucN the following transformed equation is obtained :
c
k 1 ikt
ikki
i
Dc
NxNxd
(Equation 45)
For an ideal gas mixture, the driving forces are the partial pressure gradients:
dz
dx
dz
dp
P
1d
ii
i
(Equation 46)
For a non-ideal fluid, the driving force is related to the chemical potential gradient:
dz
d
RT
xd
i
i
(Equation 47)

Literature Review: Modeling of Catalytic Distillation
45
Solving the MS equations involves the computation of various matrices and functions. In practice, a
simple film model for mass transfer is often employed with a simple difference approximation to the
MS equations:
c
1k ikt
ikki
i
Kc
)NxNxΔx
(Equation 48)
where ix is the average mole fraction over the film. The MS mass-transfer coefficients, ij
K can
be estimated from existing correlations.
It should be noted that the MERSHQ equations in the NEQ model are similar to the MESH equations
in the EQ model however, there are crucial differences in the implementation of conservation and
equilibrium equations between the EQ and NEQ models. For the equations used in the EQ stage model,
the liquid and vapor phase balances are pooled, being the sum of the individual phase balances for mass
and energy which yields the net mass and energy balance for the stage as a whole . In NEQ models,
separate balance equations are written for each distinct phase. There is a rate term for transfer of
material and energy from one phase to the other across the phase interface. The inclusion of the mass
transport equations (Equation 33) introduces the mole fractions at the interface; something unique to
the NEQ models. Furthermore, in the NEQ models, the thermodynamic equilibrium assumption is only
at the interface, which necessitates evaluating the equilibrium constant (K-values) at the interface
compositions and temperature. The use of the NEQ models, hence, hinge on the availability of reliable
mass transfer coefficents and interfacial areas. This is not a trivial task, and is the subject of a text by
Taylor and Krishna [74].
On account of these differences, the NEQ models are more demanding of thermodynamic properties
than EQ models, not only for calculation of phase equilibrium calculations but also for mass transfer
driving forces . In the case of physical property requirements, EQ models only require K-values and
enthalpies whereas NEQ models in addition to these, essentially require surface tension, diffusion
coefficients, viscosities for calculation of mass and heat transfer coefficients and interfacial areas. Table
7 highlights the requirements for EQ models vs NEQ models.
In an EQ CD Model, a reaction term is added to the liquid material balances. Modeling the reaction
phenomena in a CD NEQ model is challenging and dependent on whether the reaction is heterogeneus

Literature Review: Modeling of Catalytic Distillation
46
or homogeneous. For homogeneous CD models such as the one presented by Lee and Dudukovic[51],
the material balance is represented by equation 10, the total reaction volume jε on stage j is obtained
from the column internal specifications and appropriate hydrodynamic correlations. In the case of
sufficiently rapid reactions, the reaction would also take place in the liquid film adjacent to the phase
interface, and very fast reactions may occur only in the film. In either case continuity equations for the
film are required for taking into account the effect of the reaction on the interphase mass transfer rates.
Table 7: Equilibrium Models Vs Non-equilibrium models for Catalytic Distillation
EQ Model NEQ Model
Equations MESH
- Mass Balances
- Energy Balances
- Equilibrium Equations
- Summation Equations
MERQ/MERSHQ
- Phase Mass Balances
- Phase Energy Balances
- Equilibrium Equations
- Summation Equations
- Mass Transfer in Vapor Phase
- Mass Transfer in Liquid Phase Energy
Transfer
Physical
Property
Requirements
- Activity Coefficients
- Vapor Pressures
- Fugacity Coefficients
- Densities
- Enthalpies
- Activity Coefficients
- Vapor Pressures
- Fugacity Coefficients
- Densities
- Enthalpies
- Diffusivities
- Viscosities
- Surface Tension
- Thermal Conductivities
- Mass-Transfer Coefficients
- Heat-Transfer Coefficients
- Interfacial Areas
For a heterogeneous reaction, there are two options for the description of the reaction term. The simpler
approach is to treat the reaction as being pseudo-homogeneous as done by Peng et. al[52], whereby
catalyst diffusion and reaction is lumped into an overall reaction term. For heterogeneous reactions that
are modelled in this way the liquid-phase material balance is as given in Equation 32 and jε is replaced

Literature Review: Modeling of Catalytic Distillation
47
by the total amount of catalyst present on the stage under consideration. with catalyst mass and activity
specified. A more rigorous approach towards heterogeneous CD modeling would involve the use of the
dusty fluid model proposed by Higler et. al[86] that takes into account simultaneous mass transfer and
reaction inside the catalyst particle. Such models require information about catalyst geometry (surface
area, mean pore diameter, etc). There are also heterogeneous models such as those proposed by Xu et.
al [34] which include inter-particle mass transfer from solid to liquid phase but not the intra-particle
gradients to settle for an approporiate modeling depth avoiding complexities. In all heterogeneous
models, it is unnecessary to allow for reaction in the vapor-liquid film which would esssentially leave
the vapor-liquid transport equations exactly as Equation 33.
On the basis of an empirical representation of the reaction, NEQ CD models in this study are reviewed
after categorizing them into 3 groups: 1) Homogenerous CD models 2) Pseudo-homogeneous models
which treat liquid and solid phase as a homogeneous phase neglecting inter- and intra-particle gradients
and 3) Three-phase heterogeneous models taking into account inter- and intra-particle gradients.
Keller and Gorak[85] have presented and compared two different NEQ modeling approaches for
homogeneous CD units, where multicomponent mass transfer is represented using MS equations in one
approach and simplied using the concept of effective diffusion co-efficients in the other. In the NEQ
model using effective diffusion methods, effective diffusion co-efficients are used to extract the
effective mass-transfer coefficients from Sherwood correlations. In the effective diffusion approach,
diffusuional interaction due to gradients from other components is neglected. The simulation results
from both models yielded very close results, thereby providing evidence for the possibility of
recovering the exact dynamics of multicomponent diffusion using proper diffustivity expressions .
Most CD models neglect reactions in the film. For very fast reactions (alkylations, epoxidations), the
reactions will occur both in the bulk phase as well as the liquid film necessitating consideration of both
reaction and diffusion in the film at the vapor-liquid interface. Such reaction models often face
numerical problems towards solution due to added non-linearization due to the reaction and the steep
concentration gradient in the liquid film. A NEQ steady state CD model for a very fast homogeneous
reversible reaction proceeding in the liquid phase has been presented by Slava et. al[87], with the
simplified multicomponent Fick's law describing the mass-transfer and chemical reaction at the V–L
interface. This approach was chosen to avoid numerical problems encountered with the more complex
MS approach. The mathematical model presented consisted of two sub-systems: ordinary second-order

Literature Review: Modeling of Catalytic Distillation
48
differential equations describing reaction and diffusion in the liquid film and system of non-linear
algebraic equations comprising enthalpy and material balances of the components. The uniqueness of
the model coded in FORTRAN lies in the numerical stability of the solution and algorithm robustness
that does not fail even when the column parameters and performance conditions are changed over a
wide range.
CD is a proven process intensification technique for equilibrium limited etherification reactions of
alcohols and recently, a generalized NEQ Model )[88]has been presented by Rouzineau et. al to
simulate a non-ideal multi-component homogeneous etherification process (etherification of acetic acid
and methanol). The uniqueness of the model lies in its description of the mass transfer model by the
Maxwell Stefan approach but without any restrictive hypothesis about the type (equilibrium or kinetic)
and localization (bulk or film) of the reactions. This research also presents a stable numerical algorithm
towards a differentiation index and the initialization coherence to solve the model.
For most unsteady CD models, Newton–Raphson methods are used for achieving solutions on account
of their faster convergence. Solutions via this approach, however require analytical derivatives of model
equations and often, the algebraic effort to obtain the required derivatives manually is problematic.
Researchers claim computer algebra (CA) can accelerate model development and implementation for
complex models, because it provides the possibility of manipulating large mathematical expressions
and solving problems of great numerical complexity in a single computational environment and chosing
a CD unit for demonstrating the power of CA. Alfradique and Castier[89] have extended the computer
algebra (CA) package Thermath towards the simulation of homogeneous steady-state reactive
distillation columns based on Newton’s methods. For CD cases presented in the literature, the CA
simulation results showed better agreement than other existing simulations, as the use of CA permitted
adoption of more rigorous thermodynamic modeling with relative ease and faster convergence.
Pseudo-homogeneous NEQ models, ignore mass-transfer and heat-transfer resistances between the
liquid phase and solid (catalyst) phase and hence, are appropriate only for kinetically controlled
reactions. For highly exothermic or fast reactions-, a temperature gradient for a highly exothermic
reaction and a concentration gradient for a fast reaction exists between the liquid phase and the solid
phase. A detailed pseudo-homogeneous model for CD is presented by Svandova and Labovsky [90] for
the kinetically controlled process of MTBE production via etherification. The precision of the
nonequilibrium stage model is highly dependent on the accuracy of the correlations used to estimate
Literature Review: Modeling of Catalytic Distillation
49
the mass transfer coefficient-interfacial area product. This research presents a comparative study of
different prediction techniques for binary mass transfer coefficients and their impact on the model
behaviour. Comparisons of pseudo-homogeneous NEQ modes to heterogeneous 2 phase NEQ models,
have been discussed in several modeling research papers [48, 91].
The application of 3 phase heterogeneous NEQ CD models in the literature is rare, owing to the lack
of methods describing diffusion coefficients and thermodynamic nonidealities inside the porous
catalyst. There have been heterogneous CD modeling developments presented by various researchers.
In their non-equilibrium model[92], Sundmacher and Hoffman, researchers use an effectiveness factor
to account for diffusion and reaction inside the catalyst. Higler et al. in their work[86] have extended
the dusty fluid model to describe mass transfer inside the solid phase. A 3 phase NEQ heterogeneous
model[34] was presented in by Xu et al. for the aldol condensation of acetone where the researchers
expressed mass transfer rate at the liquid–solid interface using in-house correlations developed for
their CD column. A detailed 3-phase NEQ model[93] for steady state simulation of heterogeneous CD
process has been presented by researchers Kotora et al [93]. The mathematical model takes into account
both mass and heat transfer across the gas liquid interface and through the liquid–solid (catalyst)
interface. Equations describing the mentioned phenomena are based on an effective diffusivity
approach( against the MS approach) with the solid-liquid mass transfer coefficients taken from
correlations suggested by Kataoka et al.[94]. The resulting system of nonlinear algebraic equations was
implemented in the FORTRAN programming language and solved by the BUNLSI solver (Ferraris &
Tronconi, 1986) . The described model was verified using experimental data obtained from a
continuous distillation column equipped with a catalytic packing.
Feng et al. have modeled the heterogeneous CD for dimethyl carbonate (DMC) synthesis from urea and
have presented an improved tri-diagonal method for solving the 3 –phase non-equilibrium stage model
equations[95]. It is claimed in this research that the improved tri-diagonal matrix method avoids
negative values of the liquid composition during the calculations and restrains the fluctuation of
compositions by slowing down the variations of the values in the iteration. The modeling results show
that the improved tri-diagonal method was appropriate for system containing a wide range of boiling
point components and different rates of reaction.

Literature Review: Modeling of Catalytic Distillation
50
2.2 Appropriate modeling depth for CD
The umbrella of CD covers a large range of different chemical processes such as hydrogeneation,
hydrodesulphurization, etherifications, nitrations, esterifications, transesterifications, condensations and
alkylations etc., which all differ with respect to phase and reaction equilibrium, homogeneous or
heterogeneous catalysis systems, transport of mass and energy and column hydrodynamics. For model-
based design and operational optimization of these CD systems, mathematical models developed should
adequately describe the column hydrodynamics, mass and heat transfer resistances, and reaction kinetics
simultaneously, with the accuracy of the simulation results being strongly dependent on the quality of the
applied model parameters and an understanding of the equilibrium and kinetic limits of the process. While
complex models describe the CD models in more accurate detail, they also require more model parameters
(Table 8) and often also lead to algorithmic difficulties towards convergence.
Table 8: Complexities associated with Modeling Approaches for Reaction and Separation in CD
Models (Adapted from [96])
Modeling Approach Level of Complexity
Reaction Phase-Equilibrium
Chemical Equilibrium EQ Low
Chemical Equilibrium Rate Based Medium
Kinetic EQ Medium
Kinetic Rate-Based High
Consequently, the highest modelling depth is not always the best choice because the accessibility of the
model parameters and the possible costs for the determination of the missing parameters must be considered
in determination of the optimal modelling depth. To our knowledge, a well-defined approach towards
identifying the appropriate optimal modeling depth for CD processes has not been outlined in literature and
in this review; we attempt to outline a tactic towards selecting the appropriate model from different CD
models available in literature capable of adequately picturing a particular CD case (Figure 16).

Literature Review: Modeling of Catalytic Distillation
51
Figure 16: Framework towards identifying the appropriate modeling depth for studying a CD
process
2.2.1 EQ Models versus NEQ Models
As discussed in preceding sections, EQ models are fundamentally flawed and in reality, thermodynamic
equilibrium is a rare occurrence on a distillation stage. EQ models hinge heavily on correlation
parameters, such as tray efficiencies or HETPS, whose calculation in multicomponent mixtures are
replete with inaccuracies and puzzles. There are no comprehensive, sound methods available for
calculation of these correlation parameters and the inaccuracies associated with existing methods are
magnified in the case of CD where the chemical reactions affect the component efficiencies. EQ models,

Literature Review: Modeling of Catalytic Distillation
52
quite often fail in comparison to NEQ models in portraying good agreement with experimental results
(demonstrated by numerous researchers [97-100]). In the modern CD modeling sphere, EQ models are
hence losing applicability for detailed model-based design or optimization studies of most CD processes,
and there is more focus towards improving mass transfer models in NEQ models than perfecting
efficiency corrections to relate the EQ model to reality. Nevertheless, the simplicity and popularity of
these models (availability in most commercial simulation packages) serve great utility in quick technical
feasibility evaluation or preliminary design of CD equipment and in carrying out exploratory studies on
new candidate reactions for CD in terms of energy requirements, cost analysis or impact assessment of
processes [39, 69, 101, 102]. EQ models also have been recently applied to the study of modified design
of CD process (thermally coupled CD columns [103]) or to the study of hydrodynamics and other
phenomena such as liquid phase splitting [104].
2.2.2 Phase Equilibrium versus Chemical Equilibrium, Reaction in film/bulk
CD has been reported to provide positive effects in chemical equilibrium limited processes[10] and
azeotropic separations[105, 106] (CD breaks azeotropic and chemical equilibrium limitations). CD
processes have equilibrium and kinetic limits, with CD behavior swinging between phase equilibrium and
chemical equilibrium boundaries. The thermodynamics of CD is of paramount importance for the
understanding of CD and has been well-reviewed [41, 107, 108].
CD models can depict the reaction and the separation using different approaches, resulting in different
models of varying complexity (Table 8). The CD model could either entail reaction kinetics for the chemical
reaction or assume an infinitely fast chemical reaction, leading to a chemical equilibrium on every reactive
stage. The chemical equilibrium assumption simplifies the complexity of the model, but this is valid only
for certain scenarios (very fast reactions) and is not adequate for most chemical reactions of commercial
interest. A framework for establishing the regime for the CD process (kinetically controlled versus phase-
equilibrium controlled where the chemical equilibrium assumption is valid) is now presented. This criteria
is adapted from the work of numerous researchers [8, 109, 110] who have identified the dimensionless
Damkohler number, Da to predict the reaction regime of the CD process. The Damköhler number (Da) is a
dimensionless number in chemical engineering that relates the chemical reaction timescale (reaction rate)
to the transport phenomena rate (diffusion rate) occurring in a system. It is defined as:

Literature Review: Modeling of Catalytic Distillation
53
V
kHDa
f0
(Equation 49)
where 0H is the liquid holdup (mol) , f
k is a pseudo-first order rate constant (1/s) and V is the vapor
rate (mol/s). For low values of the Da number (Da<0.1), the reaction rate on each stage is relatively slow
as compared to the residence time available on each stage, CD models for these systems must necessarily
incorporate appropriate kinetics[8, 109]. For large values of Da>10, the reaction rate is very fast and the
chemical equilibrium assumption might be valid in these CD models (reactions such as esterification,
oligomerization of olefins etc.) [109]. If the chemical reaction is very fast, the CD process can be described
assuming chemical equilibrium regarding of whether it is homogenously or heterogeneously catalyzed
[111]. For 0.1<Da<10, the CD process are governed by both phase equilibrium and chemical equilibrium
and CD models must incorporate kinetic expressions [8].
For homogeneously and pseudo-homogeneous liquid phase CD systems, there is concurrent mass transfer
and chemical reaction and the complex interaction between these phenomena in different cases requires
modeling of varying complexity for accurate description. The working regime of the process must hence
be recognized to ascertain whether the process is mass transfer or kinetically controlled, whether the
reaction takes place only in the liquid bulk or also in the film region. Identification of the process regime
may aid simplification of the model by justified assumptions (for example: instantaneously settled chemical
equilibrium for very fast reactions).
A strategy for determining the working regime of CD processes is via the dimensionless Ha number (Ha)
[discussed in Equation 1] which helps to categorize very fast, fast, average and slow chemical reactions.
The Ha number is the ratio of the maximum possible conversion in the film to the maximum diffusion
transport through the film. For most CD processes, Ha <<1, suggesting very slow reactions and kinetically
controlled processes and for those CD models, it is appropriate to account for the reaction to be occurring
only in the bulk phase, neglecting direct interactions of mass transfer and reaction and integrating the kinetic
expression for the chemical reaction into the bulk mass and energy balances [8, 41, 112]. A Ha > 3
represents a very fast reaction system and CD models in these cases could be simplified by describing the
bulk phase conditions assuming instantaneous settled chemical reaction equilibrium. For CD systems with

Literature Review: Modeling of Catalytic Distillation
54
medium chemical reaction velocities (1<Ha<3), the reaction needs to be modeled in the bulk phase as well
as in the interfacial film, resulting in models of high complexities (discussed in ref [49, 113]).
2.2.3 Pseudo-homogeneous Vs Heterogeneous Models
The debate for pseudo-heterogeneous versus heterogeneous models for CD arises in cases of CD processes
catalyzed by heterogeneous porous catalyst systems, where there is diffusion with simultaneous reaction
within the porous catalyst. Pseudo-homogeneous models lump the catalyst diffusion and reaction into an
overall reaction term whereas heterogeneous models adopt a more rigorous approach completely describing
intra-particle mass and energy transfer and reaction inside the catalyst particles. Pseudo-homogeneous
models are simpler empirically and computationally than heterogeneous models.
In general, a pseudo-homogenous approximation is valid for scenarios where the liquid-solid transfer
resistance does not have a considerable impact. Pseudo-homogeneous CD models ,hence , provide
reasonably accurate predictions for slow (kinetically controlled) reactions, but will also fail at conditions
of low reflux for slow reactions, where the process is significantly affected by the liquid-solid mass transfer
such as the case modeled by Zheng et al.[114]. A general methodology towards recognizing scenarios
pointing to applicability of the pseudo-homogeneous models has recently been proposed by researchers
[93] by formulating a dimensionless Da criterion for the liquid-solid interface:
S
n
L
nm,
S
nav,
S
nS
n
aρk
RDa
(Equation 50)
where S
nDa represents the ratio between the reaction rate
S
nR and the transport rate through the phase
interface where L
nm,ρ is the liquid molar density (mol/m3) on the nth stage,
S
nav,k is the average mass transfer
coefficient and S
na is the interfacial area at the L-S interface.
For low values of S
nDa <<1, the reaction rate is the rate limiting step and the mass transfer resistance in the
film adjacent to the liquid-solid interface can be neglected. A pseudo-homogeneous approach would be
advantageous in such a case. Equation 49 is also able to predict the non-suitability of the pseudo-
homogenous approach in diluted systems where L
nm,ρ would be very small yielding
S
nDa >>1. Apart from
fast reaction systems, low reflux conditions and diluted systems, as shown from Equation 29; the pseudo-

Literature Review: Modeling of Catalytic Distillation
55
homogeneous approach would fail in flooded systems (larger boundary layer thickness and slower mass
transfer) and highly exothermic systems where a steep temperature gradient exists between the solid surface
and the bulk liquid[93].
2.3 Softwares available for CD modeling
Modeling of CD processes encompasses various levels. Some modelers develop models from first
principles in programming software; there are also modelers who develop models (primarily) using
model libraries and drag-and-drop flow sheeting in commercial software. There are modern software
packages available for simulation of CD processes such as CHEMCAD and Aspen Plus. Commercial
software just requires effort by the user to characterize the physical properties and reaction rates for the
species present, and to choose the appropriate model (EQ or NEQ) for the process design. The
availability of such software has opened up a convenient way for a first-hand feasibility analysis of CD
for various candidate reactions.
There are various commercially available software simulation packages such as ASPEN Plus,
particularly the RADFRAC inside-out algorithm, ChemSep, Pro/II, and SpeedUp, etc. for simulating
steady-state behavior of CD columns.
The RadFrac model developed by AspenTech[115], is the most popular commercial simulation package
available for CD modeling with both EQ and NEQ rate based models available. The NEQ model (Aspen
RateSep program ) is based largely on the NEQ distillation model outlined in refs [116, 117], with
options to incorporate kinetic expressions for chemical reactions. The influence of reaction on mass
transfer is modeled by means of enhancement factors. The RateSep program considers mass and heat
transfer limitations, liquid and vapor film diffusion, equipment hydrodynamics and chemical reaction
mechanisms. RateSep supports film reactions and film discretization which makes it very influential in
reactive separations. The program also has many built-in correlations for mass transfer and holdup for
each tray/packing type. The RadFrac model architecture is flexible to accommodate columns with side
streams, inter stage heaters/coolers and pumparounds.
ChemSep, is another distillation computational model (has both EQ and NEQ models) that can be used
to simulate reactive distillation processes. With many correlations for mass-transfer coefficients,
interfacial area and flow models built into the program, ChemSep features some of the most recent
developments in NEQ distillation models [75]. The ChemSep program also includes a variety of

Literature Review: Modeling of Catalytic Distillation
56
thermodynamic and physical property models and is capable of producing detailed design for
equipment selected for the simulation. The program is rapidly gaining popularity in academia with a
number of university licenses worldwide [118].
The gPROMS custom-modeling software environment has been very popular in building, validation
and execution of numerous CD process models of varying complexity. gPROMS also has a model
library with different reactor and separation equipment models for a drag and drop approach as well as
a rigorous physical properties package (Infochem Multiflash). gPROMS also provides a general open
interface for interfacing of external property and thermodynamic tools. Various NEQ models for CD
[34, 48, 75, 98] have been reported to have been coded in gPROMS.
Speed Up is a dynamic simulation tool mentioned in several publications[119-121].READYS; a
dynamic simulator for equilibrium based CD models, is described in ref [118]. Many other models have
been implemented primarily for research purposes of propriety software.
2.4 Conclusions
The area of CD modeling is seeing developments of sophisticated NEQ models and a gradual
obsoleteness of EQ models. While NEQ models provide a more accurate representation of the
intricacies of transport in CD, they are more demanding of physical property data and also depend
crucially on the proper estimation of mass-transfer coefficients, interfacial areas, pressure drop, and
capacities. Future improvements of NEQ models will hence be in the area of developing new and
improved correlations for these key performance parameters. Incremental improvements in the
algorithmic methods used to solve the non-equilibrium models will also continue.
The advent of comprehensive software packages for CD modeling and simulation has made it simpler
for engineers to accurately design, study and optimize the behavior of CD processes and focus on
process development without getting involved in the algorithmic and computational intricacies
(solution methods, convergence, degrees of freedom analysis etc.) involved. The near future would also
see improved models in libraries of these packages with superior user interface and more precise mass
and heat transfer correlations for a wider range of tray types and random and structured packings.
The vast majority of CD models presented in the literature assume plug flow patterns for the vapor and
liquid phases and future modeling efforts would also be redirected towards more complex and improved
Literature Review: Modeling of Catalytic Distillation
57
models towards column hydrodynamics since residence time distribution of the vapor and liquid phases
in CD units severely affect the reactor performance (reaction rates, effective driving force and the
conversion and selectivity). There is a growing need to improve these models, especially in cases of
kinetic controlled processes where liquid back-mixing, channeling, stagnant zones cause large
deviations in model results.
58
Chapter 3
A distributed film model for fast reactions in a CD process
3.1 Background
The umbrella of CD covers a large range of different chemical processes such as hydrogenation,
hydrodesulphurization, etherifications, nitrations, esterifications, transesterifications, condensations
and alkylations etc., which all differ with respect to phase and reaction equilibrium, homogeneous or
heterogeneous catalysis systems, transport of mass and energy and column hydrodynamics. For model-
based design and operational optimization of these chemical systems, mathematical models developed
should adequately describe the column hydrodynamics, mass and heat transfer resistances, and reaction
kinetics simultaneously, with the accuracy of the simulation results being strongly dependent on the
quality of the applied model parameters and an understanding of the equilibrium and kinetic limits of
the process. Particularly in study of fast kinetics in processes such as hydrogenation, competing mass
transfer and kinetic rate processes contribute to the overall observed reaction rate. Scale-up and
optimization of the process require that the contributing rate processes are understood individually and
their impact on the total process is quantified.
Catalytic hydrogenation is is one of most important transformations in the petrochemical and fine
chemical industries. Numerous researchers[7, 122-126] have reported results about hydrogenation
being made feasible at substantially lower partial pressures in CD processes. The observation of lower
hydrogen partial pressure in CD processes is a subject of focus in this thesis and to our knowledge, no
research in the current literature has discussed in accurate detail, the exact reasons for why CD makes
hydrogenation efficient and feasible at lower pressures. To mathematically formulate a reason to
explain this phenomenon was chosen to be one of the primary modeling objectives of this research. The
modeling of hydrogenation is intriguing, since hydrogen is an incondensable gas. Hydrogen can be
liquefied only, when cooled to at least –240 °C (Critical temperature). Below this critical temperature,
hydrogen can only be liquefied by compression. V-L Equilibrium relationships for hydrogen hence
don’t hold validity in hydrogenation models. The concentration of hydrogen in the liquid has to be
A distributed film model for fast reactions in a CD process
59
calculated/approximated from other empirical laws. To our knowledge, no work in literature has
presented a distillation model involving hydrogenation.
Finally, there is also a factor of appropriate modeling depth. While complex models describe the CD
process in more accurate detail, they also require more model parameters and often also lead to
algorithmic difficulties towards convergence. Consequently, the highest modelling depth is not always
the best choice because the accessibility of the model parameters and the possible costs for the
determination of the missing parameters must be considered in determination of the optimal modelling
depth.
The focus of efforts in this chapter is to develop a model that would be versatile and applicable to
different CD hydrogenation systems and could demonstrate the influence of mass transfer limitations
on the overall process productivity. The model, specifically, should have the following characteristics:
1. The model should be conceptually simple.
2. The model should be easy to use.
3. The model should focus on demonstrating the role of mass transfer and kinetic limitations on
the process performance and should be able to explain the lower hydrogenation partial pressure
observed in various CD systems.
For the proposed model, the model equations described here relate to the reaction zone. The non-
reaction zones in the CD unit comprise of the same equations for heat and mass balance and transport
as in the 3 phase NEQ model.
3.2 Model Overview and Equations
Most CD models differ in the way the reaction is set up in the column. Reactions in the distillation
column could be hypothesized as either homogeneously catalyzed (liquid catalyst or auto-catalyzed) or
heterogeneously catalyzed, in which a solid catalyst catalyzes the reaction. In homogeneously catalyzed

A distributed film model for fast reactions in a CD process
60
CD processes, the chemical reactions may occur in both the bulk and in the vapor-liquid film region.
The location of the reaction is distinguished by the concept of Hatta Number. The Hatta number is a
dimensionless parameter that compares the rate of reaction in a liquid film to the rate of diffusion
through the film. For an nth order reaction involving two reactants, the Hatta number [8, 46] as defined
in Equation 22 previously is:
2
Lk
AD
BC
1n
AC
fk
1n
2
Ha
(Equation 22)
where n is the reaction order, kf is the rate constant for the forward reaction (1/s), C is the concentration
(mol/m3), D is the diffusivity (m2/s) and kL is the mass transfer coefficient (m/s). In most
homogeneously catalyzed CD processes, chemical reactions are generally hypothesized to be only
occurring in the bulk phase on account of very low Hatta numbers(Ha), Ha <<1[44, 45].
In heterogeneous system, due to the presence of the catalyst, a third solid phase and an additional
interface is present in the system and different models go to different depths of complexity to describe
the phenomena at the liquid-solid interface. The general schematic of a gas-liquid-solid catalytic
reaction for hydrogenation of an organic compound is shown in Figure 17[127]. The complex CD
heterogeneous models entail intrinsic kinetics and the calculation of internal and external mass transfer
resistances. Some modelers, based on the assumption that the catalyst surface is totally exposed to the
liquid bulk, lump the surface reaction and internal diffusion into an overall surface reaction, forming
the base for pseudo homogeneous models.

61
Figure 17: Schematic of a gas-liquid-solid catalytic reaction for hydrogenation of an organic compound [127]

62
For very fast reactions (alkylations, epoxidations, hydrogenation), models have been presented in
literature that portray the reactions to be occurring in both in the bulk phase as well as the liquid film
necessitating consideration of both reaction and diffusion in the film at the vapor-liquid interface. Such
reaction models often face numerical problems towards solution due to added non-linearization due to
the reaction and the steep concentration gradient in the liquid film. A NEQ steady state CD model for
a very fast homogeneous reversible reaction proceeding in the liquid phase has been presented by Slava
et. al[87], with the simplified multicomponent Fick's law describing the mass-transfer and chemical
reaction at the V–L interface. The mathematical model presented consisted of two sub-systems:
ordinary second-order differential equations describing reaction and diffusion in the liquid film and
system of non-linear algebraic equations comprising enthalpy and material balances of the components.
A model is presented in this thesis, wherein we are expanding the model proposed by Slava et. al[87]
for a fast reactive homogeneous system to a fast reactive heterogeneous system. The distributed film
model presented is based on the assumption that hydrogenation is a very fast reaction with a high Ha
number. For fast reactions with (Ha>1), the reactions have been proposed to occur both in the bulk
phase as well as the liquid film. The underlying idea behind setting up the phases in the model is derived
from a patent[124] presented on hydrogenation of benzene in a CD system where the effectiveness of
the CD process was noted due to the condensation of a portion of the vapors in the reaction system,
which occludes sufficient hydrogen to obtain the requisite intimate contact between the hydrogen and
the benzene in the presence of the catalyst to result in their hydrogenation. In formulating the model,
hydrogenation is assumed to be occurring in the liquid phase solid-liquid film covering the catalyst
surface . In the film, the second order reaction diffusion differential equation is written to establish the
relation between mass transfer and the rate of the reaction. To implement the model, we test the Hatta
number critaeron for the hydrogenation reaction in each kinetic system.
We also checked if the convective fluxes could be ignored in the conditions of trickle bed flow in
catalytic distillation columns. This is achieved via calauclations of the Peclet number (Pe). The Peclet
number is a class of dimensionless numbers relevant in the study of transport phenomena in a
continuum which is the ratio of the rate of advection of a physical quantity by the flow to the rate of
diffusion of the same quantity driven by an appropriate gradient.
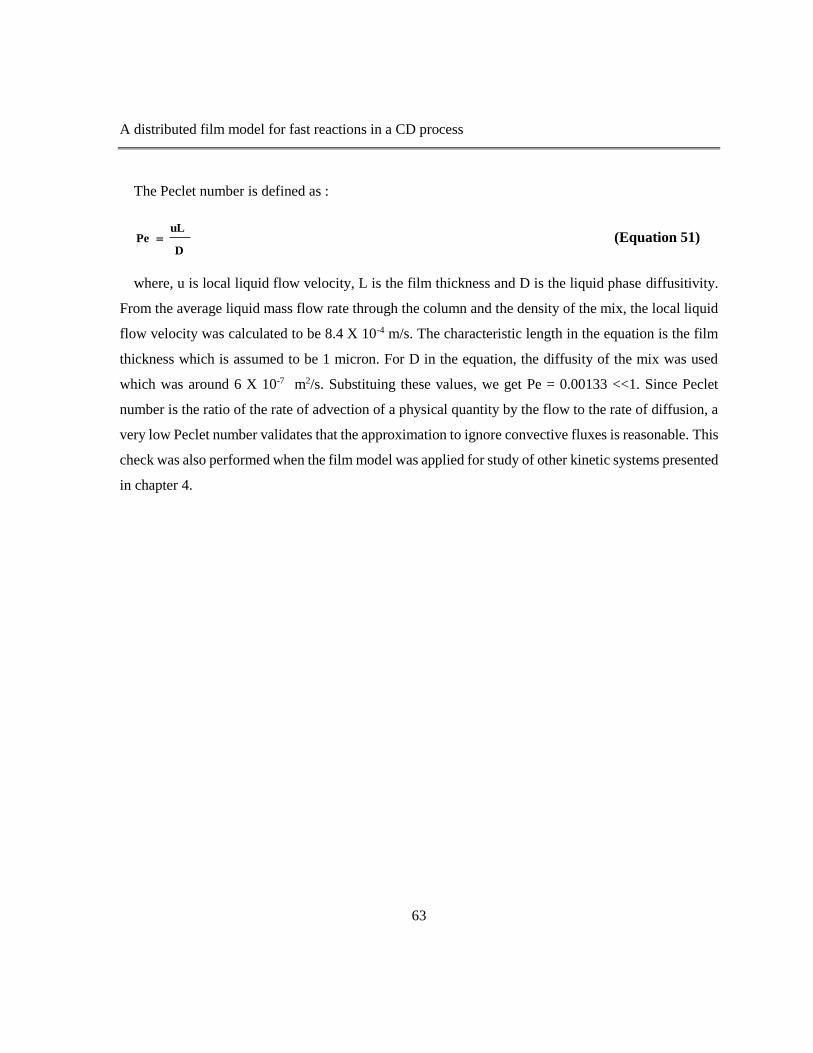
A distributed film model for fast reactions in a CD process
63
The Peclet number is defined as :
D
uLPe (Equation 51)
where, u is local liquid flow velocity, L is the film thickness and D is the liquid phase diffusitivity.
From the average liquid mass flow rate through the column and the density of the mix, the local liquid
flow velocity was calculated to be 8.4 X 10⁻⁴ m/s. The characteristic length in the equation is the film
thickness which is assumed to be 1 micron. For D in the equation, the diffusity of the mix was used
which was around 6 X 10⁻⁷ m2/s. Substituing these values, we get Pe = 0.00133 <<1. Since Peclet
number is the ratio of the rate of advection of a physical quantity by the flow to the rate of diffusion, a
very low Peclet number validates that the approximation to ignore convective fluxes is reasonable. This
check was also performed when the film model was applied for study of other kinetic systems presented
in chapter 4.

64
Figure 18: Film Model: Motivation behind the idea and Modeling Interpretation

65
A schematic diagram depicting the concepts of the proposed model is shown in Figures 19 and 20.
The column is composed of a number of stages (75) and each stage is represented in the form of a 3-
phase NEQ cell. Mass transfer takes place from vapor into the liquid into the solid. In each NEQ cell,
the vapor and liquid bulk phases are assumed to be perfectly mixed, the vapor-liquid equilibrium is
assumed to take place only at the vapor-liquid interface, the reaction rate and reaction heat on the
catalyst are assumed to be equal to the mass transfer rate and heat transfer rate respectively between
the liquid and the solid phases, and the solid catalyst is assumed to be partially wetted. The pressure
drop along the column is negligible. The liquid and vapor feed streams are assumed to be evenly
distributed over the cross-sectional area of the column.

A distributed film model for fast reactions in a CD process
66
Figure 19: Distributed Film Model for hydrogenation: Reaction in L-S film on the catalyst surface

A distributed film model for fast reactions in a CD process
67
Figure 20: Distributed Film Model for hydrogenation: Heat equation in the L-S film
The model equations for the reaction zone are as :
Mass balance equations :
V
ij,N
S
,N
i1,-jl
ij,l
ij (Equation 52)
(Liquid coming down from the top stage is enriched by diffusion from the gas phase and is depleted by
mass transfer to the catalyst surface and pore diffusion within catalyst particles; NS represents the molar
mass transfer rate from liquid to solid, NG represents the molar mass transfer rate from gas to liquid, i
and j are subscripts for the number of component and stage number respectively)
j
V
ij,N
suctionH
ij,V
i1,jV
(Equation 53)
Vapor rising from the lower stage diffuses into the liquid. Hsuction represents the requisite molar amount
of hydrogen needed for the kinetic reaction that reaches the film as the condensing vapor reaction

A distributed film model for fast reactions in a CD process
68
system occlude sufficient hydrogen to obtain the requisite intimate contact in the presence of the
catalyst to result in their hydrogenation. This approximation was made for hydrogen from idea
conveyed in patents on CD hydrogenation[124, 125]. For all other components other than hydrogen,
Hsuction is 0.
0HNVVsuction
V
outin (Equation 54)
)yy(eNij,
eq
ij,
V
ij,
V
ij, (Equation 55)
)x(xeNij,
eq
ij,
L
ij,
L
ij, (Equation 56)
Mass and energy are transferred across the vapor-liquid interface at a rate which depends on the
extent to which the phases are not in equilibrium. L
binarye and vapor
V
binarye are the binary mass
transfer coefficients for the liquid and the vapor phases for the random packing in the non-reaction.
ieq,x
ieq,y
l
ieq,
v
ieq,
(Equation 57)
Vapor-liquid equilibrium is assumed to take place at the vapor-liquid interface. v
ieq, and L
ieq, are
fugacity coefficients for vapor and liquid phase respectively.
The mass transport from bulk liquid to the film is equal to the Fick’s diffusive flux at the solid-liquid
film interface. D is the diffusivity coefficient.
film in 0x
dx
ij,dC
ij,D
S
ij,N
(Equation 58)
As outlined before, in the solid-liquid film, the 2nd order differential equation for reaction diffusion is
written in the solid-liquid film.
0filmi,j,
r2
dz
filmi,j,C
2d
ij,D (Equation 59)
The boundary conditions are as follows:
X components allfor film
X0,zat (Equation 60)

A distributed film model for fast reactions in a CD process
69
Concentration curve is continuous in the film and at the start of the film, matches the concentration in
the bulk liquid. The concentration becomes uniform at infinity in the film with the gradient
approaching 0.
components allfor dz
filmdX
,zat 0 (Equation 61)
The derivation for the reaction diffusion equation is now presented :
Figure 21 : Control volume for mass balance via advection and diffusion
For deriving the reaction diffusion differential equation, we start with deriving the full advection
diffusion reaction equation for mass balance in a control volumne and then, investigate if advective
terms could be neglected in laminar, trickle bed conditions in a CD column. The derivation of the
advective diffusion equation relies on the principle of superposition: advection and diffusion can be
added together since they are linearly independent. The total molar flux in the x-direction Jx, including
the advective transport and a Fickian diffusion term, must be :

A distributed film model for fast reactions in a CD process
70
dx
dCDuC
xJ (Equation 62)
For trickle bed conditions in a CD, there is no cross flow velocity so the advective term uC could be
neglected.
Equation 1 now transforms to :
dx
dCD
xJ (Equation 63)
We now use this flux law and the conservation of mass to derive the reaction diffusion equation. In
our control volume from before, from conservation of mass, the net flux through the control volume is:
r
outminm
t
M..
, (Equation 64)
Change = In – Out + Generation
In the x direction we have :
rzy
xx
zy
xxt
M
dx
dCD
dx
dCD- (Equation 65)
Division by the control volume, δx.δy.δz, at steady state, we get the steady state reaction diffusion
equation that has been applied to the solid-liquid film in the CD model equations:
r2
dx
C2
dD0 (Equation 66)
Heat balance equations:
The model considers heat transfer effects by both conduction and convection for the liquid and the
vapor phase. The heat transfer coefficients for transport equations for heat balance are calculated using
the Chilton Colburn analogy discussed in the Introduction, chapter 1. Multiflash software is used to
calculate the enthalpies for the pure components and their mixtures in the vapor, liquid, and solid
phases.

A distributed film model for fast reactions in a CD process
71
Liquid Phase
)j,0film,
TjL,
T(aS
h-)jL,
TjI,
T(aV
hV
ij,H
V
ij,N
S
ij,H
S
ij,N
ij,mix,H
ij,l
i1,-jmix,H
i1,-jl
(Equation 67)
Vapor Phase
)i,0film,
TiL,
T(aV
h-V
ij,H
V
ij,N
ij,mix,H
ij,V
i1,jmix,H
i1,jV
(Equation 68)
Liquid Vapor Interface
)iL,
TiI,
T(L
h)iI,
TiV,
T(V
h (Equation 69)
Convective heat transfer from the vapor phase via the vapor-liquid interface equals the convective heat
transfer to the liquid phase.
Liquid Solid Film
Analogus to the reaction diffusion differential equation, the temperature distribution in the liquid-
solid film is a second-order differential equation.
0(x)R
Q2
dx
T2
d
Sh (Equation 70)
with the boundary conditions :

A distributed film model for fast reactions in a CD process
72
0
dx
dT ,xat
LTT 0,xat
(Equation 71)
(Equation 72)
Temperature is continuous in the film and the film temperature at the liquid-solid boundary matches
the temperature in the bulk liquid. The temperature becomes uniform at infinity in the film with the
gradient approaching 0.
Solid Phase
)i,0film,
TiL,
T(aS
h-V
ij,H
V
ij,N
ij,mix,H
ij,V
i1,jmix,H
i1,jV
(Equation 73)
The model equations were solved in gPROMS. Several different numerical techniques are included in
gPROMS for solving differential equations. Due to its imporved accuracy over the forward and
backward finite difference techniques, the central difference method was selected in this work.
Because of indexing of the differential problem via finite differences method, the total number of
equations and corresponding unknown variables in the model are now close to 375,000. The model and
runs in around 465 seconds on an Intel i5 CPU with 8 GB RAM.
3.3 Model results for the Isooctane process
The distributed film model was applied to study the isooctane process. Before implementing the
model, the Hatta number criterion was checked to judge the suitability of the model towards the
reaction system. Using the kinetics developed by Xu[33] in his Thesis , and employing equation 22,
the Hatta number Ha was found out to be 2.65>1. Calculations are shown in Appendix B.
(Equation 74)
2
Lk
AD
BC
1n
AC
fk
1n
2
Ha
m

A distributed film model for fast reactions in a CD process
73
The equations representing kinetics of the isooctane system, used for the Hatta number calculations
are mentioned below. These have been taken from a doctoral research thesis [33]from our laboratory.
(Equation 75)
)RT
26859exp(
210*2.37
Hk
(Equation 76)
The model equations were coded in a gPROMS project file that depicted the CD pilot as a unit
composed of 75 non-equilibrium stages with a total condenser and a reboiler. An intriguing question
while formulating the film model was the assumption of the film thickness. The model was run at
different values of film thickness in increments of a micron and results were compared to experimental
data to tune the model. A film thickness of 3 microns was deemed as the best fit to match the reboiler
concentrations for products. The model’s sensitivity to different varying film thickness is shown in
Table 9.
330
2
300 .
H
.
16H
8C
*k
18H
8C
PxH
r

74
Table 9: Sensitivity of the film model to varying film thickness for the L-S film (Simulation tests for CD2-2 experimental runs)
RUN#
P
(psig)
Hydrogen
Feed Rate
(L/h)
Feed rate
(g/h)
Model Predictions (wt. %) Reboiler Concentrations
C4
(Isobutene) C5
(Isopentane) C8
(Isooctene) C8A
(Isooctane)
C12
(Dodecane)
Real experimental
Data
CD2-2
90
6.85
C4: 59.96 C5: 67.07
0
52.9
3.7
27
26.9
16.6
Film Thickness
1 micron
CD2-2
90
6.85
C4: 59.96 C5: 67.07
0
49.9
1.3
31.6
16.4
Film Thickness
2 microns
CD2-2
90
6.85
C4: 59.96 C5: 67.07
0
52.1
2.5
29.1
16.3
Film Thickness
3 microns
CD2-2
90
6.85
C4: 59.96 C5: 67.07
0
51.6
4.1
28.2
16.1
Film Thickness
4 microns
CD2-2
90
6.85
C4: 59.96 C5: 67.07
0
51.3
4.9
27.9
15.9
Film Thickness
5 microns
CD2-2
90
6.85
C4: 59.96 C5: 67.07
0
51.4
5.1
27.6
15.7

75
Table 10 shows the reboiler mass balance results as predicted by the model for two pilot plant
experiments reported in reference[33]. The model shows good agreement for concentrations of
isopentane, isooctene and isooctane in the reboiler with deviations under 10%. It is to be noted that the
two pilot plant experiments differed in feed flow and hydrogen injection rates which proves that the
model is flexible to simulate the system runs under different scenarios.
Figure 22 shows the simulated temperature profile compared against the actual measured
thermocouple readings at different points along the column. There is a close agreement between
predicted and experimental data. The simulated temperature profile twice overlaps the trend of the
measured profile along the column.

76
Table 10: Reboiler mass composition results: Film Model predictions versus experimental results (Film thickness 3 microns)
RUN#
P
(psig)
Hydrogen
Feed Rate
(L/h)
Feed rate
(g/h)
Experimental Results (wt. %)
Reboiler Concentrations
Model Predictions (wt. %)
Reboiler Concentrations
C4 C5 C8 C8A C12 C4 C5 C8 C8A C12
CD2-2
90
6.85
C4: 59.96
C5: 67.07
0
52.9
3.7
27
26.9
16.6
0
51.6
4.1
28.2
16.1
CD2-4
90
7.99
C4: 76.67
C5: 52.30
0
39.6
7.0
31.4
22.1
0
48.8
6.9
33.1
11.2
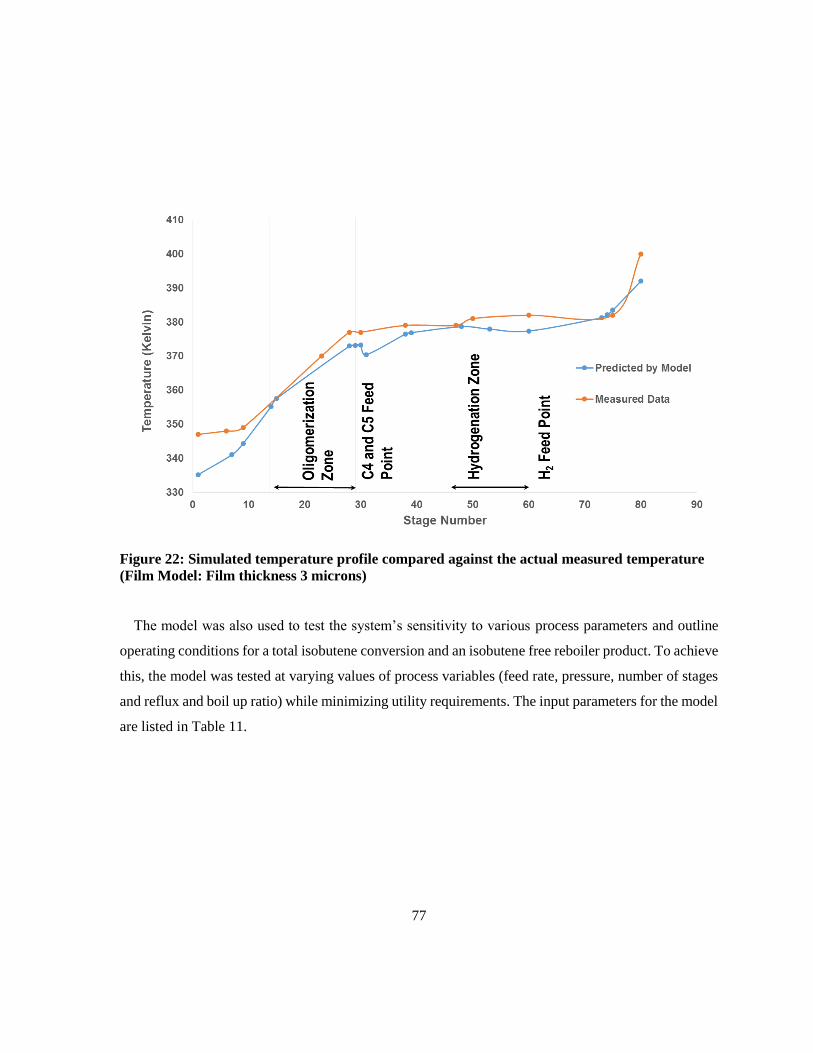
77
Figure 22: Simulated temperature profile compared against the actual measured temperature
(Film Model: Film thickness 3 microns)
The model was also used to test the system’s sensitivity to various process parameters and outline
operating conditions for a total isobutene conversion and an isobutene free reboiler product. To achieve
this, the model was tested at varying values of process variables (feed rate, pressure, number of stages
and reflux and boil up ratio) while minimizing utility requirements. The input parameters for the model
are listed in Table 11.

A distributed film model for fast reactions in a CD process
78
Feed (mole/s) Isobutene 0.00025 mole/s
Cyclopentane 0.00027 mole/s
Hydrogen 0.00008 mole/s
Reflux Ratio (Internal Reflux) 1 (Total reflux)
Vapor Boil-up Ratio 8
Column Temperature 345-395 K
Pressure (psig) 140 psi
Table 11: Operating conditions in the film model for a total isobutene conversion and an
isobutene free reboiler product
For the above-mentioned operating variables, the model predicted a reboiler product comprising of
22 % mole isooctane, 3% mole isooctene, 10% mole dodecene, and 65% mole isopentane. The
corresponding condenser and reboiler duties were 1994 W and 2043 W respectively per kg of isooctane
produced. Figure 23 depicts the concentration profiles along the column. The mole fraction of the
reacting monomer, isobutene, continuously drops from the top to the bottom. There is a sharp peak in
mole fraction around stage 30 due to the feed injection (feed line was not heated) at this stage. Below
the condenser the concentration decreases because of physical separation while in the dimerization
zone, because of the simultaneous reaction and separation, the slope of the curve is much higher. The
mole fraction of the dimerization product, isooctene, first increases in the dimerization zone and then
decreases in the hydrogenation zone. The mole fraction of the final product, isooctane, is zero in the
zones above the hydrogenation because it is the least volatile component. Isooctane starts to increase
in the hydrogenation zone to about 22% in the reboiler.
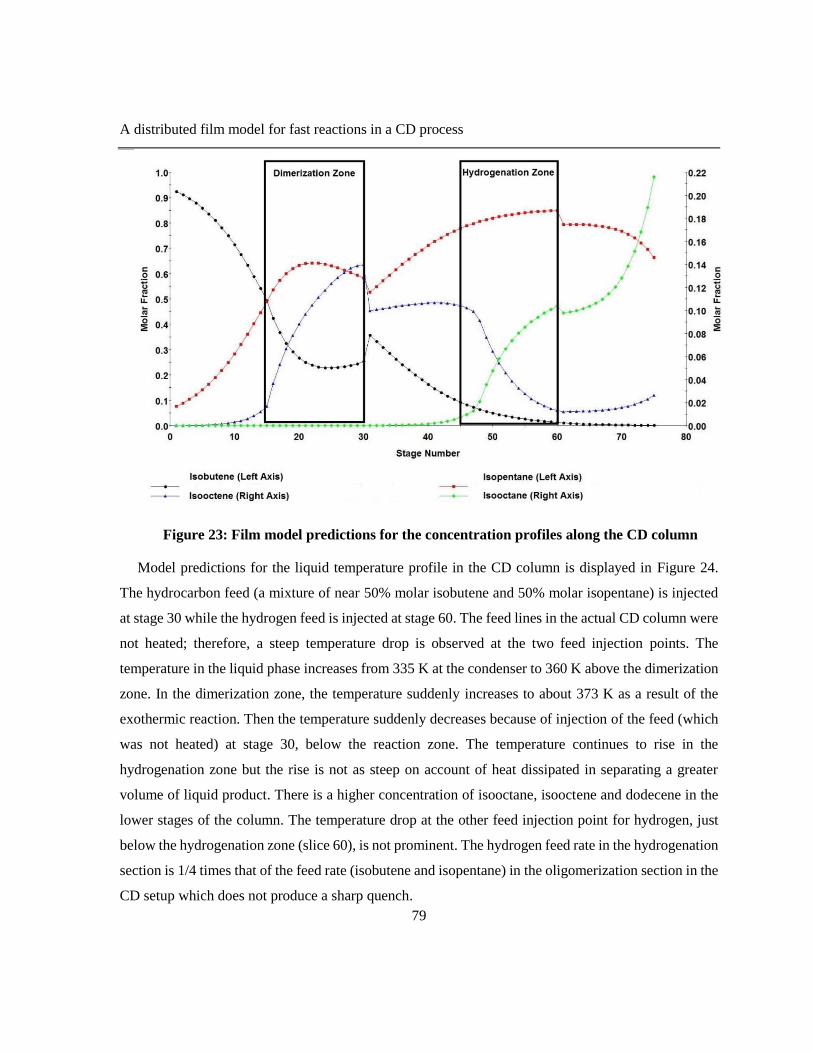
A distributed film model for fast reactions in a CD process
79
Figure 23: Film model predictions for the concentration profiles along the CD column
Model predictions for the liquid temperature profile in the CD column is displayed in Figure 24.
The hydrocarbon feed (a mixture of near 50% molar isobutene and 50% molar isopentane) is injected
at stage 30 while the hydrogen feed is injected at stage 60. The feed lines in the actual CD column were
not heated; therefore, a steep temperature drop is observed at the two feed injection points. The
temperature in the liquid phase increases from 335 K at the condenser to 360 K above the dimerization
zone. In the dimerization zone, the temperature suddenly increases to about 373 K as a result of the
exothermic reaction. Then the temperature suddenly decreases because of injection of the feed (which
was not heated) at stage 30, below the reaction zone. The temperature continues to rise in the
hydrogenation zone but the rise is not as steep on account of heat dissipated in separating a greater
volume of liquid product. There is a higher concentration of isooctane, isooctene and dodecene in the
lower stages of the column. The temperature drop at the other feed injection point for hydrogen, just
below the hydrogenation zone (slice 60), is not prominent. The hydrogen feed rate in the hydrogenation
section is 1/4 times that of the feed rate (isobutene and isopentane) in the oligomerization section in the
CD setup which does not produce a sharp quench.

80
Figure 24: Simulated Liquid Temperature Profile in the CD column
330
340
350
360
370
380
390
400
0 10 20 30 40 50 60 70 80 90
Te
mp
era
ture
(K
elv
in)
Stage Number
Temperature Liquid Phase
Dimerization Zone Hydrogenation Zone
Feed for C4
Feed Injection Hydrogen

81
3.4 More pilot experiments simulated using the film model
The film model was further tested against pilot plant data available for simulation of cases of pilot plant
experiments where the feed rate of the monomer isobutene was high. Experiments CD 2-5 and CD 2-6
conducted by Yongqiang Xu[33] in our research group featured higher isobutene and hydrogenation
rates. The rationale for increasing the feed rates for these experiments was to test if the hydrogenation
would be enhanced, which was indeed observed in real data. These two experiments were chosen for
simulation studies to test if the film model is able to study the system at varying feed rates. Changing
the feed rate changes the Reynold’s number which changes the calculation for mass transfer coefficients
and the Hatta Number.
The CD experimental runs CD 2-5 and CD 2-6 were simulated by the film model. A film thickness of
4.0 microns was found to be the best fit match the experimental data. Model predictions for the liquid
composition of reboiler products were compared against measured data. Results are present in Table
12. It can be seen from the table that overall a very good agreement between the measured and
simulated liquid weight composition in the reboiler was found.
The success of the model to simulate the experimental data at different feed rates and process conditions
with a good match demonstrates that the film model is applicable towards study of the isooctane system
over a wide design space.

82
Table 12: Reboiler mass composition results: Film Model predictions versus experimental results for experiments CD2-5 and CD 2-6
(C8=Isooctene, C8A =Isooctane)
RUN#
P
(psig)
Hydrogen
Feed Rate
(L/h)
Feed rate
(g/h)
Experimental Results (wt. %)
Reboiler Concentrations
Model Predictions (wt. %)
Reboiler Concentrations
C4 C5 C8 C8A C12 C4 C5 C8 C8A C12
CD2-5
90
10.41
C4: 91.31
C5: 52.30
0
35.9
5.6
27
36.7
21.7
0
42.3
5.3
38.3
14.1
CD2-6
90
10.40
C4: 85.22
C5: 67.07
0
45.0
3.7
33.7
17.7
0
52.6
4.0
35.2
12.2

83
3.5 Comparison between the film model and the C4 Model for the isooctane
process
One of the principal aims of developing the film model was to improve over the predictions of the C4
model towards the isooctane process. The film model, indeed is a modification of the 3 phase NEQ
concept with a solid-liquid film interface introduced in the mass transfer and heat transfer model. The
film model was now compared against the C4 model in matching the pilot plant data. Table 13 lists
the comparisons between the two models for reboiler concentrations of two pilot plant experiments. It
is evident that the film model matches the reboiler concentration readings more accurately than the
original C4 model. In particular, the model improves the under predictions of isooctane that was a
notable failure of the C4 model.
Predictions for the temperature profile along the column by the two models were also compared
against pilot plant data. Figure 25 shows plots of the model temperature profiles against experimental
data. The film model matches the temperature profile along the column more closely; the film model
curve twice intersects the measured profile. It is to noted that there was a constant gap of 10-15 K
between the measured temperature profile and the C4 model prediction for temperature.
We thought of reasons for why the film model is able to better predict the concentrations of the
reaction products. Since the same kinetic data was employed in both the models, we started with an
initial investigation into mass transfer. In the C4 model, the binary mass transfer coefficients for the
liquid and vapor and solid-liquid films for the random packing in the non-reaction zones were estimated
using the empirical correlations developed in our catalytic distillation modeling group. The mass
transfer coefficients were dependent on the liquid flow, wetting and the activity on the outer layer but
were independent of the reaction rate. In the film model, the mass transfer in the solid-liquid film is
coded so as to depend on the reaction rate and is actually synergized by the reaction which leads to
prediction of higher reaction rates, faster transport and product composition.
To further validate our hypothesis, we tested if the system was indeed mass transfer controlled. The
model’s response to different factors was carefully examined. We tested the dependence of the
isooctane composition in the reboiler on the hydrogen feed rate, reaction constant parameters, mole
A distributed film model for fast reactions in a CD process
84
ratio of isobutene/hydrogen in the feed, pressure, number of stages and the mass transfer coefficients.
A change in rate constants brought no appreciable effects in the isooctane productivity. This showed
that the process is not kinetically controlled. The factor most significantly affecting the isooctane
reboiler composition was the binary vapor phase mass transfer coefficient. Increasing it by a factor of
1.2 almost doubled the hydrogenation conversion. The heavy dependence of the model results on the
mass transfer coefficients as opposed to the reaction rate validates the idea of the system being mass
transfer controlled.
Table 14 shows the predicted hydrogenation rates by the C4 model and the distributed film model.
A faster transport of isooctene in the L-S film aided by the hydrogenation reaction leads to a higher
isooctene conversion and consequent higher isooctane concentration in the reboiler. The dodecene
concentrations are near identical in both the models, since the dodecene hydrogenation reaction was
not considered in either of the models. Dodecene model predictions are expectedly quite lower
compared to experimental data, which also influences the isopentane concentration. This is because of
absence of kinetic data on the reaction between isooctene and isobutene; in the model, the rate constants
were assumed to be the same for the trimerization and dimerization reactions.

85
Figure 25: Simulated liquid phase temperature profiles against experimental data (Experiment #CD 2-2/Film thickness 3 micro

86
Table 13: Comparisons of predictions for reboiler composition: Film Model versus the C4 Model (C8=isooctene, C8A =isooctane)
Table 14: Predicted Hydrogenation Rates: Film Model and the C4 Model
Run # CD 2-2 P
(psig)
Hydrogen
Feed (L/h)
Feed Rate (g/h) Reboiler Concentrations (wt %)
C4 C5 C8 C8A C12
Experimental Data 90 6.85 C4 : 59.96, C5:67.07 0 52.85 3.69 26.9 16.57
C4 Model 0 63.6 2.8 22.3 10.3
Film Model (Thickness 3 microns) 0 51.6 4.1 28.2 16.1
Run # CD 2-4 P Hydrogen
Feed
Feed Rate (g/h) Reboiler Concentrations (wt %)
C4 C5 C8 C8A C12
Experimental Data 90 7.99 C4 : 76.67, C5:52.30 0 39.54 7.0 31.4 22.10
C4 Model 0 53.1 8.4 26.6 11.9
Film Model (Thickness 3 microns) 0 48.8 6.9 33.1 11.2
Hydrogenation Reaction Rate (Stage 50)
3 phase NEQ model 2.974E-6
Distributed Film Model (Thickness 3 microns) 6.60E-6

87
3.6 Conclusions
The concept of hydrogenation occurring at lower pressure in a CD column has been intriguing
researchers. A few ideas have pointed to an improved mass transfer in the CD column that results in
this phenomenon. Formulating a mathematical concept to understand the process was a challenge. The
concept of the reaction occurring in a solid-liquid film on the catalyst was introduced in the CD system
tested for a CD system where the mathematical principle is that the reaction in the film would aid the
mass transfer leading to improved process performance.
The concept of a solid-liquid film was successfully coded into a steady state gPROMS CD model for
the isooctane process. Because of indexing of the differential problem via finite differences method,
the total number of equations and corresponding unknown variables in the model were higher (375,000)
and the model had a higher execution time (465 seconds). The model indeed calculated higher
hydrogenation rates and more accurate predictions for isooctane reboiler compositions. The model
predictions are in good agreement with the experimental data for the isooctane concentrations in the
reboiler. The model predicted temperature profile also closely matches the measured temperature
profile. This also added to an important objective of improving the C4 model.
An examination of the effects of the mass transfer and the kinetic parameters on the process
performance proved that the process indeed is mass transfer controlled, an assumption that was the
contributing idea for model development. It is highly desirable to now test the film model towards other
chemical systems in CD so as to confirm the model’s versatility and flexibility.

88
Chapter 4
Modeling of benzene hydrogenation and hydrogenation of acetone
to methyl isobutyl ketone in a Catalytic Distillation system using
the Film Model
Validation is the most incomprehensible part of developing a model. The power of a model or
modelling technique is a function of validity, credibility, and generality. Various validation schemes
(both quantitative and qualitative) and techniques in practice, have been proposed to test the credibility
and validity of different simulation models, however no single procedure can suit all the models [128].
Validation, differing from case to case, is both an art and a science, requiring creativity and insight.
The film model developed in chapter 2 was tested against isooctane pilot plant data and the C4 model.
In predictive validation scheme proposed by Sargent [129], the model is used to predict the system’s
behavior, and then comparison is made between the real system behavior and the model’s forecast to
determine if they are the same. Conceptual models should have some degree of logical self-consistency
or coherence with other concepts and conceptual models in the discipline.
Studies were also conducted to test for the utility and effectiveness of the film model towards
modeling other kinetic systems involving hydrogenation. The goal is to verify if the model can be
applied to depict performance of other CD systems involving other chemical components and different
phase and kinetic behavior. The systems studied are hydrogenation of benzene to cyclohexane and
production of methyl-isobutyl ketone (MIBK) from acetone.

89
4.1 Hydrogenation of Benzene to Cyclohexane
4.1.1 Background
Benzene, C6H6, is a volatile, clear, colorless, and flammable liquid aromatic hydrocarbon possessing
a distinct, characteristic odor. It is the simplest aromatic compound, with a six carbon ring, a hydrogen
atom attached to each carbon atom, and alternating double bonds in the ring structure. It occurs naturally
in fossil raw materials such as crude oil and coal tar. Benzene is industrially produced by three major
processes: catalytic reforming, toluene hydro-dealkylation, and steam cracking.
Benzene hydrogenation to cyclohexane (Figure 26) is a major petrochemical process. Currently
almost all cyclohexane is manufactured by hydrogenating pure benzene. Cyclohexane (C6H12) is a high
volume chemical with the total world production exceeding 1.8 million gallons of which the US annual
capacity is 600 million gallons [130]. The United States, Western Europe, and China are the main
capacity centers for cyclohexane and much of the global demand is driven by China. In the years 2014-
19, global cyclohexane capacity is expected to increase by about 12%, propelled by the capacity surge
in China[131]. About 90% of the world’s production of cyclohexane is used for manufacturing nylon
6 and 66. Around 7-9% of cyclohexane is used as a solvent[130, 131].
Figure 26: Benzene Hydrogenation to Cyclohexane
Gasoline is a complex mixture of hydrocarbons, generally falling in the range of C6-C10. Gasoline
reforming is the process of altering the composition of gasoline to achieve a higher octane rating.
Benzene produced in the reforming process, is an undesirable carcinogenic impurity in gasoline, which
is being regulated by the EPA due to studies showing a link between increased incidences of leukemia
in humans exposed to benzene. Due to this, refining processes have to focus not only on producing high

Modeling of benzene hydrogenation and hydrogenation of acetone to methyl isobutyl ketone in a
Catalytic Distillation system using the Film Model
90
octane gasoline but also meeting the environmental standards, benzene reduction being one or the major
regulations. Since most of the benzene is produced in the reformate stream, the benzene has to removed
downstream from the reformer. It is here that hydrogenation to cyclohexane is a promising option. The
source for the hydrogen used in the reaction is typically obtained from a petroleum hydrocarbon
catalytic reforming operation. The process of benzene hydrogenation, catalyzed by the metals of group
VIII, has been known and described in the literature for a long time. Despite its apparent simplicity, the
reaction has evolved through many variations and has given rise to many different processes (liquid
phase hydrogenation with a suspended catalyst in the IFP process[132], Hydra Process developed by
UOP[132]). The successful production of cyclohexane suitable for petrochemical production requires
the resolution of two critical problems:
1. The reaction is strongly exothermic. (ΔH = -208 KJ/mole)
2. The cyclohexane product must be pure to be applicable for use as a precursor in high quality
nylon manufacture.
The originality of any proprietary process for cyclohexane should therefore be closely related to the
successful resolution of these two problems. A CD process in particular, would allow good temperature
control and substantial removal of heat of reaction. The trickle bed conditions in CD would allow
efficient contact of hydrogen and benzene. Furthermore, CD experiments on benzene hydrogenation
in literature[123, 124] suggest that the hydrogenation partial pressure in a CD operation would be
significantly lower than a conventional fixed bed process. These points motivate our efforts to model a
CD process for this kinetic process. Papers on benzene hydrogenation to cyclohexane in a CD process
are rare in open literature.
Therefore, the objectives of this research are:
1. To investigate the efficacy of CD towards for production of a near pure cyclohexane product in
the benzene hydrogenation process.
2. In case of a feasible CD process, to outline the design variables for the benzene conversion.
3. Verify through modeling results, the phenomena of lower hydrogenation pressure observed in
CD processes in comparison to a conventional process.

Modeling of benzene hydrogenation and hydrogenation of acetone to methyl isobutyl ketone in a
Catalytic Distillation system using the Film Model
91
4. Advance the film model by testing its efficacy towards a new hydrogenation reaction system
4.1.2 Simulation of a CD process for hydrogenation of benzene to Cyclohexane
The film model presented in Chapter 3 in the Thesis is applied to simulate a CD process for
hydrogenation of benzene to cyclohexane. The aim firsthand is to investigate if the model is able to
match the results presented in literature on benzene hydrogenation in CD systems to some degree. It
would also enable us to study the effects of main operating variables, illustrate the kinetic rate and mass
transfer resistances and optimize the operating conditions.
The system is composed of three reactive components – benzene, hydrogen and cyclohexane and two
inert components isooctane and dodecane. The physical properties of these components are listed in
Table 15.
Table 15: Physical Properties of the components of the benzene hydrogenation system at 1 atm
and 25°C
The design of a CD configuration for a given kinetic system opens up intriguing points to ponder for
a given kinetic system. The feed rates and composition, point of injection and operating variables
(reflux and vapor boilup ratios) of the process are important elements in the design that would affect
the final product. A quick literature survey was conducted for proposed CD designs for the benzene-
cyclohexane system to come up with a process design to be adapted into the gPROMS modeling
environment. Several different scenarios were studied to adopt the most efficient design providing the
best results that are presented.
Property Benzene Cyclohexane Hydrogen
MW (g/mol) 78 84 2
Boiling Point (oC) 80.1 80.74 -253
Density (g/cm3) 0.876 0.779 0.08988

Modeling of benzene hydrogenation and hydrogenation of acetone to methyl isobutyl ketone in a
Catalytic Distillation system using the Film Model
92
A CD process for the production of cyclohexane by the hydrogenation of benzene has been discussed
in a patent[124] wherein the reaction mixture is boiling under low hydrogen partial pressure in the range
of about 0.1 psi to less than 200 psia at 0 to 350 psig overhead pressure (Figure 24 B). The benzene is
fed at a point above the catalyst bed and the hydrogen is fed below the catalyst bed. All of the overheads
are returned as reflux to provide cooling within the catalyst bed. Another CD configuration (Figure 27
A) for benzene hydrogenation study is presented in literature where the benzene and hydrogen streams
enters the column below the catalyst bed[133]. We tested both these designs in our gPROMS models
(comparison summarized in Table 16) and found superior results for benzene hydrogenation under the
same sets of conditions when both the benzene and hydrogen feeds are injected below the catalyst
loading in our design. Our gPROMS model is hence based on a design in (Figure 27 A) = the operating
conditions for 99 % cyclohexane in product are discussed in Table 17.
We pondered on the reasons for the difference observed in benzene conversion between the two
configurations listed in Table 16. A probable reason could be that part of benzene if injected above the
catalyst zone, in configuration B would tend to rise up and escape contact with hydrogen in the reaction
zone leading to lesser productivity of cyclohexane.
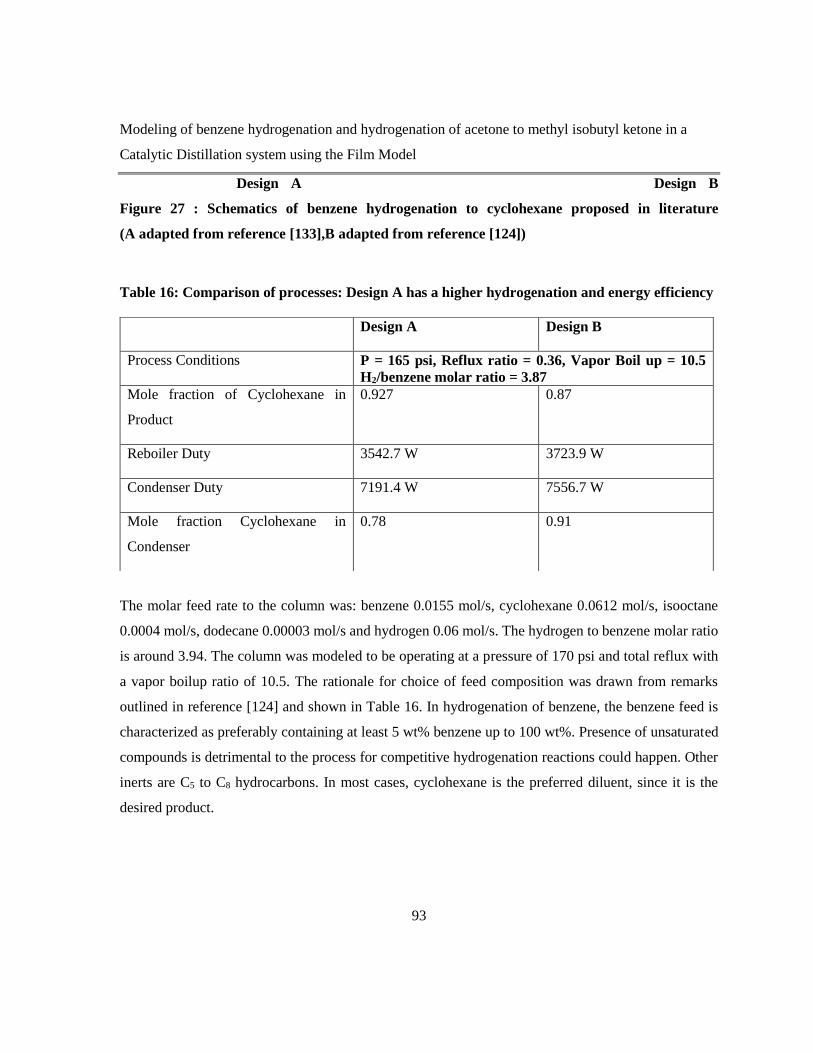
Modeling of benzene hydrogenation and hydrogenation of acetone to methyl isobutyl ketone in a
Catalytic Distillation system using the Film Model
93
Design A Design B
Figure 27 : Schematics of benzene hydrogenation to cyclohexane proposed in literature
(A adapted from reference [133],B adapted from reference [124])
Table 16: Comparison of processes: Design A has a higher hydrogenation and energy efficiency
The molar feed rate to the column was: benzene 0.0155 mol/s, cyclohexane 0.0612 mol/s, isooctane
0.0004 mol/s, dodecane 0.00003 mol/s and hydrogen 0.06 mol/s. The hydrogen to benzene molar ratio
is around 3.94. The column was modeled to be operating at a pressure of 170 psi and total reflux with
a vapor boilup ratio of 10.5. The rationale for choice of feed composition was drawn from remarks
outlined in reference [124] and shown in Table 16. In hydrogenation of benzene, the benzene feed is
characterized as preferably containing at least 5 wt% benzene up to 100 wt%. Presence of unsaturated
compounds is detrimental to the process for competitive hydrogenation reactions could happen. Other
inerts are C5 to C8 hydrocarbons. In most cases, cyclohexane is the preferred diluent, since it is the
desired product.
Design A Design B
Process Conditions P = 165 psi, Reflux ratio = 0.36, Vapor Boil up = 10.5
H2/benzene molar ratio = 3.87
Mole fraction of Cyclohexane in
Product
0.927 0.87
Reboiler Duty 3542.7 W 3723.9 W
Condenser Duty 7191.4 W 7556.7 W
Mole fraction Cyclohexane in
Condenser
0.78 0.91

Modeling of benzene hydrogenation and hydrogenation of acetone to methyl isobutyl ketone in a
Catalytic Distillation system using the Film Model
94
Reaction kinetics for the catalyst section have been taken from literature[134]. The following equation,
derived for liquid-phase benzene hydrogenation on a misch metal nickel-five (MINi5) catalyst under
analogous conditions (reaction temperature 393-513 K) was used:
Table 17: Conditions and results for a CD process for hydrogenation of benzene [124]
Configuration I Configuration II Configuration III
Time on stream, hrs 134 254 314
Pressure, psig 200 200 200
Reaction Temperature, °F
Top Catalyst Bed
Bottom Catalyst Bed
367
351
381
349
383
346
Internal Reflux L/F 23.6 19.1 15.5
Feed Rate lb/hr liquid 3.1 6.0 8.1
H2 Rate schf gas 151 151 151
H2/Benzene mole ratio 9.9 5.2 3.8
Benzene in feed, wt % 99.93% 99.93% 99.93%
H2 psi, partial pressure 75.5 77.6 79.9
Benzene in bottom, wt% 8 ppm <250 ppm 6.1%
Bottom cyclohexane, wt% 99.9 99.6 93.1
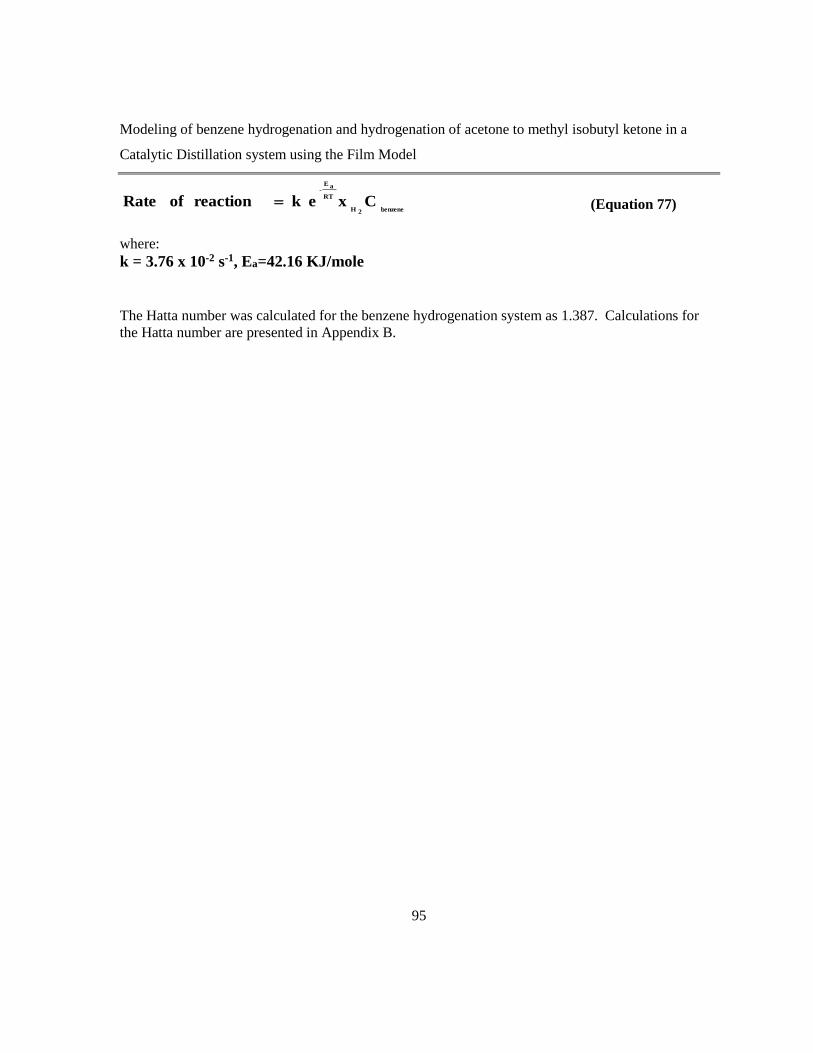
Modeling of benzene hydrogenation and hydrogenation of acetone to methyl isobutyl ketone in a
Catalytic Distillation system using the Film Model
95
benzene2H
RT
aE-
Cxe kreaction of Rate (Equation 77)
where:
k = 3.76 x 10⁻² s-1, Ea=42.16 KJ/mole
The Hatta number was calculated for the benzene hydrogenation system as 1.387. Calculations for
the Hatta number are presented in Appendix B.

Modeling of benzene hydrogenation and hydrogenation of acetone to methyl isobutyl ketone in a
Catalytic Distillation system using the Film Model
96
Figure 28 shows the CD model in gPROMS environment. The CD model is composed of a condenser,
reboiler, a reaction zone and 4 non-reacting zones connected together in series. It is assumed that the column
is composed of 250 non-equilibrium stages (five zones, 50 stages each zone). The column stages have been
numbered from top to bottom in this investigation. The first stage is the reflux drum and the last stage is
the reboiler drum. On each reactive stage, film model equations are written for mass and energy balance
and reaction and transport phenomena. Non-reactive stages featured mass and energy balance and transport
equations. On account of lack of experimental data, a film thickness of 3 microns was chosen. Benzene is
injected just below the catalyst loading on stage 100, hydrogen is injected on stage 200. Reaction occurs on
stages 50-100 in zone D marked orange.
Figure 28: CD model in gPROMS for hydrogenation of benzene
Multiflash software is used to set the equation of state models and calculate the physical properties for the
pure components and their mixtures in the vapor, liquid, and solid phases. The component thermos- physical
properties are selected from the DIPPR databank. The model comprises of 1000000 variables in 62000
equations and runs in around 67 seconds on a 4 GB RAM.

Modeling of benzene hydrogenation and hydrogenation of acetone to methyl isobutyl ketone in a
Catalytic Distillation system using the Film Model
97
4.1.3 Results and Discussion
The model was tested at varying values of process variables (feed rate, pressure, and reflux and boil up
ratio). The objective is to outline conditions for a pure cyclohexane product in the reboiler with efficient
hydrogen uptake (lower hydrogen partial pressure and energy usage). The purity level of cyclohexane
required for its oxidation for use to produce nylon is more than 99%.[135]
The column operating conditions for the model are listed in Table 18. These were set values for getting
around 99.24 % mole fraction of cyclohexane in the reboiler. The model predictions are in agreement with
the process idea disclosed in patent [124] that discusses the scope of hydrogenating benzene in a catalytic
distillation column in the pressure range of 0 to 200 psig and in the temperature range of 280° to 380° F
(410-466 K).
Table 18: Input values for getting a near pure cyclohexane in the reboiler
Feed (mole/s) Benzene 0.0155 mole/s
Cyclohexane 0.0612 mole/s
Isooctane 0.004 mole/s
Dodecane 0.00003 mole/s
Hydrogen 0.06 mole/s
Reflux Ratio (Internal Reflux) 0.344
Vapor Boil-up Ratio 10.5
Column Temperature 440-460 K
Pressure (psig) 170 psi
Model predictions for the liquid temperature profile in the CD column is displayed in Figure 29. The
system being mass-transfer controlled, the nature of the temperature profile can be best understood by
studying the mass transfer coefficients. The binary mass transfer coefficients for the liquid and the vapor
films and binary mass transfer coefficient for the solid-liquid film are higher in the top sections of the
column. This results in higher mass transfer rates resulting in higher reaction and greater heat dissipation.
The temperature steadily decreases in the non-reaction zones before increasing in the lower section of the
column due to the reboiler duty. A heat quench is observed at feed injection points for benzene and
hydrogen.
The molar compositions for the components are plotted in Figure 30. Both benzene and cyclohexane are
injected around stage 150, there is a feed quench at this point. Benzene is consumed in the reaction and

Modeling of benzene hydrogenation and hydrogenation of acetone to methyl isobutyl ketone in a
Catalytic Distillation system using the Film Model
98
hence its concentration drops in the upper zones of the column whereas cyclohexane is formed and its
concentration increases. Hydrogen is injected around stage 200 and its concentration dips in the upper
stages due to its consumption in the hydrogenation reaction.

Modeling of benzene hydrogenation and hydrogenation of acetone to methyl isobutyl ketone in a Catalytic Distillation system using the Film
Model
99
Figure 29: Model prediction for liquid temperature profile along the CD column (Patent [124] presents scope of hydrogenation in the
range 410 to 466 K) Film thickness : 3 microns

Modeling of benzene hydrogenation and hydrogenation of acetone to methyl isobutyl ketone in a Catalytic Distillation system using the Film
Model
100
Figure 30: Film Model predictions for vapor composition for benzene, cyclohexane and hydrogen along the CD column

Modeling of benzene hydrogenation and hydrogenation of acetone to methyl isobutyl ketone in a
Catalytic Distillation system using the Film Model
101
The effect of major process variables on the reboiler product composition are now discussed.
Influence of Reaction Rate
The film model was adopted for studying the benzene hydrogenation process under the hypothesis that
hydrogenation reactions are very fast and severely mass-transfer controlled and hence, would occur in the
thin film of liquid over the liquid-solid (L-S) interface under the trickle bed conditions inside the RD
column. While kinetic parameters were imported from literature [136], we investigated the influence of
kinetic parameters on the cyclohexane composition in the product. A change in rate constants brought no
appreciable effects in the benzene conversion. This supports our assertion of the process not being kinetic
controlled.
Role of Mass Transfer
The binary mass transfer coefficients for the liquid and vapor films and the solid-liquid film for the random
packing in CD zones are estimated using the empirical correlations developed in our group. These
coefficients would differ for different packings in different units. Since our objective was to study the effect
of mass transfer on the process, we tested the model predictions for different values of mass transfer
coefficients. Increasing the mass transfer coefficients by a factor of 1.5 lead to increase in benzene
composition in the reboiler from 0.927 to 0.9924. This was achieved in small incremental steps. It is to be
noted that when there are large changes in parameters, getting convergence from the model is challenging.
These results affirm our hypothesis of mass transfer severely controlling the benzene hydrogenation
process. This observation leads to a conclusion that development of a suitable packing is a significant design
factor for an efficient benzene hydrogenation process.
Effect of Hydrogen to Benzene Injection Rate Ratio
The hydrogen rate was adjusted so that it was sufficient to support the hydrogenation reaction and replace
the hydrogen lost from the catalyst but kept below that which results in flooding of the column. In the patent
[124] presented on CD for benzene hydrogenation, the mole ration of hydrogen to benzene was varied
between 3:1 to 15:1. The hydrogen to benzene molar ratio in the model for more than 99% cyclohexane in
the product is around 3.94. The cyclohexane molar composition in the feed is dependent on the
hydrogen/benzene ratio. It increases when either the benzene feed is decreased or the hydrogen feed is
increased.

Modeling of benzene hydrogenation and hydrogenation of acetone to methyl isobutyl ketone in a
Catalytic Distillation system using the Film Model
102
At lower injection rates of hydrogen, almost all of the hydrogen is consumed. At very high
hydrogen/benzene ratio in the injected feed, some non-reacted hydrogen remains at the top of the column
which might pose a safety risk.
Effect of Pressure
Increasing the column pressure led to an increased concentration of cyclohexane in the product. A higher
partial pressure of hydrogen leads to increased dissolution in the liquid and faster reaction rates due to
higher hydrogen concentration dissolved in the film over the wetted catalyst as well as higher partial
pressure of the hydrogen over the dry solid catalyst. However, this effect is less pronounced than mass
transfer or feed injection ratio. Increasing the pressure from 170 psi to 250 psi brought an increase in
cyclohexane mole fraction in reboiler from 0.88 to 0.92.
Effect of Vent
The model uses a partial condenser with a vent. Increasing the vent which is mostly gaseous hydrogen
increases the cyclohexane composition in the reboiler. This effect is very minimal.
Effect of Internal reflux ratio
Increasing the internal reflux does not have any appreciable effect on the overall benzene conversion. An
increase in internal reflux increases the catalyst wetting but the process is overall mass transfer controlled.
Effect of reboiler vapor-boil up ratio
The reboiler vapor boil-up ratio directly affects the energy balance. An increase in reboiler vapor boilup
ratio significantly increases the condenser and reboiler duties but does not have any significant effect on
the overall benzene conversion.
Effect of film thickness on productivity of process
While the research effort was largely focused around investigating the efficacy and performance of the
film model, the effect of the film thickness was investigated on the productivity of the process. Table 19
shows results for product cyclohexane composition in the reboiler. Other factors remaining same, a thicker
L-S film adversely affects the productivity (cyclohexane product molar concentration) of the process
because of a higher mass transfer resistance.
A mass balance on the whole unit with process parameters is summarized in Figure 31.

Modeling of benzene hydrogenation and hydrogenation of acetone to methyl isobutyl ketone in a Catalytic Distillation system using the Film
Model
103
Figure 31: Mass balance results and process parameters for the film model (Modeling of benzene hydrogenation)

Modeling of benzene hydrogenation and hydrogenation of acetone to methyl isobutyl ketone in a Catalytic Distillation system using the Film
Model
104
Table 19: Sensitivity of the film thickness towards cyclohexane productivity (Modeling of benzene hydrogenation)
P
(psig)
Hydrogen Feed
Rate (mol/s)
Feed rate
(mol/s)
Model Predictions (mol. %) Reboiler Concentrations for Cyclohexane
Film Thickness
1 micron
170
0.060
Benzene: 0.0155 Cyclohexane:0.0612
0.9935
Film Thickness 2 microns
170
0.060
Benzene: 0.0155 Cyclohexane:0.0612
0.9931
Film Thickness
3 microns
170
0.060
Benzene: 0.0155 Cyclohexane:0.0612
0.9924
Film Thickness
4 microns
170
0.060
Benzene: 0.0155 Cyclohexane:0.0612
0.9901
Film Thickness
5 microns
170
0.060
Benzene: 0.0155 Cyclohexane:0.0612
0.9863

105
4.1.4 Conclusions
A number of objectives were achieved by the research studies discussed in this chapter. The
successful application of the film model to the case of catalytic hydrogenation of benzene in a
distillation column produced reasonable results that were also proposed and reasoned by other
researchers. In particular, the following objectives were achieved:
1. The film model proposed in Chapter 2 for studying very fast heterogeneous reaction systems
in a CD column is able to picture the phenomenon of benzene hydrogenation with realistic
results. The successful integration of the benzene cyclohexane system into the film model
adds validity to versatility of the model towards hydrogenation systems.
2. The hydrogenation of benzene to cyclohexane is mass transfer controlled. (evidenced by the
strong dependence of the benzene conversion on the value of mass transfer coefficients). This
was our hypothesis and motivation for choosing the film model which is now verified by the
results.
3. It is possible to produce more than 99 % pure cyclohexane in a CD process at a significantly
lower hydrogen partial pressure. A CD process would result in large scale reductions in cost
and energy requirements and would be safer. The technology would be a salient example of
green engineering.
4. The study outlines individual effects of major process variables towards benzene conversion
that would aid in process design of a CD processes for benzene hydrogenation.

106
4.2 Production of Methyl Isobutyl Ketone (MIBK) via the Aldol condensation of
Acetone in a CD process
4.2.1 Background
A 23 ft (7 m) pilot CD process unit is operational in our laboratory where pilot-scale testing is done for
various reactions in continuous mode to study different heterogeneous catalyst systems. The CD reactor
apparatus was utilized for laboratory experiments for two processes - the isooctane process from
isobutene and MIBK process from acetone. Both these processes differ significantly in design and
operation and a number of changes were made in the CD pilot apparatus to switch to different reaction
modes. Process parameters such as location of feed inlets, state of feed, position of catalyst in the
column, column pressure, column internals (catalyst packing), condenser type and the residence time
were changed between the two processes. The CD isooctane process runs were operated via a total
condensation of the top product ( total reflux) with two reaction zones while the MIBK process operated
at partial reflux from the condenser ( overhead vent) and a single reaction zone. The isooctane research
hypothesized hydrogenation to occur in the gas phase [9] whereas the MIBK process considered
hydrogenation to occur in the liquid phase [137]. The column pressure in the isooctane process was
around 90 psig whereas the column pressure in the MIBK process was around 200 psig. The schematic
of the CD reactor apparatus for the MIBK process is shown in Figure 32.
The CD experiments conducted in our laboratory validated CD as a highly efficient and green hybrid
technology for MIBK synthesis from acetone[10] in a new, innovative process design that yielded very
promising and ground breaking results. Pilot runs yielded a MIBK wt % as high as 53% in the reboiler
product with higher product selectivity and conversion. This is pioneering since the state of the art
MIBK processes report MIBK in the product to be around 35 wt % which necessitates further
downstream refining. There were numerous other process merits observed such as reduced pressure
operations, higher catalyst shelf life, lower process costs, and more efficient energy usage and
emissions reduction. Furthermore, there were numerous conclusions drawn related to the process and
its dependence on different parameters. The results showed that the CD process for MIBK production

Modeling of benzene hydrogenation and hydrogenation of acetone to methyl isobutyl ketone in a
Catalytic Distillation system using the Film Model
107
was limited by hydrogen mass transfer and an increase in overhead distillate removal increased the
MIBK productivity.
Figure 32: Schematic for the CD apparatus for MIBK synthesis from acetone at University of
Waterloo[10]
Modeling objectives in this research is to describe these relevant phenomena to an appropriate level of
chemical engineering first principles representation. The model developed to simulate the process
should serve the following requirements:
1. The model should be able to depict the predictive representation of the key phenomena
occurring in the MIBK process, hydrogenation in this case.
2. The model results should be in agreement with the data obtained in the CD pilot runs

Modeling of benzene hydrogenation and hydrogenation of acetone to methyl isobutyl ketone in a
Catalytic Distillation system using the Film Model
108
3. The model should be able to validate the effect of key parameters outlined, such as hydrogen
mass transfer and overhead distillate rate.
The first modeling attempts were made at incorporating modifications in the existing three-phase, rate-
based non-equilibrium model developed for the isooctane process and to check if it was possible to
effectively simulate the changed column specifics, reaction chemistry and process design of the MIBK
CD runs. The total condenser model in the isooctane model was modified to accommodate the overhead
vent stream and kinetic rate expressions for additional reactions occurring in the reaction zone. CD
model equations in the column were changed to create a single reaction zone. Kinetic equations were
rewritten for hydrogenation in the liquid phase against gas phase. The model is represented in Figure
33.

Modeling of benzene hydrogenation and hydrogenation of acetone to methyl isobutyl ketone in a
Catalytic Distillation system using the Film Model
109
Figure 33: C4 Model Setup in gPROMS environment for the MIBK process
The equation for the partial condenser model coded in gPROMS are listed below:
Partial Condenser model
0i
producti,distillate
li
Ventiin,
V (Equation 78)
(A vent was described for the in-situ removal of water from the partial condenser)

Modeling of benzene hydrogenation and hydrogenation of acetone to methyl isobutyl ketone in a
Catalytic Distillation system using the Film Model
110
iVent
iVaporout
icondenser,y (Equation 79)
icondesner,l
i,distillatel
RatioReflux (Equation 80)
(i is the subscript representing ith component)
icondenser,x
icondenser,y
l
icondenser,
v
icondenser,
icondesner,α
(Equation 81)
NC
1iicondenser,
l
icondenser,l
il,x (Equation 82)
(Equilibrium relations for the components by relating to their vapor and liquid phase fugacity
coefficients)
Kinetic equations developed in our group for the MIBK sythesis entailing a liquid phase hydrogenation
of Mesityl Oxide to MIBK (Figure 34)were coded in the gPROMS model. The kinetic equations and
the associated Arhenius parameters were developed in our laboratory[138] and are listed as follows:

Modeling of benzene hydrogenation and hydrogenation of acetone to methyl isobutyl ketone in a
Catalytic Distillation system using the Film Model
111
Figure 34: Chemical transformation of acetone to MIBK via aldol condensation and
hydrogenation
WaterMO2Acetone 1k
2
WW
2
A1
1
)CK(1
Ckr
(Equation 83)
MIBKHydrogenMO 2k
2
WW
2
A1
1
)CK(1
Ckr
(Equation 84)
)RT
Eexp(Ak
a
jj
(Equation 85)
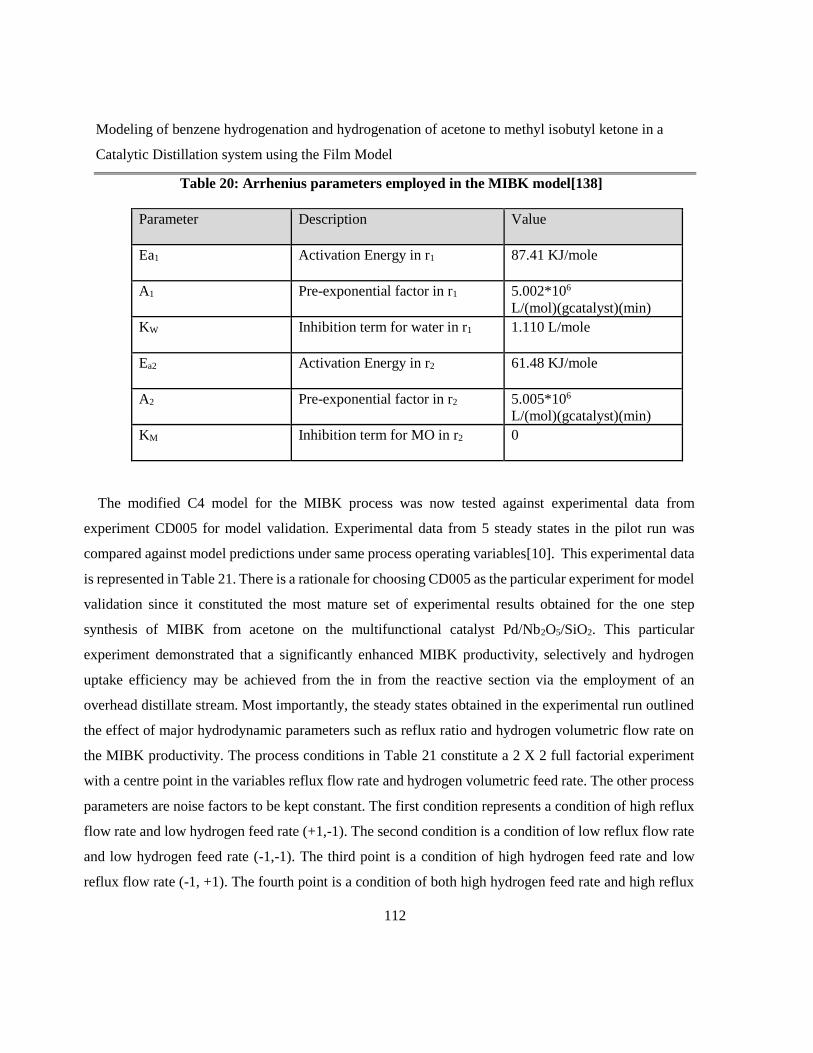
Modeling of benzene hydrogenation and hydrogenation of acetone to methyl isobutyl ketone in a
Catalytic Distillation system using the Film Model
112
Table 20: Arrhenius parameters employed in the MIBK model[138]
Parameter Description Value
Ea1 Activation Energy in r1 87.41 KJ/mole
A1 Pre-exponential factor in r1 5.002*106
L/(mol)(gcatalyst)(min)
KW Inhibition term for water in r1 1.110 L/mole
Ea2 Activation Energy in r2 61.48 KJ/mole
A2 Pre-exponential factor in r2 5.005*106
L/(mol)(gcatalyst)(min)
KM Inhibition term for MO in r2 0
The modified C4 model for the MIBK process was now tested against experimental data from
experiment CD005 for model validation. Experimental data from 5 steady states in the pilot run was
compared against model predictions under same process operating variables[10]. This experimental data
is represented in Table 21. There is a rationale for choosing CD005 as the particular experiment for model
validation since it constituted the most mature set of experimental results obtained for the one step
synthesis of MIBK from acetone on the multifunctional catalyst Pd/Nb2O5/SiO2. This particular
experiment demonstrated that a significantly enhanced MIBK productivity, selectively and hydrogen
uptake efficiency may be achieved from the in from the reactive section via the employment of an
overhead distillate stream. Most importantly, the steady states obtained in the experimental run outlined
the effect of major hydrodynamic parameters such as reflux ratio and hydrogen volumetric flow rate on
the MIBK productivity. The process conditions in Table 21 constitute a 2 X 2 full factorial experiment
with a centre point in the variables reflux flow rate and hydrogen volumetric feed rate. The other process
parameters are noise factors to be kept constant. The first condition represents a condition of high reflux
flow rate and low hydrogen feed rate (+1,-1). The second condition is a condition of low reflux flow rate
and low hydrogen feed rate (-1,-1). The third point is a condition of high hydrogen feed rate and low
reflux flow rate (-1, +1). The fourth point is a condition of both high hydrogen feed rate and high reflux

Modeling of benzene hydrogenation and hydrogenation of acetone to methyl isobutyl ketone in a
Catalytic Distillation system using the Film Model
113
flow rate (+1, +1). The final condition is the centre point of intermediate reflux flow rate and hydrogen
feed rate (0, 0). The centre point allows for modelling of nonlinear behavior.

114
Table 21: Process operating conditions and mass balance results for different steady states in the experimental run CD005
Run Acetone
Feed rate (g/hr)
Hydrogen Rate (L/hr)
STP
Reflux Ratio (%) MIBK Productivity
[g/hr*gCAT)
MIBK wt % in product
in product
1 140.6 10.2 97.1 0.096 12.7
2 140.6 10.9 82.7 0.229 30.2
3 140.6 60 88.5 0.334 44.6
4 140.6 60 97.5 0.372 52.3
5 140.6 35.9 95.4 0.288 41.5

Modeling of benzene hydrogenation and hydrogenation of acetone to methyl isobutyl ketone in a Catalytic Distillation system using the Film
Model
115
Table 22: Modified C4 model predictions against data from different steady states in the experimental run CD005
Run Hydrogen
Rate
(L/hr)
Reflux
Ratio
(%)
Acetone + water wt % in the
distillate
in product
MO wt% in reboiler MIBK wt % in reboiler
in product
Experimental Model Experimental Model Experimental Model
1 10.2 97.1 99.73 91.3 40.25 85.6 12.7 12.2
2 10.9 82.7 99.19 92.4 20.44 71.4 30.2 29.1
3 60 88.5 99.5 91.5 1.38 53.2 44.6 42.0
4 60 97.5 99.56 91.4 7.96 43.3 52.3 54.7
5 35.9 95.4 99.16 90.5 7.92 50.7 41.5 46.3

116
Comparison of the modified C4 model results listed in Table 22 to the experimental results shows that
while the model predictions match the predicted data in terms of MIBK wt % in the reboiler and the
acetone and water combined weight percentage in the condenser to a reasonable extent, the model fails
to match the mesityl oxide (MO) concentrations in the reboiler. Specifically, this means that the model
is under predicting the hydrogenation phenomenon as there is a greater concentration of unreacted MO
predicted by the model that should have been converted to MIBK. The model is also unable to correlate
the reflux ratio and hydrogen feed rate as prominent parameters for MIBK productivity that were
highlighted in experiments.
Since the experiments for the MIBK system were performed in the same CD pilot unit, for which the
binary mass transfer coefficients for the random packing in the non-reaction zones were estimated using
the empirical correlations developed our catalytic distillation modeling group, initial efforts to improve
the model’s predictions for the MIBK process were focused towards evaluating the kinetic model, to
check if the kinetic parameters fitted into the liquid phase Langmuir Hinshelwood model are
appropriate and reasonable or if the units for parameters used in the kinetics are misadjusted. While the
units for kinetic parameters were found to be correct, it was found that multiplying the kinetic
parameters by a factor of 1000 increased the model results for MIBK concentration in the reboiler. The
overall mass balance of acetone, mesityl oxide and MIBK and model results for their distribution
between the condenser and reboiler still were severely mismatched compared to experimental results.
This particular observation opened scope for further thought, as to, what could be an empirical
justification for a factor of 1000. This means the kinetics has to be improved and the multi-phase
process behavior has to correctly interpreted. It is quite logical to assume that in a CD packed column,
the catalyst packings are not totally immersed in a liquid and the wetting is controlled by process
parameters such as reflux flow rate, liquid and vapor flow rates, column void and packing internals etc.
Hydrogenation could hence occur on the “dry “active sites on the catalyst by the injected gas phase
hydrogen Furthermore due to the hydrodynamics and flow characteristics in a distillation column, the
wetted and dry areas of a catalyst are in a dynamic state and hence the exothermic heat from
hydrogenation is utilized for separation of the products and the catalyst does not suffer deactivation due

Modeling of benzene hydrogenation and hydrogenation of acetone to methyl isobutyl ketone in a
Catalytic Distillation system using the Film Model
117
to sintering. This hypothesis is also supported by observations of the CD pilot plant runs for MIBK
synthesis [10], where a lower reflux flow rate facilitates faster hydrogenation and more hydrogenated
product in the reboiler bottoms. At lower reflux, there is a shift towards a faster gaseous phase
hydrogenation regime since a lesser fraction of the catalyst bundle is in contact with the liquid.
Assuming a gas phase hydrogenation, the kinetic expression involving vapor phase concentrations and
partial pressures to appropriate power yields a factor close to 100. For a CD simulation study at 200 psi
and 450 K, the mole fraction of hydrogen dissolved in acetone on the dimerization zone stage was
around 0.000168 whereas its mole fraction in the vapor was 0.016.
A gas phase hydrogenation model if developed, for the MIBK process, should be transient since there
is constant switch between liquid and gas-phase hydrogenation regimes which are then decided by
column hydrodynamics. An accurate picturization of such a scenario would only by possible by
entailing computational fluid dynamics which was deemed not suitable in the time frame of this study,
in light of the other research goals.
The focus of our efforts in this thesis, is hence to develop a steady state model that would be versatile
and applicable to different CD hydrogenation systems and could demonstrate the influence of mass
transfer limitations on the overall process productivity. The model, specifically, should have the
following characteristics:
1. The model should serve as a predictive model and be able to match experimental data to an
appreciable extent.
2. The model should be able to correlate the dependence of MIBK productivity on reflux ratio
and hydrogen feed rate.
After the concept of the solid-liquid film was successfully applied towards studying the hydrogenation
processes for benzene hydrogenation and the isooctane process, efforts were directed towards testing
the film model’s applicability towards studying the MIBK process and to test its efficacy with respect
to the above mentioned characteristics. Since the film model is based on that postulate is that a
hydrogenation reaction in the solid/liquid film enhances mass transfer and the reaction itself is
accelerated via diffusion coupling, it is expected that the film model would predict faster kinetics and

Modeling of benzene hydrogenation and hydrogenation of acetone to methyl isobutyl ketone in a
Catalytic Distillation system using the Film Model
118
also improve the predictions for concentrations of products in condenser and reboiler. This is now
discussed in the following sections in this chapter.
4.2.2 Model architecture and implementation
The film model presented in Chapter 3 for modeling hydrogenation in CD processes was applied
towards modeling the MIBK system. The schematics depicting the concepts of the film approach have
been discussed in chapter 3. The new modeling contributions made to this particular MIBK system
would now be discussed.
The column was composed of a number of stages (75) and each stage is represented in the form of a
3-phase NEQ cell. Mass transfer takes place from vapor into the liquid into the solid. In each NEQ cell,
the vapor and liquid bulk phases are assumed to be perfectly mixed, the vapor-liquid equilibrium is
assumed to take place only at the vapor-liquid interface, the reaction rate and reaction heat on the
catalyst are assumed to be equal to the mass transfer rate and heat transfer rate respectively between
the liquid and the solid phases, and the solid catalyst is assumed to be partially wetted. The pressure
drop along the column is negligible. The liquid and vapor feed streams are assumed to be evenly
distributed over the cross-sectional area of the column.
The MIBK process entailed a multifunctional catalyst in the reaction zone. Both the aldol
condensation, dehydration and the hydrogenation reactions hence occurred in the same zone in the
column. The hydrogenation of Mesityl oxide to MIBK is a very fast reaction while the aldol
condensation of acetone to form mesityl oxide and water is not. A Hatta number >1 is the underlying
criteria for the reactions occur both in the bulk phase as well as the liquid film. Hence, in implementing
the code in gPROMS for the MIBK system, only hydrogenation reaction was assumed to be occurring
in the film. The aldol condensation occurred on the surface of the catalyst. Because of mass balance,
all components of the chemical system were distributed in the film. This is conveyed in schematic in
Figure 35.

Modeling of benzene hydrogenation and hydrogenation of acetone to methyl isobutyl ketone in a
Catalytic Distillation system using the Film Model
119
Figure 35: Setup of the Film Model for the MIBK process
A major goal in modeling the MIBK process was to understand the effect of internal reflux rate on
the MIBK productivity that was portrayed by experimental data. In the initial 3 phase C4 model, an
increase in internal reflux would increase the liquid flow rate on each stage that would influence the
Reynold’s number and hence, mass and heat transfer data predicted by the model. However, the
numbers predicted by these equations could not match the composition profiles in the condenser and
the reboiler accurately. We tried to explore other hydrodynamic effects the internal reflux could have,
on the column conditions that were not covered by the previous model. The assumption for film
thickness on the solid-catalyst is an important factor that influences the film model predictions. We
researched literature for factors that would influence film thickness. The thickness of a liquid film
adhering to a surface slowly withdrawn from a liquid was investigated by researchers[139] who found
that the thickness follows the equation:

Modeling of benzene hydrogenation and hydrogenation of acetone to methyl isobutyl ketone in a
Catalytic Distillation system using the Film Model
120
g
2t
0
(Equation 86)
where,
t = the thickness of the film near the surface of the bath
ʋ0 = the speed of withdrawal
η = the absolute viscosity of the liquid
ρ = the density of the liquid
g = acceleration due to gravity
This equation is said to apply to a plate of infinite breadth (compared to the film width). Mathematical
investigations of the profile of a draining film have also been conducted by H.Jeffreys[140], which
indicate that the profile of the film is parabolic. This work has also been substantiated by experimental
work. The cue we are taking from this theory towards refining our film model is that the film width
would vary as the internal reflux is increased, for the liquid velocity on each stage would increase. This
is also validated via our gPROMS simulation results. Running the model at different reflux rates
provides different liquid flow rates in the reactive section. This is shown in Table 23.

Modeling of benzene hydrogenation and hydrogenation of acetone to methyl isobutyl ketone in a
Catalytic Distillation system using the Film Model
121
Table 23: Effect of internal reflux on the liquid molar flow rate in the CD model
Liquid Molar flow rate
(mol/sec)
Reflux Ratio
100%
Reflux Ratio
90%
Reflux Ratio
80%
Acetone 0.002198 0.001940 0.001731
Mesityl Oxide 5.953 X 10⁻⁴ 5.632 X 10⁻⁴ 5.355 X 10⁻⁴
Water 2.586 X 10⁻⁴ 2.518 X 10⁻⁴ 2.433 X 10⁻⁴
MIBK 1.605 X 10⁻⁵ 1.459 X 10⁻⁵ 1.314 X 10⁻⁵
Hydrogen 4.162 X 10⁻⁷ 3.751 X 10⁻⁷ 3.413 X 10⁻⁷
The film model was coded in gPROMS and execution results were tested for plausibility with
respect to mass and energy balance. Since, the principal role of the model was to answer the scientific and
engineering questions that prompted the modeling effort, particularly with respect to the effect of internal
reflux and hydrogen rate on the MIBK productivity, the film concept had to be implemented in a way to
demonstrate these effects. To illustrate the effect of reflux rate, the film thickness was left as a parameter
to be adjusted to match real data depending on the reflux rate. Based on the theory presented in Equation
79, it is assumed that at increasing reflux rate would lead to an increase in film thickness. The film model
provides distributed output for concentrations and temperature in the film. The data set at varying film
thickness is tested to find out the best match to the experimental result.

122
Hydrogenation, in general, is not only a fast reaction, but also a very exothermic reaction with the heat
effects significantly affecting the overall performance of the chemical system. The hydrogenation
reaction of mesityl oxide to form MIBK is strongly exothermic (ΔH = -126 kJ/mol). A good
mathematical model has to be sensitive not only to the mass transfer but also to the heat effects of the
process. Hence, the associated heat effects were implemented in the liquid -solid film via the second-
order differential equation depicting the interdependency of heat transfer and reaction rate.
0(x)R
Q2
dx
T2
d
Sh (Equation 87)
where,
QR = the enthalpy change ΔH for the reaction
hs = heat transfer coefficient
From a first glance, it appears as if the temperature profile in the film would be linear. The heat
transfer coefficient for transport equations for heat balance are calculated using the Chilton
Colburn analogy are expressed in Equations 20-21[36].
1/2LL
pm
L
av
L
)(LeCkh (Equation 88)
where,
LeL = Lewis number, the ratio of thermal diffusivity to mass diffusivity
CP = heat capacity
kL = mass heat transfer coefficient
All the 3 are parameters are functions of temperature. The enthalpy of the reaction also depends on
temperature as the kinetic rate constants are temperature dependent. To simplify the model and save
execution time, it is possible to use sub-models to calculate these quantities separately and use those
values rather than expressions in the differential equation. However, that would influence the accuracy
of the simulation results but save execution time and algorithmic convergence. In the study for the

Modeling of benzene hydrogenation and hydrogenation of acetone to methyl isobutyl ketone in a
Catalytic Distillation system using the Film Model
123
MIBK process, while temperature correlations for mass transfer coefficient and Lewis number were
used, the heat capacity was directly calculated via Multiflash software.
4.2.3 Film Model results for the MIBK process and comparison with the C4 model
The distributed film model was applied to study the MIBK process. Simulations were run for the steady
state runs 1-5 in the CD005 experiment listed in Table 21, the results of which would be summarized
in this section. The model was also used to test the system’s sensitivity to various process parameters
which would be discussed.
A summary of the simulation results for experiment CD005 is provided in Table 24. Figure 36 also
shows the mass balance results in a simulation process schematic for run 4 of the experiment.
Figure 36: Film model mass balance results (gPROMS) for run 4 of the experiment CD005
NC = number of component, 1 = Acetone, 2 = Mesityl Oxide, 3 = Water, 4 = MIBK, 5 = Hydrogen

124
Table 24: Film model predictions for experiment CD005
Run Hydrogen
Rate
(L/h) at
STP
Reflux
Ratio
(%)
Film
Thickness
Acetone + water wt % in the
distillate
in product
MO wt% in reboiler MIBK wt % in reboiler
in product
Experimental Model Experimental Model Experimental Model
1 10.2 97.1 3 micron 99.7 99.2 40.25 38.6 12.7 11.9
2 10.9 82.7 2 micron 99.2 99.4 20.44 18.8 30.2 29.4
3 60 88.5 2 micron 99.5 99.1 1.38 2.2 44.6 42.0
4 60 97.5 3 micron 99.6 98.7 7.96 4. 8 52.3 51.0
5 35.9 95.4 3 micron 99.2 98.5 7.92 9.4 41.5 42.3

Modeling of benzene hydrogenation and hydrogenation of acetone to methyl isobutyl ketone in a Catalytic Distillation system using the Film
Model
125
Figure 37: Liquid Phase Molar composition (CD005 – Run 3)

Modeling of benzene hydrogenation and hydrogenation of acetone to methyl isobutyl ketone in a Catalytic Distillation system using the Film
Model
126
Figure 38: Liquid Phase Temperature Profile (CD005 – Run 3)

127
Model predictions for the liquid composition profile in the CD column are displayed in Figure 37 for
run 3 of the CD005 experiment. There is a buildup of water in the top sections of the column, the
acetone and water combined molar percentage in the condenser is close to 100. Because of an efficient
process design, the Mesityl oxide concentration in the column is low. It increases in the reaction zone,
and in the lower section because of the reboiler heat. Similarly, the MIBK concentration increases in
the reaction zone and the lower CD zones.
Figure 38 shows the column temperature profile for the liquid phase. The temperature in the liquid
phase increases from 434 K at the condenser to 449 K above the reboiler. The feed lines in the actual
CD column were not heated; the model too shows a steep temperature drop at the two feed injection
points (stage 30, stage 60).
Before comparing head to head the model predictions to the experimental results and deciphering the
comparison, it is important to understand the dependence of the model’s performance for the MIBK
productivity on various process variables. The effect of major process variables on the reboiler product
composition are now discussed:
Effect of Internal reflux ratio
The film model predictions were found to be strongly dependent on the liquid flow rate. The internal
reflux ratio was the strongest factor affecting the MIBK productivity in the reboiler. Increasing the
internal reflux from 0 percent to a total reflux while keeping other variables constant increased the
MIBK mass percentage in the reboiler from 18 % to 50 %. An increase in internal reflux increases the
liquid molar flow rate, the catalyst wetting and the film thickness. The associated changes in Reynold’s
number from the liquid and gas flow due to the changed internal reflux affected the mass transfer
coefficient.
Effect of Vent
A novel embodiment of the developed green process was the in-situ removal of the kinetic inhibitor
via an overhead vent. The film model uses a partial condenser with a vent. Increasing the vent which is
mostly acetone and water increases the MIBK productivity in the reboiler. This effect is very prominent.

Modeling of benzene hydrogenation and hydrogenation of acetone to methyl isobutyl ketone in a
Catalytic Distillation system using the Film Model
128
Increasing the condenser molar flow vent percentage from 5 percent to 10 percent increases the MIBK
mass percentage in the reboiler from 12 percent to 30 percent.
Effect of Hydrogen Feed Rate
The hydrogen rate was adjusted to match the hydrogen feed rates used in the actual CD experiments
which were dependent on the design and safety constraints for the process. Increasing the hydrogen
feed rate into the model from 10 L/h at STP to 60 L/h at STP increases the MIBK mass percent in the
reboiler from 12 percent (run 1) to 51 percent (run 4). The process is strongly influenced by
hydrogenation and its transfer to the catalyst.
Effect of Pressure
Increasing the column pressure led to an increased concentration of MIBK in the product. A higher
partial pressure of hydrogen leads to increased dissolution in the liquid and faster reaction rates due to
higher hydrogen concentration dissolved in the film over the wetted catalyst as well as higher partial
pressure of the hydrogen over the dry solid catalyst. However, this effect is less pronounced than the
hydrogen feed rate.
Influence of Reaction Rate
The underlying hypothesis for the film model is that hydrogenation reactions are very fast and
severely mass-transfer controlled and hence, occur in the thin film of liquid over the liquid-solid (L-S)
interface under trickle bed conditions inside the RD column. Attempts were made to affirm if the kinetic
parameters have any influence on the MIBK composition in the product. It is not be noted that the
original modified C4 model was strongly affected by a change in kinetic parameters. In the film model,
a change in rate constants to the order of 100 brought no appreciable effects in the benzene conversion.
The film model thus supports our assertion of the process not being reaction controlled.
Role of Mass Transfer
The binary mass transfer coefficients for the liquid and vapor films and the solid-liquid film for the
random packing in CD zones are estimated using the empirical correlations developed in our group.
These coefficients would differ for different packings in different units. The model’s sensitivity to mass

Modeling of benzene hydrogenation and hydrogenation of acetone to methyl isobutyl ketone in a
Catalytic Distillation system using the Film Model
129
transfer was however tested. Increasing the mass transfer coefficients by a factor of 1.5 lead to increase
in MIBK mass percentage in the reboiler from 27 % to 50%. This was achieved in small incremental
steps since mass transfer correlations are complex. These results affirm our hypothesis of mass transfer
severely controlling the MIBK process.
From the head-to-head comparison of the film model results to the experimental data in Table 24, good
agreement between simulations and experimental data is found for different runs on variation of both
hydrogen feed rate and reflux ratio, when the film thickness was varied as a parameter. At lower reflux
(runs#2, 3), a film thickness of 2 microns is used in the model. At higher reflux (runs#1, 4, 5), the film
thickness is assumed to be 3 microns. Comparing runs 1 and 3, at near identical hydrogen feed rates,
the film thickness is decreased from 3 microns to 2 microns when the reflux ration is decreased from
97.1 % to 82.7%. This is reasonable since lower reflux results in lower liquid flow rates and a smaller
thickness of the film on the solid surface. An intriguing observation is observed between runs 3 and 4.
The only process change between these two runs is the reflux ratio. In spite of a higher film thickness,
the productivity is increased in run 4. This can be explained on account of productivity being affected
by factors other than the film thickness. An increase in reflux changes the liquid flow rate and the film
thickness. The increased film thickness leads to enhanced mass transfer resistance and an adverse effect
on MIBK productivity. However, this effect is overcome by the positive effects of higher liquid flow
rates on Reynold’s number and Lewis number correlations that increase the mass transfer and heat
transfer coefficients respectively and overall result in an increased MIBK productivity.
A comparison of the model prediction results listed individually for the film and C4 model in Table 25
evidences that the film model matches the experimental data better, particularly with respect to the
mesityl oxide concentration that was a major failure of the C4 model. The film model also closely
matches the condenser composition which the C4 model was under-predicting. For the actual CD
experiments, a temperature profile along the column was not available. Temperature measurements
were taken along points in the column via thermocouples. The column temperatures recorded at the top
reaction zone and the bottom section of the column at run 3 for CD005 were 160°C (433 K) and 183°C
(456 K) respectively. Figure 39 compares the temperature profiles as predicted by the 2 models and it

Modeling of benzene hydrogenation and hydrogenation of acetone to methyl isobutyl ketone in a
Catalytic Distillation system using the Film Model
130
can be judged that the film model is closer in predictions to the actual recorded temperatures. The film
model entails a more complex set for temperature calculation where individual expressions for heat
transfer were implemented in the differential equation.
Table 25: Comparison of the predictions of C4 model and the film model towards experimental
data (CD005)
CD005 Wt % Experimental C4 Model Film Model
Run 1 Acetone and water in distillate 99.8 91.3 99.2
Mesityl oxide in reboiler 40.3 85.6 38.6
MIBK in reboiler 12.7 12.2 11.9
Run 2 Acetone and water in distillate 99.2 92.4 99.4
Mesityl oxide in reboiler 20.4 71.4 18.8
MIBK in reboiler 30.2 29.1 29.4
Run 3 Acetone and water in distillate 99.5 91.5 99.1
Mesityl oxide in reboiler 1.4 53.2 2.2
MIBK in reboiler 44.6 42.0 42.0
Run 4 Acetone and water in distillate 99.6 91.4 98.7
Mesityl oxide in reboiler 8.0 43.3 4.8
MIBK in reboiler 52.3 54.7 51.0
Run 5 Acetone and water in distillate 99.2 90.5 98.5
Mesityl oxide in reboiler 7.9 50.7 9.4
MIBK in reboiler 41.5 46.3 42.3

Modeling of benzene hydrogenation and hydrogenation of acetone to methyl isobutyl ketone in a
Catalytic Distillation system using the Film Model
131
Figure 39: Predictions for Liquid phase temperature profile (Film model versus the C4 Model)
We carried out simulations to test the sensitivity of the film model to the film thickness. Table 26 displays results
on the concentration of different products in the outlet streams. It is evident that an increase in film thickness
leads to an increase in mass transfer resistance that adversely affects the concentration of the reboiler products,
decreasing the MIBK productivity.

132
Table 26: Sensitivity of the film model results for condenser and reboiler concentrations to the film thickness
Run Hydrogen
Rate
(L/h) at
STP
Reflux
Ratio
(%)
Film
Thickness
Acetone + water wt
% in the distillate
in product
MO wt% in reboiler
MIBK wt % in
reboiler
in product
Actual
Experimental
Data
10.2 97.1 ---- 99.73 40.25 12.7
Modified C4
Model
10.2 97.1 ---- 91.3 85.6 12.2
CD005-Run 1 10.2 97.1 1 micron >99 38.5
16.3
CD005-Run 1 10.2 97.1 2 micron >99 34.7
14.1
CD005-Run 1 10.2 97.1 3 micron >99 38.6
11.9
CD005-Run 1 10.2 97.1 4 micron >99 39.3 7.3

133
While the film model was able to match experimental data, the point to ponder is how efficient the film
model is towards the MIBK process. Does the model mathematically entail every real process
phenomenon that occurred in the MIBK process? Is the film model predictive for the MIBK process?
In real CD experiments, the MIBK productivity was optimized by decreasing reflux and increasing the
hydrogen feed rate. To account for a cumulative effect and to match the experimental data, the film
thickness is employed as a varying parameter. For predictive studies, we need to investigate relationship
between film thickness and the hydrogen feed rate and the reflux flow rate. This is a potential field of
future work towards strengthening the film model and its area of applications. If a suitable relation to
predict film thickness intrinsically from the liquid and vapor flow rates in the column is developed and
implemented, film model could be a predictive model for the MIBK system. The increase in MIBK
productivity with decreasing liquid reflux also suggests the possibility of a gas phase hydrogenation
coming into picture on the dry surfaces of the catalyst where there is no inhibition of mass transfer due to
absence of liquid. That process though could not occur exclusively in a distillation column but has to occur
together with the liquid phase hydrogenation transiently. To model such a system, the film model should
be made dynamic and the switch between gas and liquid phase regimes should be setup based on fluid
dynamics. That would also investigated in future modeling studies.
4.2.4 Conclusions
The application of film model for the study of MIBK system led to a number of conclusions. The
film model was demonstrated to be more accurate in matching experimental data than the C4 model
in terms of composition and temperature profiles. For an exclusive liquid hydrogenation CD case, the
film model was also able to outline the major process parameters affecting MIBK productivity
(internal reflux rate, hydrogen feed rate, vent etc.). The model uses film thickness as a parameter to
match data and if suitable co-relations are understood and implemented to ascertain film thicknesses
for different reflux scenarios, could also be used for process design and predictive studies of MIBK
processes in a CD set up.

Biodiesel Production via Catalytic Distillation
134
Chapter 5 Biodiesel Production via Catalytic Distillation
The dependence of the world on fossil fuel energy resources for its burgeoning energy needs is unsustainable
owing to depleting reserves, volatile petroleum prices and climate change considerations. Extensive research
efforts are hence steered towards pushing development of renewable and environmentally friendly biofuels to
achieve energy security, diversifying the energy pool and mitigation of GHG emissions. The biofuels industry
also brings benefits in terms of foreign exchange savings and provides impetus to the agricultural sector. More
than 50 nations worldwide today have a biofuels mandate in place, with the global biofuels output projected
to grow at 3.5% per year [141].
Among the various biofuel resources, biodiesel has attracted significant interest as an alternative transport fuel
to conventional petroleum diesel. Biodiesel is the second largest category of global biofuel, accounting for 6.9
billion gallons globally in 2013 — 22.6% of the total biofuel production [142]. Biodiesel, apart from being
non-toxic and biodegradable, scores over other biofuels due to a variety of feedstocks ( e.g. vegetable oils -
rapeseed in Continental Europe, soybean and canola in North America and palm oil in South East Asia, waste
cooking oil, algae oil, animal fats etc.) that could be used for biodiesel production. Biodiesel is inherently safer
due to its higher flash point 150 °C, and it also provides better lubrication and hence less engine wear and tear
compared to conventional diesel. Biodiesel is more environmentally friendly since it contains very low sulphur
and aromatic content. Chemically, biodiesel is a mixture of fatty acid alkyl esters (FAAE) that can be
conventionally produced from a variety of feedstock such as vegetable oil, waste cooking oil, algae oil or
animal fats. There are two major chemical reactions for biodiesel production namely through
transesterification of triglycerides (TG) in vegetable oils and esterification of free fatty acids (FFA) in waste
cooking oil or animal fats. Both of these reactions proceed with short chain monoalcohols, usually methanol
which is less costly, easily obtainable and less sensitive to water that is produced as a side product in the
esterification process[143]. The transesterification reaction of TG in vegetable oils with methanol in the
presence of suitable catalytic systems produces biodiesel known as fatty acid methyl ester (FAME) and
glycerol (the major by product). The esterification reaction of oil feedstocks having high FFA content with
methanol produces FAME and water as a side product. Schematics of both these reactions are outlined in
Figure 40. The physical properties of the reactants and products are depicted in Table 27.
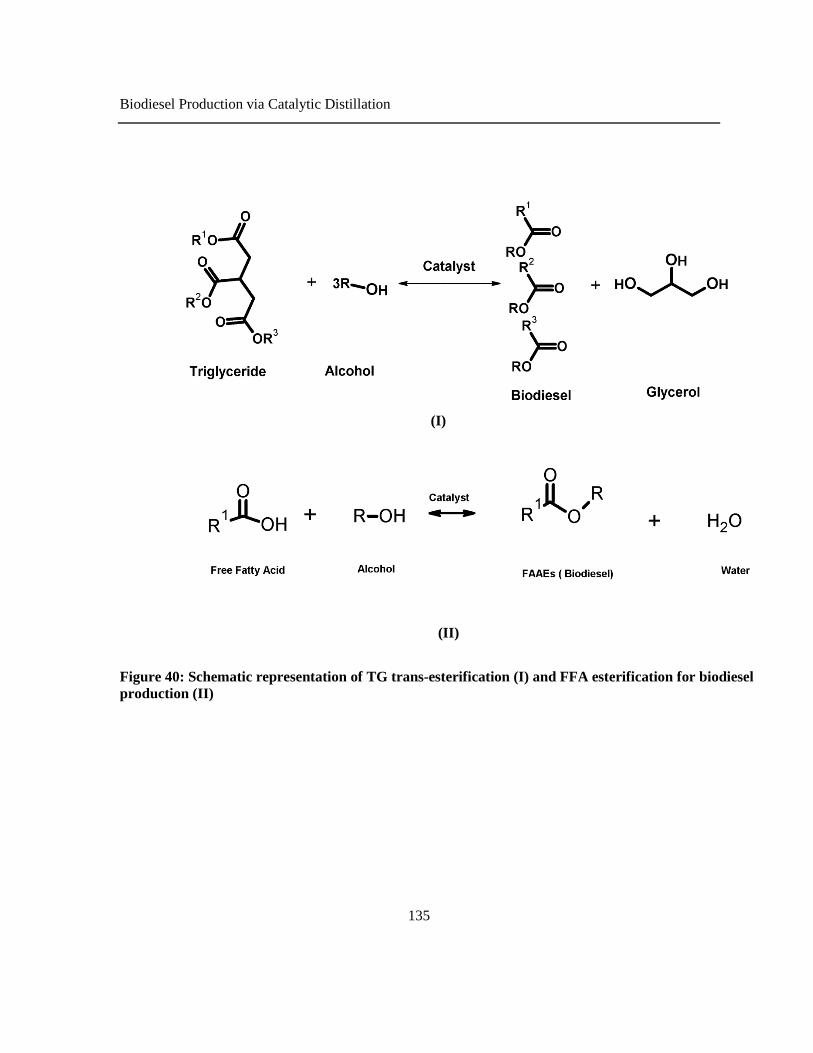
Biodiesel Production via Catalytic Distillation
135
(I)
(II)
Figure 40: Schematic representation of TG trans-esterification (I) and FFA esterification for biodiesel
production (II)

Biodiesel Production via Catalytic Distillation
136
Table 27: Physical properties of the components at 1 atm and 25°C
A promising alternative to petroleum, biodiesel use and production is hence expected to rise
significantly in the near future. More than 50 nations worldwide today have a biofuels mandate in
place, with the global biofuels output projected to grow at 3.5% per year [141].
CD is a process intensification technique that offers an efficient solution to many process constraints
enhancing the process efficiency. Biodiesel production via simultaneous esterification and trans-
esterification of yellow grease meets the design criteria of CD due to a number of reasons. During the
operation, most of the methanol would be in a vapor phase while the conversion to biodiesel would
happen in a liquid phase. The products water, glycerol and FAAE have significant volatility difference
that makes separation by distillation favorable. Secondly, both transesterification and esterification
reactions for biodiesel production are exothermic [144] and a CD operation is hence favored since the
energy liberated can be efficiently converted in situ to drive the distillation process and enhance energy
integration. Also, the biodiesel reactions are reversible and catalytic distillation allows for the constant
removal of product from reaction zones, thereby pulling chemical equilibrium to the right towards the
products [20] in accordance with Le Chatelier’s principle. Thirdly, heterogeneous catalyst systems in
CD would add economic and environmental merits to the biodiesel process, especially in terms of lower
catalyst costs, longer catalyst life and reduction of water usage for cleaning the products. In light of all
these favorable factors, research goals were directed towards investigating the possibility of
intensifying the conventional biodiesel processes for continuous production of biodiesel applying
features of catalytic distillation in a new green hybrid process and quantifying the process merits, if
Property Oleic Acid Triolein Methanol Methyl
Oleate
Glycerol Water
MW (g/mol) 282.46 885.43 32.04 296.49 92.09 18.015
Boiling
Point (oC)
360 846.5 64.7 349 287.71 99.98
Density
(g/cm3)
0.895 0.91 0.79 0.87 1.26 .999
Biodiesel Production via Catalytic Distillation
137
any, brought by CD. We investigate case studies involving two biodiesel feeds namely soybean oil and
yellow grease (waste cooking oil).
5.1 Process Design and Modeling Studies: Catalytic Distillation for production
of biodiesel from soybean (vegetable) oil
Biodiesel is made from many different sources, ranging from used cooking oil (Yellow grease) to food-
grade vegetable oils. Unfortunately, despite encouraging growth in the production of waste-based
biodiesel, 30 % of biodiesel produced in North America comes from edible soybean oil [145]. Most
U.S. biodiesel plants operate on soybean oil. A new green process for biodiesel production from
soybean oil would be contribute immensely to the biodiesel industry.
The technique implemented is to first use chemical process modeling to simulate continuous
biodiesel flow sheets and outline the key indicators that determine the process efficiency and
profitability of such a biodiesel process with a technical and economic comparison of CD against
conventional approaches. Process flow sheets depicting conventional and CD technology are modeled
in Aspen Plus, and detailed operating conditions and equipment designs are provided for each process.
The next step is to provide an optimized design for production of biodiesel product in each flowsheet
by adjusting the process parameters and highlight the process improvements brought by CD against the
conventional process.
Batch experiments on transesterification of soybean oil with methanol were carried out in our laboratory
over calcium oxide supported on Al2O3 as solid base catalysts (heterogeneous catalysts system) [146].
Assuming a pseudo first order with respect to the triglyceride (soybean oil molecule) in excess of
methanol [147], average overall reaction constants at different temperatures were calculated and the
activation energy was estimated to be 30 KJ/mol based on the Arrhenius equation:
CRT
Eakln (Equation 89)
This kinetic model was used in the process simulations modeling the biodiesel processes.

Biodiesel Production via Catalytic Distillation
138
5.1.1 Conventional Reactor Separation Configuration
A schematic diagram for a conventional biodiesel production process is shown in Figure 41. The
reaction is modeled in a continuous plug flow reactor. The transesterification reaction for biodiesel
production in a continuous process can be carried out in different reactors such as a plug flow reactor
or combined stirred tank reactor [148, 149], accordingly the reactor conditions such as volume and
residence time to achieve the same reactant conversion could differ. Plug Flow and Packed Bed reactors
are known for achieving the highest conversion per unit of volume and they also require lower
maintenance and shutdown times [150]. Most researchers [149, 151, 152] studying biodiesel production
process using homogeneous catalyst systems base their simulations on the shown schematic (Figure
41). The basic steps are transesterification reaction followed by alcohol recovery in a distillation
column and glycerol-catalyst extraction with water from the oil phase in a washing column. Some
processes also require neutralization of the catalyst. Separate distillation columns are used for FAME
and glycerol purification. In our flow sheet for the conventional reactor separation configuration with
heterogeneous catalyst, no washing column is required for extraction of catalyst from oil/biodiesel
phase; we are considering a plug flow packed bed reactor with a catalyst lifetime of 1 year. We have
also added a flash distillation unit after the high temperature, high pressure reactor operation as it brings
enormous reduction (4 times less) in utility usage for methanol separation.
Figure 41: Biodiesel production from soybean oil: Conventional reactor separation flow sheet
R-IN R-OUT
RECYCLE1
FL-BOT
DEC-TOP
DEC-BOT
FAME
RECYCLE2
GLYCEROL
RECYCLE3
FEED PFR
FLASH
DECANTER
DISTL1
DISTL2
MIXER

Biodiesel Production via Catalytic Distillation
139
Since laboratory results in [146] indicated higher biodiesel yields at higher temperatures (150°-
200°C), the reactor setting is chosen to be isothermal at 160° C with no pressure drop was chosen.
Reaction temperatures higher than 150° C do not significantly affect the biodiesel yield but increase
the cooling water utility requirements. To get the optimized reactor temperature operation, reactor
simulations were run in the temperature range 150°-200°C and at 160° C, a maximum conversion of
99.81 % was achieved. For sizing the reactor, ASPEN reactor model configuration provides length,
diameter and number of tubes as adjustable parameters. This is a continuous process, so while the
reactor was sized varying length, diameter and number of tubes we also kept a watch on the residence
time for the reaction while working in the specified pressure and temperature ranges. We aimed at more
than 95 percent reactor conversion so as to ensure ease of separation and product purity. Reaction time
for the transesterification kinetic data used in our ASPEN models was reported in range of 8-12 hours
[146]. The residence time for our ASPEN simulation for configuration A is 16 hours. Reactor length
affects the conversion very strongly, diameter and number of tubes affect the residence time.
The other flow sheet elements are a mixer, a plug flow fixed bed reactor (PFR), a flash separator, a
decanter and two distillation columns (RADFRAC). The mixer functions to enable the recycle of the
overhead methanol streams from the flash and distillation columns back into the reactor. The flash
separates the methanol from the glycerol and methyl oleate. The decanter splits the methyl oleate
(biodiesel product) from the glycerol. The purpose of the first distillation RADFRAC column (FAME
purification- DISTL1) is to purify the biodiesel from methanol while the second column (Glycerol
purification- DISTL2) separates methanol from glycerol. A constant feed of molar flow rate 100
lbmol.hr-1 in a methanol to oil optimum molar ratio of 9:1(for maximum conversion [146]) is fed to
the reactor. The reactor consists of 100 tubes each of diameter 0.37 m and 10.50 m length. A conversion
of 99.83 % is achieved. The output stream from the reactor is at 160° C and 15 atmospheres.
Pure components physical properties obtained from the Aspen library suggest that the products
separation should be easy as they have appreciable boiling point and density difference . Since the
boiling point of methanol (64.7° C at 1 atm) is significantly lower than that of methyl oleate (343.85°C
at 1 atm) and glycerol (287.85° C at 1 atm), a flash separator was utilized to isolate the methanol from
glycerol and methyl oleate. Flash Drum works on the principle of high pressure gradient to achieve a
good separation. The steps were methanol separation followed by the decantation of glycerol and final
distillation of the products. The flash drum final operating conditions were 125°C and 1 atm. The top

Biodiesel Production via Catalytic Distillation
140
stream from the flash has a methanol purity of 99%, which was recycled back to the reactor via the
mixer. Design and tear stream specifications were specified in Aspen estimate the fresh feed
composition to the mixer so as to keep the methanol to triolein ratio 9:1 at the mixer output. The bottom
stream from the flash separation unit was taken to a decanter for separation of glycerol and methyl
oleate via gravity separation.
The decanter functions to purify the biodiesel product (methyl oleate) from the methanol and
glycerol, based on the density difference and intermolecular interaction between them. Separation using
a gravity settler has also been proposed by [153]. The decanter operates at 125° C and 1 atm. The lighter
stream from the decanter is composed of 90.89 mole % methyl oleate (biodiesel) and 8.77 mole %
methanol. The denser stream is composed of glycerol mole fraction (85.32 mole %) and methanol
(14.66 mole %).
2 RADFRAC distillation columns (FAME purification, Glycerol purification) are employed for
methanol recovery as well purification of biodiesel and glycerol. The FAME purifier had 5 stages
(condenser, 3 trays and reboiler) – the feed was fed to stage 3. The glycerol purifier only had 3 stages
(condenser, tray and reboiler), with feed on stage 2. The reflux ratio of both columns was set to 0.5 in
order to save energy. The columns stages efficiency was assumed to be 1 and no pressure drop was
considered to take place in the columns. The distillate was totally condensed.
The FAME purifier distillation column achieved a separation of 99.99% mole fraction of methanol
on the top stream (99.99 % mass fraction) and 99.56% of FAME on the bottom stream (99.71 % mass
fraction). The FAME distillation column operates at 0.3 atmospheres (vacuum distillation) so as to
reduce the temperature of the product FAME stream. (biodiesel starts thermal degradation via
isomerism, polymerization and pyrolysis at temperatures exceeding 275° C [154]). Low pressure
distillation for biodiesel has also been reported in literature [149]. Methanol separation from biodiesel
is utmost necessary so as to meet ASTM standards. Most biodiesel standard allows only 0.2% v/v
methanol in the final product [155]. Residual methanol in the biodiesel fuel is a major environmental
and health hazard due to a number of reasons. Methanol is toxic (ingestion of 10 ml causes permanent
blindness), has cold-start problems, lower energy density and evaporates quickly when exposed to air.
Excess methanol can also make the fuel flammable and more dangerous to handle and store besides,
corroding metal components of engine [148, 155, 156]. The glycerol purification column achieved a
separation of 99.87 % mole fraction for methanol on the top stream (99.29 % mass fraction), which is

Biodiesel Production via Catalytic Distillation
141
recycled back into the mixer, and a purity of 98.77% of glycerol on the bottom stream (99.53 % mass
fraction). The glycerol purification column operated by 0.5 atmospheres so as to have a product glycerol
stream less than its boiling point, 287.71°C. This low pressure distillation operation at 0.5 atmospheres
also featured in the work done by [149].The composition and flow rate of all constituent streams for
the reactor separation configuration is shown in Table 2

142
Table 28: Flow sheet for the reactor separation configuration (A) - Stream names specified in Figure 41
FEED R-IN R-OUT FL-BOT DEC-BOT
DEC-
TOP FAME GLYCEROL RECYCL1 RECYCL2 RECYC3
Temperature (°C) 25.00 68.27 160.00 125.00 125.00 125.00 258.17 188.44 125.00 36.80 47.94
Pressure (atm) 1.00 1.00 15.00 1.00 1.00 1.00 0.30 0.50 1.00 0.30 0.50
Component Mole
Flow (lbmol.hr-1)
Methanol 30.09 90.00 60.05 4.59 1.70 2.89 0.02 0.12 55.47 2.87 1.58
Triolein 10.00 10.00 0.02 0.02 4.47E-11 0.02 0.02 1.87E-21 3.41E-05 7.38E-07 4.47E-11
Glycerol - 0.55 10.54 9.98 9.89 0.09 0.09 9.89 0.55 4.11E-07 1.24E-03
Methyl Oleate - 0.01 29.96 29.95 2.32E-03 29.94 29.94 1.49E-03 0.01 2.66E-08 8.31E-04
Mole Fraction
Methanol 0.7505 0.8949 0.5972 0.1031 0.1466 0.0877 0.0007 0.0121 0.9900 1.0000 0.9987
Triolein 0.2495 0.0994 0.0002 0.0004 3.85E-12 0.0006 0.0006 1.87E-22 6.08E-07 2.57E-07 2.83E-11
Glycerol - 0.0055 0.1048 0.2241 0.8532 0.0028 0.0031 0.9877 0.0099 1.43E-07 0.0008
Methyl Oleate - 0.0001 0.2979 0.6724 0.0002 0.9089 0.9956 0.0001 0.0002 9.27E-09 0.0005
Mass Fraction
Methanol 0.0982 0.2445 0.1632 0.0148 0.0564 0.0103 0.0001 0.0043 0.9706 1.0000 0.9929
Triolein 0.9018 0.7509 0.0014 0.0016 4.09E-11 0.0018 0.0018 1.81E-21 1.65E-05 7.11E-06 7.76E-10
Glycerol - 0.0043 0.0823 0.0923 0.9429 0.0010 0.0010 0.9953 0.0278 4.11E-07 0.0022
Methyl Oleate - 0.0003 0.7532 0.8913 0.0007 0.9869 0.9971 0.0005 0.0016 8.58E-08 0.0048
Total Mole Flow
(lbmol.hr-1) 40.09 100.56 100.56 44.54 11.59 32.95 30.08 10.01 56.03 2.87 1.58
Total Mass Flow
(lb.hr-1) 9818.35 11792.31 11792.50 9961.42 965.88 8995.55 8903.59 914.96 1831.08 91.96 50.92
Volume Flow
(m3.hr-1) 4.93 491.68 7.03 5.62 0.38 5.10 5.81 0.37 830.28 0.05 0.03

143
5.1.2 Catalytic Distillation Configuration
One of the most significant merits brought by CD to a process is simplification of the flow sheet and
savings in equipment cost and operation. Particularly in this case, the conventional biodiesel process
can be intensified by removal of the plug-flow reactor and two distillation columns by a single catalytic
distillation column where both reaction and separation occur. For the catalytic distillation configuration,
the process equipment required are a mixer for enabling the recycle of methanol into the reactor, a
reactive distillation column (RADFRAC) for the reaction and methanol separation and a decanter for
glycerol and methyl oleate separation.(Figure 42)
The catalytic distillation column was modelled in Aspen via an equilibrium-based rigorous 2 or 3-
phase fractionation model (RADFRAC) with a total number of 7 stages (5 trays, condenser and reboiler)
and a reflux ratio of 0.6. The column was operated at a pressure of 3 atmospheres and a per-stage
pressure drop of 0.1 atmospheres. This is another advantage demonstrated by a CD operation. Since
the heat of the exothermic reaction is consumed to separate out the products, the column is able to
operate at higher pressures while maintaining the reboiler product biodiesel at temperatures lesser than
its degradation temperature (275 °C). Two separate feed streams were added to the column. The lighter
component alcohol was fed at stage 6 close to the reboiler and the heavier component oil was fed at
stage 2 close to the condenser, to enable the reaction to take place between these stages. Design criteria
were specified for the flow rate of the fresh alcohol feed so as to maintain the 6:1 methanol to triolein
ratio for the stream exiting the mixer and entering the column. This 6:1 optimal ratio was chosen for
best conversion after a set of trial simulation runs of the CD column. A total holdup of 50 lb mol was
imposed for the liquid phase. The distillate purity was above 99 % mole fraction of methanol and could
be recycled. The mixer functioned to merge the recycle into the fresh feed. The total conversion for
triolein in the process is 99.63% and the bottom stream from the RADFRAC column was sent to a
decanter in order to settle and separate the glycerol from methyl oleate.
The operation of the CD column at lower pressures results in very little methanol in bottom product
(0.0044 mole fraction). The bottom product from CD column is composed mostly of glycerol and
methyl oleate which are easily separated by operating the decanter owing to significant difference
between their densities (density Glycerol ~ 1.26 g/cm3, density Methyl Oleate ~ 0.87 g/cm3). The

Biodiesel Production via Catalytic Distillation
144
decanter temperature and pressure conditions were set close to the bottom stream from the RADFRAC
column so as to minimize energy expenses while maintaining the purity standards. At an operation of
150°C and 1 atm, its heat duty was the lowest for a separation of 99% of methyl oleate. A final stream
of 99.10% mole fraction purity for methyl oleate was obtained from the decanter as well as another
stream with a purity of 99.38% for glycerol. These are very high product purity standards and hence
further distillation columns were not required. The composition and flow rate of all constituent streams
for the CD configuration is shown in Table 29.

145
Table 29: Flow sheet for the catalytic distillation configuration (B) - Stream names specified in
Figure 42
Stream OIL ALCOHOL ALCOHOL2 DISBOT DISTOP FAME GLYCEROL
Temperature
(°C) 25.00 25.00 62.00 273.37 95.43 150.00 150.00
Pressure
(atm) 3.20 1.00 3.70 3.70 3.00 1.00 1.00
Liquid
Fraction 1.00 1.00 1.00 1.00 1.00 1.00 1.00
Component
Mole Flow
(lbmol.hr-1)
Methanol - 30.07 60.00 0.18 29.93 0.12 0.06
Triolein 10.00 - 2.88E-03 0.04 2.88E-03 0.04 4.57E-11
Glycerol - - 0.06 9.96 0.06 0.12 9.85
Methyl
Oleate - - 1.33E-03 29.89 1.33E-03 29.89 1.70E-03
Mole
Fraction
Methanol - 1.00 0.9989 0.0044 0.9978 0.0039 0.0060
Triolein 1.00 - 4.79E-05 0.0009 0.0001 0.0012 4.61E-12
Glycerol - - 0.0010 0.2487 0.0021 0.0039 0.9938
Methyl
Oleate - - 2.21E-05 0.7460 4.42E-05 0.9910 0.0002
Mass
Fraction
Methanol - 1.00 0.9955 0.0006 0.9910 0.0004 0.0021
Triolein 1.00 - 0.0013 0.0033 0.0026 0.0036 4.45E-11
Glycerol - - 0.0030 0.0935 0.0060 0.0012 0.9973
Methyl
Oleate - - 0.0002 0.9027 0.0004 0.9947 0.0006
Total Mole
Flow
(lbmol.hr-1)
10.00 30.07 60.07 40.07 30.00 30.16 9.91
Total Mass
Flow
(lb.hr-1)
8854.30 963.42 1931.26 9817.91 967.85 8908.80 909.10
Volume
Flow
(m3.hr-1)
2.83 0.55 1.17 6.51 0.62 5.17 0.35

146
Figure 42: Biodiesel production from soybean oil: Catalytic Distillation flow sheet
OIL
ALCOHOL2
DISBOT
DISTOP
FAME
GLYCEROL
ALCOHOL
RADFRAC
DECANTER
MIXER

147
5.1.3 Comparisons (Cost and Energy)
Both process configurations were optimized for desired biodiesel ASTM purity standards while
minimizing energy requirements. The final streams from both process configurations yielded the same
mass flow rate (8900 lb-mole/hr) and percentage purity (99.00 % mole percent) of biodiesel (methyl
oleate). Operating conditions for both columns were set so as to have less than 0.2 % v/v methanol in
the final product to comply with ASTM standards. The total capital and operating costs between the
two optimized process configurations are now compared to quantitatively predict the more cost-
efficient process. To achieve this, the Aspen Process Economic analyzer tool (formerly: Aspen Icarus
Process Evaluator) was used. The process economic analyzer tool is a most valuable to compare
competing technologies and/or evaluate alternative process configurations that is able to calculate
preliminary size for process equipment and generate operating and capital cost using in-built design
and cost models directly from simulation data.
Table 30 and 31 enlist the total capital costs, total operating costs, equipment purchase costs and
yearly utility and raw material costs for the two biodiesel configurations, for an annual biodiesel
production of around 10 million gallons per year. These figures were evaluated using generated mass
and energy results from Aspen process simulators, plugging in stream prices and then mapping and
sizing the equipment using the process economic analyzer tool. The feed stream prices were set as 26
cents per pound for soybean oil and 24 cents a pound for methanol [157]. The product stream price for
technical grade glycerol was set as 0.9 dollars per pound [158] (The glycerol product stream in both
configurations is more than 98.7 % mole in purity). The total capital corresponds to the investment
required for purchase of equipment, cost of labor and materials (direct installation costs), costs for site
preparation and buildings, and certain other costs (indirect installation costs). It also includes costs for
land, working capital, and off-site facilities. The total operating costs includes labor, maintenance,
utilities, and raw material costs.

148
Table 30: Detailed cost analysis for optimum design and operating conditions for the reactor separation configuration (Configuration A)
Configuration: Reactor + Distillation
Equipment Optimal
Spec.
Optimal
Operation
Condition
Heat Duty
(kWatt)
Equipment
Utility Cost
($/yr)
Total
Operating
Cost ($/yr)
Equipment
Purchase Cost
($)
Total
Capital Cost
($)
Reactor
Volume
(112.9
m3)
Temp. (160 C)
Pressure (15 atm) -127.64 $9,618.60
$25,509,398
204800
$5,871,380
Flash Separator Volume
(3.27 m3)
Temp. (125 C)
Pressure (1 atm) 62.48 $4,708.26 19200
Decanter Volume
(1.80 m3)
Temp. (125 C)
Pressure (1 atm) -14.89 $1,122.82 16100
FAME Distillation
Column
Stages (5)
Feed (3)
Mole-RR (0.5)
Pressure (0.3 atm)
-20.04 $30,667.00 70500
386.89
Glycerol
Distillation Column
Stages (3)
Feed (2)
Mole-RR (0.5)
Pressure (0.5 atm)
-11.70 $3,029.32 52800
28.50
Utility Cost ($/yr) $49,145
Raw Materials Cost ($/yr) $22,222,700

Biodiesel Production via Catalytic Distillation
149
Table 31: Detailed cost analysis for optimum design and operating conditions for the catalytic distillation configuration (Configuration B)
Configuration: CD
Equipment Optimal
Spec.
Optimal Operation
Condition
Heat Duty
(kWatt)
Equipment
Utility Cost
($/yr)
Total
Operating
Cost ($/yr)
Equipment
Purchase Cost
($)
Total
Capital
Cost ($)
Decanter Volume
(1.80 m3)
Temp. (150 C)
Pressure (1 atm) -415.90 $13,423.32
$25,001,100
$13,500
$3,439,170 RADFRAC
Stages (7)
Feed (2, 6)
(8.53 m
high)
Mole-RR (0.6) Pressure (3
atm)
Per Stage Pressure drop
(0.1 atm)
-210.30
$26,815.98 $89,700 620.56
Utility Cost ($/yr) $40,239.30 -
Raw Materials Cost ($/yr) $22,207,200

Biodiesel Production via Catalytic Distillation
150
Table 32: Per gallon production cost of biodiesel for configurations A and B
The implementation of heterogeneous catalyst systems for the biodiesel simulations in this
study deserves special attention – In spite of slower reaction kinetics and higher costs, they
constitute an interesting area of study in the biodiesel process. Use of heterogeneous catalyst
systems would significantly simplify the separation process and reduce equipment and utility
costs. Since glycerol is a valuable byproduct of the biodiesel production process, we believe, a
relatively purer supply of glycerol from use of heterogeneous catalyst systems would
considerably benefit the cost of the overall process. Other merits include higher selectivity,
water tolerance and life time of the catalyst. In this work, we try to approximate the catalyst
requirements and associated costs into the total annual operating costs of the whole process. It
must be noted that our simulations are modeled on kinetic parameters taken from the
Conventional Process CD Process
Total Capital Cost [USD] $5,871,380 $3,439,170
Total Raw Materials Cost [USD/Year]
(Methanol + Soybean Oil)
$22,222,700 $22,207,200
Total Utilities Cost [USD/Year] $49,145 $40,239
Total catalyst costs $190,751 $301210
Total Operating Cost [USD/Year] $25,509,398 $25,001,100
Total Product Sales [USD/Year]
(Glycerol)
$7214920 $7172290
Total "FAME Stream" flow (lb/hr) 8903 8908
FAME Mass fraction 0.99 0.99
Total FAME Mass (kg/hr) 4027 4019
Density (kg/m3) at 25° C and 1 atm 870 870
Total Volume (m3/yr) 40548 40473
Price without considering glycerol
revenue ($/gallon)
2.39 2.36
Price considering glycerol revenue
($/gallon)
1.71 1.67
Biodiesel Production via Catalytic Distillation
151
performance of 20 % calcium oxide supported on Al2O3 (20 % calcium oxide by weight, 80 %
alumina) as solid base (discussed in section 2, [146]). Assuming a catalyst life of 1 year, and
catalyst loading of 3 % weight of catalyst to oil ratio (maximum ester yield at this ratio [146]),
costs associated with this heterogeneous catalyst system are added to the economic analysis
results generated from the Aspen Process Economic Analyzer Tool. For the conventional
process, the residence times associated with the packed bed reactor was used to approximate
the triolein amount at any specific time inside the reactor and accordingly, the catalyst
requirement was calculated. For the CD configuration, the liquid holdup on each stage and feed
composition and flow rate was used to approximate the triolein amount and the corresponding
catalyst requirements. Price specifications for alumina Al2O3( Brockmann I, activated, 150
mesh size) and Calcium nitrate terahydrate Ca(NO3)2.4H2O for synthesizing calcium oxide
were taken from Sigma Aldrich Chemicals. The associated catalyst requirement were for
configuration A (the reaction + distillation process) is around 1907 kg/year whereas for
configuration B (CD process), it is 3012 kg/year. As of August 2013, Sigma Aldrich prices for
alumina Al2O3( Brockmann I, activated, 150 mesh size) is 387 dollars for 5 kg and for Calcium
nitrate terahydrate Ca(NO3)2.4H2O is 268 dollars for 2.5 kg. Using these prices, the cost of a
catalyst system comprising 20 % calcium oxide and 80 % alumina by weight comes out to be
72.64 dollars per kg. Since batch and bulk costs for chemicals vary significantly, the catalyst
was assumed to have an average cost of 100 dollars per kilogram. This price also allows some
compensation for loss in material while synthesizing the catalyst and costs involved in
preparing the catalyst bed. The total catalysts costs hence were approximately 190751 dollars
for the conventional process and 301210 dollars for the CD process. These figures are rough
estimates for catalyst requirements and cost and will vary depending on packing, bed
characteristics, equipment geometry, temperature and pressure conditions and flow rates of the
process. The objective of calculating catalyst requirement in this research is to gauge an idea
of the probable costs associated with changing the biodiesel production process to
heterogeneous catalysis since no cost estimate for a heterogeneous catalyzed process for
biodiesel was available in literature. It is of note that the catalyst requirement for CD process
appears to be more than the conventional process. Further investigation of composition and
temperature profiles for the CD column demonstrate most of the reaction taking place in
between trays 1 and 3. Hence, in actual running of the CD column, the required catalyst loading
for the bottom trays should be lesser than the calculated value and both configurations would
have relatively closer catalyst requirements.
Results demonstrate that the CD process for biodiesel production is significantly economical
compared to conventional process in terms of capital costs and utility costs. There is only
meagerly savings in terms of total operating and raw material costs per year. The total capital

Biodiesel Production via Catalytic Distillation
152
cost in dollars for the catalytic distillation configuration (B) is 3.44 million dollars (41.42 %
less) compared to 5.87 million dollars for the reactor separation configuration (A). These capital
costs are in agreement with reported capital costs for 10 million gallons annual production
biodiesel plants that use soybean oil as feedstock using homogeneous catalysts[151, 159, 160].
The total operating cost in dollars per year for the catalytic distillation configuration (B) is
24.95 million dollars (1.46 % less) compared to 25.32 million dollars for the reactor separation
configuration (A). Numbers for operating costs for an annual 10 million gallon biodiesel
soybean oil facility closely matches reported literature [151, 161]. Since we are working at
same flow rates and achieving same conversions, the raw material costs per year for both
configurations are nearly identical. The utility costs per year for the catalytic distillation
configuration (B) are 18.12 % lower as compared to the reactor separation configuration (A).
Aspen used inbuilt heat integration techniques (Pinch technology) to minimize the utility costs
that can be accessed using the energy analysis icon on the analysis toolbar. Utility usage and
utility costs corresponding to each equipment in flow sheet configurations A and B are listed
in Tables 30 and 31.
The production cost per gallon of biodiesel is a significant factor to predict the profitability
of the production process. From the annual production capacity and the total operating cost per
year for the plant, the production cost per gallon of biodiesel was calculated. The calculations
are shown in Table 32. The production cost per gallon of biodiesel for both configurations
comes out to be around 2.3-2.4 dollars per gallon. After accounting for the glycerol sales from
the product stream, the production cost comes out to be around 1.6-1.7 dollars per gallon for
both the configurations. Figures for production costs are in agreement with [151, 162] and
several white papers published. It may be noted that in literature [151], published in 2005, a
biodiesel production cost of around 2 dollars per gallon was predicted. Our predicted costs are
very close, if the cumulative inflation factor between years 2005 and 2013 (around 15.06 % as
predicted by Statistics Canada) was considered between the raw material costs.

Biodiesel Production via Catalytic Distillation
153
5.1.4 Conclusions
Results depict CD to be a promising candidate to replicate the conversion and product purity of
conventional biodiesel processes while having significant savings in capital (41.42% cheaper
than conventional process) and utility costs ( 18.12% lesser than conventional process) , thereby
making it a very competitive alternative. The total operating costs and price of production per
gallon of biodiesel was only meagerly cheaper in a CD process since the most significant factor
to the biodiesel production process is the raw material cost. Results demonstrate that CD can
commercially replace the conventional reactor separation technology for biodiesel production
via transesterification process. Another advantage of CD configuration was possibility of high
pressure operation while maintaining low product stream temperatures.

Biodiesel Production via Catalytic Distillation
154
5.2 Catalytic Distillation for production of biodiesel from waste cooking
oil
Commercialization of biodiesel presently is constrained by two major problems: process
economics of production and debate on food versus fuel. The cost of production of biodiesel
without government support through subsidies is almost 1.5-2 times that of petroleum diesel
[163, 164]. Specifically, in terms of high biodiesel process costs, 70–95% of the total biodiesel
production cost is attributed to the cost of raw materials (e.g. virgin vegetable oil)[69, 163,
164]. In terms of the food versus fuel debate, extensive use of edible oils/food crops for
biodiesel production has been debated on fears that it might lead to food insecurity and
rocketing food prices especially in developing countries[165, 166].
The challenge hence is to develop biodiesel production technologies via cheaper feedstock or
those unsuitable for human consumption. This would solve the twin problems of process
economics as well as the food versus fuel debate. Yellow grease (waste cooking oil or used
frying oil) is fast emerging as a promising alternative owing to its low cost and the
environmental advantage of residue utilization [167]. Yellow grease as a biodiesel feedstock
costs approximately half to that of soybean oil [168], the most common biodiesel feedstock in
the US. Low cost of yellow grease brings the projected production cost very close to diesel after
considering government subsidies [168]. Safe disposal of yellow grease is a major problem in
many nations and there are severe restrictions and penalties against its disposal in the waste
drainage [169]. Yellow grease is abundant in both N America and Europe – yellow grease
production in the US in 2011 is estimated to be around 0.6 million tons per year [170], Europe
today produces close to a million tons per year [171]. In Canada, approximately 120,000 tons
of yellow grease is produced per year[149].Yellow grease, hence could be a feasible source for
biodiesel production, which after government subsidies could compete with petroleum diesel
in terms of cost as well as contribute towards waste utilization and environmental benefits.
The composition of free fatty acids (FFA) in yellow grease varies up to a maximum of 15 %
(w/w)[172], yellow grease is defined as vegetable oils or animal fats with a FFA less than 15%
[173], and the rest is mostly comprised of triglycerides. The FFA content in yellow grease is
generated through the hydrolysis of triglycerides resulting from the high temperatures of typical
cooking processes in the presence of water released from the foods and hence varies depending
on the cooking process, the storage and collection conditions [173, 174]. Yellow grease in a
chemical reactor undergoes both trans-esterification and esterification reactions to produce
biodiesel, hence products in the reactor outlet are FAAE (biodiesel), glycerol and water
The objective of this research is to examine the efficacy of catalytic distillation (CD) and the
merits it would bring into a biodiesel process that utilizes yellow grease as a feed. In particular,

Biodiesel Production via Catalytic Distillation
155
we are working towards proposing a new green process for continuous biodiesel production
using CD. Biodiesel production via simultaneous esterification and trans-esterification of
yellow grease meets the design criteria of CD due to a number of reasons. During the operation,
most of the methanol would be in a vapor phase while the conversion to biodiesel would happen
in a liquid phase. The products water, glycerol and FAAE (biodiesel) have significant volatility
difference that makes separation by distillation favorable. Secondly, the overall heat of reaction
considering both transesterification and esterification reactions for biodiesel production is
exothermic [144] and a CD operation is hence favored since the energy liberated can be utilized
in situ to drive the distillation process and enhance energy integration. Also, esterification and
transesterification reactions are reversible and CD allows for the constant removal of product
from reaction zones, thereby shifting chemical equilibrium to the right towards the products
[20] in accordance with Le Chatelier’s principle. Thirdly, heterogeneous catalyst systems in
CD would add economic and environmental merits to the biodiesel process, especially in terms
of separation of biodiesel from the catalyst and reduction of water usage for cleaning the
products.
The technique employed to achieve this research goal is to first advance green chemistry
principles by developing a multifunctional catalyst system that would simultaneously facilitate
the two major biodiesel chemical transformations and could be integrated in a continuous
system without requirement of any further purification steps. Most plants producing biodiesel
employ batch reactor processes using pure vegetable oils and liquid base such as NaOH
resulting in high production costs at high production rates[175]. Current processes for biodiesel
production from yellow grease is quite complicated as NaOH will react with FFA producing
sludge. A liquid acid, H2SO4, is used to esterify the FFA in the first step, followed by
transesterification. A solid acid that can accomplish both esterification and transesterification
will simply the production of biodiesel from waste oils. The next step is to develop process
design for high quality biodiesel production from yellow grease via simultaneous esterification
and transesterification in a continuous process in 2 competing configurations - one using a
conventional configuration and one using a proposed CD configuration.
In our laboratory, we have developed solid acid catalyst systems to produce biodiesel from
waste oils containing free fatty acids in a single step. The catalyst studied here is a
heteropolyacid (HSiW) on alumina. A solid acid catalyst is used since they offer several
advantages (highlighted in Figure 43) over homogeneous catalysts such as easy separation of
products, catalyst reusability, less amount of wastewater, eliminating corrosion and
environmental problems [176, 177]. Among solid acids, heteropolyacids (HPA) and their salts
are a class of highly acidic polyoxometalates which are made up of heteropolyanions having
metal–oxygen octahedral as the basic structural unit[178]. Supported HPAs have been used for

Biodiesel Production via Catalytic Distillation
156
the production of biodiesel from yellow grease as both esterification of FFA and the
transesterification of glycerides are catalyzed. This approach thus eliminates the necessity of
FFA removal and makes possible the use of low-grade oils and fats as a feedstock. Furthermore
it is reported that Bronsted acid catalysts are mainly active for esterification reactions while
Lewis acid catalysts are more active for transesterification reactions [179]. HPAs consist of
heteropoly anions with metal–oxygen octahedral as the basic structural unit show strong
Bronsted acidity [178, 180, 181] and hence, are effective for esterification. The kinetics of
esterification of FAA and transesterification of triglycerides obtained on this catalyst system is
used to carry out energy and economic analysis for biodiesel production from yellow grease in
a conventional and CD process configurations. Kinetic results for the catalyst system are
tabulated in Table 33.
Figure 43: Numerous advantages of the solid heteropolyacid catalyst HSiW for biodiesel
production from model yellow grease feed
Table 33: Arrhenius Parameters for the biodiesel reactions
The next step is to employ process design techniques and process modeling and simulation
tools to investigate the possibility of improving the biodiesel production via CD and to outline
and quantify the resulting process improvements. To achieve this aim, the conventional
biodiesel process flow sheet and CD process configurations is modeled in Aspen Plus, one of
Insensitive to FFA
Multifunctional (Catalyzes both
esterification and transesterification)
Less impurity in the biodiesel and
glycerol produced
Ease of catalyst separation
Non toxic
Can be reused
Trans-esterification Reaction of triglycerides to biodiesel
Pre-Exponential Factor (A) (sec-1) 10.1
Activation Energy (Ea) (KJ/mol) 58.32
Esterification Reaction of FFA to biodiesel
Pre-Exponential Factor (A) (sec-1) 0.128
Activation Energy (Ea) (KJ/mol) 34.06

Biodiesel Production via Catalytic Distillation
157
the most extensively used chemical engineering packages. By creating and juxtaposing these
process configurations, conclusions could be drawn. Though results from process simulations
and actual process operations differ to some extent, simulation software tools predict fairly
reliable and accurate information on process operations and the influence of process
parameters because of their comprehensive thermodynamic packages, rich component data,
and astute calculation techniques. Hence the modeling results could provide a comparison
between the performances of competing technologies in actual operations.
Two process configurations depicting continuous production of biodiesel are modeled in
ASPEN Plus. The first configuration (A – Figure 44) is the conventional reactor separation
flowsheet where trans-esterification and esterification take place in the reactor and the products
are separated in a sequence of distillation columns. The second configuration (B- Figure 45) is
a CD column that accommodates both the reaction and separation in one distillation column.
For the same biodiesel production capacity, a comparison of the total energy requirements and
process economics is performed between the two process configurations. The savings in energy
requirements, capital costs and operating costs are then quantified to compare the effectiveness
of each process.
For the conventional process, reaction kinetics is modeled in a continuous plug flow reactor.
The trans-esterification and esterification reactions for the production of biodiesel in industry
can be carried out in different reactors such as a plug flow or combined stirred tank reactors
[148, 149]. The choice of a reactor is dependent on the process conversion, volume and
residence time requirement. Plug flow and packed bed reactors are known for achieving the
highest conversion per unit of volume and they also require lower maintenance and shutdown
times [150].
Steps for developing the process model and running the simulations for each of the
configurations involve defining chemical components, choosing an appropriate thermodynamic
model, and determining the optimum operating conditions (temperature, pressure,
concentrations etc.) and the size of operation (production capacity) and process units.
Information on all chemical components of the biodiesel reaction system (methanol, water,
methyl oleate, glycerol) are available in the Aspen Plus library except the feed molecule, yellow
grease. Yellow grease composition has been reported to be 20% w/w FFA and 80% w/w
triglycerides [182]. The 20% w/w FFA content in yellow grease is a mixture of palmitic acid
l8%, oleic acid 47%, linolic acid 13%, and linolenic acid 3%. To model yellow grease in this
simulation, triolein (C57H104O6) is chosen as a model compound to represent the triglyceride
component and oleic acid is used to represent the FFA component. The reactant inputs in the
process models are hence oleic acid, triolein and methanol while the products are biodiesel,
glycerol and water. For all the two flow sheet simulations, the process type selected in the

Biodiesel Production via Catalytic Distillation
158
Aspen Plus environment was ALL and the base method selected for property calculation was
UNIQUAC, which uses ideal gas and Henry’s law, best fitting the processes conditions.
The production capacity in each process configuration is set around 10 million gallons of
biodiesel which closely matches both the current yellow grease production per year and the
capacity of most current biodiesel plants using waste oil as feedstock (discussed in
Introduction). Finally all process configurations are designed so as to yield the final biodiesel
product as per ASTM standards. The ASTM standard for purity of biodiesel product is 99.65
wt %[149]. Most biodiesel standards allow only 0.2 % of methanol in product [156]. These
purity constraints were considered in maintaining the biodiesel purity in the two process
configurations.
In recent studies, several biodiesel process simulation models have been presented to assess the
economic feasibility of biodiesel production plant configurations using waste oil as a feedstock
via different catalyst systems(homogeneous–acid-catalyzed[183-186],base–catalyzed[183-
187]; heterogeneous – acid catalyzed[185], base catalyzed[188] etc.). However, most of these
simulation models considered biodiesel production processes in conventional reactor separation
configurations. Since high production and energy costs impede biodiesel production processes,
the design of innovative chemical reactors and separation units to facilitate continuous
processing of waste oil into biodiesel is one area of development that is likely to reduce the cost
for biodiesel production in the near future. This research shows that CD is a novel approach to
make the biodiesel process more efficient and cost-effective. Although CD has been studied in
batch mode for biodiesel production, there is a need to move towards heterogeneously
catalyzed, continuous flow reactors in order to avoid the separation issues of homogeneous
catalysts and drawbacks of batch mode (notably increased capital investment required to run at
large volumes and increased labor costs of a start/stop process) and increase the scale of
operation to million gallons per year, important criteria that have been addressed in this
research. In particular, a systematic and comprehensive techno-economic comparison between
the conventional biodiesel process and CD is presented so as to outline key indicators that
determine the process efficiency and profitability. The savings in energy requirements and
capital costs could then quantified to relate the effectiveness of each process.
The intensification of a biodiesel production process via catalytic distillation (CD) is
investigated. In this paper, simulation of an annual production around 10 million gallons of
biodiesel production in each process configuration was carried out. Most dedicated biodiesel
plants using yellow grease as a feedstock have been reported to be of this capacity [189], e.g.

Biodiesel Production via Catalytic Distillation
159
the Rothsay biodiesel plant in Quebec, Canada using animal fats/yellow Grease as feedstock
produces about 12 million gallons per year of biodiesel [189].
5.2.1 Configuration A (Conventional Reactor plus Separation Process)
A simplified process flow diagram (Figure 44) for the conventional biodiesel production process is
simulated in Aspen Plus after a review of the various state of the art industrial biodiesel
technologies proposed in literature [149, 190]. The process flow sheet features a continuous plug
flow reactor for the chemical reaction. The reaction products are then fed to a sequence of flash
and distillation columns for the separation of methanol and water and purification of bio-diesel and
glycerol. The excess of methanol is recycled back to the reactor.
The process units used in the conventional process flowsheet are a mixer, a plug flow fixed bed
reactor (PFR), a flash separator, a decanter and four distillation columns (modelled by Radfrac
distillation models). The mixer functions to enable the recycle of the overhead methanol streams
from the methanol distillation columns back into the reactor. The flash separates the methanol,
water and glycerol from the biodiesel product (methyl oleate). The decanter splits the methyl oleate
into two streams – one rich in biodiesel and one rich in glycerol. The function of the methanol
distillation column (METHGLY) is to separate methanol from glycerol and water and to recycle
this methanol stream back into the reactor. The glycerol distillation column (GLYDIST) RadFrac
unit is placed to separate glycerol from other impurities and obtain a high purity glycerol. It is to
be noted that there are two streams for glycerol in this flowsheet, glycerol is also produced from
the bottom of the METHGLY column. The third Radfrac distillation unit (BIODIST) serves to
purify the biodiesel rich stream from the decanter to produce pure bio-diesel (mole purity > 99%).
The fourth distillation unit (RECDIST) receives methanol from the top products of the distillation
columns and purifies it before recycling back into the reactor.
A constant feed of mass flow rate rate of 7492 kg/hr at a methanol to oil optimum mass ratio of
around 1:1 is fed to the reactor. This feed rate corresponds to an annual biodiesel production of 10
million gallons per year. Excess methanol (a mass ratio of 1:1 corresponds to a molar ratio of more
than 20) is typically added to the biodiesel batch reactors to drive the equilibrium reaction forward.
Without an excess of alcohol in a batch reactor, the process reaches equilibrium before all the feed
are converted to biodiesel, resulting in a poor fuel that does not meet ASTM standard and can be
corrosive. The excess methanol shifts the equilibrium esterification or transesterification reaction
to produce more biodiesel and the excess methanol can be recycled.
For the biodiesel production, an isothermal operation in a plug flow reactor is chosen with no
pressure drop at a temperature of 160° C. Reaction temperatures higher than 150° C do not
significantly affect the biodiesel yield but increase the cooling water utility requirements, reactor
operation was optimized at 160° C as maximum conversion was achieved at this temperature in the

Biodiesel Production via Catalytic Distillation
160
150°-200°C range in our laboratory batch reactor experiments. A conversion of almost 100% is
achieved. The product stream from the reactor is at 160° C and 15 atmosphere.
Pure component property from the Aspen Library suggests that the separation will not be a problem
as the separation would be governed by the difference in boiling points and the density of the
products . The reaction products from the reactor are now taken to a series of separation units (Flash
and Distillation columns) to get purified product. Since the boiling point of methyl oleate (349° C
at 1 atm) is significantly greater than that of methanol (64.7°C at 1 atm), glycerol (287.85° C at 1
atm) and water (99.98° C at 1 atm), a flash separator is utilized to isolate the methyl oleate from
glycerol, water and methyl oleate. This process is one of the simplest unit operations where a liquid
mixture at high temperature and enthalpy is taken to a region of low pressure causing the liquid to
partially vaporize. Flash separations are very common in industry, particularly petroleum refining,
even when some other method of separation is to be used, so as to use a "pre-flash" to reduce the
load on the separation itself and achieve a good separation. A rigorous trial and error procedure
was used to determine the optimum operating conditions for the best possible separation. The final
and optimum operating conditions for the flash drum were 1 atm and 160o C. The top stream from
the flash has 93.85 mole % methanol with glycerol 3.58 mole % and water 2.50 mole % which
need to be separated. The bottom stream from the flash separation unit composed primarily of the
biodiesel product- methyl oleate (95.52 mole %) which was taken to a decanter for separation of
methyl oleate from other impurities (glycerol 1% and methanol 3 %) via gravity separation.
The decanter functions to further purify the biodiesel product (methyl oleate) from the the
methanol, glycerol and water produced in the flash bottoms. Components are separated in a
decanter based on the difference in their densities. The separation can also be achieved by using a
gravity settler [153]. The decanter operates at 120° C and 1 atm. The bio-diesel stream from
decanter has a biodiesel mole purity of 96.63% with 3.18 mole % methanol which is sent to a
distillation column for purifying the biodiesel so as to separate the methanol to meet the biodiesel
ASTM purity standards. Residual methanol in the biodiesel fuel is a major environmental and
health hazard due to a number of reasons and hence, most biodiesel standards allows only 0.2% v/v
methanol in the final product [155]. Methanol is toxic (ingestion of 10 ml causes permanent
blindness), has cold-start problems, lower energy density and evaporates quickly when exposed to
air. Excess methanol can also make the fuel flammable and more dangerous to handle and store
besides, corroding metal components of engine [148, 155, 156]. The glycerol rich stream from
decanter has a glycerol mole purity of 88.8 % which is purified to >99 mole % glycerol in the
GLYDISTL distillation column. The methanol from the top product is recycled back to the reactor.
In the conventional reactor separation configuration, 4 distillation columns are employed for
methanol recovery and for the purification of biodiesel and glycerol. RADFRAC model in the
Aspen library are used for simulating these columns. The biodiesel rich product is taken to the
biodiesel purifier distillation column that operates with 5 stages and at a reduced pressure (vacuum

Biodiesel Production via Catalytic Distillation
161
distillation) of 0.3 atm so as to yield biodiesel purified product at a lower temperature. Biodiesel
starts thermal degradation via isomerism, polymerization and pyrolysis at temperatures exceeding
275° C [154]. Low pressure distillation for biodiesel has also been reported in the literature [69,
149]. The biodiesel distillation column achieved a biodiesel purity of 99.99 mole % in the bottom
stream. The top stream from this column has mixed composition of all components at very low
flow rates and is purged.
The glycerol purification column had 5 stages and operates at reduced pressure so as to produce
glycerol product below its boiling point of 287.7o C. The column produces glycerol with 99.99 %
mole fraction which is a high valued by-product. The top stream from the flash comprising mostly
of methanol (93.85 mole %) is taken to the methanol purifier distillation column to produce high
purity methanol for recycle back to the reactor. The methanol distillation column has a total of 5
stages and operates at 1 atmosphere pressure producing a high purity top methanol stream (98.42
mole %). This methanol stream is merged with top product from the glycerol column and taken to
a final distillation column comprising of 8 stages before a recycle to the reactor. The design flow-
sheeting option is used in Aspen Plus so that the total methanol to oil mass ratio that goes into the
reactor remains constant at 1:1. The bottom stream from the methanol purification distillation
column is rich in glycerol (99 % mole), second by-product stream in the process. The composition
and flowrates of all constituent streams for the conventional reactor separation configuration is
shown in Table 34.

Biodiesel Production via Catalytic Distillation
162
Table 34: Operational Conditions for major process streams in the conventional reactor separation configuration flowsheet (A)
REACIN REACOUT FLMETH F-BOT BIODRICH GLYCRICH BIODIESEL GLYCEROL
Temperature (°C) 45 160 160 160 120 120 245 287
Pressure (atm) 1 1 1 1 1 1 0.3 1
Component Mole Flow
(kmol.hr-1)
Methanol 109.501 95.941 95.47 0.4611 0.44378 0.0173989 ~0 ~0
Triolein 3.81639 ~0 ~0 ~0 0 0 ~0 ~0
Oleic Acid 2.1116 ~0 ~0 ~0 0 0 ~0 ~0
Water 0.4436 2.55481 2.549 0.00559 0.00481 0.000784758 ~0 ~0
Glycerol ~0 3.81641 3.650 0.1660 0.02509 0.144967 ~0 3.05194
Methyl Oleate ~0 13.5604 0.0523 13.508 13.508 0 13.2788 ~0
Component Mole
Fraction
Methanol 0.9450 0.827 0.9385 0.03261 0.031749 0.1066 ~0 ~0
Triolein 0.0329 ~0 ~0 ~0 0 0 ~0 ~0
Oleic Acid 0.0182 ~0 ~0 ~0 0 0 ~0 ~0
Water 0.0038 0.0220 0.02505 0.000345 0.000344 0.0048 ~0 ~0
Glycerol ~0 0.329 0.035882 0.0117431 0.01508 0.888 ~0 ~1
Methyl Oleate ~0 0.117 0.00005 0.955246 0.966398 0.0001 ~1 ~0
Total Mole Flow
(kmol.hr-1) 115.873 115.873 101.732 14.1409 13.9777
0.16318
13.2788 3.05195
Total Mass Flow (kg.hr-1) 7492 7492 3457.01 4035.22 4021.29 13.931 3937.08 281.068

Biodiesel Production via Catalytic Distillation
163
Figure 44: Configuration A (Conventional Reactor Separation Process)

Biodiesel Production via Catalytic Distillation
164
5.2.2 Configuration B (Catalytic Distillation Process)
As pictured in configuration A, the conventional reactor separation process employs 4 distillation
columns for achieving high purity biodiesel conforming to ASTM standards and a fairly pure
glycerol stream that could be sold as a by-product. Distillation is an extremely energy intensive
process, with a low thermodynamic efficiency that makes the overall process highly inefficient and
costly. The large number of distillation columns result in associated increased utility and
maintenance costs. Due to the increased concern for the environment and costs associated with
capital expenditures and energy requirements, biodiesel production from yellow grease presents an
excellent opportunity for the application of CD to make the process flow sheet simpler, more energy
efficient and to maximize plant profitability.
One of the most significant merits that a CD process brings to the biodiesel production is
simplification of the flow sheet (the plug flow reactor and flash separation unit are eliminated from
the flowsheet) and significant savings in equipment capital and operating costs. In particular, the
biodiesel process is intensified by removal of the plug-flow reactor and replacement of the flash
and methanol distillation unit by a single catalytic distillation column in configuration B where
both reaction and separation occur in a single distillation column. For the CD configuration, the
process units required are a reactive distillation column (RADFRAC) for the biodiesel reaction and
its separation from other components, 3 distillation column for methanol separation, glycerol and
biodiesel purification and a decanter for glycerol and methyl oleate ( biodiesel) separation. Mixers
serve to collect recycle streams from different units and send the merged stream back into the
reactive distillation unit.
The CD process unit was modelled in Aspen Plus using an equilibrium RadFrac model with a total
number of 10 stages and a reflux ratio of 0.5. The lighter component, methanol was added on the
8th stage closer to the reboiler while the heavier feed component yellow grease was added on the
3rd stage nearer to the condenser. The reaction takes place between stages 4-8. The pressure of the
CD column was maintained at one atmosphere pressure. No stage pressure drop was assumed. The
net heat effect of the trans-esterification and esterification reactions occur is exothermic so the heat
generated in the CD column via the reaction was used to separate the products of the reaction, hence
reducing the total energy requirements of the re-boiler and aiding the separation process.
The top stream from the CD column is rich in methanol (99.06 mole %). The bottom stream of the
CD column is rich in biodiesel (50.88 mole %) and glycerol (14.30 mole %) which is then
transported to a decanter for separation of these two components based on their density differences.
The decanter operates at 1 atmospheric pressure and a temperature of 150°C. The decanter separates
this stream into biodiesel rich and glycerol rich streams which are then taken to subsequent
distillation columns as outlined in configuration A. The final biodiesel product obtained has a purity
of 99.28% mole fraction with less than 0.2% mole fraction of methanol. The glycerol obtained has

Biodiesel Production via Catalytic Distillation
165
a purity of 99.82% mole fraction and both the products meet the ASTM standards of purity. The
composition and flow rate of all constituent streams for the CD configuration is shown in Table 35.
It is to be noted that the CD flowsheet has only one purge stream instead of two purge streams in
the conventional process. The top product from the biodiesel distillation column BIODIST in the
CD configuration contains methanol at a mole purity of 92 % which is recycled to the fresh feed:
in conventional process this is purged due to low composition of the raffinate (methanol).

Biodiesel Production via Catalytic Distillation
166
Table 35: Operational Conditions for major process streams in the Catalytic Distillation (CD) configuration flowsheet (B)
Stream CDFEED CDTOP CDBOT GLYRICH BDRICH GLYCEROL BIODIESEL
Temperature (oC) 45 112.13 146.701 150 150 254 243
Pressure (atm) 1 5 5 1 1 1 0.3
Component Mole Flow
(kmol.hr-1)
Methanol 126.15 105.09 7.56 4.078 3.485 ~0 0.0519
Triolein 3.82 0.0074 0.015 ~0 0.1528 ~0 0.0153
Oleic Acid 2.11 ~0 ~0 ~0 ~0 ~0 ~0
Water 0.52 0.980 1.654 1.387 0.268 ~0 0.0003945
Glycerol ~0 ~0 3.794 3.76 0.029 3.607 0.02975
Methyl Oleate ~0 ~0 13.49 0.00361 13.49 ~0 13.49
Component Mole Fraction
Methanol 0.951 0.990 0.285 0.442 0.202 ~0 0.00382
Triolein 0.028 ~0 0.00058 ~0 0.000883 ~0 0.01123
Oleic Acid 0.016 ~0 ~0 ~0 ~0 ~0 ~0
Water 0.0039 0.009 0.062 0.1502 0.0150 ~0 ~0
Glycerol ~0 ~0 0.173 0.4077 0.0017 0.9982 0.00219
Methyl Oleate ~0 ~0 0.5088 0.000392 0.78 ~0 0.9928
Total Mole Flow (kmol.hr-1) 132.602 106.08 26.52 9.233 17.2874 3.607 13.587
Total Mass Flow (kg.hr-1) 8027.58 4635.87 3391.71 503.414 4132.46 332.218 4017.64

Biodiesel Production via Catalytic Distillation
167
Figure 45: Configuration B (CD Process)
168
5.2.3 Process Comparisons (Cost, Energy, Emissions and Waste Elimination)
The two process configurations produce the same biodiesel percentage purity in the final stream at more
than 99.00% and at the same flow rates corresponding to an annual biodiesel product rate of 10 million
gallons. In each of the two processes, the ASTM standards for biodiesel purity are produced; the methanol
concentration in all the processes for the final biodiesel stream was less than 0.2% v/v making the biodiesel
suitable for use. The objective of this research is to compare the capital and utility costs of the two
configurations so as to define the most cost efficient process. To compare the process economics of the two
processes Aspen Process Economic analyzer tool (formerly: Aspen Icarus Process Evaluator) was used.
The Aspen Process Economic Analyzer is a powerful project scoping tool that could evaluate the economic
impact of process designs by expanding unit operations from simulator output to equipment models using
proprietary mapping technology, and calculating preliminary sizes for these equipment items. The
interactive equipment sizing determines capital and operating costs and investment analysis and is hence
able to compare competing technologies for economic analysis and/or evaluate alternative process
configurations.
5.2.3.1 Capital and Operating Costs
Tables 36-38 depict the total capital costs, total operating costs, equipment purchase costs and annual
utility and raw material costs for configurations A and B for an annual biodiesel production of around 10
million gallons per year. These values were evaluated via the Aspen Economic Analyzer tool via sizing
and economic evaluation of block and process flow diagrams from the process stream information. The
feed stream prices were set us 0.755 cents per kg for yellow grease [191] and 0.532 cents per kg for
methanol [157]. The glycerol produced at more than 99 % mole purity as a by-product in the process was
assumed to bring a revenue at 0.8 cents per kg[192]. The total capital corresponds to the investment required
for purchase of equipment, cost of labor and materials (direct installation costs), costs for site preparation
and buildings, and certain other costs (indirect installation costs). It also includes costs for land, working
capital, and off-site facilities. The total operating costs includes labor, maintenance, utilities, and raw
material costs. Detailed information regarding parameters and evaluation basis for operating and capital

Biodiesel Production via Catalytic Distillation
169
costs can be found out via generating the economics report file from the Aspen process economic analyzer
toolbar.
Economic results generated from the Aspen Economic Analyzer tool show a remarkable reduction in terms
of investment and energy costs brought by CD. The elimination of reactor and flash units by introduction
of CD greatly reduced the equipment and capital cost. The total capital cost in dollars for the CD
configuration (B) is 6.3 million dollars (22.2 % less) compared to 8.1 million dollars for the reactor -
separation configuration (A). These capital costs are in agreement with reported capital costs for 10 million
gallons annual production biodiesel plants that use soybean oil (feed considered is model yellow grease
with 85 % mass triglycerides) as feedstock [151, 159, 160]. These figures add strength to the view that
employment of CD technology in biodiesel production plants will significantly bring large scale reductions
in capital investment. Comparison of energy requirements between the two configurations confirmed that
the CD process substantially reduces the energy footprint of the biodiesel process. The CD process on
account of the exothermic reaction heat driving the separation of methanol in the CD unit and dissipating
the heat, leads to significant reduction in both hot and cold utility requirements. The total hot utility duty
of the CD process in configuration B (2371.75 KW) is almost half (49.38 % reduction) of the conventional
process in configuration A (4685.6 KW), the cold utility requirements in the CD process (2580.51 KW) is
46.96 % less than the conventional process (4865.45 KW). The CD configuration is significantly
economical in terms of utility (energy) costs. The utility costs per year (649,711 dollars) for the CD
configuration (B) are 32.30 % lower as compared to the reactor separation configuration (A) which has an
annual utility cost of 959,828 dollars. The savings in energy results in the reduction in the emissions of
green-house gases and gain of environmental credits (discussed later). Aspen used inbuilt heat integration
techniques (Pinch technology) to minimize the utility costs that can be accessed using the energy analysis
icon on the analysis toolbar. Utility usage and utility costs corresponding to each equipment in the flow
sheet configurations are listed in Tables 36 and 37. Operating costs in biodiesel production processes are
heavily dependent on the raw material cost [69, 151, 183] . Since we are working on approximate the same
flow rates and conversions in both configurations, there are no significant reductions in operating costs
between the two configurations; however it is noteworthy that in the CD configuration, the operating cost
is marginally lower (2.7 % less) and sales revenue from glycerol is more. This is achieved on account of
lower energy costs and better utilization of raw materials as the purge stream flow rates are lower due to
efficient separation. Numbers for operating costs for an annual 10 million gallon biodiesel soybean oil
facility closely matches reported literature [151, 161].
Biodiesel Production via Catalytic Distillation
170
The production cost per gallon of biodiesel is a decisive cost indicator to predict the feasibility and viability
of the biodiesel production process. From the annual production capacity and the total annual operating
cost figures, the production cost per gallon of biodiesel for each configuration was calculated. These
calculations are shown in Table 38. The production cost per gallon of biodiesel for the CD configuration
is 2.46 dollars compared to 2.62 for the conventional process. After accounting for the glycerol sales from
the product stream, the production cost for CD configuration is 2.24 dollars per gallon. Figures for
production costs are in agreement with [151, 162] and a private communication with a leading biodiesel
manufacturing company in Canada. We believe figures supported by government subsidies would make
biodiesel production a very attractive and sustainable option from an economic and ecological viewpoint.
5.2.3.2 Catalyst Requirement and Costs, Emissions Control and Waste Minimization
While catalysts add value in many ways to a process, ranging from the reduction of cost of manufacture to
improving the quality of the chemical product, to the reduction of environmental emissions, catalyst costs
are an important contributor to the overall process cost. Determination of catalyst mass is a challenging
problem in the conceptual design of most continuous industrial flow-sheets. In this research, we have
attempted to calculate the heterogeneous catalyst loading in each configuration and the associated annual
catalyst costs via empirical relations suggested in literature and some calculations with assumptions. The
catalyst loading for the conventional reactor configuration is derived from the plug flow reactor design
equation (Equation 83) [150].
1
0A
totalcat,
r
dXFW
(Equation 83)
The catalyst requirement for configuration A comes out to be around 2,470 kg/year. For configuration B,
the liquid holdup on each stage of the CD column, triolein composition and flow rate were used to
approximate the corresponding catalyst requirements. The catalyst requirement for configuration B comes
out to be around 3780 kg/year. Since simulations presented in this research are being modeled on kinetic
parameters taken from the performance of solid acid heterogeneous catalyst HSiW/Al2O3, we use price
specifications for alumina Al2O3 (Brockmann I, activated, 150 mesh size) and silico-tungstic acid (HSiW).
As of January 2015, the Sigma-Aldrich price for alumina Al2O3 (Brockmann I, activated, 150 mesh size)
is 300 dollars for a 5 kg batch and for HSiW is 600 dollars per kg. Since batch and bulk costs for chemicals

Biodiesel Production via Catalytic Distillation
171
vary significantly, we approximate the bulk price of a catalyst system comprising 30 % wt HSiW and 70
% wt Al2O3 to be 150 dollars per kg (batch price approximates to 225 dollars per kg). This price also allows
for some compensation for the loss in material while synthesizing the catalyst and costs involved in
preparing the catalyst bed. Hence, the total catalyst costs were approximately $ 370,500 dollars for
configuration A and 567,000 dollars for configuration B. These figures are explorative estimates for
catalyst requirements and costs and in depth consideration of packing, catalyst bed characteristics and
reactor geometry are necessary to yield more accurate results. A calculation of the heterogeneous catalyst
presented here provides some idea on the probable costs associated with changing the biodiesel production
process to heterogeneous catalysis since no cost estimate for a heterogeneous catalyzed process for
biodiesel is available in the literature. It is of note that the catalyst requirement for the CD process in
configuration B appears to be more than that for configuration A. This is the case, when the catalyst life (1
year) is assumed to be the same in both configurations. In an actual industrial operation, the catalyst life
would be higher in the CD column as the catalyst would be better protected via in situ heat removal via
separation in the column. These could lead to lower catalyst costs. The temperature range in the CD column
(112ºC in stage 1 to 145ºC in the reboiler) is also lower than that of the isothermal packed bed reactor
(160ºC) in configuration A.
This research also produces quantitative estimates for reduction of carbon dioxide (CO2) emissions by
translating process utility consumption into associated emissions. A consequence of savings in energy is
the reduction of emissions which helps a process to meet economic or sustainability thresholds (as
determined by environmental regulations and market economy) and also provides viability and
sustainability for projects that otherwise would not be feasible. Tables 36 and 37 list the hot and cold
utilities for each process unit in both the process configurations and specify the reductions in energy
brought by the CD process. The savings in hot utility usage are translated into emission cuts via emission
factors provided by the U.S. Energy Information Administration (EIA)[40] that compute the amount of
CO2 produced per kilowatt hour (kWh) for specific fuels and specific types of generators. Cooling
operations in industrial distillation operations are achieved via large volumes of cooling water that does not
contribute to CO2 emissions [193] and hence, cold utilities are ignored. For scaling of hot utilities to
calculate CO2 emissions, natural gas is chosen as the fuel (conversion factor 1.22). Natural gas is the
preferred fuel for use in petroleum refineries utility systems [194, 195]. As detailed in Tables 36 and 37,
the total hot utility requirements for configuration A is 4685.6 KW whereas for the CD process in

Biodiesel Production via Catalytic Distillation
172
configuration B is 2371.86 KW. For an annual production of 10 million gallons of biodiesel, the CD process
configuration results in reduction of 24,728 tons of CO2 per year.
CD is known to overcome limitations such as chemical equilibrium and difficult separations leading to an
increase in space, time, mass and energy efficiency resulting in waste minimization. A comparison of
Figures 44 and 45 show that the conventional process (configuration A) has two purge streams whereas the
CD process in configuration B has one. The combined flowrate of purge streams in configuration A is 293
kg/hr compared to 236 kg/hr in configuration B. For an identical feed, the CD process hence reduces waste
by 19.45 percent.

173
Table 36: Detailed cost analysis for optimum design and operating conditions for the reactor separation configuration (Configuration A)
Configuration: Reactor + Distillation
Equipment
Optimal Operation Condition
Heat
Duty
(kW)
Equipment
Utility Cost
($/yr)
Total
Operating
Cost ($/yr)
Equipment
Purchase Cost
($)
Total Capital
Cost ($)
Reactor Temp. (160°C) Pressure (15 atm) 826.16 $259,904
$26,909,300
213,700
$8,078,190
Flash Separator Temp. (160°C) Pressure (1 atm) 414.88 $69,691 21,800
Decanter Temp. (160°C) Pressure (1 atm) -1.389 $632 17,400
Biodiesel Distillation
Column
BIODIST
Mole-RR (0.5) Pressure (0.3 atm)
Stages (5) Feed (2)
-49.39 $31,636 77,800
281.29
Glycerol Distillation
Column
GLYDIST
Mole-RR (0.5) Pressure (0.8 atm)
Stages (5) Feed (3)
-98.67 $21,424 36,300
125.27
Methanol Distillation
Column
METHGLY
Mole-RR(0.5)
Pressure(1 atm)
Stages (5) Feed (3)
-1,981
$228,377 97,400
1,267
Methanol Distillation
Column
RECDIST
Mole-RR(0.5)
Pressure(1 atm)
Stages (8) Feed (4)
-2,735 $348,164 106,300
1,771
Utility Cost ($/yr) $959,828
Raw Materials Cost ($/yr) $22,539,900

Biodiesel Production via Catalytic Distillation
174
Table 37: Detailed cost analysis for optimum design and operating conditions for the Catalytic Distillation Configuration(Configuration B)
Configuration: Reactor + Distillation
Equipment
Optimal Operation Condition
Heat
Duty
(kW)
Equipment
Utility Cost
($/yr)
Total
Operating
Cost ($/yr)
Equipment
Purchase
Cost ($)
Total
Capital
Cost ($)
CD Column Mole-RR (0.5) Pressure (1 atm)
Stages (10) Feed (2,8)
-181.18 $319,324
$26,172,900
132,600
$6,288,340
488.29
Decanter Temp. (150°C) Pressure (1 atm) -1.126 $472 15,300
Biodiesel Distillation
Column
BDISTL
Mole-RR (0.3) Pressure (0.3 atm)
Stages (5) Feed (2)
-37.83 $28,116 73,900
259.19
Glycerol Distillation
Column
GLYDIST
Mole-RR (0.5) Pressure (0.8 atm)
Stages (5) Feed (3)
-102.37 $23,432 37,200
145.27
Methanol Distillation
Column
METH
Mole-RR(0.5)
Pressure(1 atm)
Stages (10) Feed (5)
-2258
$278,367 112,400
1,479
Utility Cost ($/yr) $649,711
Raw Materials Cost ($/yr) $22,209,900
Configuration B: Catalytic Distillation Process
Configuration: Reactor+ Distillation

Biodiesel Production via Catalytic Distillation
175
Table 38: Per gallon production cost of biodiesel for configurations A, B and C
Reaction Separation Process
(Configuration A)
Catalytic Distillation Process
(Configuration B)
Total Capital Cost [USD] 8,078,190 6,288,340
Total Raw Materials Cost
[USD/Year] (Methanol + Yellow Grease) 22,539,900 22,209,900
Total Utilities Cost [USD/Year] 959,828 649,711
Total Catalyst Cost [USD/Year] 370,500 567,000
Total Operating Cost [USD/Year] 26,909,300 26,172,900
Total Product Sales [USD/Year] (Glycerol) 2,323,565 2,429,554
Total Biodiesel flow (kg/hr) 3,868 3998
Biodiesel Mole fraction 99.42 99.28
Total Biodiesel Volume (gal/yr) at 25°C 10,256,220 10,600,922
Price of biodiesel without considering
glycerol revenue ($/gallon) 2.62 2.46
Price of biodiesel considering glycerol
revenue ($/gallon) 2.40 2.24

176
5.2.4 Conclusions
The cost of biodiesel production is highly dependent on the feedstock price: yellow grease is an
attractive option in comparison to the widely used vegetable oils for biodiesel production. This research
examines the commercial feasibility of switching from the current conventional biodiesel process
configuration to a green CD technology. A new green process for biodiesel production using a waste oil
was designed. A simulation of a process design with technical and process parameters along with plant
and production economics is presented. The economic analysis indicate that a CD biodiesel production
process leads to significant reduction of capital and production costs. The CD process for biodiesel
production from yellow grease would result in lower greenhouse gas emissions, reduce waste, and
improve the economics and reduce environmental footprint for biodiesel manufacturing. The merits of
CD technology outlined in this research would open areas for further research in biodiesel production
from high FFA feedstocks.

177
Chapter 6
Conclusions and Recommendations
With an overall goal of advancing Catalytic Distillation, this thesis focused on designing plant and
equipment configuration to suit the product range and process technologies involved, taking environmental
and economic aspects into account, instituting scale-up and scale-down, optimizing production by
analyzing processes and doing waste reduction and emission cuts and cost calculations. Although results
have been discussed in relevant chapters, we believed it is necessary to compile the conclusions and
research highlights with a summary.
6.1 Elucidation of green engineering aspects of Catalytic Distillation
Quantification of process merits of CD would serve as a good validation to the green engineering attributes
of CD technology. The thesis identifies and presents numerous process merits of CD for different reaction
systems.
Lower purge, increased conversion, better heat control, and large scale savings in energy and greenhouse
gas emissions were identified as significant advantages brought about by CD in the isooctane process.
Modeling results proved that the application of CD technology leads to enhanced energy integration and
improved monomer utilization. Efficient energy usage results into lesser greenhouse emissions, contributing
to long-term sustainability of the process (Chapter 3).
For the MIBK process, experimental and process modeling predictions demonstrated breaking of
equilibrium limitations, effective utilization of reaction heat, superior hydrogenation efficiency at lower
pressure and the avoidance of azeotropes as process advantages brought by CD (Chapter 4).
Process designs presented and model runs on these designs showed the efficacy of CD technology to allow
hydrogenation possible at lower partial pressures for the benzene hydrogenation process Chapter 4).
Successful utilization of a lower-quality feed (yellow grease), huge savings in capital costs, catalyst and
equipment, superior heat control, methanol recycle and glycerol productivity were the influential process
merits of CD towards the biodiesel process as demonstrated by the process simulation results (Chapter 5).

178
6.2 Film Model Application for CD modeling
In order to model Catalytic Distillation, many different types of data are required. Consequently, this
thesis has dealt with a broad spectrum of topics in the field of chemical engineering. A comprehensive
on steady state CD modeling review discussing the intricacies involved has been presented in chapter
2. In the end, however, these varied topics are all incorporated into a unique film model for catalytic
distillation.
The underlying idea for efforts towards development of the film model was to have a process model
that would be able to simulate CD hydrogenation systems involving an incondensable gas and in
particular demonstrate the role of mass transfer and kinetic limitations on the process performance and
should point reasons to lower hydrogenation partial pressure observed in various CD systems. The
model was successful in identifying kinetic and mass controlled regimes in individual reaction systems
studied. Built on the idea of the hydrogenation reaction accelerated by diffusion in a L-S film on the
catalyst surface, the model was able to match experimental data for the isooctane process with improved
precision (chapter 3) and was also further validated on design studies extended to more reaction systems
in chapter 4. The study of these individual reaction systems entailed interpretation of kinetic and process
data, process design studies and equilibrium relationships and effect of major process variables that
have been outlined in individual chapters.
6.3 Catalytic Distillation for biodiesel process development
Before the abrupt decline of oil prices in 2014, on account of energy security, environmental concerns,
foreign exchange savings, and socioeconomic issues, biodiesel was the dominant biofuel ready for
deployment as a petroleum alternative. Commercialization of biodiesel was constrained by two major
problems: process economics of production and debate on food versus fuel. This thesis addresses the
challenge to develop biodiesel technologies via cheaper feedstock or those unsuitable for human
consumption so as to solve the twin problems of process economics as well as the food versus fuel
debate (Chapter 5).

Conclusions and Recommendations
179
An integrated reactive distillation process design for continuous large scale biodiesel production (10
million annual biodiesel production at ASTM standard) is presented. Quantified savings in costs,
energy and greenhouse gas on application of CD technology are presented for the biodiesel process.
6.4 Recommendations and scope for future work
The aim of this section is to raise some future perspective, and to suggest possible research efforts for
further advancing the research this thesis presents.
Good mathematical models developed should adequately describe the column hydrodynamics, mass
and heat transfer resistances, and reaction kinetics simultaneously, with the accuracy of the simulation
results being strongly dependent on the quality of the applied model parameters and an understanding
of the equilibrium and kinetic limits of the process. While the film model has delivered in these areas
(good predictions against experimental data and provided empirical understanding of hydrogenation
phenomena), some areas identified where the film model fails is to depict the effect of the internal
reflux particularly for the MIBK process. Our understanding of the CD process, directs us to a possible
switch between liquid and gas-phase hydrogenation regimes influencing the internal reflux that the
model didn’t consider. To model such a system, the film model should be made dynamic and the switch
between gas and liquid phase regimes should be setup based on fluid dynamics. That could be the scope
of a future work and would entail knowledge of CFD techniques with possible work in softwares such
as COMSOL etc. To generate flow pattern basis for such a data, tracer experiments could be performed
using glass columns.
Exploring the candidate reactions for CD, itself is an area that needs considerable attention to expand
the domain of CD processes. The conventional isooctane production process can be tailored to produce
the next higher oligomer dodecane by changing the reactor configuration, temperature of reaction and
catalyst activity. Dodecane is a product that has received increased commercial interest quite recently
as a possible surrogate for kerosene-based fuels such as Jet-A, S-8, and other conventional aviation
fuels. In course of research for this thesis, we conducted process design studies on the possibility of a
CD process for dodecane production. Preliminary results suggested that that CD presents an excellent
opportunity for application of a hybrid reactor and separation systems to intensify the process. That is

Conclusions and Recommendations
180
another probable future work that would expand the applicability of CD in production of next
generation fuels and chemicals.

181
Bibliography
1. Anastas, P.T. and J.B. Zimmerman, Peer Reviewed: Design Through the 12 Principles of Green
Engineering. Environmental Science & Technology, 2003. 37(5): p. 94A-101A.
2. Ng, F.T.T. and G.L. Rempel, Catalytic Distillation, in Encyclopedia of Catalysis2002, John
Wiley & Sons, Inc.
3. Lei, Z., B. Chen, and Z. Ding, Chapter 4 - Catalytic distillation, in Special Distillation
Processes, Z. Lei, B. Chen, and Z. Ding, Editors. 2005, Elsevier Science: Amsterdam. p. 178-
221.
4. Sharma, M.M. and S.M. Mahajani, Industrial Applications of Reactive Distillation, in Reactive
Distillation2003, Wiley-VCH Verlag GmbH & Co. KGaA. p. 1-29.
5. Harmsen, G.J., Reactive distillation: The front-runner of industrial process intensification: A
full review of commercial applications, research, scale-up, design and operation. Chemical
Engineering and Processing, 2007. 46(9): p. 774-780.
6. Lutze, P., et al., Heterogeneous Catalytic Distillation - A Patent Review. Recent Patents on
Chemical Engineering, 2010. 3.
7. Hiwale, R.S., et al., Industrial applications of reactive distillation: Recent trends. International
Journal of Chemical Reactor Engineering, 2004. 2.
8. Shah, M., et al., A systematic framework for the feasibility and technical evaluation of reactive
distillation processes. Chemical Engineering and Processing: Process Intensification, 2012.
60(0): p. 55-64.
9. Sarkar, A., A Catalytic Distillation Process for One-step Production of Isooctane from
IsoButene - Process Development, Modelling and Analysis, in Chemical Engineering2005,
University of Waterloo: Waterloo. p. 364.
10. O’Keefe, W.K., Application of Niobium Compounds Towards the One-Step Synthesis of
Methyl Isobutyl Ketone (MIBK) via Catalytic Distillation, in Department of Chemical
Engineering2008, University of Waterloo: Waterloo.
11. Kriván, E., I. Valkai, and H. Jenő, The Oligomerization of Olefin Hydrocarbons in Light FCC
Naphtha on Ion Exchange Resin Catalyst. Chemical Engineering Transactions, The Italian
Association of Chemical Engineering, 2012. 29.
12. Krivan, E., G. Marsi, and J. Hancsok, Investigation of the Oligomerization of light olefins on
ion exchange resin catalyst. Hungarian Journal of Industrial Chemistry, 2010(38).
13. Coelho, A., et al., 1-Butene oligomerization over ZSM-5 zeolite: Part 1 – Effect of reaction
conditions. Fuel, 2013. 111(0): p. 449-460.
14. Bellussi, G., et al., Oligomerization of olefins from Light Cracking Naphtha over zeolite-based
catalyst for the production of high quality diesel fuel. Microporous and Mesoporous Materials,
2012. 164(0): p. 127-134.
15. Srivastava, S.P. and J. Hancsók, Fuels from Crude Oil (Petroleum), in Fuels and Fuel-
Additives2014, John Wiley & Sons, Inc. p. 48-120.
16. Corma, A. and S. Iborra, Oligomerization of Alkenes, in Catalysts for Fine Chemical
Synthesis2006, John Wiley & Sons, Ltd. p. 125-140.
17. PEP Review 2009-14 : C3-C4 Oligomerization for Gasoline, 2009, IHS Chemical.

Bibliography
182
18. O'Connor, C.T. and M. Kojima, Alkene oligomerization. Catalysis Today, 1990. 6(3): p. 329-
349.
19. de Klerk, A., Fischer-Tropsch Refining2012: Wiley.
20. Ma, F. and M.A. Hanna, Biodiesel production: a review. Bioresource Technology, 1999. 70(1):
p. 1-15.
21. ChemSpider. Search and Share Chemistry. 2014 [cited 2014 27th July]; Available from:
http://www.chemspider.com/.
22. NeXoctane Process KBR. [cited 2011 7th July]; Available from:
http://www.kbr.com/Technologies/Process-Technologies/NExOCTANE/.
23. Bowman, W.G.H., TX), Stadig, William P. (Houston, TX), Dimerization of isobutene, 1978,
Petro-Tex Chemical Corporation (Houston, TX): United States.
24. Kamath, R.S., et al., Process Analysis for Dimerization of Isobutene by Reactive Distillation.
Industrial & Engineering Chemistry Research, 2006. 45(5): p. 1575-1582.
25. Centi, G., Siglinda P., Ferruccio T., Sustainable Industrial Chemistry. Principles, Tools and
Industrial Examples2009: Weinheim, Germany : Wiley-VCH, c2013.
26. Birkhoff, R.N., Matti, NExOCTANE™ Technology for Isooctane Production, in Handbook of
Petroleum Refining Processes, Third Edition R. Meyers, Editor 2004, McGraw Hills.
27. Ouni, T., et al., Isobutene dimerisation in a miniplant-scale reactor. Chemical Engineering and
Processing, 2006. 45(5): p. 329-339.
28. Dow Chemicals : DOW Ion Exchange Resins - Catalysts for Dimerization of Isobutylene - Iso
Octane. 2013 [cited 2014 May 27]; Available from:
http://dowac.custhelp.com/app/answers/detail/a_id/16116/~/dow-ion-exchange-resins---
catalysts-for-dimerization-of-isobutylene---iso-octane.
29. Kolah, A., Q. Zhiwen, and S. Mahajani, Dimerized isobutene: An alternative to MTBE, in
Chemical Innovation2001, ACS. p. 15-21.
30. ALKYLATION VS . DIMERIZATION : What are the limitations of modern dimerization
technology?, 2000, NPRA Annual Meeting, STRATCO, Spring 2000.
31. Blahušiak, M., et al., Quick assessment of binary distillation efficiency using a heat engine
perspective. Energy, 2016. 116, Part 1: p. 20-31.
32. Kiss, A.A., Heat-Integrated Distillation Column, in Advanced Distillation Technologies2013,
John Wiley & Sons, Ltd. p. 271-309.
33. Xu, Y., Numerical Modelling and Experimental Study of Catalytic Distillation for Olefin
Oligomerization and Hydrogenation, in Chemical Engineering2006, University of Waterloo:
Waterloo.
34. Xu, Y., et al., A three-phase nonequilibrium dynamic model for catalytic distillation. Chemical
Engineering Science, 2005. 60(20): p. 5637-5647.
35. Onda, K., E. Sada, and Y. Murase, Liquid-side mass transfer coefficients in packed towers.
AIChE Journal, 1959. 5(2): p. 235-239.
36. King, C.J., Separation Processes, Introduction, in Ullmann's Encyclopedia of Industrial
Chemistry2000, Wiley-VCH Verlag GmbH & Co. KGaA.
37. Hayduk, W. and B.S. Minhas, Correlations for prediction of molecular diffusivities in liquids.
The Canadian Journal of Chemical Engineering, 1982. 60(2): p. 295-299.
38. Fuller, E.N., P.D. Schettler, and J.C. Giddings, NEW METHOD FOR PREDICTION OF
BINARY GAS-PHASE DIFFUSION COEFFICIENTS. Industrial & Engineering Chemistry,
1966. 58(5): p. 18-27.

Bibliography
183
39. Goortani, B.M., et al., Production of Isooctane from Isobutene: Energy Integration and Carbon
Dioxide Abatement via Catalytic Distillation. Industrial & Engineering Chemistry Research,
2015.
40. EIA. Independent Statistics and Analysis : US Energy Information and Administration. 2014
[cited 2014 16th June]; Available from: http://www.eia.gov/tools/faqs/faq.cfm?id=74&t=11.
41. Taylor, R. and R. Krishna, Modelling reactive distillation. Chemical Engineering Science,
2000. 55(22): p. 5183-5229.
42. Doherty, et al., Reactive distillation by design. Vol. 70. 1992, Amsterdam, PAYS-BAS:
Elsevier.
43. Sundmacher, K.A.I., L.K. Rihko, and U. Hoffmann, CLASSIFICATION OF REACTIVE
DISTILLATION PROCESSES BY DIMENSIONLESS NUMBERS. Chemical Engineering
Communications, 1994. 127(1): p. 151-167.
44. Taylor, R. and R. Krishna, Modeling of Homogeneous and Heterogeneous Reactive Distillation
Processes, in Reactive Distillation2003, Wiley-VCH Verlag GmbH & Co. KGaA. p. 215-240.
45. Vincent, G.G., Reactive Separation, in Encyclopedia of Chemical Processing2007, Taylor &
Francis. p. 2541-2556.
46. Roizard, C. and G. Wild, Mass transfer with chemical reaction: the slow reaction regime
revisited. Chemical Engineering Science, 2002. 57(16): p. 3479-3484.
47. Talwalkar, S., et al., Selectivity Engineering with Reactive Distillation for Dimerization of C4
Olefins: Experimental and Theoretical Studies. Industrial & Engineering Chemistry Research,
2007. 46(10): p. 3024-3034.
48. Xu, Y., F.T.T. Ng, and G.L. Rempel, Comparison of a Pseudo-homogeneous Nonequilibrium
Dynamic Model and a Three-phase Nonequilibrium Dynamic Model for Catalytic Distillation.
Industrial & Engineering Chemistry Research, 2005. 44(16): p. 6171-6180.
49. Kenig, E.Y. and S. Blagov, Chapter 10 - Modeling of Distillation Processes, in Distillation,
A.G. Sorensen, Editor 2014, Academic Press: Boston. p. 383-436.
50. Schmidt-Traub, I.H. and A. Górak, Integrated Reaction and Separation Operations2006:
Springer Berlin Heidelberg.
51. Lee, J.-H. and M.P. Dudukovic, A comparison of the equilibrium and nonequilibrium models
for a multicomponent reactive distillation column. Computers & Chemical Engineering, 1998.
23(1): p. 159-172.
52. Peng, J., et al., A Comparison of Steady-State Equilibrium and Rate-Based Models for Packed
Reactive Distillation Columns. Industrial & Engineering Chemistry Research, 2002. 41(11): p.
2735-2744.
53. Klemola, K.T., Efficiencies in Distillation and Reactive Distillation, in Department of
Chemical Engineering1998, Helsinki University of Technology: Helsinki.
54. Sinnott, R.K., 11. Separation Columns (Distillation, Absorption and Extraction), in Coulson
and Richardson's Chemical Engineering Volume 6 - Chemical Engineering Design (4th
Edition), Elsevier.
55. Chan, H. and J.R. Fair, Prediction of point efficiencies on sieve trays. 2. Multicomponent
systems. Industrial & Engineering Chemistry Process Design and Development, 1984. 23(4):
p. 820-827.
56. Seader, J., The B.C. (Before Computers) and A.D. of Equilibrium-Stage Operations. Chemical
Engineering Education, 1985. 19(2): p. 88-103.
57. Taylor, R. and A. Lucia. Modeling and Analysis of Multi-Component Separation Processes. in
Foundations of Computer Aided Process Design. 1995.

Bibliography
184
58. Steffen, V. and E.A. Da Silva, Steady-state modeling of reactive distillation columns. Acta
Scientiarum: Technology, 2012. 34(1).
59. Baharev, A. and A. Neumaier, A globally convergent method for finding all steady-state
solutions of distillation columns. AIChE Journal, 2014. 60(2): p. 410-414.
60. Khaledi, R. and P.R. Bishnoi, A Method for Modeling Two- and Three-Phase Reactive
Distillation Columns. Industrial & Engineering Chemistry Research, 2006. 45(17): p. 6007-
6020.
61. Gupta, A.K., P. Raj Bishnoi, and N. Kalogerakis, A method for the simultaneous phase
equilibria and stability calculations for multiphase reacting and non-reacting systems. Fluid
Phase Equilibria, 1991. 63(1–2): p. 65-89.
62. Venkataraman, S., W.K. Chan, and J.F. Boston, Reactive distillation using ASPEN PLUS.
Chemical Engineering Progress, 1990. 86(8): p. 45-54.
63. Leyva, F., et al., Isoamyl propionate production by reactive distillation. Separation and
Purification Technology, 2015. 146: p. 199-212.
64. Patidar, P. and S.M. Mahajani, Esterification of fusel oil using reactive distillation – Part I:
Reaction kinetics. Chemical Engineering Journal, 2012. 207–208(0): p. 377-387.
65. Xiao, Y., et al. Simulation of the catalytic reactive distillation process for biodiesel production
via transesterification. in 2013 International Conference on Materials for Renewable Energy
and Environment, ICMREE 2013, August 19, 2013 - August 21, 2013. 2013. Chengdou, China:
Institute of Electrical and Electronics Engineers Inc.
66. Hu, S., et al., Design and simulation of an entrainer-enhanced ethyl acetate reactive distillation
process. Chemical Engineering and Processing: Process Intensification, 2011. 50(11-12): p.
1252-1265.
67. Kolah, A.K., et al., Triethyl Citrate Synthesis by Reactive Distillation. Industrial & Engineering
Chemistry Research, 2008. 47(4): p. 1017-1025.
68. Tian, H., et al., Novel procedure for coproduction of ethyl acetate and n- butyl acetate by
reactive distillation. Industrial and Engineering Chemistry Research, 2012. 51(15): p. 5535-
5541.
69. Gaurav, A., et al., Transesterification of Triglyceride to Fatty Acid Alkyl Esters (Biodiesel):
Comparison of Utility Requirements and Capital Costs between Reaction Separation and
Catalytic Distillation Configurations. Energy & Fuels, 2013. 27(11): p. 6847-6857.
70. Huang, Z., et al., Novel procedure for the synthesis of dimethyl carbonate by reactive
distillation. Industrial and Engineering Chemistry Research, 2014. 53(8): p. 3321-3328.
71. Haas, R.J. Distillation/ Modeling and Simulation. 2000.
72. Ciornei, C., G. Bumbac, and V. Plesu, Modelling and simulation of operation for the TAEE
synthesis by catalytic distillation, in Computer Aided Chemical Engineering, P. Luis and E.
Antonio, Editors. 2005, Elsevier. p. 655-660.
73. Haas, R.J., Rigorous Distillation Calculations, in Distillation Design, Z.H. Kister, Editor 1992,
McGraw-Hill.
74. Taylor, R. and R. Krishna, Multicomponent Mass Transfer1993: Wiley.
75. Taylor, R. and A.H. Kooijman, The ChemSep Book, 2006.
76. Whitman, W.G., The two film theory of gas absorption. International Journal of Heat and Mass
Transfer, 1962. 5(5): p. 429-433.
77. Lewis, W.K. and W.G. Whitman, Principles of Gas Absorption. Industrial & Engineering
Chemistry, 1924. 16(12): p. 1215-1220.

Bibliography
185
78. Higbie, R. The rate of absorption of a pure gas into a still liquid during short periods of
exposure. in American Institute of Chemical Engineers. 1935.
79. Danckwerts, P.V., Significance of Liquid-Film Coefficients in Gas Absorption. Industrial &
Engineering Chemistry, 1951. 43(6): p. 1460-1467.
80. Danckwerts, P.V., Gas absorption accompanied by chemical reaction. AIChE Journal, 1955.
1(4): p. 456-463.
81. Toor, H.L. and J.M. Marchello, Film-penetration model for mass and heat transfer. AIChE
Journal, 1958. 4(1): p. 97-101.
82. Krishna, R. and J.A. Wesselingh, The Maxwell-Stefan approach to mass transfer. Chemical
Engineering Science, 1997. 52(6): p. 861-911.
83. Wesselingh; J.A. and K. R., Mass Transfer in Multicomponent Mixtures2006: VSSD.
84. Frank, M.J.W., et al., Modelling of simultaneous mass and heat transfer with chemical reaction
using the Maxwell-Stefan theory I. Model development and isothermal study. Chemical
Engineering Science, 1995. 50(10): p. 1645-1659.
85. Keller, T. and A. Górak, Modelling of homogeneously catalysed reactive distillation processes
in packed columns: Experimental model validation. Computers & Chemical Engineering,
2013. 48(0): p. 74-88.
86. Higler, A., R. Krishna, and R. Taylor, Nonequilibrium Modeling of Reactive Distillation: A
Dusty Fluid Model for Heterogeneously Catalyzed Processes. Industrial & Engineering
Chemistry Research, 2000. 39(6): p. 1596-1607.
87. Sláva, J., Ľ. Jelemenský, and J. Markoš, Numerical algorithm for modeling of reactive
separation column with fast chemical reaction. Chemical Engineering Journal, 2009. 150(1):
p. 252-260.
88. Rouzineau, D., et al., Non-Equilibrium Model and Experimental Validation for Reactive
Distillation. Hungarian Journal of Industry and Chemistry, 2003. 31(1).
89. Alfradique, M.F. and M. Castier, Modeling and simulation of reactive distillation columns
using computer algebra. Computers & Chemical Engineering, 2005. 29(9): p. 1875-1884.
90. Švandová, Z., J. Markoš, and Ľ. Jelemenský, Impact of mass transfer coefficient correlations
on prediction of reactive distillation column behaviour. Chemical Engineering Journal, 2008.
140(1–3): p. 381-390.
91. Baur, R., R. Taylor, and R. Krishna, Bifurcation analysis for TAME synthesis in a reactive
distillation column: comparison of pseudo-homogeneous and heterogeneous reaction kinetics
models. Chemical Engineering and Processing: Process Intensification, 2003. 42(3): p. 211-
221.
92. Sundmacher, K. and U. Hoffmann, Development of a new catalytic distillation process for fuel
ethers via a detailed nonequilibrium model. Chemical Engineering Science, 1996. 51(10): p.
2359-2368.
93. Kotora, M., Z. Švandová, and J. Markoš, A three-phase nonequilibrium model for catalytic
distillation. Chemical Papers, 2009. 63(2): p. 197-204.
94. Kataoka, T., H. Yoshida, and T. Yamada, LIQUID PHASE MASS TRANSFER IN ION
EXCHANGE BASED ON THE HYDRAULIC RADIUS MODEL. Journal of Chemical
Engineering of Japan, 1973. 6(2): p. 172-177.
95. Feng, W., et al., Non-equilibrium model for catalytic distillation process. Front. Chem. Sci.
Eng., 2008. 2(4): p. 379-384.
96. Steinigeweg, S. and J. Gmehling, Distillation, in Green Separation Processes2006, Wiley-VCH
Verlag GmbH & Co. KGaA. p. 127-154.
Bibliography
186
97. Buchaly, C., P. Kreis, and A. Górak, Hybrid separation processes—Combination of reactive
distillation with membrane separation. Chemical Engineering and Processing: Process
Intensification, 2007. 46(9): p. 790-799.
98. Baur, R., et al., Comparison of equilibrium stage and nonequilibrium stage models for reactive
distillation. Chemical Engineering Journal, 2000. 76(1): p. 33-47.
99. Švandová, Z., et al., Impact of mathematical model selection on prediction of steady state and
dynamic behaviour of a reactive distillation column. Computers & Chemical Engineering,
2009. 33(3): p. 788-793.
100. Bhatia, S., et al., Production of isopropyl palmitate in a catalytic distillation column:
Comparison between experimental and simulation studies. Computers & Chemical
Engineering, 2007. 31(10): p. 1187-1198.
101. Luo, Z.-H., X.-Z. You, and J. Zhong, Design of a Reactive Distillation Column for Direct
Preparation of Dichloropropanol from Glycerol. Industrial & Engineering Chemistry Research,
2009. 48(24): p. 10779-10787.
102. Hasabnis, A. and S. Mahajani, Transacetalization of Glycerol with Methylal by Reactive
Distillation. Industrial & Engineering Chemistry Research, 2012. 51(40): p. 13021-13036.
103. Gómez-Castro, F.I., et al., Simplified Methodology for the Design and Optimization of
Thermally Coupled Reactive Distillation Systems. Industrial & Engineering Chemistry
Research, 2012. 51(36): p. 11717-11730.
104. Radulescu, G., et al., Dynamics of reactive distillation processes with potential liquid phase
splitting based on equilibrium stage models. Computers & Chemical Engineering, 2009. 33(3):
p. 590-597.
105. Luo, H.-P. and W.-D. Xiao, A reactive distillation process for a cascade and azeotropic reaction
system: Carbonylation of ethanol with dimethyl carbonate. Chemical Engineering Science,
2001. 56(2): p. 403-410.
106. Tavan, Y. and S.H. Hosseini, A novel integrated process to break the ethanol/water azeotrope
using reactive distillation – Part I: Parametric study. Separation and Purification Technology,
2013. 118(0): p. 455-462.
107. Hasse, H., Thermodynamics of Reactive Separations, in Reactive Distillation2003, Wiley-
VCH Verlag GmbH & Co. KGaA. p. 63-96.
108. Schoenamakers, H.G. and W. Arlt, Reactive distillation, in Chemical Thermodynamics for
Industry, T. Letcher, Editor 2004, The Royal Society of Chemistry. p. 33-42.
109. Venimadhavan, G., et al., Effect of kinetics on residue curve maps for reactive distillation.
AIChE Journal, 1994. 40(11): p. 1814-1824.
110. Buzad, G. and M.F. Doherty, Design of three-component kinetically controlled reactive
distillation columns using fixed-points methods. Chemical Engineering Science, 1994. 49(12):
p. 1947-1963.
111. Smejkal, Q. and M. Šoóš, Comparison of computer simulation of reactive distillation using
aspen plus and hysys software. Chemical Engineering and Processing: Process Intensification,
2002. 41(5): p. 413-418.
112. Keller, T., Chapter 8 - Reactive Distillation, in Distillation, A.G. Olujić, Editor 2014, Academic
Press: Boston. p. 261-294.
113. Kenig, E. and A. Górak, A film model based approach for simulation of multicomponent
reactive separation. Chemical Engineering and Processing: Process Intensification, 1995.
34(2): p. 97-103.

Bibliography
187
114. Zheng, Y., F.T.T. Ng, and G.L. Rempel, A comparison of a pseudo-homogeneous non-
equilibrium model and a three-phase non-equilibrium model for catalytic distillation. Chemical
Engineering Journal, 2004. 100(1–3): p. 119-127.
115. Aspen Rate Based Distillation. 2015 [cited 2015 10th May]; Available from:
https://www.aspentech.com/products/aspen-plus-carbon-capture/.
116. Krishnamurthy, R. and R. Taylor, A nonequilibrium stage model of multicomponent separation
processes. Part I: Model description and method of solution. AIChE Journal, 1985. 31(3): p.
449-456.
117. Krishnamurthy, R. and R. Taylor, A nonequilibrium stage model of multicomponent separation
processes. Part II: Comparison with experiment. AIChE Journal, 1985. 31(3): p. 456-465.
118. ChemSep - Modeling Separation Processes. 2013 [cited 2015 10th May]; Available from:
http://www.chemsep.com/.
119. ABUFARES, et al., Mathematical modelling and simulation of an MTBE catalytic distillation
process using SpeedUp and AspenPlus. Vol. 73. 1995, Amsterdam, PAYS-BAS: Elsevier.
120. Schrans, S., S. de Wolf, and R. Baur, Dynamic simulation of reactive distillation: An MTBE
case study. Computers & Chemical Engineering, 1996. 20, Supplement 2(0): p. S1619-S1624.
121. Sneesby, M.G., et al., ETBE Synthesis via Reactive Distillation. 1. Steady-State Simulation
and Design Aspects. Industrial & Engineering Chemistry Research, 1997. 36(5): p. 1855-1869.
122. Silvergerg, S.E., J.R. Lattner, and L.E. Sanchez, Use of catalytic distillation to produce
cyclopentane or cyclopentene, 2000, Google Patents.
123. Sapre, A. and B. Gates, Hydrogenation of Aromatic Hydrocarbons Catalyzed by Sulfided CoO-
MoO3/y-Al2O3: Reactivities, Reaction Networks and Kinetics D.o.C.E. Center for Catalytic
Science and Technology, University of Delaware Editor.
124. Gildert, G.R., Hydrogenation of benzene to cyclohexane, 2001, Google Patents.
125. Gildert, G.R. and M.E. Loescher, Catalytic distillation process for the production of C8 alkanes,
2001, Google Patents.
126. Kamath, R.S., et al., Comparison of Reactive Distillation with Process Alternatives for the
Isobutene Dimerization Reaction. Industrial & Engineering Chemistry Research, 2006. 45(8):
p. 2707-2714.
127. Joshi, J.B. and L.K. Doraiswamy, Chemical Reaction Engineering, in Albright's Chemical
Engineering Handbook2008, CRC Press. p. 737-968.
128. Martis, M., Validation of Simulation Based Models: A Theoretical Outlook The Electronic
Journal of Business Research Methods, 2006. 4(1): p. 39-46.
129. Sargent, R.G. Verification and Validation of Simulation Models. in Winter Simulation
Conference. 2007.
130. Karimi, I.S., Rajagopalan, 11th International Symposium on Process Systems Engineering ed.
Elsevier2012.
131. IHS Chemical Economics Handbook Cyclohexane, 2015.
132. Franck, H.-G.S., Jurgen Walter, Industrial Aromatic Chemistry Raw Materials Processes
Products1988: Springer.
133. Mahindrakar, V. and J. Hahn, Dynamics and control of benzene hydrogenation via reactive
distillation. Journal of Process Control, 2014. 24(3): p. 113-124.
134. Shiyao; Dai, G.X., Yue; AN, Kinetics of Liquid-Phase Hydrogenation of Benzene in a Metal
Hydride Slurry System formed by MINi5 and Benzene. Chinese Journal of Chemical
Engineering, 2003. 11(5): p. 571-576.
Bibliography
188
135. Bertucco, A.V., G, High Pressure Process Technology: fundamentals and applications. 1st
ed2001: Elsevier. 684.
136. Kazantsev, R.V., et al., Kinetics of Benzene and Toluene Hydrogenation on a Pt/TiO2 Catalyst.
Kinetics and Catalysis, 2003. 44(4): p. 529-535.
137. O’Keefe, W.K., et al., Liquid phase kinetics for the selective hydrogenation of mesityl oxide
to methyl isobutyl ketone in acetone over a catalyst. Chemical Engineering Science, 2005.
60(15): p. 4131-4140.
138. O'Keefe, W.K., F.T.T. Ng, and G.L. Rempel, Experimental Studies on the Syntheses of Mesityl
Oxide and Methyl Isobutyl Ketone via Catalytic Distillation. Industrial & Engineering
Chemistry Research, 2007. 46(3): p. 716-725.
139. Morey, F.C., Thicknmess of a Liquid Film adhering to a surface slowly withdrawn from the
liquid. Journal of Research of the National Bureau of Standards, 1940. 25: p. 9.
140. Jeffreys, H., Proceedings of the Cambridge Philosophical Society, 1930. 26(204).
141. Eisentraut, A., Biofuels Outlook : Market Developments and Policy Challenges, 2013,
International Energy Agency.
142. Rapier, R. The Global Outlook For Biofuels. 2014 [cited 2015 March 1]; Available from:
http://oilprice.com/Alternative-Energy/Biofuels/The-Global-Outlook-For-Biofuels.html.
143. Leung, D.Y.C., X. Wu, and M.K.H. Leung, A review on biodiesel production using catalyzed
transesterification. Applied Energy, 2010. 87(4): p. 1083-1095.
144. Yokoyama, S., The Asian Biomass Handbook2008: The Japan Institute of Energy.
145. NREL - Biodiesel and Other Renewable Diesel Fuels, National Renewable Energy Laboratory.
146. Pasupulety, N., et al., Production of biodiesel from soybean oil on CaO/Al2O3 solid base
catalysts. Applied Catalysis A: General, 2013. 452(0): p. 189-202.
147. Oliveira, C.F., et al., Esterification of oleic acid with ethanol by 12-tungstophosphoric acid
supported on zirconia. Applied Catalysis A: General, 2010. 372(2): p. 153-161.
148. J. Van Gerpen, B.S., R. Pruszko, D. Clements, G. Knothe, Biodiesel Production Technology,
2004, National Renewable Energy Laboratory.
149. Zhang, Y., et al., Biodiesel production from waste cooking oil: 1. Process design and
technological assessment. Bioresource Technology, 2003. 89(1): p. 1-16.
150. Fogler, H.S., Elements of Chemical Reaction Engineering. 4 edition ed2005: Prentice Hall
Professional Technical Reference, 2006.
151. Haas, M.J., et al., A process model to estimate biodiesel production costs. Bioresource
Technology, 2006. 97(4): p. 671-678.
152. You, Y.-D., et al., Economic Cost Analysis of Biodiesel Production: Case in Soybean Oil†.
Energy & Fuels, 2007. 22(1): p. 182-189.
153. Krawczyk, T., Biodiesel. INFORM - International News on Fats, Oils and Related Materials,
1996. 7(8): p. 800-800.
154. Lin, R., Y. Zhu, and L.L. Tavlarides, Mechanism and kinetics of thermal decomposition of
biodiesel fuel. Fuel, 2013. 106(0): p. 593-604.
155. Bondioli, P., The Biodiesel Handbook. By Gerhard Knothe, Jon Van Gerpen and Jürgen Krahl
(Eds.). Biotechnology Journal, 2007. 2(12): p. 1571-1572.
156. Berrios, M. and R.L. Skelton, Comparison of purification methods for biodiesel. Chemical
Engineering Journal, 2008. 144(3): p. 459-465.
157. METHANEX. Methanol Price - Methanex Regional Posted Contract Prices. [cited 2013 July
7]; Available from: http://www.methanex.com/products/methanolprice.html.

Bibliography
189
158. ICIS. ICIS Indicative Chemical Prices A-Z. 2013 [cited 2013 June 17]; Available from:
http://www.icis.com/chemicals/channel-info-chemicals-a-z/.
159. Gerpen, J.H.V., Biodiesel Economics - Oilseeds and Biodiesel Workshop, U.o.I. College of
Agriculture and Life Science Editor 2008: Billings, Montana, USA.
160. Tyson, K.S., Biodiesel Technology, Economics & Case Studies, in NAEMI Biomass &
Business Training Workshop, Spokane, WA2006, Rocky Mountain Biodiesel Consulting,
LLC.
161. Fortenbery, T.R., Biodiesel Feasibility Study: An Evaluation of Biodiesel Feasibility in
Wisconsin, in Agricultutal and Applied Economics - Staff Paper Series2004, University of
Wisconsin Madison: Madison.
162. Wisner, D.R. Biodiesel Economics - Costs, Tax Credits and Co-product. AgMRC Renewable
Energy Newsletter 2009 [cited 2013 July 7]; Available from:
http://www.agmrc.org/renewable_energy/biodiesel/biodiesel-economics-costs-tax-credits-
and-co-product.
163. Hoque, M.E., A. Singh, and Y.L. Chuan, Biodiesel from low cost feedstocks: The effects of
process parameters on the biodiesel yield. Biomass and Bioenergy, 2011. 35(4): p. 1582-1587.
164. Zhang, Y., W.-T. Wong, and K.-F. Yung, Biodiesel production via esterification of oleic acid
catalyzed by chlorosulfonic acid modified zirconia. Applied Energy, 2014. 116(0): p. 191-198.
165. Balat, M., Potential alternatives to edible oils for biodiesel production – A review of current
work. Energy Conversion and Management, 2011. 52(2): p. 1479-1492.
166. khan, T.M.Y., et al., Recent scenario and technologies to utilize non-edible oils for biodiesel
production. Renewable and Sustainable Energy Reviews, 2014. 37(0): p. 840-851.
167. Canakci, M. and J. Van Gerpen, A Pilot Plant to Produce Biodiesel from High Free Fatty Acid
Feedstocks. Transactions of the American Society of Agricultural Engineers, 2003. 46(4): p.
945-954.
168. Radich, A., Biodiesel Performance, Costs and Use 2004, Energy Information Administration.
169. Kulkarni, M.G. and A.K. Dalai, Waste cooking oil - An economical source for biodiesel: A
review. Industrial and Engineering Chemistry Research, 2006. 45(9): p. 2901-2913.
170. Swisher, K., Market Report : Industry savors record prices and growing global demand, in
Render 2012.
171. Supple, B., et al., The effect of steam treating waste cooking oil on the yield of methyl ester.
Journal of the American Oil Chemists' Society, 2002. 79(2): p. 175-178.
172. Plascencia, A., M. Estrada, and R.A. Zinn, Influence of free fatty acid content on the feeding
value of yellow grease in finishing diets for feedlot cattle. Journal of Animal Science, 1999.
77(10): p. 2603-9.
173. Diaz-Felix, W., et al., Pretreatment of yellow grease for efficient production of fatty acid
methyl esters. Biomass and Bioenergy, 2009. 33(4): p. 558-563.
174. Encinar, J.M., J.F. González, and A. Rodríguez-Reinares, Biodiesel from used frying oil.
Variables affecting the yields and characteristics of the biodiesel. Industrial and Engineering
Chemistry Research, 2005. 44(15): p. 5491-5499.
175. Souza, T.P.C., et al., Simulation and preliminary economic assessment of a biodiesel plant and
comparison with reactive distillation. Fuel Processing Technology, 2014. 123(0): p. 75-81.
176. Furuta, S., H. Matsuhashi, and K. Arata, Biodiesel fuel production with solid superacid
catalysis in fixed bed reactor under atmospheric pressure. Catalysis Communications, 2004.
5(12): p. 721-723.

Bibliography
190
177. Boro, J., A.J. Thakur, and D. Deka, Solid oxide derived from waste shells of Turbonilla striatula
as a renewable catalyst for biodiesel production. Fuel Processing Technology, 2011. 92(10): p.
2061-2067.
178. Devassy, B.M., et al., Synthesis of linear alkyl benzenes over zirconia-supported 12-
molybdophosphoric acid catalysts. Journal of Molecular Catalysis A: Chemical, 2005. 236(1–
2): p. 162-167.
179. Di Serio, M., et al., Heterogeneous Catalysts for Biodiesel Production. Energy & Fuels, 2008.
22(1): p. 207-217.
180. Busca, G., Acid Catalysts in Industrial Hydrocarbon Chemistry. Chemical Reviews, 2007.
107(11): p. 5366-5410.
181. Okuhara, T., et al., Microstructure of Cesium Hydrogen Salts of 12-Tungstophosphoric Acid
Relevant to Novel Acid Catalysis†. Chemistry of Materials, 2000. 12(8): p. 2230-2238.
182. Andy, A., Waste Grease Life Cycle Assessment : Project Status, 2004, National Renewable
Energy Laboratory.
183. Zhang, Y., et al., Biodiesel production from waste cooking oil: 2. Economic assessment and
sensitivity analysis. Bioresource Technology, 2003. 90(3): p. 229-240.
184. Marchetti, J.M., V.U. Miguel, and A.F. Errazu, Techno-economic study of different
alternatives for biodiesel production. Fuel Processing Technology, 2008. 89(8): p. 740-748.
185. West, A.H., D. Posarac, and N. Ellis, Assessment of four biodiesel production processes using
HYSYS.Plant. Bioresource Technology, 2008. 99(14): p. 6587-6601.
186. Morais, S., et al., Simulation and life cycle assessment of process design alternatives for
biodiesel production from waste vegetable oils. Journal of Cleaner Production, 2010. 18(13):
p. 1251-1259.
187. Lee, S., D. Posarac, and N. Ellis, Process simulation and economic analysis of biodiesel
production processes using fresh and waste vegetable oil and supercritical methanol. Chemical
Engineering Research and Design, 2011. 89(12): p. 2626-2642.
188. Simasatitkul, L., R. Gani, and A. Arpornwichanop, Optimal Design of Biodiesel Production
Process from Waste Cooking Palm Oil. Procedia Engineering, 2012. 42(0): p. 1292-1301.
189. USA Plants/Canada Plants, 2014, Biodiesel Magazine.
190. Bart, J.C.J., N. Palmeri, and S. Cavallaro, 11 - Industrial process technology for biodiesel
production, in Biodiesel Science and Technology, J.C.J. Bart, N. Palmeri, and S. Cavallaro,
Editors. 2010, Woodhead Publishing. p. 462-513.
191. National Ag Energy - USDA Livestock, Poultry & Grain Market News, USDA.
192. Quispe, C.A.G., C.J.R. Coronado, and J.A. Carvalho Jr, Glycerol: Production, consumption,
prices, characterization and new trends in combustion. Renewable and Sustainable Energy
Reviews, 2013. 27: p. 475-493.
193. Louis, O., Water Requirements of the Petroleum Refining Industry, 1963, US Department of
the Interior.
194. Taraphdar, T.Y., Pradeep; and M. Prasad, Natural gas fuels the integration of refining and
petrochemicals, in Digital Refining2012.
195. EIA, Refinery Capacity Report, 2013, US Energy Information Administration.

Appendix
191
Appendix
Appendix A: CD pilot plant at University of Waterloo
Figure A1: Catalytic Distillation pilot plant at Professor Ng and Rempel’s research
laboratory, University of Waterloo
A 23 ft (7 m) pilot CD process unit (schematic presented in Figure 2) is operational in our laboratory
where pilot-scale testing is done for various reactions in continuous mode to study different
heterogeneous catalysts and envisage process design for process intensification of these chemical
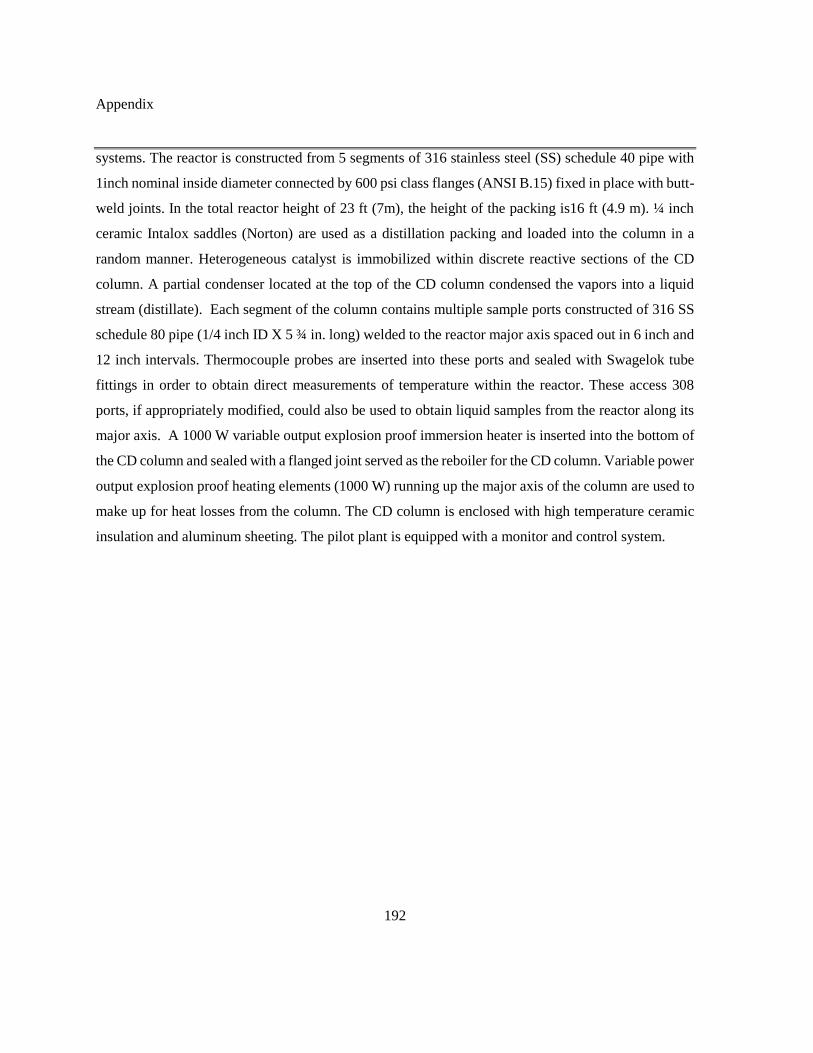
Appendix
192
systems. The reactor is constructed from 5 segments of 316 stainless steel (SS) schedule 40 pipe with
1inch nominal inside diameter connected by 600 psi class flanges (ANSI B.15) fixed in place with butt-
weld joints. In the total reactor height of 23 ft (7m), the height of the packing is16 ft (4.9 m). ¼ inch
ceramic Intalox saddles (Norton) are used as a distillation packing and loaded into the column in a
random manner. Heterogeneous catalyst is immobilized within discrete reactive sections of the CD
column. A partial condenser located at the top of the CD column condensed the vapors into a liquid
stream (distillate). Each segment of the column contains multiple sample ports constructed of 316 SS
schedule 80 pipe (1/4 inch ID X 5 ¾ in. long) welded to the reactor major axis spaced out in 6 inch and
12 inch intervals. Thermocouple probes are inserted into these ports and sealed with Swagelok tube
fittings in order to obtain direct measurements of temperature within the reactor. These access 308
ports, if appropriately modified, could also be used to obtain liquid samples from the reactor along its
major axis. A 1000 W variable output explosion proof immersion heater is inserted into the bottom of
the CD column and sealed with a flanged joint served as the reboiler for the CD column. Variable power
output explosion proof heating elements (1000 W) running up the major axis of the column are used to
make up for heat losses from the column. The CD column is enclosed with high temperature ceramic
insulation and aluminum sheeting. The pilot plant is equipped with a monitor and control system.

Appendix
193
Appendix B: Hatta Number Calculations for reaction systems
1. Isooctane System
The reaction considered is the hydrogenation of isooctene to produce isooctane.
182HCHHC
8168
k
Using the formula for Hatta number defined previously in text (Equation 22) and the reaction kinetic
parameters taken from equations 75 and 76, the Hatta number was calculated to be 2.65. This
suggests that the rate of reaction is comparable to the rate of diffusion in the film and the film model
should be applied to consider both these phenomena in the liquid-solid film.
2
Lk
AD
BC
1n
AC
fk
1n
2
Ha
Here n is the reaction order, kf is the pseudo first order kinetic rate constant for the forward reaction
(1/s), C is the concentration (mol/m3), D is the diffusivity (m2/s) and kL is the mass transfer
coefficient (m/s).
CA = 4.08x10⁻⁴(mol/m3) A= gaseous reactant hydrogen
CB = 6.1x10⁻³(mol/m3) B= Isooctene
n =0.33, m=0.30
kf =5.6x10⁻² s-1
DA =6x10⁻⁶ (m2/s)
kL =1.7x10⁻³ liquid phase mass transfer coefficient (m/s).

Appendix
194
2. Benzene Hydrogenation System
The reaction considered is the hydrogenation of benzene to produce cyclohexane.
122HCHHC
666
k
Using the formula for Hatta number (Equation 22) and the reaction kinetic parameters taken from
equation 75 in text, the Hatta number was calculated to be 1.387.
CA = 1.90x10⁻⁴(mol/m3) A= gaseous reactant hydrogen
CB = 7.71(mol/m3) B= Benzene
n =1, m=1
kf =1.31x10⁻³ s-1
DA =2.58x10⁻⁵ (m2/s)
kL =3.68x10⁻⁴ liquid phase mass transfer coefficient (m/s).
3. Production of Methyl Isobutyl Ketone (MIBK) via the Aldol condensation of Acetone in
a CD process
OHCHOHC126
k
2106
Using the formula for Hatta number defined previously in text (Equation 22) and the reaction kinetic
parameters taken from Table 20 in text, the Hatta number was calculated to be 1.169.
CA = 3.39x10⁻³(mol/m3) A= gaseous reactant hydrogen
CB = 9x10⁻² (mol/m3) B= Mesityl Oxide
n =1, m=1
kf =3.65x10⁻¹ s-1
DA =6x10⁻⁵ (m2/s)
kL =1.2x10⁻³ liquid phase mass transfer coefficient (m/s).