Embed Size (px)
Citation preview

Some Practical Aspects Of Modeling Crude Oil Distillation
Gerald L. Kaes
Introduction Crude oil distillation began in the United States in 1861. It was born out of an early oil crisis - there was a shortage of whale oil for the lamps of the day. Early refiners focused on recovery of the kerosene portion of crude oil with batch stills for use as a substitute for whale oil. The lighter and heavier portions of the crude oil were often discarded since there was no established use for them. Today crude oil distillation is only the first step in the refining process for petroleum. The crude oil is broken into several fractionation products that are routed to other refining processes for production of salable petroleum products. This is accomplished in a pipe still that typically contains 40 to 50 vapor/liquid contact devices (trays). Unlike most distillation columns, the crude oil still does not have a reboiler, and all of the heat input is supplied by heating the crude oil charge in a furnace. Because crude oil distillation is the first step in the refining process, all of the feed to the refinery must pass through the pipe still(s), resulting in high flow rates and large energy consumption. This provides good economic incentive for improvements to the process since a small improvement in the operation translates into a large saving in operating cost. This also provides a good incentive for modeling the crude still as a first step in improving the process.
The Nature of Crude Oil Crude oil is a naturally occurring liquid resource produced from wells drilled into the earth. It is produced in nearly every corner of the globe. The nature and chemical composition of the crude oil vary widely, depending on the geographical region from which it is produced. Moreover, the composition of the crude oil from any given well also changes with time as the well is produced. Gary and Handwerk1 report that the elementary composition of crude oil usually falls within the following ranges:
Crude oil is a very complex mixture. API Project 6 has succeeded in isolating thousands of distinct hydrocarbons from a single sample of Oklahoma crude oil. In general, such
Element % by weight
Carbon 84 - 87
Hydrogen 11 - 14
Sulfur 0 - 3
Nitrogen 0 - 0.6
VMGSimUser'sManual
Page 1 of 18Some Practical Aspects Of Modeling Crude Oil Distillation
2012/07/03http://www.cadfamily.com/online-help/VMGSIM5_web%5COil_Characterization/So...

comprehensive analyses are not conducted on crude oils. No attempt is made to analyze for pure components in crude oil except for the lower boiling point distilled components (or light ends). Alternately, a number of simple tests are used to evaluate crude oils as potential refinery feeds. These tests include density (or gravity), boiling point range, characterization factor, sulfur content, carbon residue, salt content, metals content, nitrogen content, and pour point. Further information on these tests is given in books by Kaes2 and Gary and Handwerk3. Three general classes of hydrocarbons are present in crude oil: paraffins (alkanes), naphthenes (cyclanes), and aromatics (derivatives of benzene). Significant quantities of olefins (alkenes) do not occur naturally in crude oil. Paraffins range in boiling point from methane to compounds exceeding 1000 degrees F (538 degrees C). Naphthenes have at least one saturated ring and range from cyclopentane through complicated multi-ring compounds. Aromatics range from benzene through multiple condensed-ring structures with 56 carbon atoms or more. As long side chains are added to the ring structures they become more paraffinic in their properties and behavior. This makes it difficult to classify most crude oils as one particular class of hydrocarbons.
What Crude Oil is the Refinery Processing? This question may seem simplistic, but it is the first matter to be resolved when modeling crude oil distillation. Refineries typically have many crude oils available for processing, and the corporate crude oil traders may exchange crude oils to gain economic advantage for the corporation. This means that the slate of crude oil processed in any given refinery is subject to change. Further complications arise from the way the crude oil is handled within the refinery. Crude oil arrives to the refinery via pipelines and ships. It is not likely that sufficient storage is available to segregate every batch of crude oil; therefore, similar types of crude oil are often mingled in storage. This creates a problem in identifying the actual crude oil mixture processed during any given plant test. The engineer conducting a plant test may have to rely on accounting information to determine the crude oil mixture being processed during the test period. Needless to say, this approach is not the most accurate means for determining the actual crude oil mixture processed during a plant test.
Practical Aspects of Crude Oil Laboratory Data Laboratory analyses for crude oil are time consuming and very costly. Consequently, the crude oil mixture charged to the pipe still is rarely analyzed as part of the plant test procedure. Rather, the engineer relies on previous analyses for the crude oil(s) when constructing the charge to the unit for modeling purposes. An abundant supply of crude oil assay data is available within most oil company libraries and in open literature. These assay data typically include true boiling point (TBP) distillation, gravity versus percent distilled curve, and the laboratory tests for several fractions of the crude oil sample. The fractions are selected such that they correspond to typical products of crude oil distillation. These data are useful for economic evaluation of crude oils. Crude assay data are also convenient for representation of the crude oil(s) charged during plant tests. When a mixture of several crude oils is processed, the engineer simply blends the data for the individual crude oils to determine the composite properties of the charge to the refinery pipe still(s). This is an oversimplification of the problem for several reasons. First, it is not easy to determine the precise mixture being processed during a typical plant test of several hours as has been previously discussed. Prediction of the crude oil mixture from accounting data
Page 2 of 18Some Practical Aspects Of Modeling Crude Oil Distillation
2012/07/03http://www.cadfamily.com/online-help/VMGSIM5_web%5COil_Characterization/So...

assumes that a so-called "average" mixture of crude oils (perfectly mixed) is in the charge tank(s) during the plant test period. Second, the crude oil data on file may no longer accurately represent the crude oil. Any given crude oil is in itself a mixture from a myriad of individual producing wells. The composition of the crude oil being produced may vary significantly within as small a geographical area as a production field. Furthermore, the composition from any producing well changes over time as the well is produced. Thus as wells are produced and additional wells and fields are brought on-line, the composition for any given crude oil may change significantly. In the author's work with crude oil distillation for a major oil company, crude oil assay data more than two years old were considered to be inaccurate for modeling purposes. In fact, the author has seen significant changes in the compositions for some domestic USA crude oils that invalidated the crude assay data in less than one year. Incredibly, the author was once asked to comment on a crude oil distillation design case for which the crude oil assay data were more than 20 years old!
Practical Limitations of Crude Oil Assay Tests The TBP distillation is the single-most important information for any crude oil for modeling and design purposes. Without an accurate boiling point curve for the crude oil, the modeling project is doomed to failure. It is interesting that for a test so important there are no standard test procedures and a number of different methods are used with slightly differing results. See Kaes4 for further discussion of the various tests. The TBP distillation tends to separate the individual mixture components relatively sharply in order of boiling point and is a good approximation of the separation that may be expected in the plant. As the lighter components are distilled from the crude oil, the pressure of the TBP still is reduced. For many of the TBP apparatuses, the minimum pressure attainable is 40 mm Hg. The highest temperature that can be measured for most crude oils subsequent to cracking the oil is in the temperature range 925 to 975 degrees F (496 to 526 degrees C) for still data corrected to a pressure base of 760 mm Hg. According to Nelson5, the actual TBP end point for crude oil is greater than 1400 degrees F (760 degrees C) and may exceed 2000 degrees F (1094 degrees C) for asphalt base crude oil. Thus, a significant portion of the boiling point curve for a crude oil is not defined by this procedure. The boiling curve from the TBP distillation procedure may be experimentally extended through use of the ASTM D1160 vacuum distillation procedure for the residue from the TBP still. This test is commonly run at 10 mm Hg and can measure temperatures up to 1050 to 1125 degrees F (566 to 607 degrees C) when corrected to a 760 mm Hg basis. The ASTM D1160 distillation is equivalent to the TBP distillation for these temperatures and no correction is applied. The practical reality is that a TBP curve by itself is barely sufficient to define the separation that occurs in most crude columns. In fact, for simulation purposes it must be extrapolated to provide sufficient information for calculations in the vacuum column that typically follows the crude column. This means that the flash zone calculations in the vacuum column may depend on extrapolated (versus measured) data. The ASTM D1160 extension of the TBP improves the accuracy of the predicted flash zone separation in the vacuum unit by providing real data. Because of their high cost, TBP analyses are being replaced with chromatographic simulated distillations. These tests are described by Kaes6 and compare the column retention times for the various fractions to those for normal paraffins to assign "boiling point" values to the chromatographic results. For paraffin and naphthalene based crude oils, the simulated distillation corresponds closely to the TBP distillation. However, for crude oils with substantial quantities of aromatic compounds, the simulated distillation predicts boiling point temperatures that are lower than the TBP distillation. For further discussion of the "paraffin bias" of simulated distillations see Kaes7.
Page 3 of 18Some Practical Aspects Of Modeling Crude Oil Distillation
2012/07/03http://www.cadfamily.com/online-help/VMGSIM5_web%5COil_Characterization/So...

The first simulated distillation procedure was the ASTM D-2887 procedure. This procedure has an upper boiling point limit of about 1000 degrees F (538 C) that renders the method unacceptable for crude oil. This method has been extended to approximately 1140 degrees F (616 degrees C) in the ASTM D-2887-extended procedure. This method is sometimes used to analyze crude oil, but it is not particularly satisfactory either. For both of these methods the higher boiling point portion of the simulated TBP curve tends to be flat versus the normally expected upward concave shape. The high temperature simulated distillation (HTSD) measures temperatures up to 1382 degrees F (695 degrees C) and is more accurate than the methods discussed above. However, the boiling point curve produced with this procedure also has a definite bias toward paraffin normal boiling points. Therefore, corrections should be applied for crude oils containing significant quantities of aromatic compounds with normal boiling points higher than 500 degrees F (260 degrees C).
Figure 1: Development of Petroleum Pseudo-components for Crude Oil Generalized correlations for converting ASTM D86 and ASTM D1160 boiling point data to equivalent TBP curves and vice versa have been successfully used for many years. Such correlations are available in nearly every commercial simulator program. However, there are no reliable generalized methods for converting simulated distillations to TBP distillation equivalents. While some methods for simulated distillation conversion are offered in commercial simulator programs, they are inaccurate and should not be used for crude assay
Page 4 of 18Some Practical Aspects Of Modeling Crude Oil Distillation
2012/07/03http://www.cadfamily.com/online-help/VMGSIM5_web%5COil_Characterization/So...

data. Accurate conversion of simulated distillation data for crude oils to TBP equivalents requires supplemental laboratory data for the crude oil, since the boiling point corrections are strongly dependent on the crude oil composition, i.e., aromatic content. In essence, each crude oil has a unique set of correction factors for conversion of the simulated distillation to the equivalent TBP distillation.
Practical Realities for Petroleum Pseudo-components The first step in building a crude distillation model is transformation of the crude assay data into petroleum pseudo-components or "cuts". This step is illustrated in Figure 1. Each cut represents a portion (liquid volume or mass basis) of the TBP boiling point curve and is assigned a normal boiling point equal to the average value for the entire cut. The obvious first step in defining the cuts is conversion (if necessary) of the laboratory distillation for the crude oil to a TBP equivalent basis. As previously mentioned, there are no reliable correlations for conversion of crude oil simulated distillations to TBP distillations. When simulated distillation data are provided they should be supplied to the simulator program as a mass TBP boiling point curve. Any corrections for deviation from the true TBP distillation must be performed on a manual basis outside the commercial simulator program. This will be discussed later in this article. To establish the corresponding mass or liquid volume for each cut it is necessary to define a gravity for each cut. When a gravity curve is provided for the crude oil, these data are used to define the average gravity for each cut. When no gravity curve is provided, most commercial simulators estimate the individual cut gravities by using the TBP equivalent boiling point curve and the average stream gravity for the crude oil. The technique8 most commonly used to predict the cut gravities from the average stream gravity and the boiling point curve is to assume that the Watson-Murphy K factor is constant (or nearly constant) for the entire crude oil boiling range. This is not a particularly good assumption for full boiling point range crude oil. Figure 1 illustrates the error in the cut gravities that is introduced with the constant K factor technique. Note that the lower boiling cuts have API gravities that are too low, i.e., these petroleum pseudo-components are too dense. On the other end of the boiling point curve, the cuts have API gravities that are too high, i.e., these pseudo-components are too light. In terms of the compositions of the pseudo-components it may be said that the low-boiling cuts are not sufficiently paraffinic and the high-boiling cuts are too paraffinic. This error in characterization affects the other predicted cut thermophysical properties, and in particular the cut molecular weights. The next step in development of properties for the petroleum pseudo-components is prediction of the molecular weight. Several correlations are made available in commercial simulator programs that relate the normal boiling point, gravity, and molecular weight for hydrocarbons. All other necessary thermophysical properties may be predicted for hydrocarbons from the normal boiling point, gravity, and molecular weight. Note: It is generally advisable to use the default molecular weight correlation in commercial simulators since other thermophysical properties may be correlated to the default molecular weights.
How Many Pseudo-components Should be Used to Characterize Crude Oil?
In the days prior to computer programs, crude oils were represented with fewer than ten petroleum pseudo-components or cuts. Crude oil distillation columns were designed and built, with many still in operation today. Of course, the key to early designs was using a large safety factor. As simulators gained popularity in the middle 1970's, computers were relatively primitive and virtual storage was unknown. Therefore early simulators were designed for a maximum
Page 5 of 18Some Practical Aspects Of Modeling Crude Oil Distillation
2012/07/03http://www.cadfamily.com/online-help/VMGSIM5_web%5COil_Characterization/So...

number of components based on fixed dimensional arrays within the programs. The most popular number of components was 50, and the cuts used to represent petroleum were designed around this number. Interestingly, this number is still widely used in simulators today, with the same designer cuts of the 1970's. These cut point ranges give reasonable results for most refining problems and are as follows:
Recall that full boiling point range crude oil contains thousands of real components. Yet the simple boiling point cuts given above produce reasonable answers for many crude distillation problems. The number of cuts to use for any petroleum problem is dependent on the distributed components in the fractionation zones, where a fractionation zone is defined as a distillation column section in which two products are separated. The distributed components appear in both products. For reasonable results, there should be at least 6 to 8 significant distributed components in the two products of separation.
Figure 2: Simulation of "Heartcut" Product Streams For crude oil distillation, the number of cuts may be tested with a sensitivity study on the model in which each product yield is varied. The model should respond in similar fashion to an actual column, i.e., in a continuous, smooth fashion with no large step changes in the tray temperatures or drastic changes in the boiling point curves for the products. When step changes occur, the model does not have a sufficient number of distributed boiling point cuts. To correct the model, additional boiling point cuts should be defined in the boiling point range of the distributed components.
TBP range, Degrees F
TBP Range, Degrees C
Number of Pseudo-components (cuts)
< 100 < 37.8 Use actual components (pentanes and lighter)
100-800 37.8-427 28
80-1200 427-649 8
1200-1600 649-871 4
Page 6 of 18Some Practical Aspects Of Modeling Crude Oil Distillation
2012/07/03http://www.cadfamily.com/online-help/VMGSIM5_web%5COil_Characterization/So...

One other case for additional cuts in a boiling point range is worthy of note. This occurs when a relatively flat boiling point curve product ("heartcut product") is distilled. This product generally corresponds to a flat region of the TBP curve for the feed stock. Figure 2 illustrates this situation. It is absolutely necessary that additional cuts be added in the boiling point range for the "heartcut" product to resolve this problem.
A Practical Way to Verify the Accuracy of the Crude Oil TBP Curve
Many hours of frustration may be avoided if the crude oil TBP curve is tested prior to development of the crude column model. W. L. Nelson9 presents four principles for the operation of crude columns: - The yield of a given product is primarily a function of the composition of the feed mixture, not the degree of separation. - The number of trays only slightly alters the boiling range of the products as defined by ASTM initial and end points. - The initial boiling point of side draw products is always low, and must be corrected by either steam stripping or reprocessing. - The end point of a side draw product is primarily controlled by opening or closing the draw valve to change the yield. Freely translated to the modeling of crude oil distillation, Nelson's four principles are: - If the composition of the feed is incorrect, it is impossible to match the yields by changing the column configuration or operating conditions. - Separations in crude columns are insensitive to the number of contact trays used in the sections. - Crude columns do no significant stripping of the side products- they must be stripped in attached stripping columns. - The product final boiling points are controlled by draw rate, not fractionation. Notice that the first and last of these principles predicate an accurate representation of the crude oil boiling point curve. Without question, the single-most important step when modeling crude oil distillation is development of an accurate characterization for the crude oil. No amount of adjustment of the column model can compensate for a poor representation of the crude oil feed. The accuracy of crude oil assay data in representing the unit being modeled may be tested by reconstruction of the crude oil TBP curve from the actual product data. This is easily accomplished with a commercial simulator program by entering the laboratory data (distillation and gravity) for the various products from the unit and creating flow sheet streams at the observed flow rates. The individual flow sheet streams are combined and the composite TBP curve is predicted. This composite curve may be compared to the TBP curve for the crude oil assay data. If there are significant variations between the curves: a) the crude assay data do not represent the crude oil being processed for the plant test, b) there may be an error in one or more of the plant product rates, c) there may be a significant paraffin bias in a simulated distillation that must be corrected. Variations between the crude oil assay and the product composite curve should be resolved before any effort is expended to model the crude distillation column. This technique of building a crude oil TBP curve from the products may also be used when the oil being processed by the refinery is an unknown mixture of crude oils. The goal is always to maximize the use of available data. This translates to using product rates and qualities from units downstream from the crude distillation unit. Consider the block flow
Page 7 of 18Some Practical Aspects Of Modeling Crude Oil Distillation
2012/07/03http://www.cadfamily.com/online-help/VMGSIM5_web%5COil_Characterization/So...

diagram shown in Figure 3.
Figure 3: Block Flow: Crude Oil Processing There are two final products from the crude oil distillation unit: kerosene and diesel. Laboratory distillations are routinely reported for these streams. The atmospheric gas oil is sampled and monitored. However, a full laboratory distillation for this stream may not be available, and a special sample may be required. The light products of the crude distillation are produced by stabilizing and splitting the crude distillation overhead liquid. A chromatographic breakdown for the C3's and C4's is generally available, as well as the gravity and laboratory distillation for the light straight run and the heavy naphtha. The wet gas is not routinely sampled and may be ignored when building a crude oil from the products. The light gases in the wet gas are primarily products from cracking of the crude oil in the furnace. They may be estimated and added to the model later to complete definition of the heated crude charge to the crude distillation column. The topped crude oil has a wide boiling point range: heavy kerosene to the heaviest material in the crude oil. Other than the gravity, few data are available for this stream. Occasionally a partial distillation is done to check the stripping in the main column stripping zone, but these data are not routinely available. The crude column flash zone separates the atmospheric gas oil and lighter from the topped crude oil. Therefore it is necessary to have some boiling point data for the topped crude oil to properly model this column zone. If product data are not available for the vacuum column, it is possible to fabricate a topped crude oil laboratory distillation using a technique developed by Kaes10. When data are available for the vacuum distillation products, these products may be used in lieu of the topped crude oil. The vacuum column overhead stream is primarily light liquid and gases produced by cracking of the topped crude oil in the vacuum furnace and may be ignored. The light vacuum gas oil may be analyzed using typical laboratory methods. The heavy vacuum gas oil has a boiling point range that extends to about 1100 degrees F
Page 8 of 18Some Practical Aspects Of Modeling Crude Oil Distillation
2012/07/03http://www.cadfamily.com/online-help/VMGSIM5_web%5COil_Characterization/So...
(594 degrees C). Either an ASTM D1160 or ASTM D-2887-extended simulated distillation may be used to produce a full boiling point curve for this product. For the most accuracy in the vacuum column calculations, it is best to have a complete laboratory distillation for the heavy vacuum gas oil. Distillation data are rarely available for the vacuum column residuum, which is a heavy, tar-like mixture. The flash zone in the vacuum column separates between the heavy vacuum gas oil and the vacuum residuum. It is necessary to build a laboratory distillation for the vacuum residuum that includes the distributed components for this fractionation zone if an accurate model is required for the vacuum column. When an accurate model for the vacuum column is not needed, the vacuum residuum may be given an arbitrary laboratory distillation ranging from 700 degrees F (371 degrees C) to 1600-2000 degrees F (871-1094 degrees C), depending on the heaviness of the crude oil. A few points may be read from probability distillation paper to complete the boiling point curve for the vacuum residuum. When the synthesized crude oil is also used to model the vacuum distillation column, a trial and error procedure developed by Kaes11 may be used to fabricate the portion of the vacuum residuum that overlaps the heavy gas oil. Components with boiling points higher than the heavy gas oil have no impact on the vacuum column flash zone calculations and may be assigned arbitrarily high values.
Translation of the Physical Hardware to a Theoretical Computer Model
This step in the model building process pales in significance when compared to the proper characterization of the crude oil. In the author's experience with technical support issues, it was usually necessary to adjust the charge to the crude distillation column rather than the distillation column model itself to resolve poor modeling results. It is important to restate Nelson's second principle at this point: "the separations in crude columns are insensitive to the number of contact trays". For actual crude columns, contact trays are liquid/vapor contact devices such as bubble cap trays or valve trays. For column models, contact trays are theoretical trays or liquid/vapor contact steps in which the liquid and vapor leaving the tray are in perfect vapor/liquid equilibrium. Conditions in crude distillation columns are hardly conducive for reaching phase equilibrium; therefore, there will be fewer theoretical trays of fractionation than the number of actual trays. The ratio of theoretical trays to actual trays is called tray efficiency and is less than 100 on a percent basis. Thus to build a computer model for a crude distillation column, it is necessary to apply tray efficiency factors to translate the actual trays to theoretical trays.
Page 9 of 18Some Practical Aspects Of Modeling Crude Oil Distillation
2012/07/03http://www.cadfamily.com/online-help/VMGSIM5_web%5COil_Characterization/So...

Figure 4: Typical Crude Distillation Unit Commercial simulator programs provide various tray efficiency models. None of these tray efficiency models are valid for crude distillation columns, and they should not be used in the model building process. See Kaes12 for additional discussion of tray efficiency models. The translation of actual trays to theoretical trays should be accomplished by the model builder, and the resultant theoretical trays supplied to the simulator. For discussion purposes, consider the typical crude distillation column shown in Figure 4. This column has three side products, two overhead products, and a bottom product. The side products are stripped in small stripping columns to control the front portion of their boiling point curves. The only significant stripping that takes place in the main column is in the stripping zone below the hot crude oil entry point (or flash zone). Three pump around cooling circuits are used to help remove the latent heat from the hot flash zone vapors and condense the side products. The heat removed is transferred to the crude charged to the unit in the preheat exchangers to reduce the heating requirements for the furnace. The pump around circuits also degrade the separation between side products somewhat, since they reduce the internal liquid flows between the side products. Figure 4 illustrates only a small portion of the contact trays in a crude column. There are typically around 40 to 50 trays in a crude column such as is illustrated in Figure 4. For purposes of discussion, the column is considered as consisting of several zones. The main column stripping zone is between the bottom of the column and the column flash zone and usually has 5 to 7 actual trays. Tray efficiencies are low and two theoretical trays are adequate to represent this zone. Note that the top stripping tray receives the liquid from the flash zone.
Page 10 of 18Some Practical Aspects Of Modeling Crude Oil Distillation
2012/07/03http://www.cadfamily.com/online-help/VMGSIM5_web%5COil_Characterization/So...

Figure 5: Main Column Flash Zone The main column flash zone is the next zone of the column. There are no actual trays in this zone where the hot crude oil "flashes" or vaporizes. However, for preliminary modeling purposes it is useful to represent the flash zone with one theoretical tray as shown in Figure 5. This permits the addition of a "trim" heat duty to the flash zone to adjust the effective feed temperature. A performance specification may be added to correspond to this dummy heat source. This technique lends stability to the column model. The main column wash zone is comprised of the trays between the flash zone and the bottom side product (gas oil). Old designs use 2 to 4 trays in this zone and newer designs use 6 to 8 trays in this zone. It is necessary to have more liquid flow returning to the flash zone (overflash) for old designs to protect the quality of the gas oil. The trays in this zone have very low efficiencies because of the low liquid reflux rate versus the vapor rate. Use one theoretical tray for old designs and two theoretical trays for newer designs to represent this zone. The pump around zones include the trays between the draw tray and the return tray. There are three pump around arrangements illustrated in Figure 6, with scheme 1 being the most common. This scheme circulates a cooled pump around stream up the column. The pump around stream is typically drawn from the same tray as a liquid side product. The limit for heat transfer occurs when the liquid flowing from the tray above the pump around return tray disappears. Crude units operate below this limit to insure that this liquid is always a positive flow.
Figure 6: Pump around Arrangements Note that the trays in the pump around zone are for heat transfer only. The large flow of pump around liquid creates a region of constant liquid composition that eliminates fractionation. A pump around zone may be considered equivalent to an equilibrium flash for which equilibrium liquid is re-circulated. Scheme 2 is similar to scheme 1 except that the pump around cooling zone is placed beneath the product draw tray. For this scheme, all liquid is removed from the draw tray above the pump around, and the pump around liquid provides liquid for the tray below the product draw. This produces a liquid "pinch point" at the product draw tray and maximizes
Page 11 of 18Some Practical Aspects Of Modeling Crude Oil Distillation
2012/07/03http://www.cadfamily.com/online-help/VMGSIM5_web%5COil_Characterization/So...

heat removal from the column. Scheme 3 uses a "pump down" scheme to remove heat from the column. This scheme cannot remove as much heat as schemes 1 and 2 since some of the cold reflux is re-vaporized by the hot vapor entering the return tray. It has an advantage over the other schemes in that the tray receiving the cold return still accomplishes fractionation. For all three schemes the pump around circuit is represented with two trays: a draw tray and a return tray. For schemes 1 and 3 the draw tray also serves as the product draw tray. Sometimes both the product and the pump around return stream circulate through the pump around exchanger as shown in Figure 7. For this arrangement, the column model pump around should only include the net liquid that returns to the column and its associated cooling duty. A true model for the pump around exchanger may be constructed by exporting a stream from the column that includes both the net pump around and the product draw flows.
Figure 7: Net Pump around Model The side product zones are illustrated in Figure 8. Crude distillation columns typically have 8 to 10 actual trays between the side products. One tray is used to represent the pump around cooling tray (when present). For the lower side products, two theoretical trays are adequate to represent the fractionation trays in a side product zone. For the higher side products, three or four theoretical trays may be used. Figure 8 illustrates the simulation configuration for a typical crude distillation column.
Figure 8: Side Product Draw Zones The main column top zone consists of the trays from the highest side product draw tray to the top tray. This zone has reasonable fractionation, and an overall tray efficiency of 65 percent may be used for this section; i.e., 12 actual trays would be represented with 12 times 0.65 = 8 theoretical trays (fractional trays are rounded to an integer). The steam side stripper columns have 6 to 10 actual trays, depending on the design. They may be adequately represented with two (author's preference) or three theoretical trays.
Page 12 of 18Some Practical Aspects Of Modeling Crude Oil Distillation
2012/07/03http://www.cadfamily.com/online-help/VMGSIM5_web%5COil_Characterization/So...
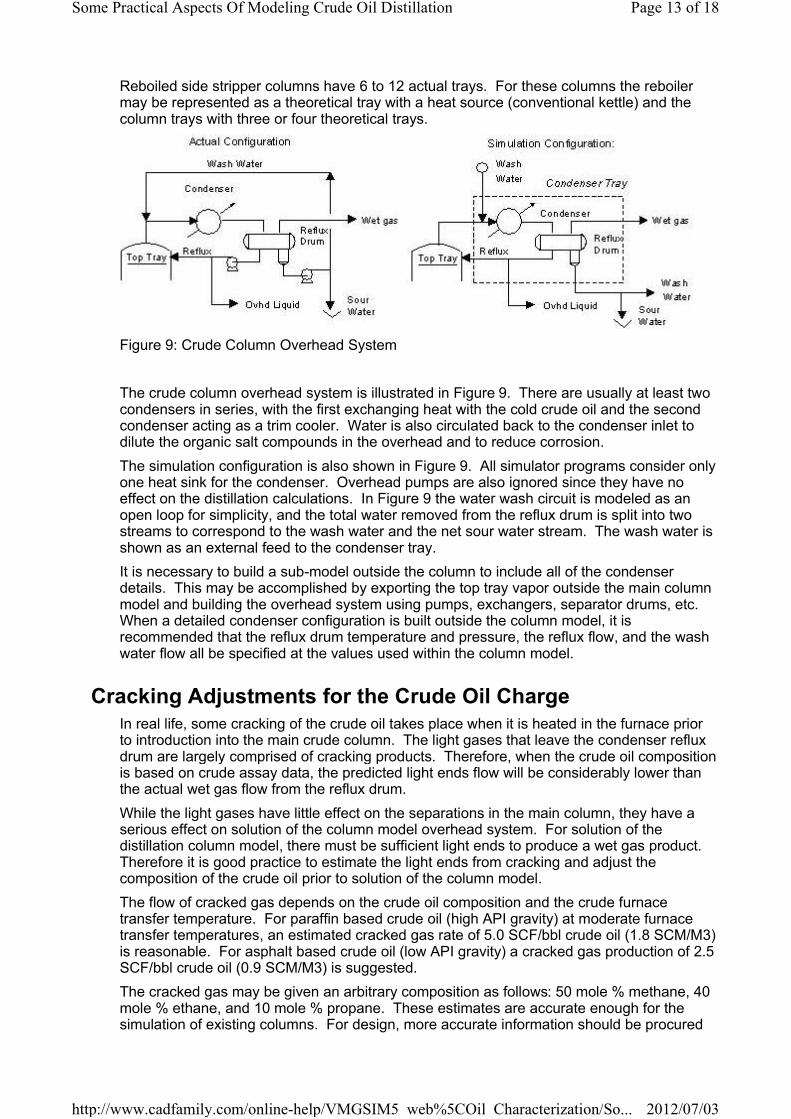
Reboiled side stripper columns have 6 to 12 actual trays. For these columns the reboiler may be represented as a theoretical tray with a heat source (conventional kettle) and the column trays with three or four theoretical trays.
Figure 9: Crude Column Overhead System The crude column overhead system is illustrated in Figure 9. There are usually at least two condensers in series, with the first exchanging heat with the cold crude oil and the second condenser acting as a trim cooler. Water is also circulated back to the condenser inlet to dilute the organic salt compounds in the overhead and to reduce corrosion. The simulation configuration is also shown in Figure 9. All simulator programs consider only one heat sink for the condenser. Overhead pumps are also ignored since they have no effect on the distillation calculations. In Figure 9 the water wash circuit is modeled as an open loop for simplicity, and the total water removed from the reflux drum is split into two streams to correspond to the wash water and the net sour water stream. The wash water is shown as an external feed to the condenser tray. It is necessary to build a sub-model outside the column to include all of the condenser details. This may be accomplished by exporting the top tray vapor outside the main column model and building the overhead system using pumps, exchangers, separator drums, etc. When a detailed condenser configuration is built outside the column model, it is recommended that the reflux drum temperature and pressure, the reflux flow, and the wash water flow all be specified at the values used within the column model.
Cracking Adjustments for the Crude Oil Charge In real life, some cracking of the crude oil takes place when it is heated in the furnace prior to introduction into the main crude column. The light gases that leave the condenser reflux drum are largely comprised of cracking products. Therefore, when the crude oil composition is based on crude assay data, the predicted light ends flow will be considerably lower than the actual wet gas flow from the reflux drum. While the light gases have little effect on the separations in the main column, they have a serious effect on solution of the column model overhead system. For solution of the distillation column model, there must be sufficient light ends to produce a wet gas product. Therefore it is good practice to estimate the light ends from cracking and adjust the composition of the crude oil prior to solution of the column model. The flow of cracked gas depends on the crude oil composition and the crude furnace transfer temperature. For paraffin based crude oil (high API gravity) at moderate furnace transfer temperatures, an estimated cracked gas rate of 5.0 SCF/bbl crude oil (1.8 SCM/M3) is reasonable. For asphalt based crude oil (low API gravity) a cracked gas production of 2.5 SCF/bbl crude oil (0.9 SCM/M3) is suggested. The cracked gas may be given an arbitrary composition as follows: 50 mole % methane, 40 mole % ethane, and 10 mole % propane. These estimates are accurate enough for the simulation of existing columns. For design, more accurate information should be procured
Page 13 of 18Some Practical Aspects Of Modeling Crude Oil Distillation
2012/07/03http://www.cadfamily.com/online-help/VMGSIM5_web%5COil_Characterization/So...

for sizing the wet gas compressor. Figure 10 illustrates the simulator flow for the cracking adjustment. The cracking gas composition is defined and the rate set based on the crude flow. To maintain the material balance, a like mass of crude oil is subtracted.
Figure 10: Cracking Adjustment for the Crude Oil from the Furnace
Reality Checks for the Operating Data Much time can be saved with a few reality checks on the operating data for the crude distillation unit. The first check is a material balance based on the feed stock and product rates and gravities. If the material balance is in error by more than three or four weight percent, the source of the imbalance should be located and corrected. Normalizing the data is a poor substitute for locating the problem! Note that plant tests are usually normalized to perfect weight balances. It is very helpful to examine the test data before any corrections were made. The following rates are likely to be inaccurate, especially if the meter factors were not been updated for the plant test: top reflux rate, pump around rates, and topped crude oil rate. These streams are not products and accurate flows are not needed for the plant operations. Stripping steam rates are sometimes missing or inaccurate. Side stripper steam flows may be estimated as 0.1 to 0.15 lb steam/gallon stripped product (12 to 18 kg/M3). It is important to have an accurate flow for the main column bottom steam since this steam determines the required flash zone temperature. If missing, the bottom steam may be estimated as 0.12 lb/gallon (14.4 kg/M3). Note that an estimated steam flow may require tuning later on to match the column operating conditions. For crude distillation columns the temperature measurement for the vapor leaving the top tray tends to be inaccurate. Interestingly, the measured temperature is always lower than the simulated temperature when there is a difference. One plausible explanation is that liquid entrainment in the overhead vapor causes a "wet bulb" effect that lowers the measured temperature. It is not unusual to have a difference of 15 to 25 degrees F (7.8 to 13.9 degrees C) between the measured and simulated overhead temperatures, with the simulated value being highest. The furnace transfer temperature is a reasonable check on the column flash zone temperature. The column flash zone is usually about 5 to 7 degrees F (2.8 to 3.9 degrees C) lower than the transfer temperature because of Joule-Thompson cooling. The bottom stream from the crude column is typically 9 to 12 degrees F (5.0 to 6.7 degrees C) lower than the flash zone because of the stripping steam. Main column product draw temperatures may or may not be accurate, depending on the point of measurement. It is important to remember that the simulation model draw temperature is the true bubble point for the liquid product at the draw tray pressure. For a main column draw stream that is fed to a steam side stripper, the side stripper bottom temperature may be used to verify the main column draw temperature. The stripped product is cooler than the draw stream because of the steam stripping.
Page 14 of 18Some Practical Aspects Of Modeling Crude Oil Distillation
2012/07/03http://www.cadfamily.com/online-help/VMGSIM5_web%5COil_Characterization/So...

Typical stripper cooling is: Kerosene strippers: 20 to 30 degrees F (11-16.7 degrees C) Diesel strippers: 25 to 40 degrees F (13.9 to 22.2 degrees C) Gas oil strippers: 25 to 40 degrees F (13.9 to 22.2 degrees C Pump around data should also be checked. Since the pump around streams exchange with crude oil, the heat transferred can be calculated for both sides of the pump around exchanger. The example below illustrates this procedure.
Example 1 Checking Pump around data Exchanger: Diesel pump around versus crude oil Diesel: Rate = 40,000 bbl/day, API gravity = 36.0, Draw = 490 F, Return = 375 F Crude: Rate = 50,000 bbl/day, API gravity = 29.0, Inlet = 275 F, Outlet = 370 F Approximate Heat Capacities:
Diesel = 0.62 Btu/lb-deg F (2.59 kj/kg-deg C) Crude oil = 0.63 Btu/lb-deg F (2.64 kj/kg-deg C)
Gravity Conversions: Diesel = 36.0 API = 295.4 lb/bbl Crude = 29.0 API = 308.3 lb/bbl
Procedure: Compute the exchanger duty with formula: Q = w cp delta t Duty from diesel data = (40,000/24)(295.4)(0.62)(490-375) = 35.1 MMBTU/hr Duty from crude data = (50,000/24)(308.3)(0.63)(370-275) = 38.4 MMBTU/hr Conclusion: The pump around data is reasonably accurate. For the model, the diesel pump around rate is specified as 40,000 bbl/day and the delta t as 115 deg F.
Solution techniques for the Distillation Model Most commercial simulator programs use the inside/out (I/O) algorithm for solution of crude distillation systems. This method is very effective and solves the side columns and pump around circuits simultaneously with the main column. The tray pressures are supplied by the model builder and are not changed during the solution process. Iteration variables include the tray temperatures, tray flows and compositions, tray enthalpy balances, and tray vapor/liquid phase equilibrium relationships. The solution is based on performance specifications that are supplied by the user and/or by program defaults. The solution procedure is iterative in nature and starts from estimated temperature, flow, and tray composition profiles. The procedure is robust, and most calculation failures are the result of badly chosen performance specifications. However, the solution process may be expedited with reasonable estimates. In particular, convergence is enhanced by good estimates for the main column temperature profile. The following estimates should be provided: reflux drum, column overhead, all product draws, flash zone, and column bottom. While the I/O method is relatively insensitive to estimated flows, it is good practice to provide estimates for the overhead reflux and all products for which the rates are not specified.
Page 15 of 18Some Practical Aspects Of Modeling Crude Oil Distillation
2012/07/03http://www.cadfamily.com/online-help/VMGSIM5_web%5COil_Characterization/So...

Solution Strategy for the Distillation Model Unconverged column results yield little useful information and the strategy is always to procure a converged solution. In the initial model building phase, there are usually several items of data for which reconciliation is necessary. It is wise to simplify the performance specifications and use the flash zone represented in Figure 5 in which a tray with a trim heater represents the flash zone. The following set of specifications is recommended: > Circulation rate and delta temperature for each pump around. > All liquid product flow rates except one. > Condenser temperature for partial condensers. > Overflash rate (liquid return to flash zone). The trim heater duty at the flash zone tray should be small and the flash zone temperature should match the plant data within a few degrees Fahrenheit. If this is not the case, there may be a problem with the topped crude oil flow rate, overflash rate, bottom steam rate, and/or the crude oil composition. The flash zone temperature for the model must be reconciled with the plant data before further tuning of the model is justified.
Fine Tuning the Distillation Model After the major data problems have been resolved, the model may be generalized and tuned. The furnace transfer temperature should be adjusted such that the flash zone trim heater has zero duty. This heater is no longer needed and may be removed from the model. Optionally, the tray representing the flash zone may also be removed from the model. After the flash zone tray is removed, the flash zone liquid portion should be fed to the top stripping tray and the flash zone vapor portion fed to the bottom wash zone tray. Performance specifications may be generalized as follows:
Circulation rate and delta temperature for each pump around (no change) Condenser temperature for partial condensers (no change)
Overhead liquid specification: ASTM D86 95 % distilled temperature All liquid products except the atmospheric gas oil: ASTM D86 95 % distilled
Specification for atmospheric gas oil/topped crude separation: Overflash rate or Gas oil draw temperature or Gas oil 95 % distilled.
Pump around return temperatures should never be specified since the duty is only correct for this specification when the simulated draw temperature exactly matches the plant. Delta temperature is preferable to insure that the pump around duties are correct. The pump around rate may be tuned as needed to match a return temperature for the model and the plant. ASTM D86 95 % distilled specifications are preferable to TBP distillation specifications for setting the product rates. Simulated end points are not consistently accurate and may not respond properly to changes in the product draw rates. The TBP or simulated distillation end point is very sensitive to trace quantities of heavy components. ASTM D86 95 % distilled points are very stable for column calculations as well as plant operations. The separation between the topped crude oil and the atmospheric gas oil is sloppy, and a product distillation specification may not be as stable as the gas oil draw temperature for the model. The model has maximum stability when an overflash specification is used for the separation in this column zone.
Page 16 of 18Some Practical Aspects Of Modeling Crude Oil Distillation
2012/07/03http://www.cadfamily.com/online-help/VMGSIM5_web%5COil_Characterization/So...

How Well Should the Model Match the Plant? This paper has already dealt with the importance of the crude oil composition used in the model. When matching plant operations, the best measure of the accuracy of the crude oil representation is a plot of the TBP constructed from the product data superimposed on the crude oil TBP. Nothing in a model can compensate for poor characterization of the crude oil charge. The comments below assume that the crude oil representation for the model is reasonably accurate. The flash zone temperature for the model should be no more than 3-5 degrees F (1.7 - 2.8 degrees C) different from the actual operating temperature. The furnace transfer temperature is typically 5-8 degrees F (2.8-4.4 degrees C) higher than the flash zone and may be used for a second check. Deviations in the flash zone temperature that are higher than mentioned above should be resolved early in the modeling process. The liquid draw temperatures for the side products and pump around draws (typically the same draw tray) should match the plant data within 5-10 degrees F (2.8-5.6 degrees C). The pump around exchangers provide an additional check on the measured draw temperatures since the duties for the pump around streams may be compared to the duties for the crude oil streams for the pump around exchangers. The stripped product temperatures provide another check point and have been previously discussed in the section entitled "Reality Checks for the Operating Data". The overhead vapor temperature may or may not agree closely with the plant value. A deviation of 15-25 degrees F (8.3-13.9 degrees C) is not unusual for crude distillation models. However, it may be categorically stated that when there is a difference in the model and measured overhead temperatures, the model temperature will always be higher than the plant value. There is something wrong with a model in which the simulated overhead temperature is lower than the plant temperature. Reasons for the deviation between simulated and actual overhead temperatures have been given in the section entitled "Reality Checks for the Operating Data." The simulated bottom temperature should be within 5-10 degrees F (2.8-5.6 degrees C) of the measured value. Note that this temperature is usually 7-10 degrees F (3.9-5.6 degrees C) lower than the flash zone temperature. The measured overhead reflux rates for crude distillation columns are typically not very accurate. It is not unusual to see differences of 10 - 15 percent in the simulated value versus the measured value. For the initial model in which the product rates are specified, the draw temperatures should be within 5-10 degrees F (2.8-5.6 degrees C) of the measured values. The simulated product distillations should be in reasonable agreement with those measured in the plant. Note that true to Nelson's fourth principle, draw temperatures may only be changed by adjusting the rates for the side products. The draw temperature for any side product may be raised by decreasing the flow of the product immediately below and vice versa. Changing the number of theoretical trays to control draw temperatures is a bad idea and will not work for crude distillation columns. For the diesel and lighter side products, the ASTM D86 95 LV% distilled temperature should be within 5-10 degrees F (2.8-5.6 degrees C) of the measured value. This simulated temperature point should be used in lieu of the simulated endpoint (which can be inaccurate and insensitive to rate changes). For these products, the ASTM D86 50 LV% distilled temperature should also be within 5-10 degrees F (2.8-5.6 degrees C) of the plant values. The ASTM D86 10 LV% distilled temperatures of the diesel and lighter side products are controlled by the side stripping columns, not the main column. Simulated temperatures higher than the plant indicate more stripping in the model than in the plant and may be corrected by reducing the stripping steam and/or reducing the number of trays in the side stripper. Simulated temperatures that are lower than the plant may be corrected by increasing the stripping steam and/or adding trays to the side stripper. Note that
Page 17 of 18Some Practical Aspects Of Modeling Crude Oil Distillation
2012/07/03http://www.cadfamily.com/online-help/VMGSIM5_web%5COil_Characterization/So...

measurements of side stripper steam are often either missing or inaccurate. For side strippers above the kerosene draw, the steam is often removed completely and the stripper functions as a product surge drum. In comparing ASTM D86 data for the plant and the model it is helpful to look at several plant measurements to see the fluctuations that are occurring in the plant products. There are two sources of fluctuation in the plant measurements: small changes in the plant operation and differences in the laboratory measurements. It must be remembered that the sampling techniques can cause some differences in the lab measurements as well as the repeatability of the ASTM D86 measurements. The ASTM D86 procedure is designed for repeatability of temperature measurements within plus or minus 6 degrees F (3.3 degrees C).
References 1 - James H. Gary and Glenn E. Handwerk, Petroleum Refining Technology and Economics, 4th edition, Marcel Dekker Inc., New York (2001), p 21. 2 - Kaes, Gerald L., Refinery Process Modeling, Athens Printing Co., Athens, GA (2000), p 16-24. 3 - James H. Gary and Glenn E. Handwerk, Petroleum Refining Technology and Economics, 4th edition, Marcel Dekker Inc., New York (2001), p 22-26. 4 - Kaes, Gerald L., Refinery Process Modeling, Athens Printing Co., Athens, GA (2000), p 16,17. 5 - Nelson, W. L., Oil and Gas Journal, p 125,126, (March 25, 1968). 6 - Kaes, Gerald L., Refinery Process Modeling, Athens Printing Co., Athens, GA (2000), p 20. 7 - Ibid, p 21,22. 8 - Ibid, p 33. 9 - Nelson, W. L., "Regulation of I.B.P. and E.P.", Oil and Gas Journal, p 143 (August 25, 1945). 10 - Kaes, Gerald L., Refinery Process Modeling, Athens Printing Co., Athens, GA (2000), p 102-103. 11 - Ibid, p 104,105. 12 - Ibid, p 64-67. Copyright (c) 2003-2009 Virtual Materials Group, Inc. All Rights Reserved
VMGSim ver. 5.0 August 2009
Page 18 of 18Some Practical Aspects Of Modeling Crude Oil Distillation
2012/07/03http://www.cadfamily.com/online-help/VMGSIM5_web%5COil_Characterization/So...