Embed Size (px)
Citation preview

Catalyst Paper Corporation
Business Review
Presented byKevin J. Clarke, President and CEO
Brian Baarda, Vice-President Finance and CFO August 11, 2010
Jefferies 6th Annual Global ConferenceNew York

2Jefferies 6th Annual Global Conference, August 11 2010
Forward-Looking StatementsThe presentation and answers to questions today contain forward-looking statements. Forward-looking statements are statements that address or discuss activities, events or developments that we expect or anticipate may occur in the future, including statements relating to overall economic conditions, future cost savings, capital expenditures, demand for our products, product prices and advertising levels, production volumes, future cash flows and liquidity, currency rates, covenant compliance, severance obligations, strength of markets, availability of fibre, curtailment of operations, and the impact of labour disruptions affecting suppliers. These forward-looking statements can be identified by the use of statements that include words such as “believe”, “expect”, “anticipate”, “intend”, “plan”, “likely”, “predicts”, “estimates”, “forecasts”, and similar words or phrases or the negative of these statements. These forward-looking statements reflect our current views and are based on certain assumptions including assumptions as to future economic conditions and courses of action as well as other factors we believe are appropriate in the circumstances. Such forward-looking statements are subject to risks and uncertainties and no assurance can be given that any of the events anticipated by such statements will occur or, if they do occur, what benefit we will derive from them. A number of factors could cause actual results, performance or developments to differ materially from those expressed or implied by such forward-looking statements, including:
the impact of general economic conditions in the United States and Canada and in other countries in which we do business; market conditions and demand our products and the outlook for inventories, production and pricing; declines in advertising and circulation; expected cash flows, capital expenditures and completion of capital projects; our ability and that of our agents to sell our products in export markets; the implementation of trade restrictions and sanctions in jurisdictions we market our products; business strategies and measures to implement strategies; our history of losses; the cyclical nature of our business; the effects of intense competition; competitive strengths, goals, expansion and growth of our business and operations; shifts in industry capacity; fluctuations in foreign exchange or interest rates; our ability to successfully obtain cost savings from our cost reduction initiatives; labour unrest; fluctuations in the availability and cost of raw materials, including fibre and energy; implementation of environmental legislation requiring capital for operational changes; the availability of qualified personnel or management; the outcome of certain litigation or disputes; conditions in the capital markets and our ability to obtain financing and refinance existing debt; and other factors beyond our control.
We disclaim any intention or obligation to update or revise any forward-looking statements, whether as a result of new information, future events or otherwise, except as required by law.
Investors are cautioned not to place undue reliance on these forward-looking statements. No forward-looking statement is a guarantee of future results.

3 Jefferies 6th Annual Global Conference, August 11 2010
Non-GAAP Measures
Except where otherwise indicated, the financial information in this presentation is determined on the basis of U.S. GAAP.
“EBITDA” is a non-GAAP measure, calculated as operating earnings (loss) plus depreciation and amortization and impairment. We focus on EBITDA as we believe this measure enables comparison of our results between periods without regard to debt service, income taxes, capital expenditure requirements and impairment.
“EBITDA before specific items”, “net earnings (loss) attributable to the Company before specific items” and “net earnings (loss) per share attributable to the Company’s common shareholders before specific items” are non-GAAP measures. We use measures excluding specific items in evaluating our results between periods without regard to specific items that adversely or positively affect our EBITDA and net earnings (loss).
“Free cash flow” is a non-GAAP measure, calculated as EBITDA after capital expenditures, interest and taxes paid, and adjustments to reflect employee future benefit payments. The closest GAAP measure is cash provided by operating activities less cash used by investing activities. We report free cash flow as we believe it is useful for investors and other users to be aware of this measure so they can better assess our operating performance.

4 Jefferies 6th Annual Global Conference, August 11 2010
Changes in Accounting Policies
Effective January 1, 2010, we changed our policy on the classification of foreign exchange gains and losses on the ineffective portion of our U.S dollar revenue risk management instruments, on the portion that is excluded from the assessment of hedge effectiveness, and on translation of working capital balances denominated in foreign currencies. The respective foreign exchange gains and losses previously recognized in “Sales” are now recognized in “Other expense, net”. We continue to classify the effective portion of gains or losses on our previously designated U.S. dollar revenue risk management instruments in the same income statement line items as the hedged item in “Sales”.
We consider the new policies to be preferable as they increase the transparency of the economic hedging activity.
Prior period comparative information contained in this presentation has been restated to reflect these changes in accounting policies.

5Jefferies 6th Annual Global Conference, August 11 2010
Presentation Overview
Company OverviewIndustry OverviewFinancial ReviewCompany Strategies and Priorities
6 Jefferies 6th Annual Global Conference, August 11 2010
COMPANY OVERVIEW
7Jefferies 6th Annual Global Conference, August 11 2010
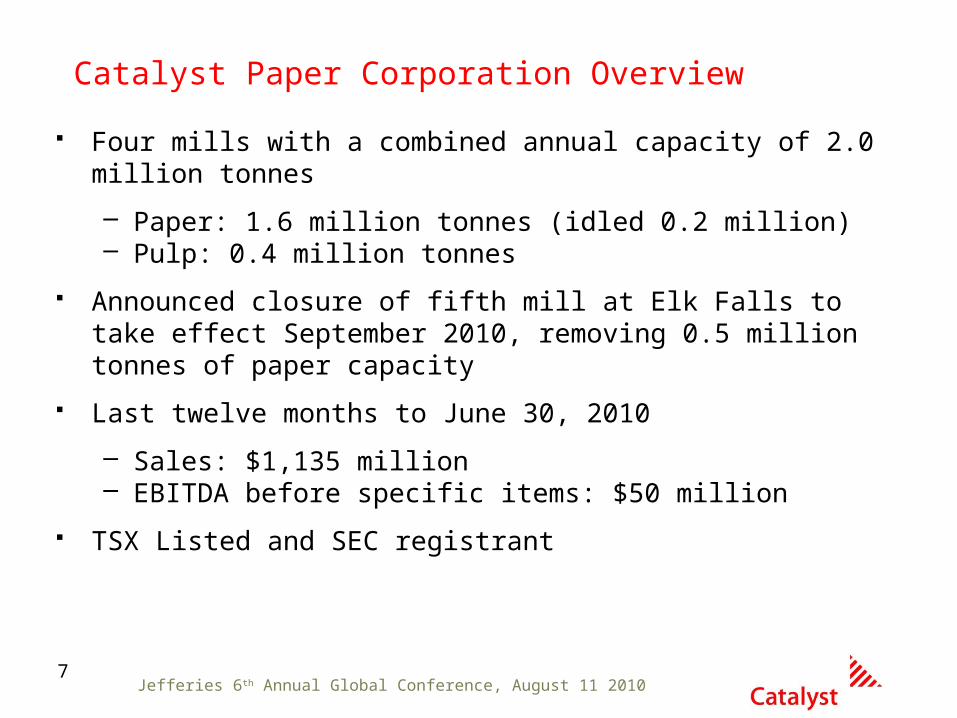
Catalyst Paper Corporation Overview
Four mills with a combined annual capacity of 2.0 million tonnes
– Paper: 1.6 million tonnes (idled 0.2 million)– Pulp: 0.4 million tonnes
Announced closure of fifth mill at Elk Falls to take effect September 2010, removing 0.5 million tonnes of paper capacity
Last twelve months to June 30, 2010
– Sales: $1,135 million– EBITDA before specific items: $50 million
TSX Listed and SEC registrant

8 Jefferies 6th Annual Global Conference, August 11 2010
2009 Production
Largest producer of mechanical printing papers in western North America
Only producer of lightweight coated paper in western North America
Own a 100% recycled paper mill in Arizona
Paper 1.4 million tonnes
Pulp 0.1 million tonnes
Total 1.5 million tonnes
Catalyst Paper Corporation Overview, continued
Powell River
Vancouver
Port Alberni
Crofton
Snowflake

9 Jefferies 6th Annual Global Conference, August 11 2010
Capacity by Mill Location and Product Line
CAPACITY BY MILL LOCATION AND PRODUCT LINE 1
Specialty printing papers 1 Newsprint 1 Pulp
Total
Mill locationNumber of
paper machinesUncoated
mechanicalLightweight
coated Directory Newsprint NBSK pulp
Crofton, B.C. 2 3 - - 183,000 234,000 403,000 3 820,000
Port Alberni, B.C. 2 - 231,000 112,000 - - 343,000
Powell River, B.C. 3 368,000 - - 104,000 - 472,000
Snowflake, Arizona 2 65,000 - - 281,000 - 346,000
Total capacity (tonnes) 433,000 231,000 295,000 619,000 403,000 1,981,000
% of total capacity 22% 12% 15% 31% 20% 100%
1 Capacities expressed in the above table can vary as we are able to switch production between products, particularly newsprint, directory and machine-finished uncoated grades.
2 We have indefinitely curtailed the No. 1 paper machine at Crofton, removing 140,000 tonnes of newsprint production on an annualized basis. The capacity and number of machines noted in the above table have not been adjusted to reflect this indefinite curtailment.
3 Total pulp capacity at Crofton is 403,000 tonnes, of which 343,000 tonnes are designated as market pulp with the remainder being consumed internally.
• The permanent closure of our Elk Falls mill in September 2010 will remove 373,000 tonnes of newsprint capacity and 153,000 tonnes of specialty printing papers capacity on an annualized basis and our total capacity will decrease from 2,507,000 tonnes to 1,981,000 tonnes of product, as reflected above.

10 Jefferies 6th Annual Global Conference, August 11 2010
Segment Specialty Printing Papers Newsprint Pulp
Category Uncoated Mechanical Lightweight Coated
Directory Newsprint NBSK Pulp
Soft-Calendered Machine-Finished
Brand Names ElectrasoftElectracal
Electraprime
ElectrabriteElectrabrite Lite
Electrastar
Electracote Catalyst Marathon Crofton Kraft
Basis Weight (g/m2) 45 – 52 45 – 66.5 44.4 – 63.6 28 – 40 43 – 48.8 n/a
Applications retail inserts, magazines, catalogues,
flyers, direct mail, directories
retail inserts, magazines,
supplements, flyers, direct mail, PR and corporate
communication books/manuals
retail inserts, magazines,
catalogues, direct mail
telephone books, catalogues
newspapers, retail inserts,
flyers, supplements,
directories
tissue, printing and writing
papers, specialty paper products, containerboard
Total capacity (tonnes) 433,000 231,000 295,000 619,000 403,000
% of Total Capacity 22% 12% 15% 31% 20%
Product Profile

11 Jefferies 6th Annual Global Conference, August 11 2010
United States66%
Canada13%
Asia & Australasia
12%
Latin America7%
Europe & Other 2%
Total Geographic Sales Distribution(% tonnes)
Specialty Printing Papers
68%
Newsprint26%
Pulp6%
2009 Revenue by Segment(% $mm)
Product and Geographic Diversity

12 Jefferies 6th Annual Global Conference, August 11 2010
Summary of Historical Financials($millions)
$132
$208
$141
$50
0.60
0.70
0.80
0.90
1.00
2007 2008 2009 LTM
US
$/C
DN
$
Foreign Exchange
$1,732$1,867
$1,224$1,135
2007 2008 2009 LTM
Sales
($105)
$64 $49
($55)
2007 2008 2009 LTM
Free cash flow
EBITDA before specific items

13 Jefferies 6th Annual Global Conference, August 11 2010
INDUSTRY OVERVIEW

14 Jefferies 6th Annual Global Conference, August 11 2010
Total North American (“NA”) Demand
NA Paper Demand
NA Paper demand is expected to increase 1.1% (130,000 tonnes) in 2010 vs. 2009. This up from the March 2010 forecast which forecasted declines of 1.7%.
Newsprint and directory are expected to see smaller demand declines in 2010 versus previous forecasts.
Coated and uncoated mechanical are expected to see higher growth than previously forecasted vs. 2009.
Source: PPPC
2007 2008 20092010
(03/10)2010
(06/10)
Newsprint 8,743 7,764 5,798 5,355 5,595 Directory 1,012 915 720 693 699 Uncoated- High Gloss 2,884 2,648 2,147 2,219 2,311 Uncoated- Standard 2,342 2,437 2,083 2,085 2,105 Coated 5,908 5,023 4,027 4,172 4,195 Total Paper 20,889 18,787 14,775 14,524 14,905
Year-over Year % Change
2007 2008 20092010
(03/10)2010
(06/10)
Newsprint -10.3% -11.2% -25.3% -7.6% -3.5%Directory -0.1% -9.6% -21.3% -3.8% -3.0%Uncoated- High Gloss 5.4% -8.2% -18.9% 3.3% 5.6%Uncoated- Standard -1.1% 4.1% -14.5% 0.1% 1.0%Coated 4.7% -15.0% -19.8% 3.6% 5.4% Total Paper -2.9% -10.1% -21.4% -1.7% 1.1%
North American Demand

15 Jefferies 6th Annual Global Conference, August 11 2010
Operating Rates
NA Operating Rates
Operating rates for paper are expected to improve to 93.7% compared to the 79.1% in 2009 and 82.4% in the previous 2010 forecast.
Excess capacity in newsprint has been significantly reduced from 2.4 million tonnes in 2009 leading to tighter market conditions.
Coated and uncoated mechanical rates are expected to be significantly higher than 2009 and the previous 2010 forecast which should lead to improved market conditions.
Source: PPPC
2007 2008 20092010
(03/10)2010
(06/10)
Newsprint 92.5% 93.6% 75.5% 77.0% 91.3%Directory 95.2% 95.9% 87.1% 88.8% 87.2%Uncoated- High Gloss 91.4% 92.9% 85.6% 89.2% 104.0%Uncoated- Standard 89.4% 90.2% 80.9% 92.5% 96.7%Coated 97.3% 87.6% 80.8% 83.3% 92.8% Total Paper 93.2% 91.8% 79.1% 82.4% 93.7%
Excess Capacity (000's mt)
2007 2008 20092010
(03/10)2010
(06/10)
Newsprint 900 705 2,400 2,125 725 Directory 52 45 117 100 107 Uncoated- High Gloss 228 170 324 237 (79) Uncoated- Standard 304 297 536 186 77 Coated 145 615 847 733 302 Total Paper 1,629 1,829 4,224 3,381 1,132
Adj. Operating Rate %
16 Jefferies 6th Annual Global Conference, August 11 2010
FINANCIAL REVIEW

17Jefferies 6th Annual Global Conference, August 11 2010
Summary of Segmented Financial Information
($millions, except where otherwise stated) 2007 2008 2009 LTM
Sales (000 MT) Specialty printing papers 1,054.8 1,080.8 896.5 887.0 Newsprint 496.3 601.8 488.2 478.0 Pulp 603.2 506.9 110.2 165.8 2,154.3 2,189.5 1,494.9 1,530.8
Sales Specialty printing papers $ 919.6 $ 1,000.9 $ 832.3 $ 737.2 Newsprint 338.0 463.9 320.6 270.7 Pulp 457.0 384.6 70.6 126.7 $ 1,714.6 $ 1,849.4 $ 1,223.5 $ 1,134.6
EBITDA Specialty printing papers $ 26.2 $ 139.5 $ 134.9 $ 61.5 Newsprint (23.7) 43.3 (8.4) (50.3) Pulp 24.5 (23.4) (3.3) 12.2 $ 27.0 $ 159.4 $ 123.2 $ 23.4
EBITDA before specific items Specialty printing papers $ 68.4 $ 150.1 $ 146.6 $ 69.5 Newsprint (10.8) 47.4 (5.4) (33.9) Pulp 34.1 (8.0) (0.1) 14.2 $ 91.7 $ 189.5 $ 141.1 $ 49.8
Operating earnings (loss) Specialty printing papers $ (75.1) $ 27.0 $ 41.1 $ (129.9) Newsprint (56.9) 3.6 (70.3) (294.6) Pulp (17.4) (188.0) (11.6) (0.6) $ (149.4) $ (157.4) $ (40.8) $ (425.1)

18 Jefferies 6th Annual Global Conference, August 11 2010
Free Cash Flow
($millions) 2007 2008 2009 LTM
Summarized cash flow
EBITDA before specific items $ 116.7 $ 189.5 $ 141.1 $ 49.8
Specific items (89.7) (30.1) (17.9) (26.4)
EBITDA 27.0 159.4 123.2 23.4
Interest expense, excluding amortization (67.8) (74.4) (66.5) (66.8)
Capital expenditures (85.8) (41.9) (11.5) (11.7)
Income taxes received (paid) (0.5) (0.8) (0.5) 0.4
Employee future benefits, net of funding 6.7 2.9 4.3 (0.3)
Free cash flow $ (120.4) $ 45.2 $ 49.0 $ (55.0)

19Jefferies 6th Annual Global Conference, August 11 2010
Liquidity
($millions) December 31 June 30
2007 2008 2009 2010
Borrowing base $ 309.0 $ 263.3 $ 147.9
$ 167.8
Letters of credit (20.7) (27.9) (24.1) (25.3)
Amount drawn (47.5) (60.1) (14.5) –
Minimum excess availability - (35.0) (35.0) (35.0)
Available to be drawn(1) (2) (3) 240.8 140.3 74.3 107.5
Cash on hand - 5.0 83.1 100.8
Total liquidity $ 240.8 $ 145.3 $ 157.4 $ 208.3
(1) Our ABL Facility is subject to certain financial covenants as disclosed in our interim consolidated financial statements for the
three and six months ended June 30, 2010, in note 9, “Long-term debt.”
(2) Under the terms of the ABL Facility, various reserves may be deducted from the borrowing base. A reserve in respect of vacation pay obligations, which as at June 30, 2010 amounted to $19.1 million, may be imposed if Excess Availability, as defined in the ABL Facility, is below a threshold of $75 million. Excess Availability under this definition was $142.5 million at June 30, 2010.
(3) Availability effective 2008 relates to the ABL Facility and availability for prior periods relates to the Company’s previous $350 million revolving operating facility.

20 Jefferies 6th Annual Global Conference, August 11 2010
Capitalization
($millions, except where otherwise stated) 2009
Dec 31 2010
June 30 Total debt
8.625% senior notes, due June 2011 (US$36 million; 2009 – US$354 million) $ 372 $ 38 7.375% senior notes, due March 2014 (US$250 million) 265 269 11.0% senior secured notes, due December 2016 (US$280 million; 2009 - $nil) – 297 11.0% Class B senior secured notes, due December 2016 (US$110 million; 2009 - $nil) – 101
Modification – difference in carrying value of 8.625% and 11.0% senior secured notes on exchange (US$38 million; 2009 - $nil) – 38
Revolving asset based loan 15 – Capital lease obligation 11 11 Other non-recourse (PREI) 113 114
Total 776 868
Shareholders’ equity attributable to the Company 814 422
Total capitalization attributable to the Company $ 1,590 $ 1,290
Cash $ 83 $ 101
Net debt ratio (1) 46% 65%
(1) Net debt ratio equals net debt (i.e., total debt less cash), divided by net capitalization (i.e., shareholders’ equity attributable to the Company and total debt less cash)

21 Jefferies 6th Annual Global Conference, August 11 2010
EBITDA Sensitivities
($millions) EBITDA
Impact of US$10/t change (1), (2) Specialty printing papers $ 9 Newsprint 5 Pulp 3
$ 17
Impact of $0.01 change in US$ (3) 5
Impact of 5% change in price of: (1), (4) Natural gas and oil – direct purchases 1 Electricity – direct purchases 6 Coal 1
Impact of US$5/unit change (1), (4) Wood chips (Bdt) 8 ONP (ST) 2
(1) Based on a foreign exchange rate of US$0.97. (2) Based on sales of Q2 2010 annualized production. (3) Based on Q2 2010 annualized net cash flows and a foreign exchange movement to US$0.98 from US$0.97
and excluding our hedging program and the impact of the translation of U.S. dollar denominated debt. (4) Based on annualized Q2 2010 consumption levels.

22 Jefferies 6th Annual Global Conference, August 11 2010
COMPANY STRATEGIESAND PRIORITIES

23Jefferies 6th Annual Global Conference, August 11 2010
60
339
208
67
344
217
116
314
213
154
338
225
169
344
211
201
361
203
145
311
154
136
326
166
0
200
400
600
800
1,000
2003 2004 2005 2006 2007 2008 2009 LTM
Hi-Gloss Standard LWC
610
Sales Volumes (MT 000’s)
Strategy is to Grow Specialty Grades and Optimize Directory and Newsprint Competitive Position
769
361
755
367
707
300
699
273
496
330
388
214
316
261
227
287
239
239
258
0
200
400
600
800
1,000
1,200
1,400
2003 2004 2005 2006 2007 2008 2009 LTM
BC Newsprint SF Newsprint Directory
1,007
Sales Volumes (MT 000’s)
724717
643628607 826
918972
1,1221,130
2008 newsprint includes approximately 9 months of Snowflake volume post-acquisitionSF = Snowflake
Uncoated Coated
765
775 736
628

24Jefferies 6th Annual Global Conference, August 11 2010
Pricing Momentum
Newsprint Directory Uncoated High-brights Uncoated Super-brights Uncoated Soft-cal-endered
Lightweight Coated 0
10
20
30
40
50
60
70
80
90
100
25
50
25
40
60 60
40
70
30 30
2010 Pricing Announcements for U.S. Paper Shipments(US$/tonne, US$/short ton)
April 2010 May 2010 June 2010 July 2010 September 2010
$/to
nne,
$/s
hort
ton
• We expect that pulp prices will soften for the balance of the year.

25Jefferies 6th Annual Global Conference, August 11 2010
2010 Key Priorities
Focus on cash flows and liquidity Free cash flow was negative $21.9 million and liquidity increased by $88.8 million; and Expended $2.8 million towards maintenance of business capital projects in Q2.
Match production to customer orders and optimize inventory levels Returned our pulp production to full capacity; and Newsprint curtailment comprised 32% of paper production capacity in Q2, or 9% of paper
production capacity reflecting the removal of Elk Falls.
Develop higher-value grades at all mills Developed Electrabrite Book and Electracote Brite at our B.C. mills and Electrabrite Lite, a
100% recycled and FSC certified grade, at our Snowflake mill.
Implement initiatives to reduce fixed costs The closure of facilities announced for September will generate immediate fixed cost
savings, with annualized savings of approximately $13 million expected for 2011. Continue to take legal and other actions in pursuit of fair and sustainable municipal
property taxes.
Reduce labour costs and develop more flexible and efficient work practices Continue to address legacy costs and other issues with the local unions and adjust manning
and work practices to reduce costs and improve competitiveness.
Improve the safety performance at all mills Continue to focus on workplace and work practice safety audits.