Embed Size (px)
Citation preview
Case study
example
“Footloose”

Duraflex is a German footwear company with annual men’s footwear sales of approximately 1.0 billion
Euro(€).
They have always relied on the boot market for the majority of their volume and in this market they
compete with three other major competitors.
Together, these four brands represent approximately 72% of the 5.0 billion € German men’s boot
market. The boots category includes four main sub-categories:
Work boots, casual boots, field and hunting boots, and winter boots. Work boots is the largest sub-
category and is geared to blue collar workers1 who purchase these boots primarily for on-the-job
purposes. Casual boots is the fastest growing sub- category, and is geared more towards white collar
workers2 and students who purchase these boots for week-end / casual wear and light work purposes.
The four key competitors in the market are Badger, Duraflex, Steeler, and Trekker.
Footloose
Introduction
2 Case study example | “Footloose”
1 Blue collar workers: wage earners who generally work in manual or industrial labour and often require special work clothes or protective clothing, which are
replaced approximately every 6 months
2 White collar workers: salaried employees who perform knowledge work, such as those in professional, managerial or administrative positions
© Deloitte & Touche (M.E.)
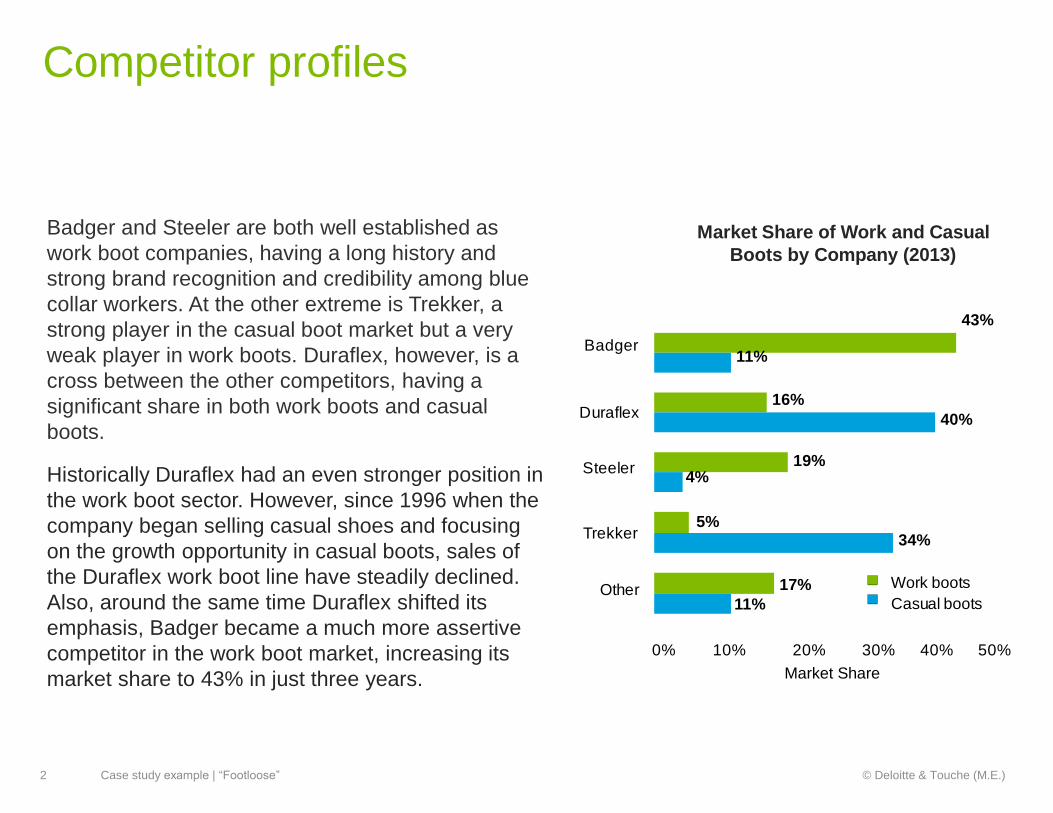
Badger and Steeler are both well established as
work boot companies, having a long history and
strong brand recognition and credibility among blue
collar workers. At the other extreme is Trekker, a
strong player in the casual boot market but a very
weak player in work boots. Duraflex, however, is a
cross between the other competitors, having a
significant share in both work boots and casual
boots.
Historically Duraflex had an even stronger position in
the work boot sector. However, since 1996 when the
company began selling casual shoes and focusing
on the growth opportunity in casual boots, sales of
the Duraflex work boot line have steadily declined.
Also, around the same time Duraflex shifted its
emphasis, Badger became a much more assertive
competitor in the work boot market, increasing its
market share to 43% in just three years.
Competitor profiles
Market Share of Work and Casual
Boots by Company (2013)
0% 10% 20% 30%
Market Share
40% 50%
Badger
Duraflex
Steeler
Trekker
Other
43%
11%
16%
40%
19%4%
5%34%
17% Work boots
11% Casual boots
2 Case study example | “Footloose” © Deloitte & Touche (M.E.)
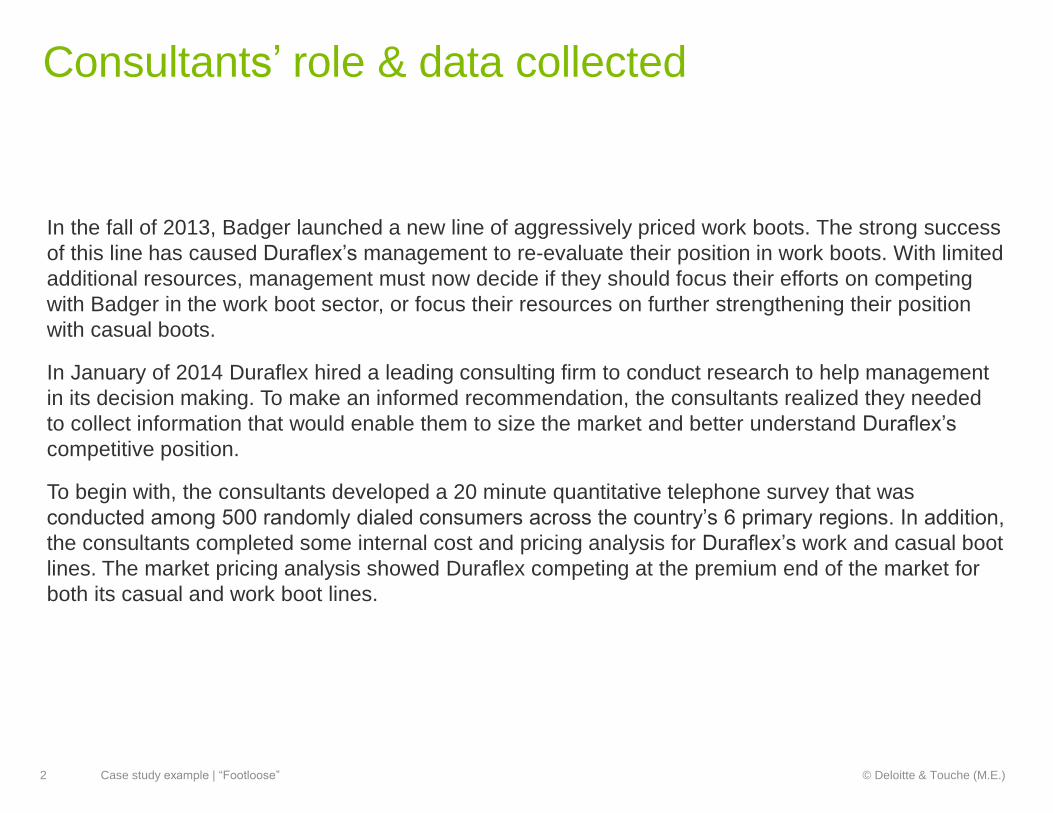
Consultants’ role & data collected
In the fall of 2013, Badger launched a new line of aggressively priced work boots. The strong success
of this line has caused Duraflex’s management to re-evaluate their position in work boots. With limited
additional resources, management must now decide if they should focus their efforts on competing
with Badger in the work boot sector, or focus their resources on further strengthening their position
with casual boots.
In January of 2014 Duraflex hired a leading consulting firm to conduct research to help management
in its decision making. To make an informed recommendation, the consultants realized they needed
to collect information that would enable them to size the market and better understand Duraflex’s
competitive position.
To begin with, the consultants developed a 20 minute quantitative telephone survey that was
conducted among 500 randomly dialed consumers across the country’s 6 primary regions. In addition,
the consultants completed some internal cost and pricing analysis for Duraflex’s work and casual boot
lines. The market pricing analysis showed Duraflex competing at the premium end of the market for
both its casual and work boot lines.
2 Case study example | “Footloose” © Deloitte & Touche (M.E.)
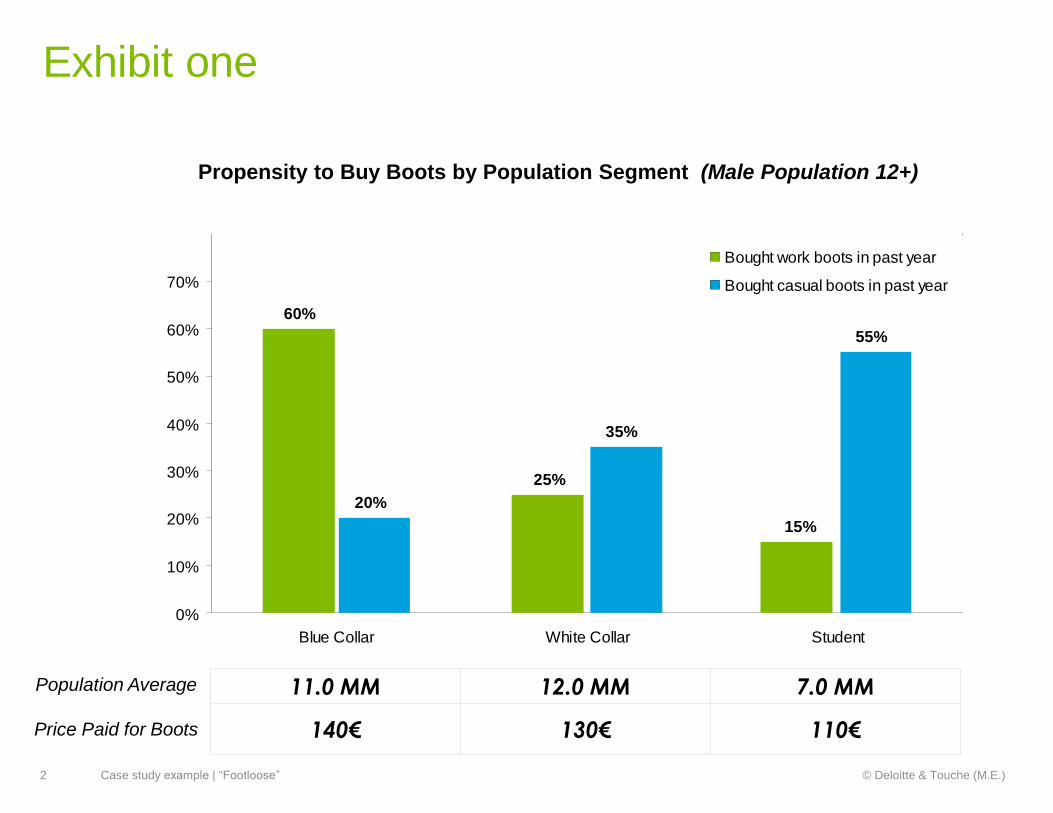
Exhibit one
Propensity to Buy Boots by Population Segment (Male Population 12+)
60%
25%
15%
20%
35%
55%
10%
0%
20%
30%
40%
50%
60%
70%
Blue Collar White Collar Student
Bought work boots in past year
Bought casual boots in past year
Population Average
Price Paid for Boots
11.0 MM 12.0 MM 7.0 MM
140€ 130€ 110€
2 Case study example | “Footloose” © Deloitte & Touche (M.E.)
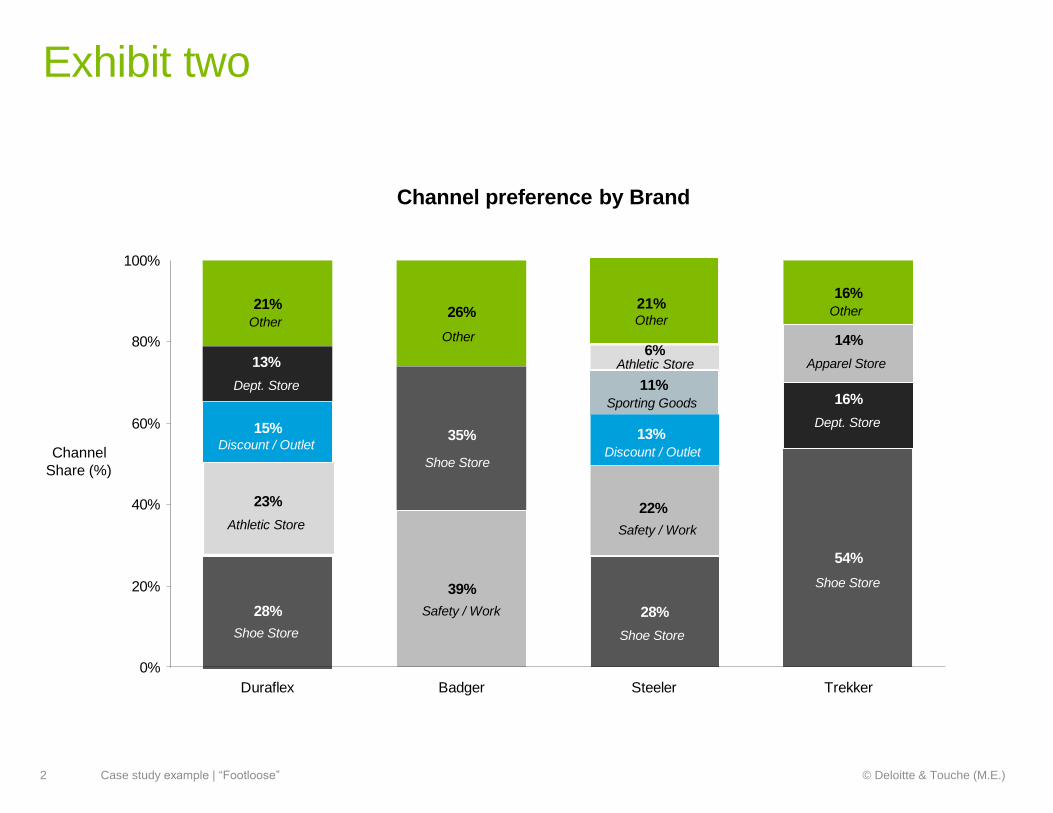
Exhibit two
28%
Shoe Store
21%
Other
16%
Other
39%
Safety / Work
54%
Shoe Store
28%
Shoe Store
23%
Athletic Store
35%
Shoe Store
22%
Safety / Work
16%
Dept. Store13%
Discount / Outlet
15%Discount / Outlet
26%
Other 14%
Apparel Store6%
Athletic Store
11%
Sporting Goods
13%
Dept. Store
0%
20%
40%
60%
80%
100%
Duraflex Badger Steeler Trekker
Channel preference by Brand
Channel
Share (%)
21%Other
2 Case study example | “Footloose” © Deloitte & Touche (M.E.)
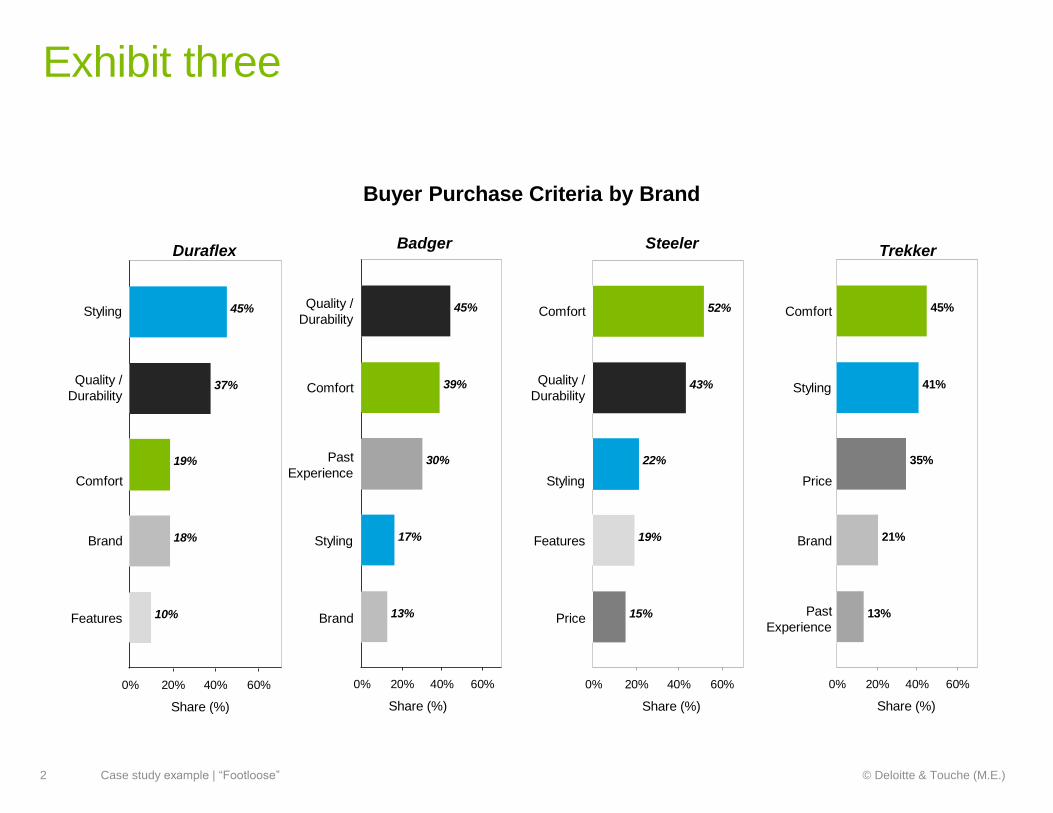
Exhibit three
0%
Buyer Purchase Criteria by Brand
Duraflex
20% 40% 60%
Share (%)
20% 40%
Share (%)
0% 60%
Styling
0% 20% 40% 60%
Share (%)
0% 20% 40%
Share (%)
60%
Past
Experience
Price
Comfort
Quality /
Durability
Comfort
Brand
Features
Comfort
Styling
Quality /
Durability
Comfort
Styling
Brand
Features
Styling
Quality /
Durability
Price
Brand
Past
Experience
Trekker
45%
41%
35%
21%
13%
45%
37%
19%
18%
10%
45%
39%
30%
17%
13%
52%
43%
22%
19%
15%
Badger Steeler
2 Case study example | “Footloose” © Deloitte & Touche (M.E.)
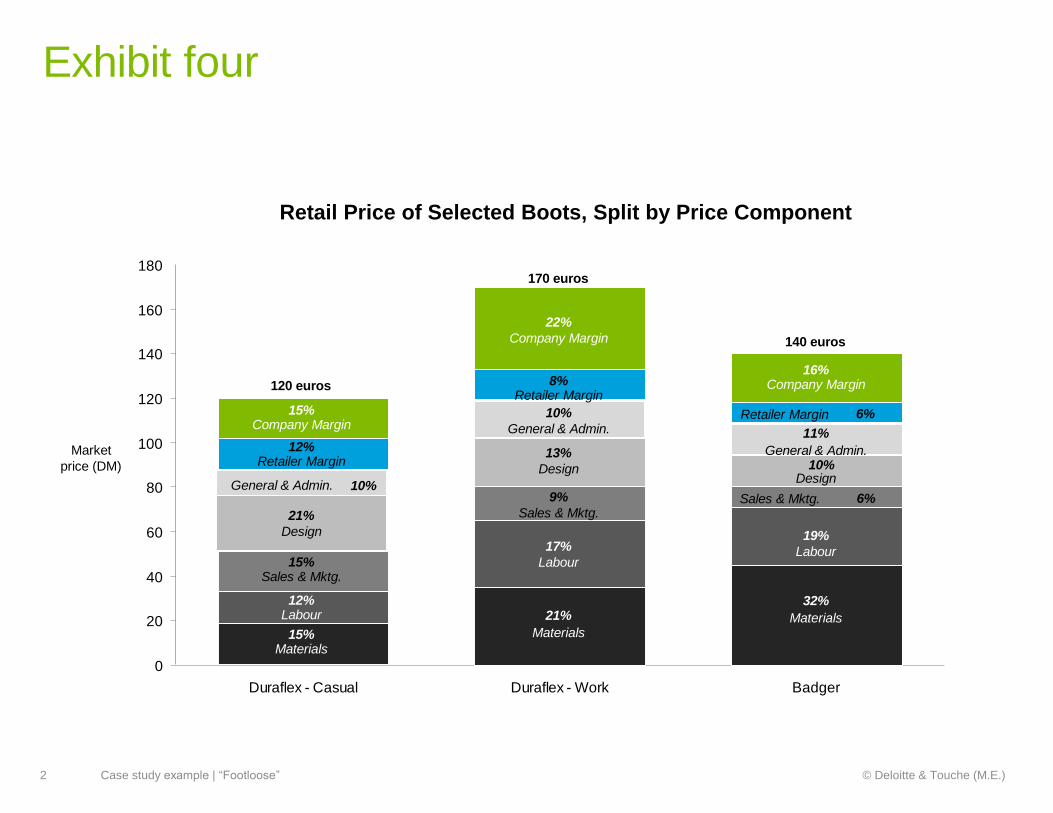
Exhibit four
0
20
40
60
80
100
120
140
160
180
Duraflex - Casual Duraflex - Work Badger
21%
Design
15%Materials
12%Labour 21%
Materials
17%
Labour15%Sales & Mktg.
9%
Sales & Mktg.
13%
Design
22%
Company Margin
15%Company Margin
General & Admin.
12%Retailer Margin
10%
General & Admin.
8%Retailer Margin
120 euros
170 euros
10%
32%
Materials
19%
Labour
Sales & Mktg.
10%Design
16%Company Margin
11%
General & Admin.
Retailer Margin
140 euros
6%
6%
Retail Price of Selected Boots, Split by Price Component
Market
price (DM)
2 Case study example | “Footloose” © Deloitte & Touche (M.E.)
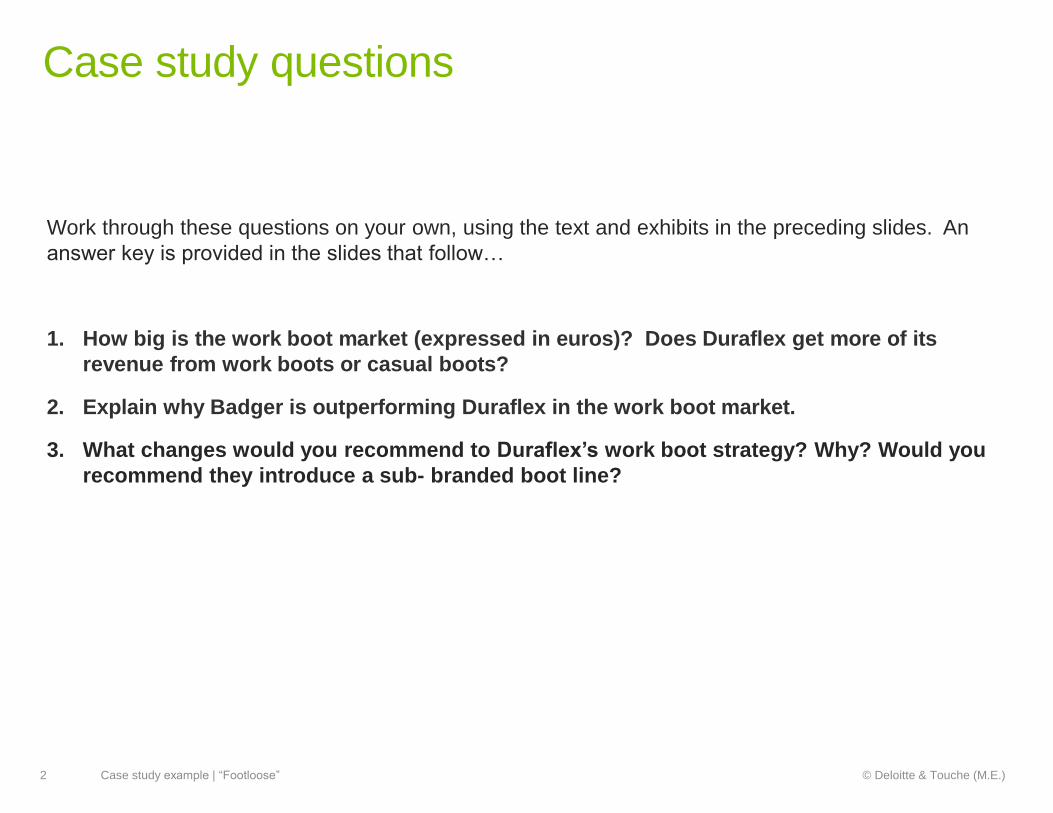
Case study questions
Work through these questions on your own, using the text and exhibits in the preceding slides. An
answer key is provided in the slides that follow…
1. How big is the work boot market (expressed in euros)? Does Duraflex get more of its
revenue from work boots or casual boots?
2. Explain why Badger is outperforming Duraflex in the work boot market.
3. What changes would you recommend to Duraflex’s work boot strategy? Why? Would you
recommend they introduce a sub- branded boot line?
2 Case study example | “Footloose” © Deloitte & Touche (M.E.)

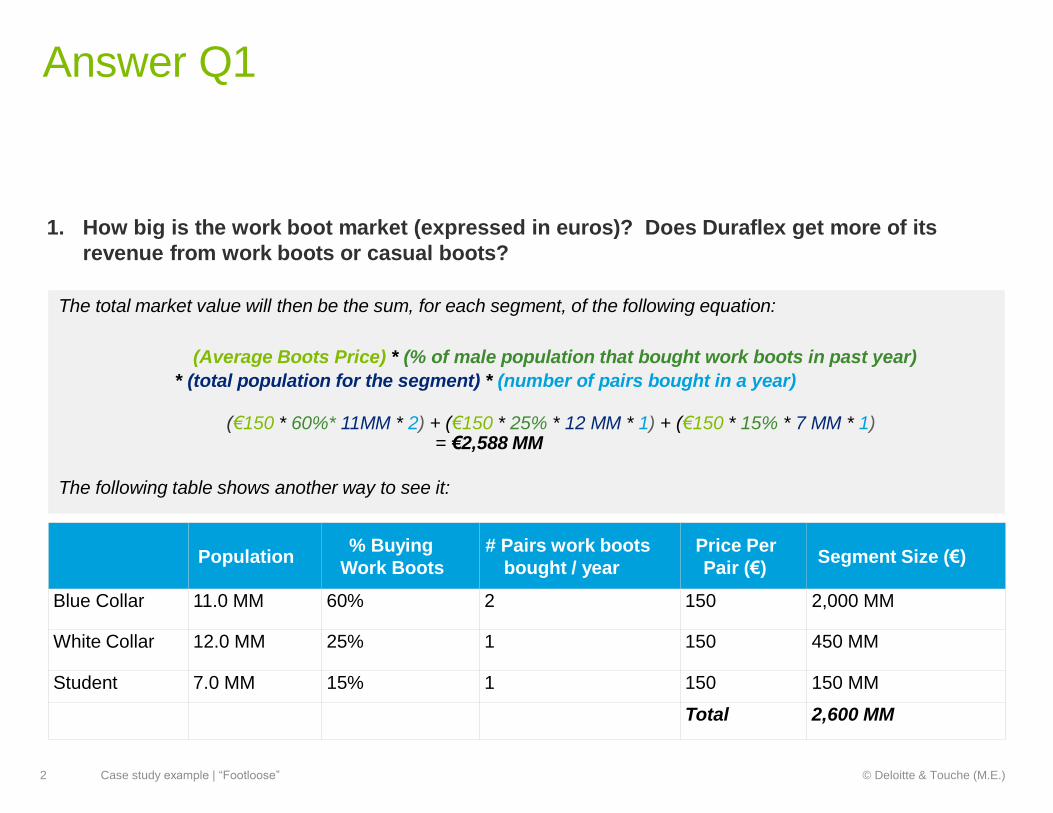
Answer Q1
1. How big is the work boot market (expressed in euros)? Does Duraflex get more of its
revenue from work boots or casual boots?
To find the size of the market, we can use the following equation:
(Average Boots Price) * (% of male population that bought work boots in past year)
* (total population for the segment) * (number of pairs bought in a year)
Exhibit One gives us the populations for each segment and the percentages that bought boots. We
therefore need to find the number of boots sold and the average price of each pair. For this question, the
candidate will need to make some assumptions.
1. Average number of boots purchased per user
• For work boots, we know that blue collar workers purchase an average of 2 pairs per year (from
Introduction, Footnote1)
• White collar workers and students who buy work boots probably use less rigorously and less frequently,
therefore probably only 1 pair per year
• For casual boots, we can make a reasonable assumption, knowing that casual boots are purchased primarily
for weekends and light wear (from text) so the average number of pairs should be no more than work boots
from Exhibit 1 (i.e. 1 pair per year)
2. Average price per pair of boots
• Work boots cost more (compare Blue Collar vs. Student) so the average price should be higher than 140 €
for all (150 € is reasonable); casual should be lower than student (100-110 € is reasonable).
2 Case study example | “Footloose” © Deloitte & Touche (M.E.)
Answer Q1
1. How big is the work boot market (expressed in euros)? Does Duraflex get more of its
revenue from work boots or casual boots?
The total market value will then be the sum, for each segment, of the following equation:
(Average Boots Price) * (% of male population that bought work boots in past year)
* (total population for the segment) * (number of pairs bought in a year)
(€150 * 60%* 11MM * 2) + (€150 * 25% * 12 MM * 1) + (€150 * 15% * 7 MM * 1)= €2,588 MM
The following table shows another way to see it:
Population% Buying
Work Boots
# Pairs work boots
bought / year
Price Per
Pair (€)Segment Size (€)
Blue Collar 11.0 MM 60% 2 150 2,000 MM
White Collar 12.0 MM 25% 1 150 450 MM
Student 7.0 MM 15% 1 150 150 MM
Total 2,600 MM
2 Case study example | “Footloose” © Deloitte & Touche (M.E.)
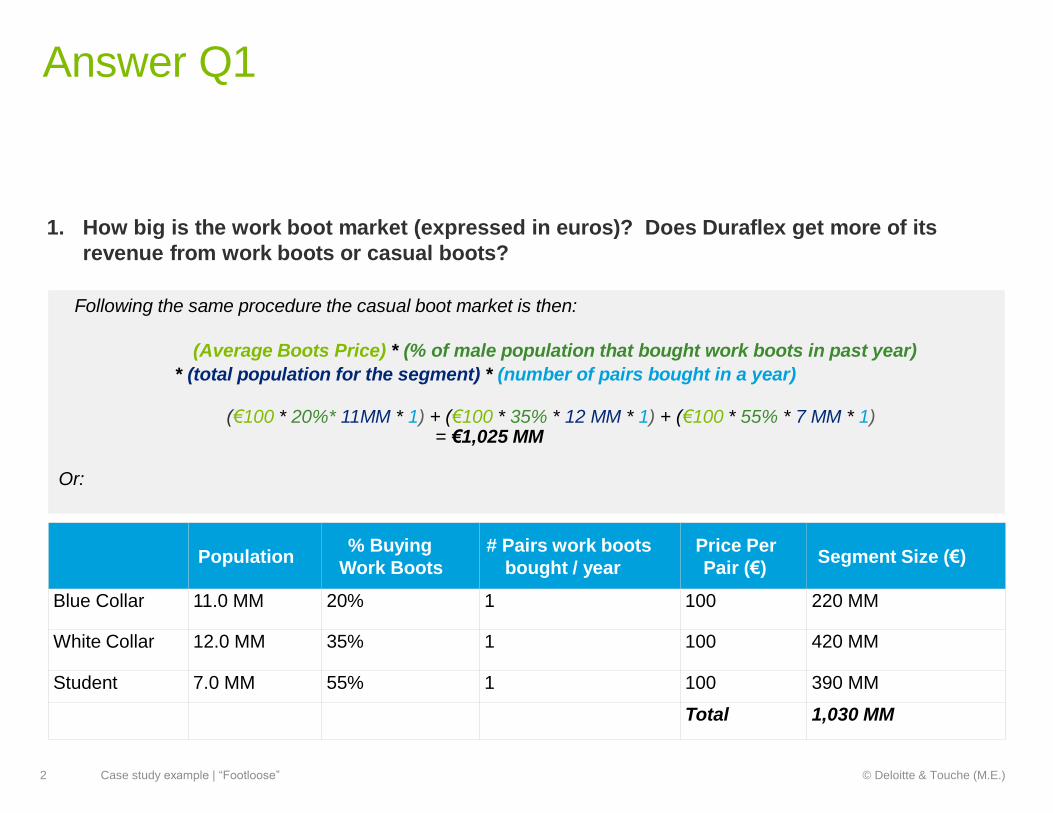
Answer Q1
1. How big is the work boot market (expressed in euros)? Does Duraflex get more of its
revenue from work boots or casual boots?
Following the same procedure the casual boot market is then:
(Average Boots Price) * (% of male population that bought work boots in past year)
* (total population for the segment) * (number of pairs bought in a year)
(€100 * 20%* 11MM * 1) + (€100 * 35% * 12 MM * 1) + (€100 * 55% * 7 MM * 1)= €1,025 MM
Or:
Population% Buying
Work Boots
# Pairs work boots
bought / year
Price Per
Pair (€)Segment Size (€)
Blue Collar 11.0 MM 20% 1 100 220 MM
White Collar 12.0 MM 35% 1 100 420 MM
Student 7.0 MM 55% 1 100 390 MM
Total 1,030 MM
2 Case study example | “Footloose” © Deloitte & Touche (M.E.)
Answer Q1
1. How big is the work boot market (expressed in euros)? Does Duraflex get more of its
revenue from work boots or casual boots?
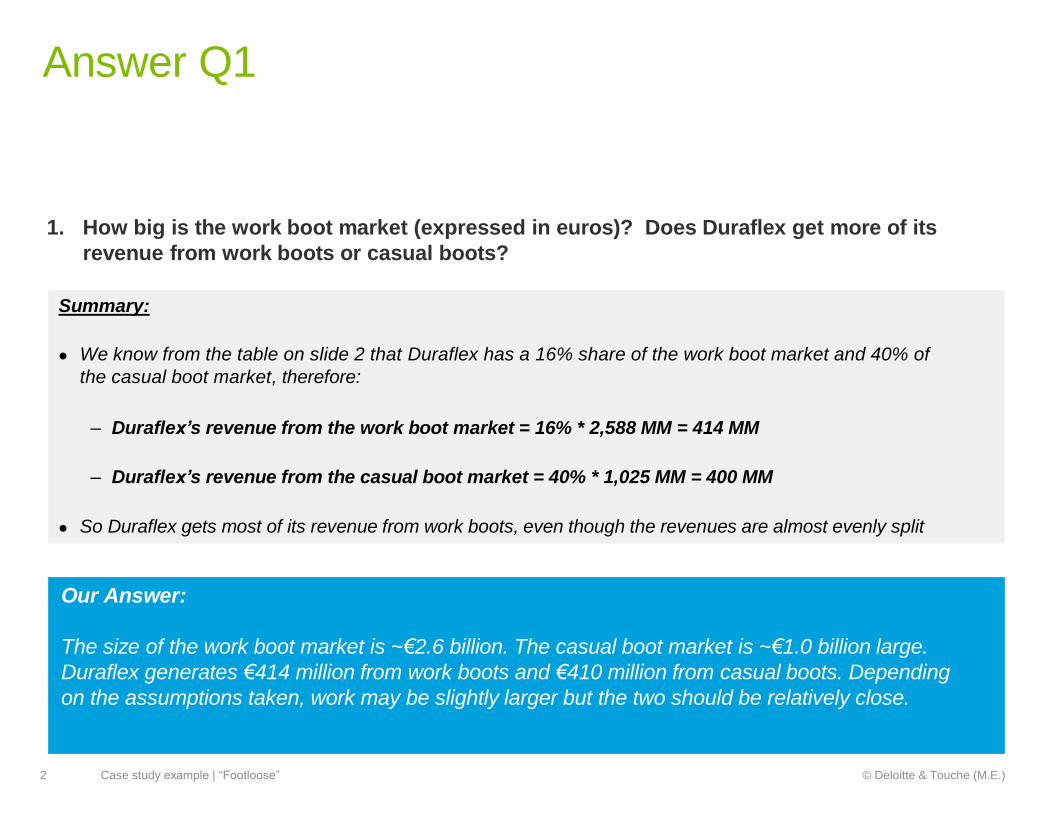
Summary:
We know from the table on slide 2 that Duraflex has a 16% share of the work boot market and 40% of
the casual boot market, therefore:
– Duraflex’s revenue from the work boot market = 16% * 2,588 MM = 414 MM
– Duraflex’s revenue from the casual boot market = 40% * 1,025 MM = 400 MM
So Duraflex gets most of its revenue from work boots, even though the revenues are almost evenly split
Our Answer:
The size of the work boot market is ~€2.6 billion. The casual boot market is ~€1.0 billion large.
Duraflex generates €414 million from work boots and €410 million from casual boots. Depending
on the assumptions taken, work may be slightly larger but the two should be relatively close.
2 Case study example | “Footloose” © Deloitte & Touche (M.E.)
Answer Q2
2. Explain why Badger is outperforming Duraflex in the work boot market.
Ways to approach the question
According to the data we have, and what we know as industry dynamics, the analysis can be split in
4 main areas that would demand further study:
Distribution
Buyer Purchase Criteria by Brand (BPCs)
Pricing
Cost analysis
Even if you have many good ideas to answer this question, you won’t be impressive without
STRUCTURE. You don’t need a formal framework, just be methodical and organised in your
approach – and summarise at the end!
2 Case study example | “Footloose” © Deloitte & Touche (M.E.)
Answer Q2
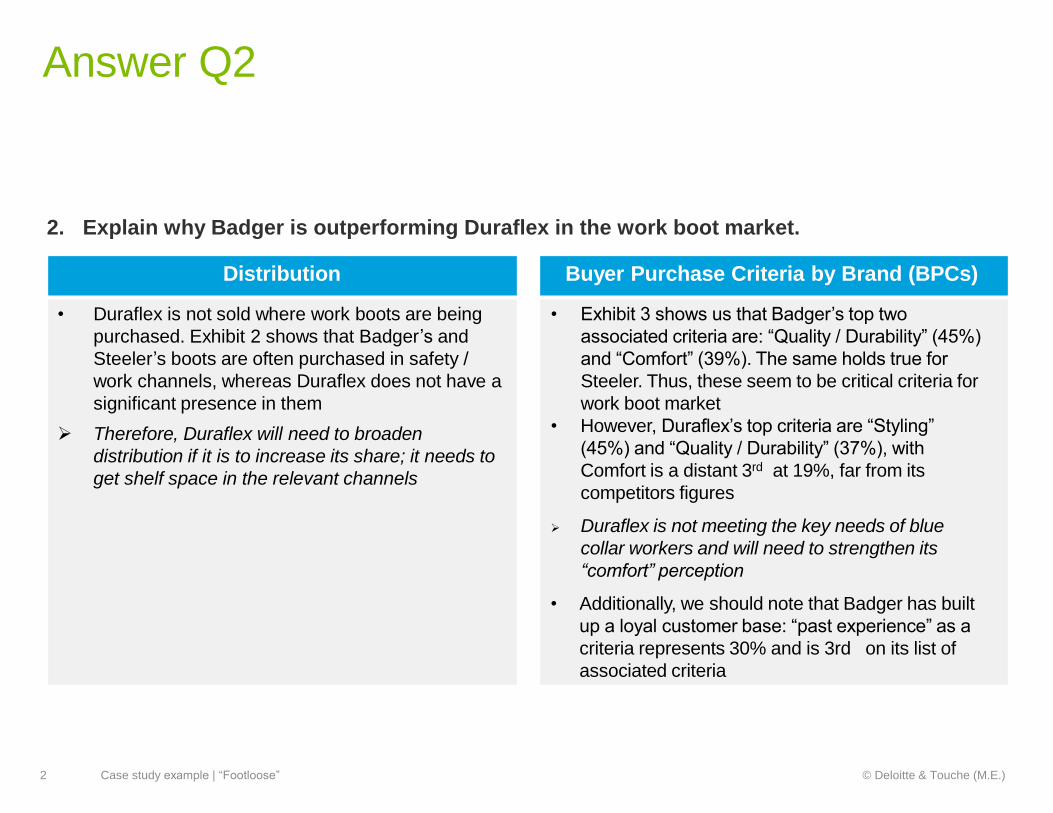
2. Explain why Badger is outperforming Duraflex in the work boot market.
Distribution Buyer Purchase Criteria by Brand (BPCs)
• Duraflex is not sold where work boots are being
purchased. Exhibit 2 shows that Badger’s and
Steeler’s boots are often purchased in safety /
work channels, whereas Duraflex does not have a
significant presence in them
Therefore, Duraflex will need to broaden
distribution if it is to increase its share; it needs to
get shelf space in the relevant channels
• Exhibit 3 shows us that Badger’s top two
associated criteria are: “Quality / Durability” (45%)
and “Comfort” (39%). The same holds true for
Steeler. Thus, these seem to be critical criteria for
work boot market
• However, Duraflex’s top criteria are “Styling”
(45%) and “Quality / Durability” (37%), with
Comfort is a distant 3rd at 19%, far from its
competitors figures
Duraflex is not meeting the key needs of blue
collar workers and will need to strengthen its
“comfort” perception
• Additionally, we should note that Badger has built
up a loyal customer base: “past experience” as a
criteria represents 30% and is 3rd on its list of
associated criteria
2 Case study example | “Footloose” © Deloitte & Touche (M.E.)
Answer Q2
2. Explain why Badger is outperforming Duraflex in the work boot market.
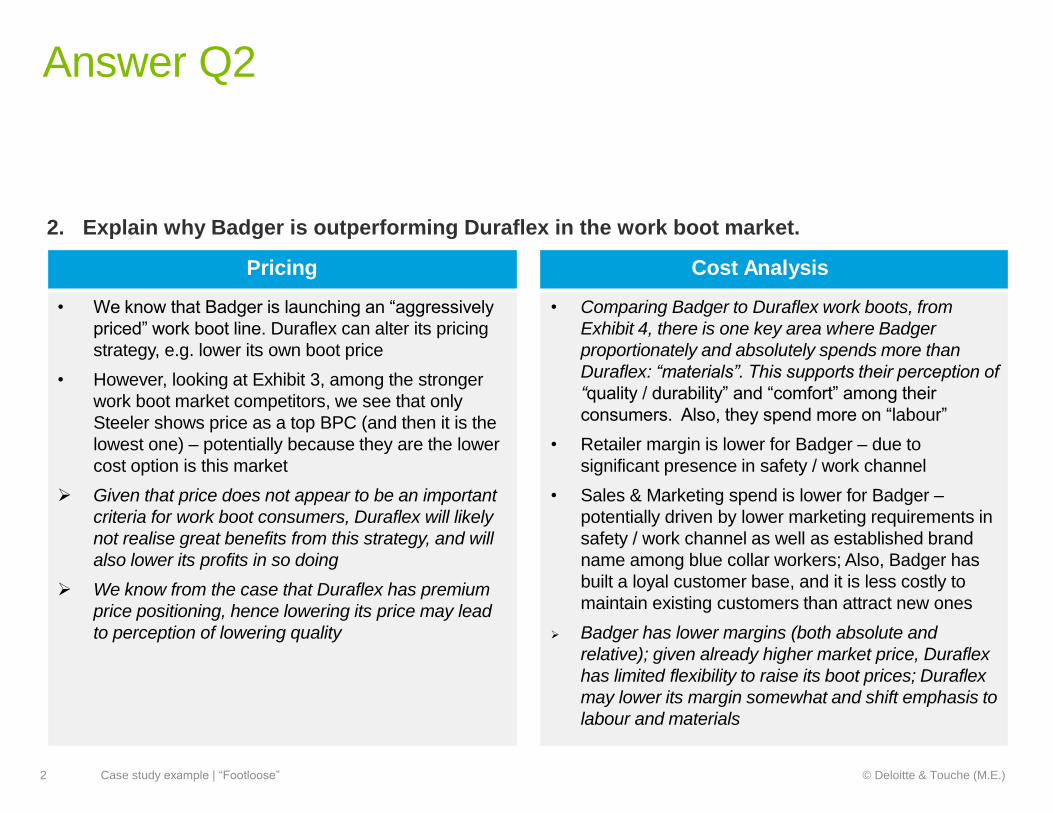
Pricing Cost Analysis
• We know that Badger is launching an “aggressively
priced” work boot line. Duraflex can alter its pricing
strategy, e.g. lower its own boot price
• However, looking at Exhibit 3, among the stronger
work boot market competitors, we see that only
Steeler shows price as a top BPC (and then it is the
lowest one) – potentially because they are the lower
cost option is this market
Given that price does not appear to be an important
criteria for work boot consumers, Duraflex will likely
not realise great benefits from this strategy, and will
also lower its profits in so doing
We know from the case that Duraflex has premium
price positioning, hence lowering its price may lead
to perception of lowering quality
• Comparing Badger to Duraflex work boots, from
Exhibit 4, there is one key area where Badger
proportionately and absolutely spends more than
Duraflex: “materials”. This supports their perception of
“quality / durability” and “comfort” among their
consumers. Also, they spend more on “labour”
• Retailer margin is lower for Badger – due to
significant presence in safety / work channel
• Sales & Marketing spend is lower for Badger –
potentially driven by lower marketing requirements in
safety / work channel as well as established brand
name among blue collar workers; Also, Badger has
built a loyal customer base, and it is less costly to
maintain existing customers than attract new ones
Badger has lower margins (both absolute and
relative); given already higher market price, Duraflex
has limited flexibility to raise its boot prices; Duraflex
may lower its margin somewhat and shift emphasis to
labour and materials
2 Case study example | “Footloose” © Deloitte & Touche (M.E.)

Answer Q2
2. Explain why Badger is outperforming Duraflex in the work boot market.
Summary
• Duraflex is not sold where work boots are being purchased
• Duraflex is not meeting the key needs of blue collar workers, as it is weaker than
competitors on the critical ‘Comfort’ dimension
• Badger prices its boots more competitively, which is likely to be particularly appealing
to the large work boot market; this has helped develop a large and loyal consumer
base
• Badger has lower retailer margins (both absolute and relative) and spends less on
Sales & Marketing
2 Case study example | “Footloose” © Deloitte & Touche (M.E.)
Answer Q3
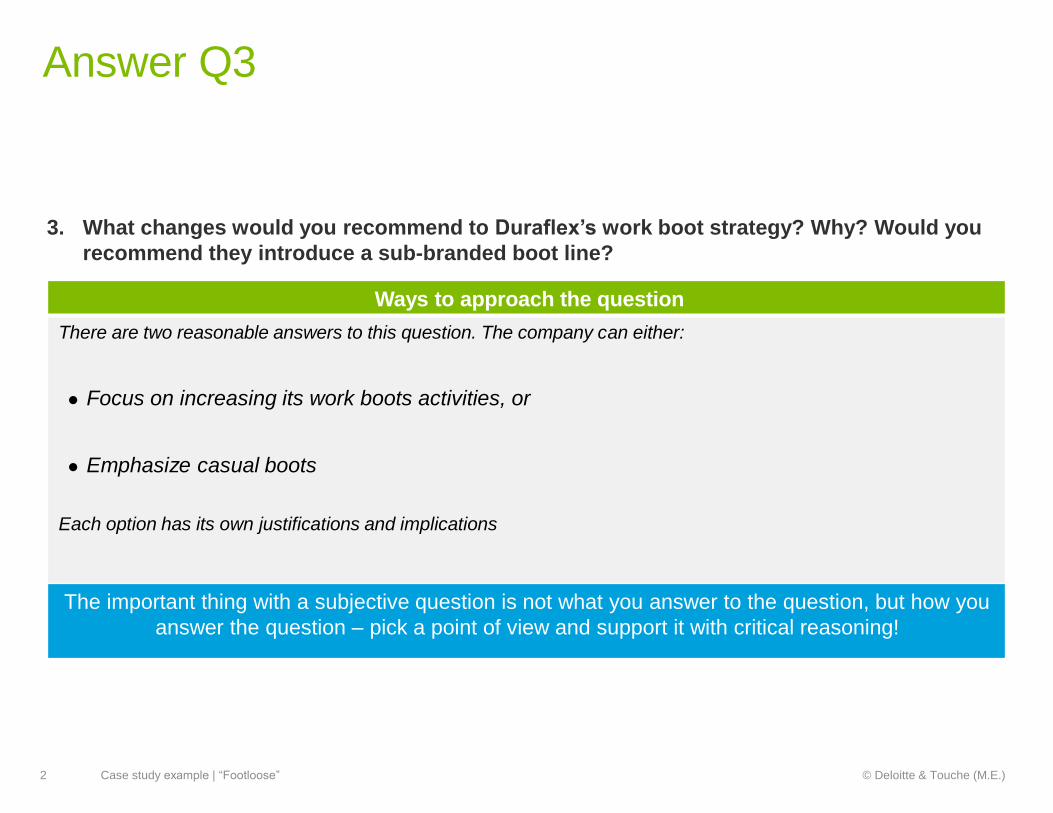
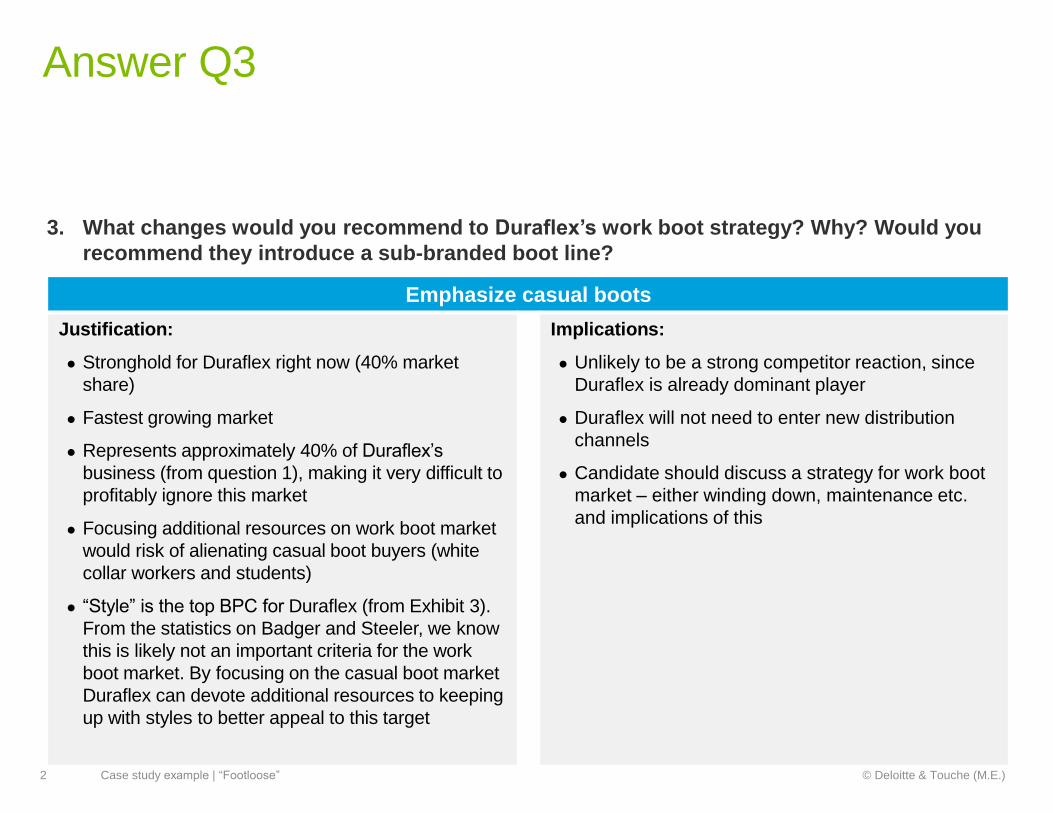
3. What changes would you recommend to Duraflex’s work boot strategy? Why? Would you
recommend they introduce a sub-branded boot line?
Ways to approach the question
There are two reasonable answers to this question. The company can either:
Focus on increasing its work boots activities, or
Emphasize casual boots
Each option has its own justifications and implications
The important thing with a subjective question is not what you answer to the question, but how you
answer the question – pick a point of view and support it with critical reasoning!
2 Case study example | “Footloose” © Deloitte & Touche (M.E.)

Answer Q3
3. What changes would you recommend to Duraflex’s work boot strategy? Why? Would you
recommend they introduce a sub-branded boot line?
Increased work boot market focus
Justification:
Represents approximately 40% of Duraflex’s
business (from question 1), making it very difficult
to profitably ignore this market
While Duraflex does have greater market share in
the casual boot market, we know from information
given in the case that the casual boot market
is smaller in size than the work boot market, which
may indicate less opportunity for share growth;
also, we derive lower margins (15% vs. 21%) from
casual boots (from Exhibit 4)
Given that Badger is introducing a new work line,
they may see new growth potential in the market
which Duraflex may also want to capitalise on
Building a stronger image among blue collar
workers may entice them to try other Duraflex
footwear products
Implications:
Enter safety / work channel – we may be faced
with pressure from Badger exerting influence on
retailers in this channel
Build “comfort” and “quality / durability”
perception among blue collar workers
Increase proportion of costs allocated to
materials and labour – potentially reducing
company margin
There may be unique / niche positionings for
Duraflex (suggestions should be well thought out)
Introduce sub-brand or increase promotion of brand
with a focus on blue collar workers: may include on-
site promotions, advertising in industry publications,
or advertising in magazines / on television during
programmes with a higher blue collar readership /
viewership
2 Case study example | “Footloose” © Deloitte & Touche (M.E.)
Answer Q3
3. What changes would you recommend to Duraflex’s work boot strategy? Why? Would you
recommend they introduce a sub-branded boot line?
Emphasize casual boots
Justification:
Stronghold for Duraflex right now (40% market
share)
Fastest growing market
Represents approximately 40% of Duraflex’s
business (from question 1), making it very difficult to
profitably ignore this market
Focusing additional resources on work boot market
would risk of alienating casual boot buyers (white
collar workers and students)
“Style” is the top BPC for Duraflex (from Exhibit 3).
From the statistics on Badger and Steeler, we know
this is likely not an important criteria for the work
boot market. By focusing on the casual boot market
Duraflex can devote additional resources to keeping
up with styles to better appeal to this target
Implications:
Unlikely to be a strong competitor reaction, since
Duraflex is already dominant player
Duraflex will not need to enter new distribution
channels
Candidate should discuss a strategy for work boot
market – either winding down, maintenance etc.
and implications of this
2 Case study example | “Footloose” © Deloitte & Touche (M.E.)

This communication contains general information only, and none of Deloitte Touche Tohmatsu Limited, its member firms, or their related entities (collectively,
the “Deloitte network”) is, by means of this communication, rendering professional advice or services. No entity in the Deloitte network shall be responsible for
any loss whatsoever sustained by any person who relies on this communication.
About Deloitte
Deloitte refers to one or more of Deloitte Touche Tohmatsu Limited, a UK private company limited by guarantee (“DTTL”), its network of member firms, and
their related entities. DTTL and each of its member firms are legally separate and independent entities. DTTL (also referred to as “Deloitte Global”) does not
provide services to clients. Please see www.deloitte.com/about for a more detailed description of DTTL and its member firms.
Deloitte provides audit, consulting, financial advisory, risk management, tax and related services to public and private clients spanning multiple industries.
With a globally connected network of member firms in more than 150 countries and territories, Deloitte brings world-class capabilities and high-quality service
to clients, delivering the insights they need to address their most complex business challenges. Deloitte’s more than 220,000 professionals are committed to
making an impact that matters.
About Deloitte & Touche (M.E.)
Deloitte & Touche (M.E.) is a member firm of Deloitte Touche Tohmatsu Limited (DTTL) and is the first Arab professional services firm established in the
Middle East region with uninterrupted presence since 1926.
Deloitte is among the region’s leading professional services firms, providing audit, tax, consulting, and financial advisory services through 26 offices in 15
countries with more than 3,000 partners, directors and staff. It is a Tier 1 Tax advisor in the GCC region since 2010 (according to the International Tax Review
World Tax Rankings). It has received numerous awards in the last few years which include Best Employer in the Middle East, best consulting firm, the Middle
East Training & Development Excellence Award by the Institute of Chartered Accountants in England and Wales (ICAEW), as well as the best CSR integrated
organization by CSR Levant.
About Monitor Deloitte
Monitor Deloitte is the strategy practice of Deloitte Consulting. From strategy through execution, Monitor Deloitte in the Middle East helps deliver improved
performance by increasing growth and de-risking strategic choices through strategy professionals who employ cutting-edge approaches embedded with deep
industry expertise, working with leaders to resolve critical choices, and drive enterprise value.
© 2015 Deloitte & Touche (M.E.). All rights reserved.