Embed Size (px)
Citation preview
Case studies to characterize the seismic demands for high-rise buildings
Acknowledgements: Graham Powell, CSI, John Wallace, nees@berkeley laboratory, Brian Morgen, Nico Luco, Jack Baker and Jennie Watson-Lamprey

What’s different about these buildings?
They are tall. Has many higher modes. Long mode periods (~10 sec). High-performance materials and
innovative framing systems that does not satisfy code prescriptive limits.
Requires special seismic review, including site specific PSHA.
after MKA

Objectives Develop realistic computer models for actual tall
buildings being constructed or already constructed.
Conduct nonlinear dynamic analyses on 100s of ground motions selected from various M, R, .. bins.
Characterize key building responses. Develop statistical models for these critical
building responses. Develop guidelines for seismic design of high-
rise buildings.

Prototype models
22-story concrete moment frame.
30-story space concrete moment frame with out-trigger trusses.
62-story concrete core shear wall with out-trigger trusses.
48-story concrete core shear wall.

48-story concrete core shear wall – Perform3D
concrete fiber shear wall with coupling beams

Nonlinear dynamic analyses 3D bi-directional shaking. Ground motion are selected based on:
Database: PEER NGA database. Magnitude (Mw): > 6.5. Distance (R): 10 km (0 - 20 km). Useable periods: > 8 sec. Scaling factors: 1, 2 and 4. Synthetic ground motions: not yet implemented.
Characterize building responses. Such as inter-story drift, floor acceleration, story
shear, story moment, plastic hinge rotation and demand in the gravity columns.

Preliminary results – M7, 10 km

Preliminary results – M7, 10 km

Variation in the structural responses Fl
oor
num
ber
[-]
Maximum story moment X [N-m]

Variation in the structural responses Fl
oor
num
ber
[-]
Maximum story drifts X [m]
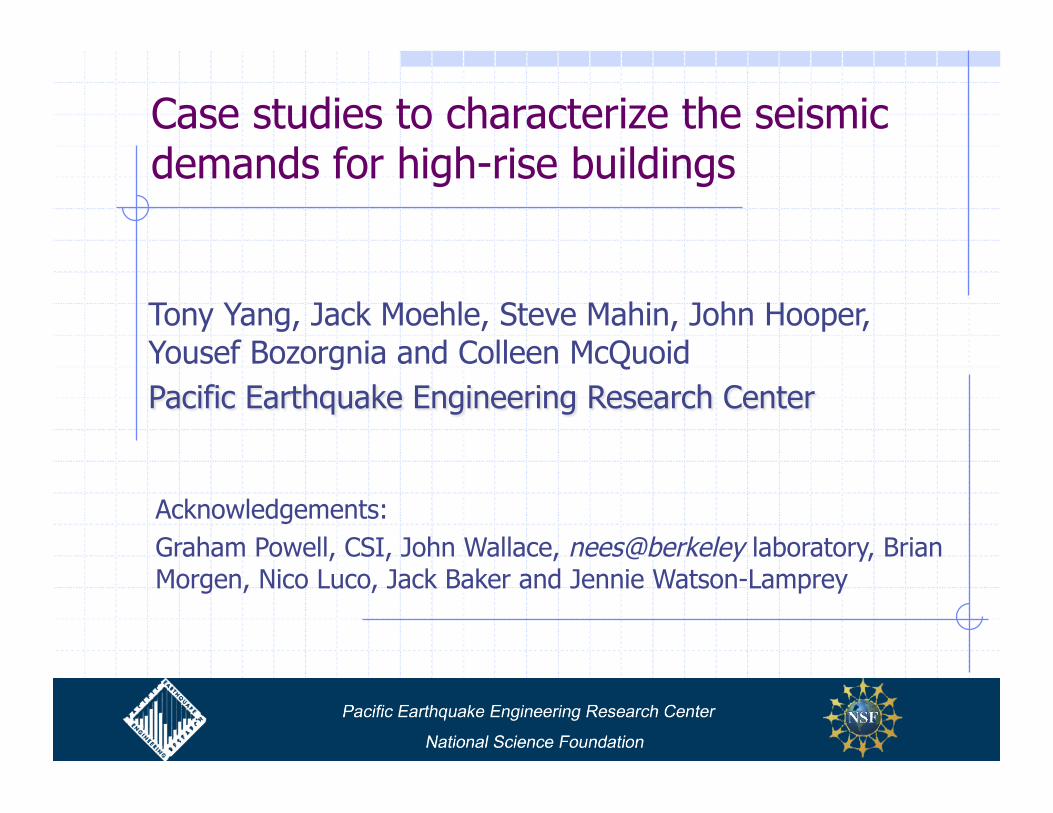
Effects of the scaling factor Fl
oor
num
ber
[-]
Mean of maximum story drifts X [m] 0 0.2 0.4 0.6 0.8 1 1.2 1.4 1.6 1.8
B5
L1
L6
L11
L17
L22
L27
L32
L37
L42
SF = 1 SF = 2 SF = 4

Effects of the scaling factor Fl
oor
num
ber
[-]
Mean of maximum story moment X [N-m]
Stor
y fo
rce
[N]
Story deformation [m]
SF = 1 SF = 2 SF = 4

Roof drift ratio vs. spectra acceleration M
axim
um r
oof
drift
X [
%]
SaX(T1) [g] SaX(T2) [g] Max
imum
roo
f dr
ift X
[%
]

Base shear vs. spectra acceleration M
axim
um b
ase
shea
r X
[kip
s]
SaX(T1) [g] SaX(T2) [g] Max
imum
bas
e sh
ear
X [k
ips]

Probabilistic model of EDP responses How can we use these findings towards
performance-based design for high-rise buildings? What is the annual rate (probability) that the roof drift
ratio will exceed 1%? What is the median roof drift ratio? If I am designing
the structure for a life time of 75 years?
PEER PBEE methodology. (EDP>$edp) = ∫ P(EDP>$edp|Sa)x|d(Sa)/dSa| dSa

Probabilistic model of EDP responses
Log(SaX(T1))
Log(
Max
imum
roo
f dr
ift r
atio
X)
EDP = f(Sa)
P(EDP|Saj)
P(EDP|Sai)
P(EDP|Sak)
P(EDP|Sal) M
axim
um r
oof
drift
rat
io X
SaX(T1)

Uniform hazard spectra S a [g
]
Period [sec]
5% damping
0 1 2 3 4 0
0.5
1
1.25 RT = 72 years RT = 475 years RT = 975 years
Sa [g]
=
1/R
T
0 0.5 1 1.5 2 10 -6
10 -5
10 -4
10 -3
10 -2
10 -1
T = 4 sec
5% damping
5
(Sa)
(EDP>$edp) = ∫ P(EDP|Sa)x|d(Sa)/dSa| dSa

Probabilistic model of EDP responses
Maximum roof drift ratio [%]
Annu
al r
ate
of e
xcee
danc
e (
)
1% roof drift ratio ~= 4.2 ft
Annual rate of exceedance ~= 1e-4
P(EDP>$edp) = 1-(1-)yr

Probabilistic model of EDP responses
$edp - Maximum roof drift ratio [%]
P(ED
P>$e
dp)
– ro
of d
rift
ratio

Building code GM scaling procedure Sa
[g]
Periods [sec]

Building code GM scaling procedure

Building code GM scaling procedure We have selected 24 pairs of GMs that has
reasonable spectra shape (compare to the code design spectra).
Separate the ground motions into 2 bins that represent 2 range of magnitudes. Bin 1: 6.5 Mw – 7.25 Mw. (12 pairs of GMs) Bin 2: > 7.25 Mw. (12 pairs of GMs)
Following the code procedure, there is a total of 792 distinct combinations to select 7 pairs of ground motions (out of 12 pairs).

Building code GM scaling procedure Sa
[g]
Periods [sec]

Building code GM scaling procedure P
(edp
<=
$ed
p)
Base shear X [kips] – Bin 1

Summary Tall buildings has many higher mode effects. The structural responses are very sensitive to the
ground motions. There is a large variation in the structural
responses, if the ground motions are selected from a M, R, ect bin.
Correlation between EDP and spectral demand Roof drift ratio correlated more to Sa(T1) Base shear correlated more to Sa(T2).

Summary (cont.) Shown a simple probabilistic model to estimate
EDP responses. More robust probabilistic models will be presented next time.
We are currently studying: Effect of gravity framing systems. Effect of spectrum matched motions. Effect of selecting GM based on CMS. Effect of synthetic ground motions.

Questions and suggestions? Thank you for your attention!
Contact information:
Tony Yang: [email protected]
Jack Moehle: [email protected]
Yousef Bozorgnia: [email protected]