Embed Size (px)
Citation preview

2001 PEER Annual Meeting
PPEEEERR Seismic Demands and their
Dependence on GroundMotions
Helmut Krawinkler
Stanford University

2001 PEER Annual Meeting
What are Seismic Demands?
� Damage Measures� Roof and story drifts� Local deformations (e.g., plastic hinge rotation)� Floor acceleration and velocity� Cost-related damage indices� Cumulative damage measures (e.g., energy)
� Design Parameters� Story shear forces and overturning moments� Relative strength of fuses (strong column concept)

2001 PEER Annual Meeting
Purpose of Demand Evaluation
� Understanding of Behavior� Rigorous Probabilistic Performance
Assessment in the Presence of Uncertainties� Approximate Performance Assessment� Conceptual Design (Strength and Stiffness
Requirements)

2001 PEER Annual Meeting
PPEEEERR Probabilistic Performance
Assessment in the Presenceof Uncertainties

2001 PEER Annual Meeting
Incremental Dynamic Analysis (IDA)
� Spectral Acceleration Hazard
� Incremental Dynamic Analysis Curves
� Probability Distribution of Drift given Sa
� System Drift Capacity Data Points
� Probability Distribution of CapacityCornell/Jalayer
Maximum Interstory drift Angle,qmax HSa(sa) = Pr [Sa > sa ]
sa1
sa2
Sa a
t T
1
Median Capacity
δ C HSa(sa1)
δ D
qmax |Sa2
qmax = a Sa b

2001 PEER Annual Meeting
Accuracy of IDA Depends on
� Description of return period dependent hazard� Intensity measure
� Frequency content
� Duration
� Description of structural properties, includingdeterioration
� Analytical modeling and analysis tool
� Method of prediction (analysis method)

2001 PEER Annual Meeting
PPEEEERR
Description of return perioddependent hazard

2001 PEER Annual Meeting
Frequency Effects, T1 = 0.5 sec.
ELASTIC STRENGTH DEMAND SPECTRAScaled Records (T=0.5 s), LMSR, ξ = 0.05
0
0.5
1
1.5
2
0 1 2 3 4 5
T (s)
S a (
g)
Median84%NEHRP 94 Soil D

2001 PEER Annual Meeting
Frequency Effects, T1 = 2.0 sec.
ELASTIC STRENGTH DEMAND SPECTRAScaled Records (T=2.0 s), LMSR, ξ = 0.05
0
0.5
1
1.5
2
0 1 2 3 4 5
T (s)
S a (
g)
Median84%NEHRP 94 Soil D
2001 PEER Annual Meeting
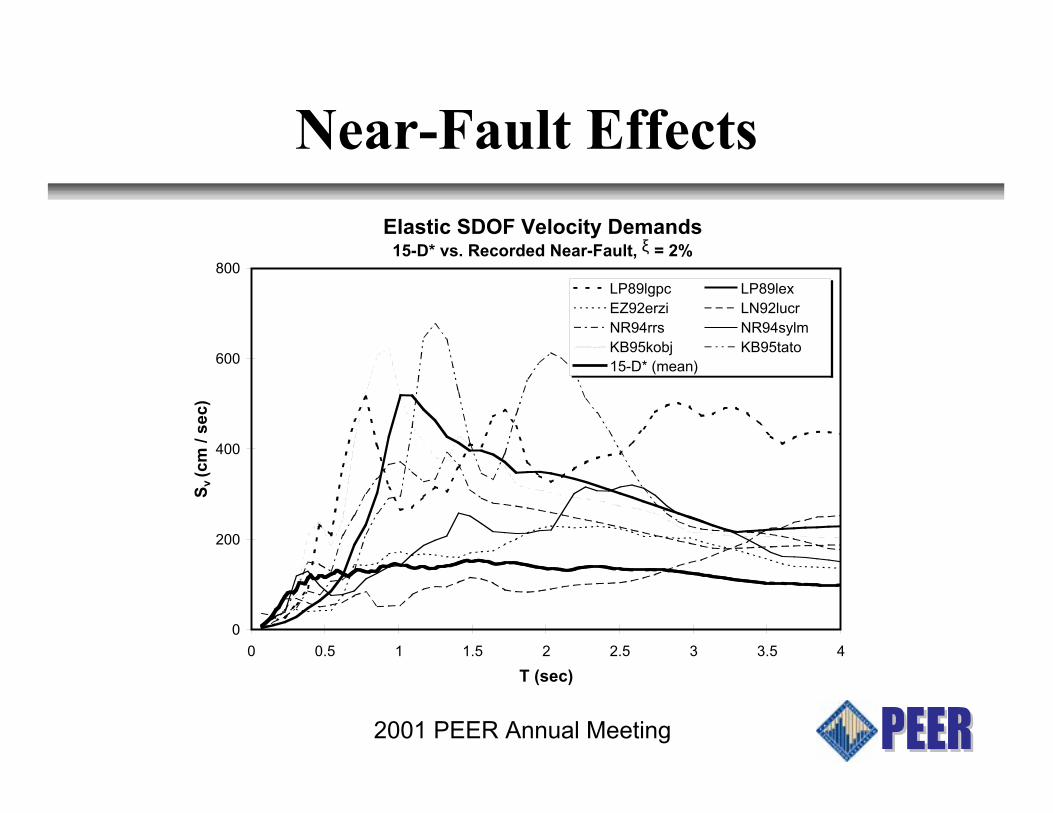
Near-Fault Effects
Elastic SDOF Velocity Demands15-D* vs. Recorded Near-Fault, ξ = 2%
0
200
400
600
800
0 0.5 1 1.5 2 2.5 3 3.5 4
T (sec)
Sv (c
m /
sec)
LP89lgpc LP89lexEZ92erzi LN92lucrNR94rrs NR94sylmKB95kobj KB95tato15-D* (mean)

2001 PEER Annual Meeting
NF Response of Strong Structures
Story Ductility Demands15-D* vs. Recorded Near-Fault, T = 2.0 sec, γ = 0.40
0
0.2
0.4
0.6
0.8
1
0 1 2 3 4 5
Story Ductility Ratio, µi = δmax,i / δy,i
Rel
ativ
e H
eig
ht
LP89lgpcLP89lexEZ92erziLN92lucrNR94rrsNR94sylmKB95kobjKB95tato15-D* (mean)

2001 PEER Annual Meeting
Story Ductility Demands15-D* vs. Recorded Near-Fault, T = 2.0 sec, γ = 0.15
0
0.2
0.4
0.6
0.8
1
0 2 4 6 8 10 12
Story Ductility Ratio, µi = δmax,i / δy,i
Rel
ativ
e H
eig
ht
LP89lgpcLP89lexEZ92erziLN92lucrNR94rrsNR94sylmKB95kobjKB95tato15-D* (mean)
NF Response of Weak Structures

2001 PEER Annual Meeting
Improvement of Intensity Measure
Figure 5 � IDA plot of IDR versus (left) Sa(T1) and (right) SaRsaα
IDRMAX
0.00 0.02 0.04 0.06 0.08 0.10 0.12 0.14 0.16 0.18 0.20
SaR
Saα
0
1
2
3
α = 0.9TF = 1.8T1
IDRMAX
0.00 0.02 0.04 0.06 0.08 0.10 0.12 0.14 0.16 0.18 0.20
Sa (T
1,5%)
0
1
2
3
4
5
6IV79-A6 LP89-LG LP89-LX EZ92-EZ NR94-NH NR94-RS NR94-SY KB95-JM
Tp/T1 > 1
Tp/T1 < 1
(a) Intensity Measure = Sa(T1) (b) Intensity Measure = SaRsaα
Cordova/Deierlein

2001 PEER Annual Meeting
PPEEEERR Description of structural
properties, includingdeterioration

2001 PEER Annual Meeting
Basic Modes of Deterioration
Normalized Deformation (%)
Nor
mal
ized
Loa
d (%
)
1.0
1.0 5.0
Normalized Deformation (%)
Nor
mal
ized
Loa
d (%
)
1.0
1.0 5.0
Normalized Deformation (%)
Nor
mal
ized
Loa
d (%
)
1.0
1.0 5.0
Normalized Deformation (%)
Nor
mal
ized
Loa
d (%
)
1.0
1.0 5.0
No deterioration Strength deterioration
Strength det. with capping Strength det. with capping & stiff. det

2001 PEER Annual Meeting
Det. Modes for Pinching System
Normalized Deformation (%)
No
rmal
ized
Lo
ad (
%)
1.0
1.0 5.0
Normalized Deformation (%)
No
rmal
ized
Lo
ad (
%)
1.0
1.0 5.0
Normalized Deformation (%)
No
rmal
ized
Lo
ad (
%)
1.0
1.0 5.0
Normalized Deformation (%)
No
rmal
ized
Lo
ad (
%)
1.0
1.0 5.0
No deterioration Strength deterioration
Strength det. with capping Accelerated stiffness det. with capping

2001 PEER Annual Meeting
Example of Deterioration Model
A single deterioration parameter:
c
i
jjt
ii
EE
E
−=
∑=1
β
in which βi = parameter defining the deterioration in excursion i
Ei
= hysteretic energy dissipated in excursion
iEt
= hysteretic energy dissipation capacity = γFyδyEj∑
= ηψστερετιχ ενε ργψ δισσιπατεδ ιν αλλ πρεϖιουσ εξχυρσιονσ
c = exponent defining the rate of deterioration

2001 PEER Annual Meeting
Calibration of Deterioration Model
Pinching Hysteretic Model, Halil-Column 1,P-∆=0, α=0.10,αcap=-0.24,κ=0.5,γk=100,γs=50,γa=30,γc=40,δc=2.3δ
y
-40000
-30000
-20000
-10000
0
10000
20000
30000
40000
-15 -10 -5 0 5 10 15
Displacement
Fo
rce
AnalyticalExperimental

2001 PEER Annual Meeting
Sensitivity to Deterioration, SDOFR factor vs. Norm. Disp. - NR94hol Pinching Model, T=0.5s
Sa=1, ξ=5% , P-∆=0, α=0.03, αcap=-0.06, δc=4δy, γs,k,c,a=Variable
0
5
10
15
20
0 5 10 15 20δmax/δy
R
R = µ
No Deterioration

2001 PEER Annual Meeting
Sensitivity to Frequency ContentR factor vs. Norm. Displacement - Pinched System, T=0.5 sOrd. Rec. LMSR, Sa=1, ξ=5%, P-∆=0, α=0.05, αcap=-0.10, δc=4δ
y, No Det
0
5
10
15
20
25
30
0 2 4 6 8 10 12 14 16δ
max/δ
y
R

2001 PEER Annual Meeting
Deterioration Effect, MDOF System
2001 PEER Annual Meeting
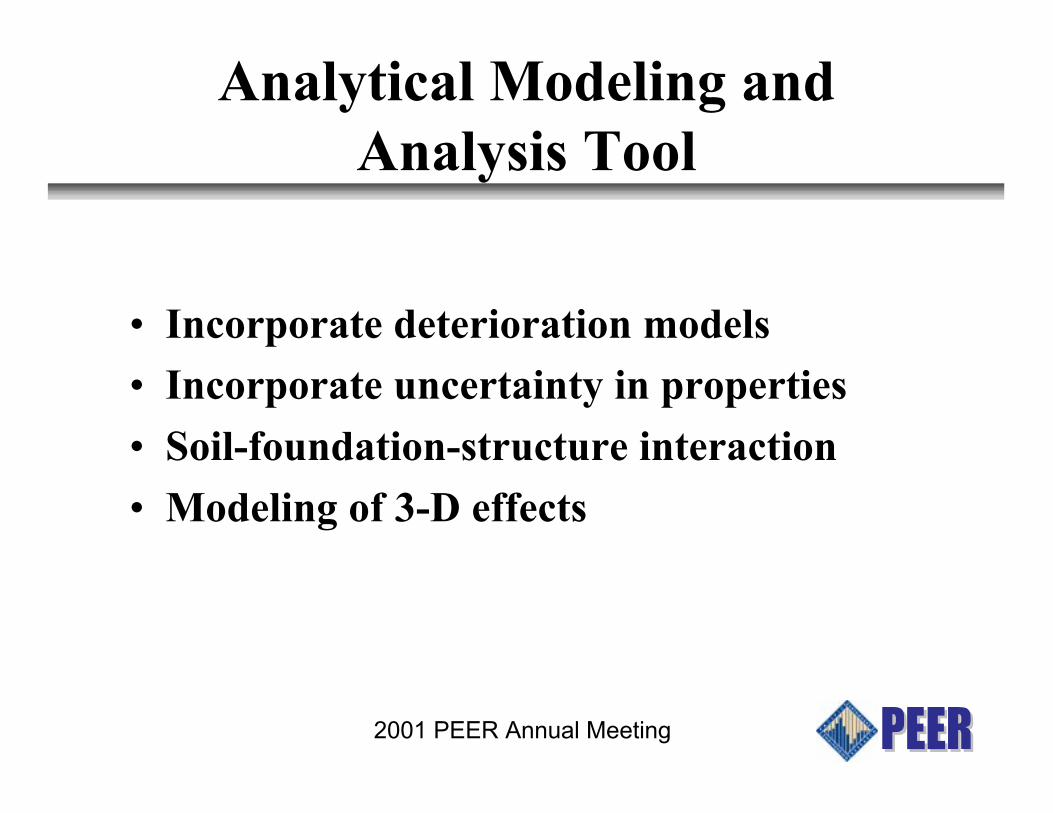
Analytical Modeling andAnalysis Tool
� Incorporate deterioration models
� Incorporate uncertainty in properties
� Soil-foundation-structure interaction
� Modeling of 3-D effects

2001 PEER Annual Meeting
Method of Prediction(Analysis Method)
STORY DRIFT ANGLE ENVELOPES Dynamic Analysis, Record LA30 (Tabas): LA 20-Story, Pre-Northridge
1
3
5
7
9
11
13
15
17
19
21
0 0.03 0.06 0.09 0.12 0.15
Story Drift Angle
Flo
or L
evel
Model M2 Model M1A
Model M2A Model M2AK
Model M1 FW Model M1FS
Model M1-NPD Model M1E-PD
Model M1E-NPD Model M1: Collapse

2001 PEER Annual Meeting
Understanding of Behavior - Walls
20-StoryT = 1.22 sec.

2001 PEER Annual Meeting
Understanding of Behavior - Walls
µ = 3

2001 PEER Annual Meeting
PEER Research Activities
� Demand database for many structuralsystems and different ground motion types
� Sensitivity of demands to ground motioncharacteristics (ordinary and near-fault)
� Collapse safety prediction from IDAs
� Improved intensity measures for reducinguncertainties in demand prediction
� Prediction of demand parameters for lossestimation (structural and nonstructural)

2001 PEER Annual Meeting
PEER Research Activities, cont�d
� Modeling of deterioration
� Evaluation of demand parameters forconceptual design
� Fragility curves for bridge peers andsystems
� Probabilistic demand models for bridges

2001 PEER Annual Meeting
Ultimate Objective
� Provide knowledge and data needed toimplement a performance assessmentmethodology based on the PEER frameworkequation (short term)
� Provide understanding, knowledge, and dataneeded to develop and implement aperformance-based conceptual designmethodology for retrofitting existing structuresand designing new ones (long range)