Embed Size (px)
Citation preview

SDM: Case Report Digital
Green
Location: India
Commodity: Rice, wheat, maize
Services: Farmer training (video extension work), market access
services (LOOP)
Service Delivery Model assessment: Short version
August 2017

Study by NewForesight | © IDH 2018 | All rights reserved
Analyzing SDMs brings a range of
benefits
• Enhanced services, which lead to improved
farmer income and resilience, through higher
productivity and product quality
• Improved SDM outcomes, which lead to an
improved social and environmental environment
• Better understanding of your business case
• Insights to improve service delivery
• Insights to develop a cost-effective SDM
• Identification of opportunities for innovation and
access to finance
• Comparison with other public and private SDM
operators operating across sectors/geographies
• Ability to communicate stories of impact and
success at farmer level
• Common language to make better informed
investment decisions
• Insights to achieve optimal impact, efficiency
and sustainability with investments and
partnerships in SDMs
What are SDMs and why are we interested in analyzing them?
Service Delivery Models (SDMs) are supply chain structures which
provide services such as training, access to inputs and finance to farmers.
The aim is to improve farmers’ performance, and ultimately their
profitability and livelihoods.
A SDM consists of service providers, often supported by donors and
financial institutions (FIs), and farmers receiving the services. All are set
within a specific enabling environment.
Enabling Environment
Service providers Farmers
Training, inputs, services, etc.
ProductsDonors & FIs
Financing for services and infrastructure
Key drivers for
success of SDMs,
benchmarking
Innovation
opportunities to
support
Convening at
sector and
national level
Cross-sector
learning, learning
community
By analyzing SDMs, we aim to support efficient, cost-effective and
economically sustainable SDMs at scale through:
Farmers and farmer organizations
SDM operator
Investors/FIs
2

Study by NewForesight | © IDH 2018 | All rights reserved
The Digital Green SDM and objectives
3
General SDM information:
Location: India
Timing and analysis scope: 2014-2020
Scale (start of analysis): 46,274 farmers
Scale (end of analysis): 65,000 farmers
Funding: BMGF, USAID, CISCO, NRLPS, JEEVIKA,
Goldman Sachs
SDM Archetype*: Service focused
• Digital Green is a not-for-profit international development organization
that uses an innovative digital platform for community engagement to
improve lives of rural communities across South Asia and Sub-Saharan
Africa.
• In India, Digital Green partners with local public, private and civil
society organizations to share knowledge on improved agricultural
practices, livelihoods, health, and nutrition, using locally produced
videos and human mediated dissemination.
• In 2016, Digital Green has reached over 416,000 farmers in more than
4,800 villages across India.Training on
good agricultural practices
Better access to market and farm
productivity
Transportation, price & payment
services
SDM objectives:
* For more info on SDM archetypes, see the IDH Smallholder Engagement Report
1Improve farm productivity through
training on good agricultural practices
(video extension)
2 Improve health and nutrition practices
in farmers’ villages and communities
Improve farmer access to market by
providing transportation and price &
payment services (LOOP)
SDM rationale:
3

Study by NewForesight | © IDH 2018 | All rights reserved
SDM Structure
4
Flow of goods and services Cash flowLegend
Scope of SDM analysis
Farmers
Digital Green
Co-funding
Frontline
worker
Local coordinatorTraining (through managers
of frontline workers)
Performance-tracking mobile
application
GAP Training
Organization of aggregators
LOOP implementation, incl.
phone and platform access
Aggregator
Transport
Market information
Produce
Produce
Payment
Payment Commission
Content co-
creation
Fee
Villages,
communities
Training on
health &
nutrition
Incentive-based
payment
Pre-selection of
aggregators, villages
and farmer groups
Data
input
Performance
reporting
Capacity building
Quality assurance
Technology
Government
Donors & investors
Mandi
trader
Selection, training and
management of frontline
workers

Study by NewForesight | © IDH 2018 | All rights reserved
Services delivered and enabling environment
5
Farmer training
(video extension work)
• Digital Green supports the government in building capacity
of frontline workers to produce and disseminate localized
video content.
• Frontline workers train female farmers on agricultural,
health and nutrition practices.
Market access services
(LOOP)
• Digital Green provides aggregators (local entrepreneurs or
farmers from the local community) with a market
application that provides information and facilitates
payment. Aggregators gather produce and arrange
collective transportation and sales at higher prices.
• Aggregators return to the farmer the same day to confirm
the sale and make the payment.
Enabling environment Farmers and Digital Green and are impacted by several
factors within their enabling environment. These factors
are most important:
1. Labor
Labor is available but farmers tend to work their land
themselves, hindering effective GAP implementation due to
time constraints. Out-migration of males makes it tough for
women to market their produce.
2. Trading system
Vulnerability of vegetables to timing logistics and the fact that
vegetable markets tend to be less controlled with higher
price fluctuation suits the LOOP system well.
3. Environmental (issues)Farmers in Bihar face significant livelihood challenges, due
to weather events and adverse climatic conditions. Floods
and droughts are common in the state.
4. Infrastructure
In absence of proper storage facilities, post-harvest losses
are incurred. Infrastructure is poor and hinders effective
transportation as well as causing losses during transport.
6. Social (issues)Adoption of new models is slow and influenced by several
behavioral factors. Changes depend on individuals’
resources, preferences, and constraints.
5. Inputs & financing
Generally, the use of fertilizers is seldom adopted.
Agricultural insurance, savings and new agricultural
techniques follow the same trend.
Study by NewForesight | © IDH 2018 | All rights reserved
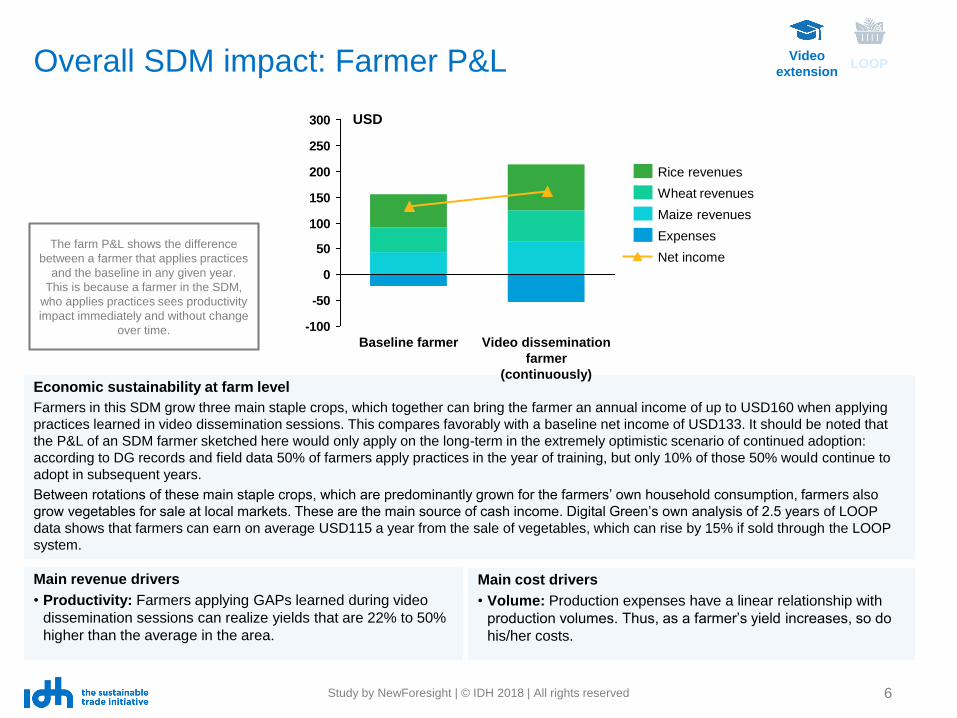
Overall SDM impact: Farmer P&L
6
Economic sustainability at farm level
Farmers in this SDM grow three main staple crops, which together can bring the farmer an annual income of up to USD160 when applying
practices learned in video dissemination sessions. This compares favorably with a baseline net income of USD133. It should be noted that
the P&L of an SDM farmer sketched here would only apply on the long-term in the extremely optimistic scenario of continued adoption:
according to DG records and field data 50% of farmers apply practices in the year of training, but only 10% of those 50% would continue to
adopt in subsequent years.
Between rotations of these main staple crops, which are predominantly grown for the farmers’ own household consumption, farmers also
grow vegetables for sale at local markets. These are the main source of cash income. Digital Green’s own analysis of 2.5 years of LOOP
data shows that farmers can earn on average USD115 a year from the sale of vegetables, which can rise by 15% if sold through the LOOP
system.
Main revenue drivers
• Productivity: Farmers applying GAPs learned during video
dissemination sessions can realize yields that are 22% to 50%
higher than the average in the area.
Main cost drivers
• Volume: Production expenses have a linear relationship with
production volumes. Thus, as a farmer’s yield increases, so do
his/her costs.
-100
-50
0
50
100
150
200
250
300
Video dissemination
farmer
(continuously)
Baseline farmer
Rice revenues
Net income
Expenses
Maize revenues
Wheat revenues
USD
The farm P&L shows the difference
between a farmer that applies practices
and the baseline in any given year.
This is because a farmer in the SDM,
who applies practices sees productivity
impact immediately and without change
over time.
Video
extensionLOOP

Study by NewForesight | © IDH 2018 | All rights reserved
Overall SDM impact: Farmer P&L
7
22,091
18,11815,03714,483
-10,000
0
10,000
20,000
30,000
20,052
Price received Net salesTransport costs
Distance < 5 km < 15 km < 45 km < 120 km > 120 km
Markets in
reach1 - 2 1 - 2 4 - 5 6 - 8 10
Max price
obtainable60% 65% 79% 90% 100%
Transport Lorry Lorry Mini truck TruckLarge
truck
Transport
cost in
INR/km/MT
20 20 13 11 10
Access to distant marketsFarmer direct sales revenues (price – transport costs)
can be increased by selling to more distant markets
INR
/MT
The farmer business case for LOOP
• The analysis of LOOP sales data reveals that selling
through LOOP results in higher farm level prices for
produce compared to selling in the conventional way.
• Farmer profit increases by 15%.
• Part of the reason why farmers can earn higher prices for
the same product is the access to more distant markets,
as shown in the graphic and table on the right:
– LOOP aggregators are able to identify where prices
are highest through information shared via the
internet.
– When a large enough volume of the product is
transported, the relative transport cost is reduced.
• Further analysis has shown that in addition to monetary
profit, farmers trading through LOOP can save 4-6 hours
of travel time per day as they no longer have to bring their
crop to the market themselves.
LOOPVideo
extension

Study by NewForesight | © IDH 2018 | All rights reserved
SDM P&L – video dissemination
8
Economic sustainability of theprogram and main cost drivers
• The cost of the video disseminationservice declines over time, whileoverhead expenses remain constant.
• The irregular nature of the cost ofvideo dissemination is due to the needto purchase costly projection andrecording equipment at irregular timeintervals.
• As the approach scales up, thegovernment will gradually take on alarger portion of the expenses of thisservice.
• The graph presents those expenses inyear of purchasing and assumes nomajor procurement is necessary upuntil 2020. It therefore does not showthe fact that a large investment willlikely be necessary in 2021.
• The video extension program aims tolower costs and attract sufficientfunding. It does not aim to have thecosts covered in any commercial way.
500
150
350
200
550
450
250
1,200
800
600
400
50
200
100
1,000
00
400
300
440
510
411
2016
396
2014
185
2017 2018 2020
1,125
372191
2015
835
535
360
510
2019
360
490
Overhead
Farmers reached
Video dissemination
Total cost
$ 0
00
Overall SDM costs by service vs. farmers reached
High costs of video
dissemination program
due to purchase cost
of recording- /
projection equipment
High costs of video
dissemination program
due to purchase cost
of recording- /
projection equipment
as well as higher staff
costs
Fa
rme
rs (
00
0)
Video
extensionLOOP

Study by NewForesight | © IDH 2018 | All rights reserved
SDM P&L – LOOP
9
Economic sustainability of theprogram
• The cost of LOOP tracks the growth infarmers reached with this service.
• Variable costs, constituting themajority of costs, are directly linked tosales volumes and thus do not allowfor significant economies of scale forthis service.
• In the future, much of the costs of thisprogram will be offloaded to itsbeneficiaries.
Main revenue drivers
• The variable costs of LOOP(aggregator fees and transport costs)are covered by farmer and tradercontributions from 2019 onwards.
Main cost drivers
• The primary cost driver of the LOOPsystem is the scale of the program,specifically the volume of producesold through LOOP, as this drivestransportation costs and aggregatorfees.
• Overhead costs per farmer decreasesignificantly over the course of theprogram; this includes for example thecost of technology infrastructure andprogram implementation and –coordination.
0
35
50
5
20
25
40
30
15
45
1,500
10
2,500
2,000
1,000
500
0
1,624
40
20
2017
253
985
4
2016
2,470
2018
2
2015
19
2019 2020
50
0
8
2014
0
139
Overhead LOOP Total costFarmers reached
$ 0
00
Overall SDM costs by service vs. farmers reached
Fa
rme
rs (
00
0)
LOOPVideo
extension
Study by NewForesight | © IDH 2018 | All rights reserved 10
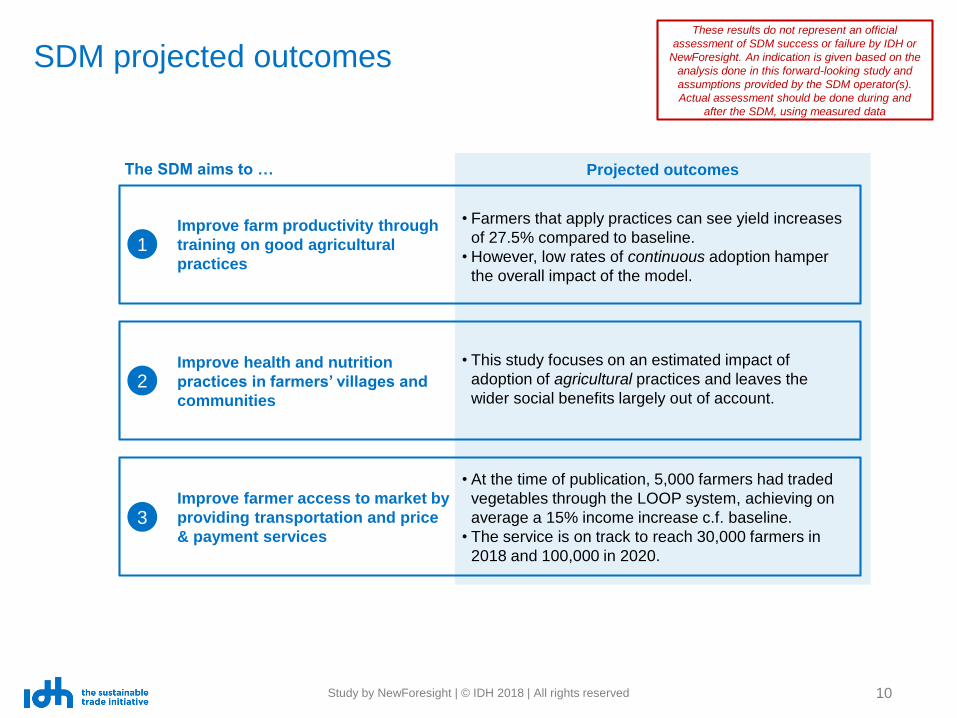
SDM projected outcomes
The SDM aims to … Projected outcomes
1Improve farm productivity through
training on good agricultural
practices
2
Improve farmer access to market by
providing transportation and price
& payment services3
Improve health and nutrition
practices in farmers’ villages and
communities
• Farmers that apply practices can see yield increases
of 27.5% compared to baseline.
• However, low rates of continuous adoption hamper
the overall impact of the model.
• At the time of publication, 5,000 farmers had traded
vegetables through the LOOP system, achieving on
average a 15% income increase c.f. baseline.
• The service is on track to reach 30,000 farmers in
2018 and 100,000 in 2020.
• This study focuses on an estimated impact of
adoption of agricultural practices and leaves the
wider social benefits largely out of account.
These results do not represent an official
assessment of SDM success or failure by IDH or
NewForesight. An indication is given based on the
analysis done in this forward-looking study and
assumptions provided by the SDM operator(s).
Actual assessment should be done during and
after the SDM, using measured data

Study by NewForesight | © IDH 2018 | All rights reserved
Key insights
11
Video dissemination
• Integration into existing face-to-face training methodology
allows for the best of both worlds: personal engagement
combined with a standardized message.
• The fact that the people in the video are peers of the farmers
creates credibility that they themselves can also use those
practices.
• Integration into wider JEEViKA program set-up allowed DG to
reach a large amount of farmers with a relatively low overhead.
Attention to needs of and added value for JEEViKA, and
patience in building this relationship created space for DG to
structurally impact the JEEViKA program.
Video dissemination
• The practices that are taught through the dissemination may not
continue to be adopted over time (this is not measured).
• It may also not be the case that the practices spread entirely
through the household and remain only with the women that
were educated. Men could perhaps be integrated into the
training to ensure wider adoption.
• The impact of the practices taught is uncertain and the greatest
focus may not lie on those practices that create the greatest
impact.
• JEEViKA may at some point decide to radically change their
model, without properly thinking through the implications for the
video technology trainings.
Key drivers of success Key risks
LOOP model• The model is driven by a network effect: the wider the
spread of the technology, the greater the geographical
spread of markets and the level of market information. The
greater the number of markets available/known the better
farmers can balance the price for their crop against
transportation costs.
• Over time farmers can aggregate greater volumes and
obtain greater economies of scale in transportation, thus
reaching further markets.
• Finally, greater volumes aggregated also allow farmers a
stronger negotiation position with other market parties. At
some point farmers may be able to “cut out” an increasing
amount of middle-men.
LOOP model• The program will stand or fall with mass participation. If a
lot of people participate it’s a success. If not enough
participants are garnered fast the program will fail.
• Trading practices are deeply entrenched into local
communities, and may be hard to break. On top of that the
gadidar plays a role in financing the farmers beyond the
direct trades they engage in, providing access to finance in
times of need. That practice effectively locks in farmers.
• Technological hiccups or botched trades would affect the
model heavily in the early stages.

Study by NewForesight | © IDH 2018 | All rights reserved
Key insights
12
Key factors in replicationOpportunities for improvement
Video dissemination
• The approach lends itself well to be translated into a revenue-
generating model, whereby commercial parties would pay for
the video dissemination methodology to be implemented in their
supply chains.
• Digital Green and JEEViKA involved have done a very good job
monitoring adoption, and could extend this approach to also
monitoring impact. Then the actual impact on household
livelihood could be assessed and the practices taught could be
adjusted over time to maximize impact.
• Adoption over time could also be monitored. It is currently not
clear to which extent the better practices are actually
implemented over time (this study takes an optimistic approach
on that).
LOOP model
• While only in its pilot stage, the model shows great potential.
An interesting opportunity exists on the farm input side. Farmer
demand could be aggregated, bought centrally and disbursed
by the farmer through the same approach and supported by a
technological platform that would largely be the same.
• Impact of Digital Green as a whole could be enhanced by tying
the LOOP model to farmers trained through video extension
(as is indeed planned in the future).
Video dissemination
• The key aspect of the Digital Green approach that needs to be
replicated is the careful embedding of the methodology in the
local enabling environment. The way DG has over the years
won the trust by clearly working to support and strengthen the
existing program approach has allowed them to build up the
goodwill to come with a range of improvement to that approach
over time.
LOOP model
• The model was able to build on the trust, the network and
the brand name that Digital Green has build up in the
geographical area where it has been active. Without that the
technology by itself could not have the same effect.
• The technology used on the other hand should make for
easy adoption into different environments, but would need to
be adjusted to match the specific structure of local markets.
It could also be tailored to meet the needs of existing farmer
organizations and fulfill the same role of payment and
marketing system.
Study by NewForesight | © IDH 2018 | All rights reserved
Joost Gorter
Senior Consultant
Julia Bolton
Senior Program Officer of learning and
innovation
Iris van der Velden
Director Learning and Innovation
13
For more information, see the IDH
Smallholder Engagement Report. This
report, gathered by analyzing over 30
individual SDMs in 16 countries,
provides insights into IDH’s data-
driven business analytics. The
findings identify drivers of farmer
resilience, cost reduction and financial
sustainability in service models and
the conditions needed for a
supporting enabling environment.