Embed Size (px)
Citation preview

1
EN This text is made available for information purposes only. A summary of this decision is published in all Community languages in the Official Journal of the European Union.
Case No COMP/M.4513 -
Arjowiggins/ M-real Zanders Reflex
Only the English text is authentic.
REGULATION (EC) No 139/2004 MERGER PROCEDURE
Article 8 (2) Date: 04/06/2008

2
COMMISSION OF THE EUROPEAN COMMUNITIES
Brussels, 04-06-2008
C(2008) 2382 final
COMMISSION DECISION
Of 04-06-2008
declaring a concentration to be compatible with the common market and the EEA Agreement
(Case No COMP/M.4513 - Arjowiggins/ M-real Zanders Reflex)
PUBLIC

3
Commission Decision
of 04-06-2008
declaring a concentration to be compatible with the common market
and the EEA Agreement
(Case No COMP/M.4513 - Arjowiggins/ M-real Zanders Reflex)
(Only the English text is authentic)
(Text with EEA relevance)
THE COMMISSION OF THE EUROPEAN COMMUNITIES,
Having regard to the Treaty establishing the European Community,
Having regard to the Agreement on the European Economic Area, and in particular Article 57 thereof,
Having regard to Council Regulation (EC) No 139/2004 of 20 January 2004 on the control of concentrations between undertakings1, and in particular Article 8(2) thereof,
Having regard to the Commission's decision of 7 December 2007 to initiate proceedings in this case,
Having given the undertakings concerned the opportunity to make known their views on the objections raised by the Commission,
Having regard to the opinion of the Advisory Committee on Concentrations2,
Having regard to the final report of the Hearing Officer in this case 3,
WHEREAS:
1 OJ L 24, 29.1.2004, p. 1 2 OJ C ...,...200. , p.... 3 OJ C ...,...200. , p....

4
I. INTRODUCTION
1. On 31 October 2007, the Commission received a notification pursuant to Article 4 and following a referral pursuant to Article 4(5) of Regulation (EC) No 139/2004 (the "Merger Regulation") of a proposed concentration by which the undertaking Arjowiggins SAS ("Arjowiggins", France), which is controlled by Sequana Capital (formerly known as Worms & Cie), acquires within the meaning of Article 3(1)(b) of that Regulation control of certain assets of M-real Zanders GmbH, Germany ("M-Real Zanders",), namely all the assets of the Reflex mill situated in Düren, Germany ("Reflex") and a 25% shareholding in the joint venture Zhejiang Minfeng Zanders Paper Company Ltd, China ("ZMZ").
2. By a decision of 7 December 2007, the Commission found that the notified operation fell within the scope of the Merger Regulation and that it raised serious doubts as to its compatibility with the common market and the functioning of EEA Agreement. The Commission therefore initiated proceedings pursuant to Article 6(1)(c) of the Merger Regulation.
3. At the request of the notifying party, Arjowiggins, the deadline for decision in this case was extended by 15 working days on 10 January 2008 pursuant to the second subparagraph of Article 10(3) of the Merger Regulation.
4. On 4 March 2008, a Statement of Objections was sent to Arjowiggins pursuant to Article 18 of the Merger Regulation.
5. Arjowiggins replied to the Statement of Objections on 18 March 2008.
6. On 31 of March 2008, at the request of the notifying party, and of the seller M-Real Zanders, an Oral Hearing took place.
7. On 7 April 2008, Arjowiggins offered commitments with a view to rendering the proposed concentration compatible with the common market. These commitments were modified; the final version of the commitments was submitted to the Commission on 28 April 2008.
8. On 11 April 2008, Arjowiggins informed the Commission that the notified transaction had been modified. In particular, the 25% shareholding in ZMZ, is no longer included in the notified transaction.
9. The Advisory Committee discussed a draft of this Decision on 21 May 2008.
II. THE PARTIES
10. Arjowiggins is a 100% subsidiary of Sequana Capital. Arjowiggins is one of the world's largest manufacturers of specialty paper, mainly graphic or creative paper, communication paper, including carbonless copy paper; and security and technology paper (used to print

5
banknotes, for example). Arjowiggins has […]∗ paper mills and a total paper production of […]* tons per year.
11. Reflex is a paper production plant located in Düren, Germany, including all fixed assets related thereto. Reflex also includes various trademarks and other intellectual property rights including an exclusive licence, which is unlimited in time, for the use of M-real Zanders' "Gohrsmühle" trademark. The plant in Düren produces carbonless paper and various specialty papers including premium uncoated wood free papers used for image and office uses as well as coated wood free papers for digital applications (inkjet paper). The plant comprises […]* paper machines and […]* coating machines with a production capacity of around […]* tons per year.
12. Reflex, which does not have a legal personality, is currently owned by M-Real Zanders, which, in turn, is controlled by the Finnish Metsäliitto Group. After the transaction, M-Real Zanders will retain one other paper mill, Gohrsmühle, which is located in Bergisch Gladbach, Germany.
III. THE OPERATION AND THE CONCENTRATION
13. The proposed operation concerns a concentration within the meaning of to Article 3(1)(b) of the Merger Regulation, since it concerns the acquisition by Arjowiggins of sole control of Reflex through the purchase of the entirety of the latter's assets.
14. Following the modification of the notified transaction, the 25%-shareholding in ZMZ, a company which is active in the production of tracing paper, will not be acquired by Arjowiggins and therefore does no longer form part of the proposed concentration.
IV. COMMUNITY DIMENSION
15. The proposed concentration does not have a Community dimension within the meaning of Article 1 of the Merger Regulation4. Sequana Capital’s aggregate worldwide turnover in 2006 was EUR 3 979 million; the aggregate Community-wide turnover was 2 727 million. The aggregate turnover attributable to Reflex for 2006 amounts to about EUR [100-200]* million worldwide and to EUR [100-200]* million in the Community. Reflex achieved more than EUR [20-30]* million only in one Member State.
16. In view of the filing requirements in seven Member States5 and the cross-border nature of the proposed transaction, the notifying party on 21 May 2007 submitted a reasoned
∗ Parts of this text have been edited to ensure that confidential information is not disclosed; those parts are enclosed in square brackets and marked with an asterisk.
4 Turnover calculated in accordance with Article 5(1) of the Merger Regulation and the Commission Notice on the calculation of turnover under Council Regulation (EEC) No 4064/89 on the control of concentrations between undertakings (OJ C 66, 2.3.1998, p. 25).
5 Germany, Greece, Italy, Slovakia, Slovenia, Spain and the United Kingdom.

6
submission for a referral to the Commission pursuant to Article 4(5) of the Merger Regulation. In conformity with the second subparagraph of that Article, the Commission transmitted that submission to all Member States. None of the Member States expressed their disagreement with the request for referral within the period laid down by the Merger Regulation. The concentration is therefore deemed to have a Community dimension pursuant to Article 4(5) of the Merger Regulation.
V. Relevant Markets
A. Carbonless Paper
Product market definition
17. Both Arjowiggins and M-Real Zanders produce carbonless paper (also called self-copying paper). While all M-Real Zanders' carbonless paper activities are concentrated in Reflex, Arjowiggins has several production sites. Carbonless paper is used to make duplicate copies without a carbon layer, for example for invoicing forms (one third of total consumption), internal forms (expenses, stock keeping), transport documents (freight orders), purchase orders and contracts. It is a specific grade of coated wood free paper made from a paper base to which layers of chemical products are applied. The image is generated by the chemical reaction between a colour former and a developer.
18. The principle behind carbonless paper thus involves obtaining a copy by reaction between two complementary layers under pressure of handwriting or the impact of a computer printer or typewriter. The first layer, the transmitting coated back layer (“CB”), is composed of microcapsules, which contain colour formers. The pressure or impact bursts the microcapsules, thus releasing these colour formers, which are then absorbed by the second layer, the receiving coated front layer (“CF”). This CF layer is made from a reactive substance (or “activated clay”), which reacts with the colour formers to give a sharp image.
19. Arjowiggins submits that carbonless paper comprises two basic systems.6 The most widely used system (which represents more than 95% of carbonless paper) consists in coating separately the encapsulated colour former and the carbonless developer.7 This results in three types of carbonless paper sheets:
• CB (coated back) top sheet: carbonless paper coated with a transmitting layer containing microcapsules. This sort of carbonless paper is used as the top copy of the bundle.
• CFB (coated front and back) middle sheet: carbonless paper coated on the front with a reactive substance, intended to act as a chemical developer, and coated on the back with microcapsules. This type of carbonless paper is used as the middle sheet or one of several middle sheets. It is the central part of the bundle, which receives and transmits the copy.
6 Form CO, p. 28. 7 The other system consists in having the encapsulated colour former and the developer in one coating,
resulting in a so-called “self contained” paper.

7
• CF (coated front) bottom sheet: carbonless paper used as the last sheet, which is coated with a receiving layer of reactive substance on the front but no microcapsules on the back capable of bursting under pressure.
20. Arjowiggins submits that producers mainly sell carbonless paper in reels (80%) while about 20% are sold in the form of sheets8. All carbonless paper producers produce both sheets and reels and cater for sheet demand by cutting reels into sheets. Converters buy reels from carbonless paper producers and are specialised in cutting operations. Reels are sold to reel printers either directly or via merchants, whereas sheets are mainly distributed via merchants.
21. Arjowiggins considers that there is an overall market for carbonless paper. In particular, Arjowiggins argues that reels and sheets are fully interchangeable from a supply-side perspective and to a large extent from a demand-side perspective and therefore belong to the same product market.
22. The Commission has briefly analysed the carbonless paper market in two previous Phase I merger decisions. In the most recent case, Case No COMP/M.2245 Metsä-Serla/Zanders9, it left open the definition of carbonless paper, since only M-Real Zanders was active in that market. In an earlier decision, in Case No IV/M.166 Torras/Sarrio10, the "self-copying" paper market was considered to be "separated" from other types of paper "equally from the consumer's and from the producers' points of view." Also, in that case only one of the parties, Sarrio, was active in the market.
23. The carbonless paper market was also dealt with in a recent cartel case, Commission Decision 2004/337/EC of 20 December 2001 relating to a proceeding pursuant to Article 81 of the EC Treaty and Article 53 of the EEA Agreement, Case COMP/E-1/36.212 - Carbonless Paper 11. It was stated in that Decision that one of the parties, Carrs Paper Ltd (Carrs), implied that carbonless paper reels and sheets form separate markets. Carrs argued that 'the market for sheets is entirely separate in commercial terms from reels – both as regards production costs, pricing and distribution channels.'12 According to Carrs it was not feasible for a printer to react to any changes in the relationship between the price of sheets and reels by switching from one to the other.
24. In the present case, the Commission has investigated whether carbonless paper should be considered a relevant product market or whether it should be divided into several smaller markets. The analysis has focused on three divisions: one between the three types of carbonless paper (CB, CFB and CF); one between coloured and non-coloured carbonless paper; and one between sheets and reels. Two types of information were analysed. First, market participants (manufacturers, merchants, and printers) were asked their opinion. Secondly, the Commission analysed monthly price and sales data from all the major
8 Form CO, p. 33. 9 Commission Decision of 15 December 2000 in Case No COMP/M.2245 Metsä-Serla / Zanders. 10 Commission Decision of 24 February 1992 in Case No IV/M.166 Torras / Sarrio. 11 (OJ L 115, 21.4.2004, p. 1). Judgment of the Court of First Instance of the European Communities of 26 April
2007 in Joined cases T-109/02, T-118/02, T-122/02, T-125/02, T-126/02, T-128/02, T-129/02, T-132/02 and T-136/02, Bolloré SA and Others v Commission of the European Communities, [2007] ECR II-00947.
12 Commission Decision in Case COMP/E-1/36.212 - Carbonless Paper, Recital 11.

8
producers of carbonless paper13. The data were given country by country worldwide for the period from 1 January 2004 until 31 December 200714.
CB, CFB and CF are in the same product market
25. The Commission first considered whether the three types of carbonless paper (CB, CFB and CF) should be considered to be in the same relevant product market. The data showed that the market shares of an individual company do not significantly deviate from each other for the three types of paper. This indicates that the competitive assessment would be broadly the same whether each type was analysed separately or together. The Commission also examined the price movements of the three types of paper and found that they move broadly in the same way, which is consistent with the three types of paper being in the same product market.15 In addition, the market investigation did not reveal any indications that CB, CFB and CF might belong to separate relevant markets.16 The Commission therefore proceeded with its assessment on the basis of all three types belonging to the same product market.
Coloured and non-coloured paper is in the same product market
26. Market participants were asked whether coloured and non-coloured paper is in the same product market. They were unanimous in arguing that coloured and non-coloured paper is in the same market.17 The Commission does not possess any other information that would point to coloured and non-coloured paper being in different markets. The Commission therefore proceeded with its assessment on the basis that coloured and non-coloured paper belongs to the same product market.
Reels and sheets are potentially separate product markets
27. The Statement of Objections of 4 March 2008 found that reels and sheets may form separate product markets but ultimately left open the exact market definition.
28. Arjowiggins argues in the Reply of 18 March 2008 to the Statement of Objections that there is a single product market for all types of carbonless paper and "strongly disagrees" with the Commission's conclusion in the Statement of Objections that reels and sheets of carbonless paper may be in separate product markets.
29. Arjowiggins argues that the Commission's finding is contrary to the views of industry players and to the reality of the market. According to Arjowiggins only 5 respondents to the market investigation out of 26 considered carbonless paper reels and sheets to form separate product markets. It argues that the fact that the Commission has failed to take into account the views of market participants on this issue is in stark contrast to its reliance on the results of the market investigation in relation to other issues, where it claims that the views of market participants support its findings (for example, in relation to possible
13 Arjowiggins, M-Real Zanders, Koehler, Mitsubishi and Torraspapel. 14 One competitor only provided the data from 2005 onward. Another could not deliver data for December 2007. 15 See Annex 1 for details of the analysis. 16 Questionnaire to competitors of 15 November 2007. 17 Questionnaire to producers of carbonless paper of 20 December 2007.

9
distinctions between CB, CFB and CF sheets on the one hand, and coloured and non-coloured carbonless paper on the other).
30. In addition, Arjowiggins considers that the view of the majority of market participants in this case is in conformity with the economic reality, which shows both supply-side and demand-side substitutability between reels and sheets.
31. Arjowiggins mentions several "supply-side factors" that were already described in the notification and argues that they seem to have been underestimated by the Commission in this case and that this is demonstrated by the fact that the Commission did not ask manufacturers whether they considered carbonless paper reels and sheets to form part of the same product market. That question being only asked to customers.
32. Arjowiggins also emphasises the existence of demand-side substitutability between reels and sheets of carbonless paper, since the end use for carbonless paper sold in reels or sheets is identical, both being used to produce the same types of documents (for example invoices, forms, receipts and delivery documents). It argues that the Commission has failed to address this end-user perspective.
33. Arjowiggins also criticises the econometric analysis carried out by the Commission and presented an alternative analysis carried out by its economic consultant which concluded that reels and sheets are part of a single product market.
34. Finally, Arjowiggins questions the Commission's reliance on historic evidence collected prior to its 2001 cartel case Decision 2004/337/E in relation to an infringement which came to an end in 1995, in the context of assessing what the relevant product market is at this point in time. In addition, it questions why the Commission appears to be relying on the views of one of the parties to that cartel case, but disregards the current views of the market participants in this case.
35. The Commission still considers that reels and sheets may form separate relevant product markets for the reasons set out below, but does not exclude the possibility of an overall carbonless market.
36. Market participants were asked whether reels and sheets are in the same product market.18 The Commission noted already in the Statement of Objections of 4 March 2008 that the majority, but not all, market participants thought reels and sheets to be in the same product market. Among the arguments used by the majority of the customers in favour of one product market are that reels and sheets are produced on the same paper machines and that the end product is identical. A few customers answered that reels and sheets form separate product markets. One customer argued that "from the point of end users – it's the same product market as the applications are the same. From the point of view of paper mills and merchants – these are separate markets, reels bring no profit neither for mills, nor for merchants, while sheets have normal profitability".
37. The Commission also noted in the Statement of Objections of 4 March 2008 that Decision 2004/337/EC contains information as to whether reels and sheets are separate product
18 Questionnaire to competitors of 15 November 2007.

10
markets. First, as referred to above, one company argued that carbonless paper reels and sheets form separate markets. Secondly, Tables 4 to7 in that Decision show agreed price increases decided among the cartel members at various meetings. In each table there is a separate row for each country for reels and for sheets. The agreed increases for reels and sheets are often quite different with the maximum difference being a 10% increase for one of the two products and no increase for the other. This difference seems to indicate that the cartel members thought that prices of reels and sheets could be changed separately in a way that is not consistent with reels and sheets being in the same product market.
38. The Commission also stated in the Statement of Objections of 4 March 2008 that it did not find that the market investigation and the cartel decision gave a clear answer to whether reels and sheets are in the same product market. This does not mean that the Commission "relies on" the views of one of the parties in Decision 2004/337/EC while it "disregards the current views of the market participants". The Commission carefully considered the totality of the evidence from the market investigation and the cartel decision and in the end did not find that such evidence conclusive as to whether reels and sheets are in the same product market.
39. Arjowiggins also criticises the Commission for not having asked end customers and manufacturers about their view of the relevant product market. It is not clear how end users, such as large administrations and corporations, could give a meaningful answer as to whether reels and sheets are in the same relevant product market, as they order the product they need in the form they need from a printer. As described below the Commission does not contest the existence of technical supply side substitution and saw no need to ask manufacturers about this. Even if manufacturers would have answered that they considered reels and sheets to be in the same product market, the Commission would, in any event, have made a careful analysis of price movements.
40. Contrary to the situation for reels and sheets, the market investigation (and the cartel case, Decision 2004/337/EC) did not give any indications that coloured and non-coloured papers could be in different product markets or that CB, CFB and CB could be in different product markets. That last point was also confirmed by the econometric analysis performed by the Commission.
41. Arjowiggins submits in the notification that "in view of the strong supply-side substitutability and the relative demand-side substitutability between carbonless paper reels and sheets, the two products belong to the same product market for the purposes of the present Transaction."19
42. Arjowiggins argues that from a demand-side perspective there is a "certain degree of substitutability" between carbonless paper reels and sheets. Paper merchants – the main customers of the parties - purchase both products and for end-customers, it "appears" that the end-use applications for reels and sheets are "the same". However, Arjowiggins also admits that "reel customers are generally large printers whereas sheet customers are generally small printers". Furthermore, "printers who use reel presses only purchase reels, whereas printers who own format presses only purchase sheets". The fact that paper merchants buy both types of paper is largely irrelevant; this simply reflects the fact that
19 Form CO, p. 31.

11
they have both types of printers as customers, and therefore purchase both types of paper. According to Arjowiggins' own submission, printers cannot easily switch between reels and sheets, as they generally use either one or the other. What should prevent a hypothetical monopolist from raising prices of either sheets or reels would therefore be the switching done by the end-customers. The Commission's analysis of price movements shows that this threat is not sufficient to ensure that prices move together, and the evidence in the 2001 cartel case, Decision 2004/337/EC, shows that the cartel members thought that reel and sheet prices could be changed separately.
43. Arjowiggins argues that there is "strong supply-side substitutability" since all major manufacturers produce both reels and sheets. The production process of sheets and reels is almost the same and involves the same paper machines and coating machines. Although the average prices applied for sheets are higher than those applied for reels, this price difference is, according to Arjowiggins, mostly explained by higher mill fixed costs generated by the cutting and ream packaging operations. Arjowiggins also mentions that the Commission Notice on the definition of the relevant market for the purposes of Community competition law20 specifically mentions the paper industry as an example of supply-side substitutability.21
44. That Commission Notice refers to paper as an example of a product which is supplied in a range of different qualities. From a demand point of view these qualities may not be substitutable. "However, paper plants are prepared to manufacture the different qualities, and production can be adjusted with negligible costs and in a short time-frame. In the absence of particular difficulties in distribution, paper manufacturers are able therefore, to compete for orders of the various qualities, in particular if orders are placed with sufficient lead time to allow for modification of production plans. Under such circumstances, the Commission would not define a separate market for each quality of paper and its respective use."22
45. The Commission Notice on the definition of the relevant market for the purposes of Community competition law also refers to the basic theory behind the supply-side substitution argument at paragraph 20 thereof: "This means that suppliers are able to switch production to the relevant products and market them in the short term without incurring significant costs or risks in response to small and permanent changes in relative prices. When these conditions are met, the additional production that is put on the market will have a disciplinary effect on the competitive behaviour of the companies involved. Such an impact in terms of effectiveness and immediacy is equivalent to the demand substitution effect".23
46. It is important to take into account that whether supply-side substitution is sufficiently strong to lead to two or more "demand-side markets" being added together is not only an issue of technical possibility. Paragraph 20 of the Commission Notice makes it clear that
20 OJ C 372, 9 December 1997, p. 5. 21 Form CO, p. 31. 22 Commission Notice on the definition of the relevant market for the purposes of Community competition law
(OJ C 372, 9 December 1997, p. 5) at paragraph 22. 23 Commission Notice on the definition of the relevant market for the purposes of Community law, at paragraph
20.

12
marketing and distribution issues are also relevant. Technical supply-side substitution possibilities are, for instance, unlikely to be particularly relevant for the purpose of market definition in markets of heavily branded consumer goods.24 Similarly, difficulties in distribution may render technical supply-side substitution possibilities less efficient. The incentives to switch production should also be carefully considered and should involve not only the supply-side costs of switching but also the effects that switching production would have on the prices in the various markets.
47. Whether the possibility of technical supply-side substitution will induce producers to react quickly to "small (in the range 5% to 10%) but permanent changes in relative prices"25 therefore needs careful analysis. The Commission thus analysed how reels and sheets prices move together over time within each of the six largest countries that account for about 75% of the total volume sales in the EEA.
48. The Commission used in particular two techniques to examine the extent to which prices move together over time: correlation analysis and stationarity analysis. Pricing analyses of this kind are a standard tool used to assess whether products are in the same product market for competition purposes.
49. Correlation analysis measures the extent to which price movements of one product are associated with price movements of another product. If two prices move perfectly “in step”, then the correlation coefficient is one; if there is no association between the prices, the correlation coefficient is zero. To assess whether the prices of two products are sufficiently correlated to be considered in the same market, it is typical to use as a benchmark the correlation between two products that are accepted as being in the same market. However, if such a benchmark is not readily available, a view must be taken on what level of the correlation coefficient is high enough to indicate that two products are in the same market.
50. Stationarity analysis uses sophisticated statistical tests to gauge whether the relative price of two products tends to revert to a constant value over time (that is to say, whether the relative price is “stationary”). Essentially, it is a test of whether the “law of one price” holds between the products: if products are close substitutes, then their prices can only deviate from each other for short periods of time. If this law does hold, then this is consistent with these products being in the same market (competing directly with one another) for competition purposes.
51. One important element to correlation analysis is controlling for common shocks to prices across the different products such as common cost movements or currency movements, as it is possible that high correlations could be driven entirely by changes in these common elements (as we are analysing movements in price levels). Given that stationarity tests analyse relative prices, the role of these common elements is reduced to a minimum.
24 For the avoidance of doubt, the Commission does not view carbonless paper as a heavily branded consumer good; it simply wants to illustrate that the presence of technical supply side substitution does not always guarantee that two products are in the same product market. The competitive pressure exerted by technical supply side substitution has to be analysed on a case-by-case basis.
25 Commission Notice on the definition of the relevant market for the purposes of Community law, at paragraph 17.

13
Additionally, stationarity tests do not require use of any benchmarks. Thus, it is important to look at the results of both of these types of analysis together.
52. While the evidence that prices move together over time is not conclusive evidence of strong competitive constraints between two products, it is certainly consistent with the two being in the same market. At the same time, however, if strong price co-movements over time are not found, this suggests that the competitive relationship between the two products is not particularly strong and thus they are not in the same product market.26
53. The Commission based its analysis on two types of data. The Commission obtained monthly volume sales and value sales by country and by product (CB reels, CF reels, CFB reels, CB sheets, CF sheets and CFB sheets) from the five largest producers of carbonless paper (Arjowiggins, M-Real Zanders, Mitshubishi, Torraspapel and Koehler) that account for about 90% of the total market sales for the period from 1 January 2004 to 31 December 2007. In addition, the Commission also obtained transaction-level data at the invoice level from Arjowiggins for the period from 1 January 2002 to 31 December 2007 and from M-Real Zanders for the period from 1 January 2003 to 31 December 2007.
54. The results from the correlation and stationarity tests (see Annex 1) suggest that reels and sheets are not part of the same relevant product market. The correlations between reels and sheets prices based on the data for the five major producers range from -0.32 (in Italy) to 0.5 (in France). These correlations are significantly lower than the correlations of the CF, CB and CFB products that can serve as useful benchmarks in this case for acceptance of products in the same product market.27 The results based on the analysis of the Arjowiggins transaction data are very similar: excluding the sales to the paper merchant Antalis, which is a sister company to Arjowiggins, four of the five correlation coefficients are in the range 0.06 to 0.16, while that for the United Kingdom is 0.84.28 With the exception of the Arjowiggins United Kingdom coefficient, these correlation coefficients are clearly not in the range normally considered to indicate that two products are in the same relevant market and are significantly below the correlations at the CF, CB and CFB levels.
55. The stationarity tests also confirmed that reels and sheets are not likely to be in the same market. There seems to be a clear upward trend in the prices of reels relative to the prices of sheets for both types of data.29 This would suggest that there is no long-term average that the relative prices converge to, and thus the “law of one price” does not seem to hold.
56. In addition, as discussed in the competitive assessment below, the market investigation indicates that sheet prices are significantly higher in the EEA than outside, while reels
26 Unless the competitive relationship between two products has been subject to some large structural change over time.
27 The benchmark correlations for the three types of reels coatings range from 0.47 to 0.98, with only two correlation coefficients (out of 18) below 0.8. Even the benchmark correlations for the three types of sheets coatings are in a somewhat lower range from 0.48 to 0.89.
28 It was not possible to compute a correlation coefficient for […]*, as Arjowiggins had no sales other than to Antalis in that country.
29 The presence of strong trends is also confirmed by the Augmented Dickey Fuller tests used for the statistical testing of stationarity.

14
prices are more similar.30 This also points towards different dynamics in the sheets and reels markets.
57. Arjowiggins' criticism of the econometric analysis carried out by the Commission is dealt with in Annex 1. In particular, it is shown that the correlation and stationarity analysis of percentage gross margins presented by Arjowiggins is subject to a large number of methodological shortcomings, as (i) the statistical tests are not implemented properly, and (ii) the analysis is not in accordance with the Commission Notice on the definition of the relevant market for the purposes of Community law. It is also noted that Arjowiggins adopted the Commission's econometric approach for its tracing paper analysis, which puts further doubt on Arjowiggins' criticism of the analysis carried out by the Commission.31 As a result, the analysis presented by Arjowiggins, as well as Arjowiggins' criticism of the econometric analysis by the Commission, is rejected, and the validity of the analysis presented in the Statement of Objections is confirmed.
58. When reviewing Arjowiggins' econometric analysis, the Commission found additional evidence that would be consistent with sheets and reels being in separate product markets. In particular, in the economic study it is stated that "…cost structure explains why the average prices for sheets are higher than those for reels. In 2007 gross margins were also higher for the products in sheets ([…]*%) than in reels forms ([…]*%)."32 This implies that Arjowiggins' sheet margins are more than […]*% higher than the reels margins. However, Arjowiggins, in order to support its supply-side argument, stated in its Reply to the Statement of Objections that the only difference between reels and sheets is that (i) "…at the end of the paper production process, the paper is either sent to a reeler or a sheeter, and then to the relevant packaging line, this latter stage being a relatively quick and inexpensive process," and (ii) "…while there may be differences in the average price of sheets and reels, this is only due to the fact that there are slightly higher fixed costs generated by the cutting and packaging process for sheets". Therefore, costs cannot be put forward to explain why Arjowiggins' sheet margins are more than […]*% higher than the reels margins. These differences must therefore be attributed to other factors such as, for example, the competitive dynamics, which would point to sheets and reels being in separate markets.
59. Although the econometric analysis carried out by the Commission points mainly towards separate product markets for reels and sheets of carbonless paper, the question may ultimately be left open as to whether there is an overall market for both reels and sheet or whether reels and sheets are separate product markets.
The market is not wider than carbonless paper
60. The notifying party, Arjowiggins, did not claim in the notification that the market is wider than carbonless paper. In a submission of 20 December 2007 the parties commented on the Commission's Article 6(1)c decision and argued that "the relevant product market is in fact wider than the carbonless paper manufacturing market and should also include some
30 Commission calculations based on price and volume data supplied by the major EEA producers of carbonless paper.
31 See Annex 3, in which the Commission overviews Arjowiggins' analysis of the tracing paper market. 32 See Annex A of the "Carbonless market definition" report, 17 March 2008, provided by Arjowiggins.

15
certain end-use uncoated woodfree and thermal paper segments". However, in a later submission of 22 January 2008, Arjowiggins confirmed its position in the notification that the market is not wider than carbonless paper, although it argued that the Commission in its assessment had not taken account of the competitive pressure exerted by other types of papers, in particular uncoated wood free paper and thermal paper, as well as non-paper based alternatives. Arjowiggins reiterated this position in the Reply to the Statement of Objections.
61. The Commission has, nevertheless, investigated whether the market could be wider than carbonless paper. However, the vast majority of customers covered by the Commission’s market survey confirmed that that carbonless paper is not part of a wider product market.33 The Commission also analysed the price development of thermal and carbonless paper using correlation analyses. The results clearly showed that thermal and carbonless paper is not in the same relevant market. The issue of competitive pressure from thermal paper and other products outside the relevant product market is analysed in Part VI of this Decision.
Conclusion on the relevant product market definition
62. The econometric analysis carried out by the Commission points mainly towards separate product markets for reels and sheets of carbonless paper. However, the Commission will assess the competitive effect of the proposed transaction both on the basis of separate product markets for reels and sheets of carbonless paper and on the basis of an overall carbonless paper market. However, the exact product market definition may be left open as the notified transaction would lead to a significant impediment to effective competition under either market definition.
Geographic market definition
63. In the notification Arjowiggins considers that the geographic market is at least EEA-wide due to centralised manufacturing, European or worldwide brands, limited transportation costs ([0-10]*% of the sale price) and high levels of import and export within the EEA.34
64. In the Statement of Objections the question was left open as to whether the geographic market definition is EEA-wide or national, while it was excluded that the market is wider than the EEA. However, in the Reply to the Statement of Objections, Arjowiggins argues that the geographic market is worldwide.
65. In the notification, Arjowiggins refers to Recital 29 of Decision 2004/337/EC, the 2001 Carbonless Paper cartel decision, which states: "… Generally speaking, however, producers sell throughout the EEA, and transport costs do not seem to hinder trade inside this area".35 The current investigation has confirmed that carbonless paper manufacturers transport and sell carbonless paper in various countries in the EEA from one or a few manufacturing sites.36 Within the EEA transport costs do not appear significant. However, as described below; it is nevertheless noticeable that some manufacturers seem to
33 Questionnaire to customers in the first phase investigation and questionnaire to customers of carbonless paper in the second phase investigation.
34 Form CO, p.39. 35 Decision 2004/337/EC, Recital 29. 36 Questionnaire to competitors of 15 November 2007.

16
concentrate their sales in particular EEA countries. In addition, while cross-border trade flows are certainly consistent with wider geographic markets, they do not provide conclusive evidence that a hypothetical monopolist could not profitably implement a small but permanent relative price increase.37
66. Decision 2004/337/EC also contains certain information that points to the markets being national. Tables 4 to 7 of Decision 2004/337/EC show agreed price increases decided among the cartel members at various meetings. In each table there is a separate row for each country for reels and for sheets. The agreed increases for the different countries are often quite different with the maximum difference being a 15% increase for one country and no increase for another. This seems to indicate that the cartel members thought that prices in different countries could be changed separately in a way that is not consistent with the geographic market being at least EEA wide.
67. Arjowiggins argues in the notification that "Arjowiggins' prices are fairly homogeneous across the EU. For each country where Arjowiggins has significant sales, i.e. where the volumes of carbonless paper (sheets and reels) exceed [2 000-4 000]* tons, prices generally do not vary more than [10-20]*% above or below the average European price."38 The Commission notes that this would indicate that there is a price difference of up to [20-30]*% between some of these countries, a difference that could be considered significant. The source of the price data provided in the notification is not specified. However, these prices do not seem to correspond with those in Figure 14 in a report submitted on 25 January 2008 on behalf of Arjowiggins and M-Real Zanders. The prices in this report generally are higher than those in the notification. In response to a question by the Commission, Arjowiggins confirmed that the prices given in the notification were not correct.39 In addition, as prices of sheets are significantly higher than prices of reels, Arjowiggins' findings in the econometric study suffer from significant "composition effects" by combining sheets and reels prices together. Thus, it is not clear how meaningful Arjowiggins' analysis of price levels is.
68. However, analysing price movements over time is a useful approach to geographic market definition. Similarly to what is described in the section on product market definition, the Commission has therefore undertaken the same type of analysis for the six largest countries.40 If the market is EEA-wide, one would expect to see the prices of reels and sheets moving closely together across the six countries. The reasoning behind this test is as follows: if markets are EEA-wide, any "misalignment" in national prices would only be temporary, as prices would be forced back into line due to imports from the "high price country" to the "low price country".
69. The results of the correlation analysis are mixed. While the correlation coefficients for sheet prices between the six countries are quite small41, some of those for reels42 are closer
37 Commission Notice on the definition of the relevant market for the purposes of Community law, paragraph 17.
38 Form CO, p. 40. 39 Arjowiggins Reply of 13 February 2008 to the Commission's Questionnaire of 5 February 2008. 40 Germany, France, Italy, Poland, Spain and the United Kingdom. 41 In the range -0.16 to 0.46 for the prices based on all five manufacturers and -0.04 to 0.54 based on
Arjowiggins transaction data excluding sales to Antalis.

17
to the levels that normally could be accepted as indicating that the different countries are in the same market (although such a market certainly would not be EEA-wide). However, even for reels, some of the close movements in prices may be simply driven by common movements in input costs or exchange rate shocks (the so-called spurious correlations). Thus, the Commission also undertook a stationarity analysis of relative prices (between different country pairs) to further strengthen its geographic market tests, as (i) there is no clear benchmark against which to assess the correlations and (ii) the relative prices reduce the role of common elements to a minimum.
70. The analysis based on the data from the five manufacturers indicates that there are significant trends in the relative prices, and there is thus no support for markets that are wider than national. The findings from the stationarity tests using the Arjowiggins' transaction data (including and excluding Antalis, Arjowiggins' sister company) also do not provide any consistent and robust evidence that would point to EEA-wide markets.
71. Those results are also documented by the differences in price levels across the different countries.43 For example, for the year 2007 prices of sheets in Germany are [20-30]*% higher than in Poland, and the prices in the Netherlands are more than [40-50]*% higher than in Hungary. While in 2007 the price differences are not so pronounced for reels, they can still amount to about […]*% (for example between Sweden and Belgium).44
72. Neither the correlation analysis nor the stationarity tests have provided any consistent evidence that would point towards EEA-wide markets. There also seem to be important differences in price levels among some countries. Thus, the evidence from the market definition tests is difficult to reconcile with an EEA-wide geographic market. It should also be noted that carbonless paper manufacturers often have very different market shares from one country to another. Indeed, even major manufacturers have no sales at all in some countries. The fact that there are indications that the geographic market may be narrower than EEA-wide of course logically implies that the geographic market cannot be wider than EEA-wide.
42 The five-manufacturer coefficients between France, Italy and Poland are, for instance, in the range 0.86 to 0.94. Those between Germany and those three countries are in the range 0.73 to 0.77, while those between the United Kingdom and the other four countries between 0.45 and 0.51. The coefficients based on Arjowiggins transaction data excluding Antalis are broadly similar.
43 The cross-country comparisons are also suggestive of important differences between sheets and reels. For example, while the Netherlands and Germany are among the highest price countries for sheets, they are one of the lowest price countries for reels. Similarly, in the opposite direction, Hungary appears to be one of the highest price countries for reels but, at the same time, is one of the lowest price countries for sheets.
44 The Commission also found similar differences for the Arjowiggins transaction data: the price differences appear to be higher for sheets than for reels.

18
Arjowiggins' reply to the Statement of Objections
73. Arjowiggins argues in the reply to the Statement of Objections that the Commission in its analysis has not given weight to factors which indicate that the relevant market was EEA-wide and is in the process of becoming worldwide.
74. First, Arjowiggins refers to an analysis conducted by its economic adviser, which argues that price dispersions are fairly similar within each country in the EEA and that, in any case, there is sufficient volume available both within and outside the EEA to defeat a 5% price increase in any given country in the EEA.
75. Secondly, Arjowiggins notes that the Commission accepts that carbonless producers transport and sell carbonless paper in various countries in the EEA from one or two centralised manufacturing sites and that transport costs within the EEA are not significant. According to Arjowiggins, the fact that some manufacturers are stronger in some countries of the EEA is not sufficient to undermine the fact that these factors point to there being an EEA-wide (or wider) geographic market.
76. Thirdly, Arjowiggins submits that there are clear and objective signs that the market for carbonless paper is in the process of becoming, if not being already, worldwide. According to Arjowiggins, the recent evolution of the exchange rate between the euro and the US dollar "tremendously" favours suppliers selling in the latter currency, and this development has already had, and is likely to continue to have, significant effects on the structure of competition in relation to carbonless paper.
77. Arjowiggins argues that the Commission in the Statement of Objections rejects Arjowiggins’ argument on the mere ground that “current imports of carbonless paper into the EEA have not accounted for more than 2% of sales in the last three years”, but fails to adopt a prospective approach and to address a number of factors.
78. Arjowiggins thus claims that non-EEA competitors themselves declare that they have already begun to benefit from the effects of a declining exchange rate. In particular, Arjowiggins refers to the US company Appleton which recently indicated that its “net sales for the last quarter [of 2007] went up 2 per cent, to USD 241 million, as the company logged a surprising increase in sales volumes of carbonless paper markets”. Arjowiggins argues that this beneficial effect of the USD/EUR exchange rate is confirmed in Appleton’s recent financial statements, which indicate that this competitor “was able to increase shipments internationally in part due to a weakened dollar” and that, with regard to thermal paper, “international shipment volumes increased nearly 30%.” Also, Arjowiggins argues that Appleton has indicated that it was willing to take full benefit from this trend, through “increased international sales efforts” and a recent USD 100 million investment aimed at increasing its capacities for thermal and carbonless paper to meet the demand of its growing international customer base.
79. Arjowiggins claims that it has noted in the recent years the growing importance of imports of carbonless paper into Europe. According to Arjowiggins (i) Appleton is increasingly active in at least the former Yugoslavia, Poland, Slovenia and Greece, (ii) the Indonesian company APP has a sales person in Poland to promote its sales in Central and Eastern Europe, (iii) the American producer Glatfelter offers carbonless digital sheets to European customers via its establishment in the United Kingdom; and (iv) the Turkish competitors

19
Meteksan and Mopak record increasing sales in Bulgaria, Romania and the former Yugoslavia. Arjowiggins makes the following estimates with regard to the volumes of carbonless sold or to be sold in Europe by some of these competitors:
Competitor 2007 2008 Appleton 150 to 200 tons Above 1 000 tons APP 100 to 150 tons 500 to 800 tons Meteksan and Mopak 800 tons Above 1 000 tons
80. Arjowiggins argues that it has already felt the actual effects of this growing competition from non-EEA players. For example, it states that Appleton took volumes after the closure of Mondi in May 2007; that Asian suppliers, including APP, have taken customers from […]* in South Africa; that Inapa switched some volumes from […]* to […]* in Italy in 2007; that some volumes were taken from […]* by […]* in Turkey in 2007; and that Appleton took volumes from […]* in Poland via a sales representative based in Austria.
81. Arjowiggins takes the view that those trends should be maintained and even enhanced in the near future, as most analysts agree that, at least for the next two years, the EUR/USD exchange rate should remain above or around 1.4. In addition, Arjowiggins considers that, in the event that the USD/EUR exchange rate should remain at its current level (that is approximately 1.6 as of the date of the Reply to the Statement of Objections45) for a period of four years, the European carbonless paper industry as a whole would disappear and would not be able to recover even if the exchange rate were to decrease afterwards.
82. Arjowiggins is convinced that those developments, which have already proved detrimental to its position, clearly establish that the market for carbonless paper is in the process of becoming worldwide. This should at least be true from the point of view of a European customer, who is able to choose between European products sold in euros and, increasingly, cheaper supplies offered in US dollars. In accordance with the paragraph 13 of the Commission Notice on the definition of relevant market for the purposes of Community competition law, which states that: “…Basically, the exercise of market definition consists in identifying the effective alternative sources of supply for the customers of the undertakings involved, in term of both of products/services and of geographic location of suppliers.”, Arjowiggins submits that, in this case, the growing availability of cheaper imports for European customers should lead to the conclusion that the geographic market for carbonless paper is becoming worldwide, at least from the point of view of European customers.
83. Finally, Arjowiggins notes that its view that the relevant geographic market is at least EEA-wide and most certainly worldwide is, to a large extent, shared by a significant number of market participants since, based on Arjowiggins' review of the Commission’s file, 21 customers indicated that the market is EEA-wide and 17 customers replied that it is worldwide. Arjowiggins therefore strongly disagrees with the Commission’s view that such market may be national and submits that, even if the relevant market were defined as
45 18 March 2008.

20
EEA-wide, the strong and growing competitive constraints exercised by non-EEA players should be fully taken into account in the Commission's substantive assessment.
The Commission' view
84. The Commission has carefully considered Arjowiggins' arguments presented in the reply to Statement of Objections. It cannot, however, agree with Arjowiggins' position that the geographic market is wider than the EEA – or even worldwide – and maintains its position in the Statement of Objections that the geographic market may be national.
85. The study provided by Arjowiggins' economic adviser argues that the price correlation and stationarity tests in the Statement of Objections on which the Commission based its geographic market definition suffer from "shortcomings". These alleged shortcomings are described in a general way for the analysis conducted by the Commission. In addition, Arjowiggins argues that "the most appropriate way of testing whether two products are in the same relevant market using time series information is to test for the existence of co-integration between the prices of products – or regions when defining geographical markets – that potentially belong to the same relevant market. The Commission, however, has not addressed the possibility of applying such test." As shown in Annex 1, Arjowiggins' criticism is not convincing, as the techniques employed by Arjowiggins do not provide any results that could be interpreted as robust evidence for EEA-wide markets, or are based on unrealistic assumptions with results that are contradicted by the findings of the actual price movements. Thus, the validity of the analysis presented in the Statement of Objections should be confirmed.
86. In addition, the Commission notes that Arjowiggins does not attempt to perform its own correlation or stationarity tests using the methods it argues that the Commission should have used. Instead it completely changes analytical approach and presents a "price dispersion" analysis. It finds that the "price dispersions of countries within the EEA are fairly similar especially across the larger countries, and the price dispersions of all countries have significant overlaps with those of many other countries". The Commission does not find that this is a convincing argument for a wider geographic market. It finds that its analysis of the movement of average prices in the different countries provides more pertinent information for a market definition exercise. Even if there are similar price dispersions across the different countries, the fact that the movement of average prices in two different countries develops in different ways over time implies that these two countries are not in the same relevant geographic market, except if there are other explanations for this development. Arjowiggings has not presented any such explanations besides the unfounded technical criticism of the Commission's analysis referred to above.
87. As to the finding that there is a sufficient volume available both within and outside the EEA to defeat a 5% price increase in any given country of the EEA, such analysis is, however, based on the crucial assumption that volumes could be freely shifted from one country to another, and that the carbonless paper producers would have the ability and incentive to do so. This is clearly not a credible assumption to make, since if it were true one should already expect Arjowiggins' prices to be closely related to each other in the different countries, a finding that is not consistent with the results from Commission's analysis. Thus, while the Commission agrees with Arjowiggin's claim that in theory "there is sufficient volume available both within and outside the EEA to defeat a 5% increase in a country", such a finding does not say anything about whether the carbonless paper

21
producers would have the ability and incentive to shift these volumes. The examination of the actual market-clearing prices that Arjowiggins submitted to the Commission clearly suggests that this is not the case.
88. The Commission also used the gross margin data that Arjowiggins submitted in support of its product market definition analysis to further test its hypothesis regarding the geographic market definition, as the results from the correlation analysis of prices were mixed: while the correlation coefficients for sheet prices between the six countries are quite small, some of those for reels are closer to the levels that could normally be accepted as indicating that the different countries are in the same market (although such a market would certainly not be EEA-wide). As explained above, one explanation for such a finding may be that the close movements in prices may be driven by common movements in input costs. Thus, the gross margin data submitted by Arjowiggins lend themselves particularly well to assessing the role of the common input cost movements. The findings in Annex 1 show that the correlation coefficients for prices excluding common costs (gross margins) are very low and do not by and large attain values such that the countries could be considered to be part of the same market.46
89. Arjowiggins' second argument seems to be based on a misunderstanding. Arjowiggins claims that the Commission maintains that the fact that some manufacturers are stronger in some countries in the EEA is sufficient to undermine Arjowiggins' argument that low transportation costs and producers having only one or two centralised manufacturing sites point to there being an EEA-wide (or wider) geographic market. First, as mentioned above, the Commission accepts that cross-border trade flows are consistent with wider geographic markets, but does not consider that they provide conclusive evidence for markets being wider than national. Similarly, the Commission does not consider that the fact that carbonless paper manufacturers often have very different market shares from one country to another - and that even major manufacturers have no sales at all in some countries in the EEA – in itself is conclusive evidence that geographic markets are wider than national. However, it considers that such widely varying market shares give an indication that markets may be national. This conflicting evidence is also one of the reasons why the Commission performs formal geographic market definition tests using statistical analysis.
90. Arjowiggins' support for its claim that the market for carbonless paper is in the process of becoming worldwide, if it is not already so, is not convincing. Even if it were true that EEA producers will in the future sell increasing volumes in Europe, this would not in itself prove that the market is not EEA-wide or even national. The important issue is whether competitive conditions are the same outside and inside Europe and trade flows do not in themselves prove that this is true. That is, one would need to carefully assess whether a 5 to 10% price increase of a monopolist in the EEA would be found unprofitable due to imports from outside of the EEA in order to accept that markets are wider than the EEA. Of course, such an assessment is not even necessary in this case, given that there are strong indications that markets may be national. Thus, it is very unlikely that sales from distant third countries such as the United States of America, where Appleton is based,
46 The fact that the analysis of the gross margin data cast doubts on an EEA-wide geographic market definition and suggests that markets may be national logically implies that such data cannot provide any support for a geographic market definition that is wider than the EEA.

22
could be regarded as a sufficient constraint for the geographic market to be wider than the EEA
91. However, for the sake of completeness, the Commission has investigated that issue further. The quotes from Appleton mentioned above refer to "international" shipments, sales efforts and customer base. There is nothing in these quotes that specifically refers to Appleton's competitive position in the EEA. The Commission also finds that Arjowiggins overestimates the "growing importance of imports". Arjowiggins thus estimates that Appleton will increase its sales by more than 500% from 2007 to 2008 and APP by more than 300%. These estimates hardly seem credible given past increases in imports. However, the Commission notes that even if Arjowiggins were correct in estimating that those companies would significantly increase their sales, it would happen from a very low starting point. Adding the maximum sales attributed by Arjowiggins to Appleton, APP, Meteksan and Mopak in the table above, one arrives at a total volume of 1 150 t in 2007. This should be seen in comparison to the estimates by Arjowiggins stating that the total sales in the EEA in 2007 were almost 393 000 t. The four companies mentioned would therefore together have less than 0.3% of sales in the EEA in 2007. Even a three-fold increase from 2007 to 2008 would still leave them with less than 1%. The importance of these imports is further analysed in Part VI.
92. The examples given by Arjowiggins about customers in South Africa and Turkey are not relevant and the European examples are not quantified and only deal with "some volumes". In any event, the countries mentioned by Arjowiggins where most of these increased activities (for example, by Appleton, Meteksan and Mopak) are taking place are mostly in the 'new' Member States, while the main impact of the transaction is found in the 'old' Member States (EU 15).47 This again is additional evidence that suggests that the EEA market should be partitioned into finer relevant geographic markets.
93. The Commission recognises that a low dollar exchange rate could lead to an increase in imports of carbonless paper from producers outside the EEA. However, it does not consider that this necessarily will change the geographic market definition in the foreseeable future. However, it does recognise that the impact of a low dollar vis-à-vis imports should be taken into account in the competitive assessment in Part VI..
94. Finally, Arjowiggins refers to the replies by customers to the Commission's Phase I market investigation and notes that a majority answered that the market was either EEA or world-wide. Most customers answered the question that asked them to "estimate the geographic scope of the carbonless market as either "EEA-wide" or "worldwide". However, this was part of a Phase I questionnaire which was mainly intended to provide first indications as to whether there are potential competition problems. Complicated issues such as the correct product and geographic market definitions are not decided by simply counting the responses from a market investigation. This is particularly the case when a detailed Phase II investigation has taken place, in which the Commission carefully examined whether prices of reels and sheets are moving together across the EEA using widely accepted geographic market definition techniques.
Conclusion
47 Although competition problems are also identified in Bulgaria, Poland and Slovakia.

23
95. To conclude, there is strong evidence that competitive conditions in the carbonless paper market vary significantly between the countries in the EEA. On balance, the evidence points towards national markets rather than an EEA-wide market. However, it may ultimately be left open as to whether the heterogeneity in supply and demand conditions leads to the relevant markets being national or merely constitutes an instance of strong differentiation along the national dimension because the transaction would significantly impede effective competition in the common market, regardless of whether it is assessed on an EEA-wide basis or on the basis of national markets. Hence, the exact market definition may be left open. The fact that there are indications that the geographic market may be narrower than EEA-wide implies that the geographic market cannot be wider than EEA-wide.
B. Tracing Paper
Product market definition
96. Tracing paper is translucent paper which is manufactured by strongly refining pulp in order to obtain transparency. Cellulose fibre in pure form is translucent; however, air entrapped between fibres makes paper opaque. If fibres are refined/beaten so that all air is taken out, the resulting sheet is translucent.
97. Arjowiggins considers that there are two types of tracing paper which would have different applications48. These types are:
(1) industrial tracing paper: basic white tracing paper mainly used for technical and manual drawings by architects, reprographers and engineering designers (computer aided design "CAD", plain paper copier "PPC", sketching applications);
(2) graphic tracing paper: tracing paper of a higher quality and in different colours and eventually special effects (for example, metallic) which is used by designers and printers for a number of graphic and printing applications such as menu cards, calendars, invitations, mailing cards, envelopes, covers, inserts, brochures, creative leisure applications. Due to these characteristics graphic tracing paper would normally be more expensive than industrial tracing paper.
98. From a supply side perspective, Arjowiggins stated that the "production processes for industrial and graphic tracing paper are basically the same, except that: for coloured graphic tracing paper, dyes need to be put into wet pulp in a part of the paper machine called the "kitchen" at the beginning of the paper-making process [and] the speed [of the paper machine] also needs to be adapted depending on the grammages".
99. As to the product market definition, Arjowiggins argues that - should tracing paper be defined as a separate product market - such a market should only cover industrial tracing paper as this would correspond to the specific needs of professionals. On the market for industrial tracing paper the concentration would, however, not have any impact due to a lack of significant overlap.
48 See "Memorandum for the European Commission - Comments on the Commission's Article 6.1.c Decision" submitted by the notifying party, dated 22 January 2008.

24
100. Arjowiggins first considered graphic tracing paper to be part of the market for "premium fine paper". In the Reply to the Statement of Objections, Arjowiggins considered that graphic tracing paper belongs to the wider market of "all fine papers for graphic use" given high demand-side substitutability. Arjowiggins stated that graphic tracing paper and premium fine paper or fine paper for graphic use could be used indifferently by designers and printers for various applications (for example business cards, complementary slips, menus, corporate or advertising brochures, leaflets, invitations, packaging)
The Commission’s market investigation
101. To date, the Commission has not investigated tracing paper in any previous merger case. Many respondents to the market investigation in the present case confirmed the differences between industrial and graphic tracing paper as far as the application is concerned. In addition, the facts submitted in the course of the market investigation show that prices per ton of industrial and of graphic tracing paper are substantially different. Also, some producers of industrial and graphic tracing paper use separate brands for the two types of tracing paper.49
102. In particular with regard to industrial tracing, many respondents did not see any alternatives at all to this kind of paper. Both industrial and graphic tracing paper were perceived distinct from "fine–" or "premium fine paper"; the vast majority of respondents stated that they or their customers would not switch to alternative products in case of a permanent price increase of 5 to10%50.
103. The Commission's investigation also confirmed that there are no material differences in the production of industrial and graphic tracing paper and showed that those producers who manufacture both types of tracing paper (notably the target, Reflex) do this with the same equipment and are able within a short period of time and without incurring any additional costs to switch between both types of tracing paper51.
Arjowiggins’ response to the Statement of Objections
104. In the Reply to the Statement of Objections Arjowiggins listed a number of arguments as to why industrial and graphic tracing paper did not belong to the same product market. In particular, Arjowiggins noted that "prices for graphic tracing paper (white or coloured) are more than 50% higher and increasing, whereas prices for industrial tracing paper are lower and declining"52. In addition,, Arjowiggins pointed to the fact that the marketing differs for industrial tracing paper and graphic tracing paper due to the fact that there are different end-users.
49 For example, Arjowiggins and M-Real Zanders use specific brands for tracing paper. For Arjowiggins, these are "gateway" and "Curious". The former is used for industrial tracing paper, the latter for graphic applications. Reflex uses the brands "Spectral" for coloured tracing paper, as well as "T2000" and "Medley" for white tracing paper.
50 22 November 2007 Questionnaire to customers of tracing paper;20 December 2007 Questionnaire to customers of tracing paper. See also answers by competing producers of tracing paper, Schoellershammer and Mitsubishi.
51 22 November 2007 Questionnaire to producers of tracing paper; 30 January 2008 Questionnaire to producers of tracing paper; 30 January 2008 Questionnaire to Mitsubishi (tracing paper).
52 See Section 1 of Section C of Section V (Tracing Paper) of the Reply to the Statement of Objections.

25
105. Arjowiggins considers this to strongly indicate that: (a) industrial application customers are unlikely to switch to the graphic application product, as it is substantially more expensive; and (b) the number of marginal graphic application customers who might switch to the less expensive industrial application product is insufficient to prevent the price differential. Industrial and graphic tracing paper would therefore not belong to the same product market.
106. Arjowiggins also submitted an econometric study to provide further support for its arguments.53 This study uses correlation and stationarity tests to show that prices of industrial and graphic tracing papers do not move closely together, which would imply that industrial and graphic tracing papers are in separate product markets.
107. In addition, Arjowiggins considers that graphic tracing paper forms part of a wider market comprising other types of fine paper for graphic use, as these are used for similar applications by the same customers such as, for example, advertising materials, flyers, envelopes, greeting cards and other promotional tools.
108. Both are sold to the same customers for the same needs. The choice whether to use graphic tracing paper or another type of graphic paper would largely be determined by user preference and budget. Also, graphic tracing paper and other types of paper for graphic use would be marketed together. Typically there are pattern booklets comprising graphic tracing paper along with other paper for decorative uses. In support of these indications for these products belonging to the same market, Arjowiggins also noted that the products are distributed through a single sales organisation within Arjowiggins and that price ranges are similar.
109. Arjowiggins further supplements those arguments with an econometric study using correlation and stationarity tests and argues that prices of graphic tracing paper and other types of paper for graphic use move closely together and thus these two products belong to the same market.54
110. Arjowiggins also argues that "graphic and creative papers face competition from a range of differentiated alternatives, none of which compete with industrial tracing paper. These include book linen, PVC and acrylic (for packaging and book coverings) and parchment (for packaging, and text and cover applications)."
53 See Annex 5.1 of the Reply to the Statement of Objections, “Tracing paper: industrial v. graphic applications,” 17 March 2008.
54 See Annex 5.2 of the Reply to the Statement of Objections, “Graphic tracing papers v. other fine papers for graphic use”, 17 March 2008, and “Graphic tracing paper and other fine papers for graphic purposes (Supplement)”, 28 March 2008.

26
Assessment concerning the product market definition
111. As argued by the notifying party, the Commission has found that industrial tracing paper represents a separate product market. Despite the supply side substitutability with graphic tracing paper and the fact that for white tracing paper there could be a partial demand side substitutability the prices for industrial and graphic tracing paper are substantially different and do not correlate. While prices for industrial tracing paper are declining, prices for graphic tracing paper have increased in recent years. Also, while the demand for industrial tracing paper is declining, the demand for graphic tracing paper is increasing. In addition, the marketing and distribution of the two types of graphic tracing paper differs. These differences have been also confirmed by the study provided by Arjowiggins that the Commission has reproduced and agrees with its findings (see Annex 3). In view of this finding, industrial tracing paper represents a separate product market.
112. The Commission considers that also graphic tracing paper represents a separate product market. The Commission's market investigation indicated that customers of graphic tracing paper would not switch to alternative products in the event of a price increase of 5 to10%. Arjowiggins argued in favour of a broader product market, but did not specify which kinds of fine paper for graphic use should be considered as a potential replacement for graphic tracing paper. 55 The methodology applied in the study is not convincing and thus the Commission rejects its findings (see Annex 3). In addition, Arjowiggins concedes that the choice between various "fine paper for graphic use" depends on the customer's budget, admitting that there are considerable price differences of different types of paper for graphic use. In view of these findings, the Commission considers graphic tracing paper to be a separate product market.
113. However, the Commission notes that for the same final applications of graphic tracing paper such as greeting cards, invitations and corporate brochures, there are alternative products from neighbouring markets available (such as metallic paper and parchment). Even if these products, because of their special aesthetic characteristics and prices, cannot be considered as sufficiently close substitutes of graphic tracing paper to be included in the same market, they can nevertheless be used for the same applications and therefore exercise some competitive pressure on graphic tracing paper Also, the econometric analysis described in Annex 3 suggests that there may be some competitive pressure from certain types of fine paper for graphic use, for example, metallics subcategory. This is considered in the competitive assessment in Part VI.
Conclusion on product market definition
114. Based on the information obtained in the market investigation and the information provided by the parties, it should be concluded that: (i) industrial tracing paper constitutes a separate product market; and that (ii) graphic tracing paper is a separate product market.
55 The Commission notes that Arjowiggins’ supplemental analysis of 28 March 2008, in which the price movements of three different types of this other fine paper for graphic use (metallics, particles and touch) are examined, do not even indicate that these three different paper types belong to the same product market.

27
Geographic market definition
115. The notifying party submitted that the market for both types of tracing paper would be at least EEA-wide, if not world-wide in scope due to the European/ global purchasing system, the European/ world-wide brands and similar prices around the world. This initial geographic market definition has been slightly changed in the Reply to the Statement of Objections, in which Arjowiggins still maintains "… that the market for industrial tracing paper may be worldwide"56. However, in terms of the wider market comprising all fine paper for graphic use, Arjowiggins considers this market to be EEA-wide.
116. Based on the results of the market investigation and taking into account the information provided by the notifying party, the geographical scope of the market for industrial tracing paper, as well as the market for graphic tracing paper, covers the EEA. However, the market investigation casts doubts as to a worldwide scope of both of the markets. The majority of customers consider the market to be worldwide57. However, the market investigation shows that producers outside the EEA do not supply tracing paper in the EEA countries, and there are differences between the price levels in the EEA and the other parts of the world.
117. However, the geographic market definition may be left open for both product markets, industrial and graphic tracing paper, since the proposed transaction will not significantly impede effective competition under either market definition.
C. Premium fine paper
Product market definition
118. In previous Commission decisions58 it was left open whether fine paper represents a separate product market and whether this market should be further subdivided.
119. Both parties to the proposed transaction are active in the production of "premium fine paper". The notifying party submits that premium fine paper is high quality woodfree paper, such as letterhead, business cards, complimentary slips, menus, corporate or advertising brochures, leaflets and invitations, premium packaging and translucent papers.
120. The notifying party considers that all types of premium fine paper, including letterhead and tracing paper, belong to the larger product market of fine paper which comprises standard fine paper and premium fine paper. Standard uncoated fine paper is DIN A4 printing paper, basic letterhead paper and basic envelopes. Arjowiggins argues that premium fine paper is part of the overall fine paper market since there would be a certain degree of demand side substitutability between standard and premium fine paper as there would be a continuum between the various quality grades59. However, it concedes that the
56 See Section 2 of Section B of Section V (Tracing Paper) of the Reply to the Statement of Objections. 57 22 November .2007 Questionnaire to customers of tracing paper; 20 December 2007 Questionnaire to
customers of tracing paper. 58 See, for example, Case No COMP/ M.3822 Stora Enso/Schneidersöhne Papier of 25 July2005. 59 Form CO, pages 34 to 38; reply to the Statement of Objections, page 43.

28
premium fine paper has special characteristics which demands different manufacturing process and different pricing strategy than the standard fine paper.60
121. During the market investigation, the vast majority of respondents, customers and competitors indicated the existence of a premium fine paper market consisting of "wood free papers of high quality used for communication for business or private purposes such as letterhead, business cards, premium packaging.61 Those papers present special characteristics that might vary depending on the type of paper: plain, coloured, embossed, translucent, and coated with metallic inks. Due to these specific characteristics and to the specific marketing strategies, premium fine papers are more expensive than standard fine papers.62Also, standard fine paper would normally be a commodity product that is sold in bulk, whereas premium fine paper would be sold in small quantities.63
122. However, in the present case the precise market definition may be left open since the target, Reflex, is not active in the production of standard fine paper and as the transaction would not lead to an impediment to effective competition in a "narrower market" of premium fine paper.
Premium letterhead paper
123. Premium letterhead paper refers to applications, such as stationery paper, corporate brochures, complimentary slips or business cards, has low weight, between 80g and 130g, and it is made of more subtle textures than other types of premium fine paper (hereafter: premium letterhead 80 130g). These papers may be fitted with watermarks and are sold under a variety of brands. One submission in the market investigation pointed to a market of premium letterhead which would consist of premium fine paper used for letterhead application only (hereafter: high-end letterhead).64
124. However, the notifying party points out that for letterhead applications a market consisting of premium fine paper only would be an over-narrowly defined market. The notifying party therefore argues that the market would include not only premium but also standard fine papers (hereafter: standard and premium paper used for letterhead applications). In supporting such a market definition, the notifying party submitted an economic study which indicates that "a majority of respondents reported a clear trend towards less expensive paper in letterhead applications at the expense of premium fine papers." The notifying party also gave examples of customers65 switching from premium fine paper to other grades of (standard) fine paper, such as offset paper for letterhead applications.
60 Form CO, pages 37 and38. 61 20.11. 2007 Questionnaire to competitors; 8.2.2008 Questionnaire to producers of letterhead; 20
November2007 Questionnaire to customers. 62 In most EEA countries, premium fine paper are referred to as "creative papers". They are sometimes also
referred to as "graphic papers" or "specialty papers" 63 Form CO, pages 37 and38. 64 The (anonymous) submission referred to this as "high-end letterhead" market. 65 Customers such as […]* have indicated that they have switched from premium fine paper to a standard fine
paper.

29
125. The notifying party also submits that there are no specific brands for premium letterhead; brands such as Conqueror or Opale are used in many general corporate communication applications, not just letterhead. Similarly it points to the fact that two of Reflex' brands (Medley and Zeta) are used for both letterhead and non-letterhead applications, and four brands (Bankpost, Classic, Gohrsmühle and Reflex Special) only for letterhead applications.
126. As for the supply-side, the notifying party submitted that the production of premium letterhead paper (with or without watermarks) would not require any special know-how and all producers would be able to produce such paper. Reels produced by a paper machine would be cut into smaller reels and put into a sheeting machine to be cut into sheets, mainly A4. In order to insert watermarks, a dandy roll (which would be a very basic device) would be added to the wire section of a paper machine. The dandy roll with a logo in relief would mechanically leave a print in the paper.
127. The notifying party, in the Reply to the Statement of Objections pointed out that its paper machines producing premium letterhead are not dedicated to premium letterhead paper; they are used to produce other types of paper as well. In addition, it noted that even if producers at a particular point in time dedicate machines to the production of premium letterhead paper, this does not detract from the fact that a producer can easily “re-dedicate” to another type of fine paper, or commence using a paper machine to produce both premium letterhead and other types of fine paper.
The Commission's market investigation
128. Some respondents to the market investigation considered that there is a separate market for premium letterhead paper due to a higher quality in comparison with premium fine paper and due to the fact that premium letterhead would often bear watermarks. However, the majority of respondents did not recognise the premium letterhead as a subdivision of premium fine paper; one of them indicated that this was probably the case in the past but now "[…] the market is too small to be considered a subdivision of premium fine paper".
129. On the supply side, the market investigation has shown that some competitors produce their letterhead paper on specific paper machines. However, there were indications that competitors would also be able to use other machines for the production of the letterhead paper.66
130. Based on the above reasons, and as no competition concerns arise in any of the potential markets, namely for premium letterhead 80 to130g, high-end letterhead or standard and premium paper used for letterhead applications, the precise market definition may be left open.
Geographic market
131. The notifying party submitted that the market for premium fine paper, as well as of premium letterhead paper, is EEA-wide since many premium fine paper manufacturers would operate throughout Europe from a limited number of production sites, the costs of
66 20 December 2007 Questionnaire to producers of premium fine paper..

30
transport would be low and most premium fine paper brands would be used in several EEA countries or even all over Europe, for example Conqueror (in Belgium, Eastern Europe, France, Germany, Greece, the Netherlands , Ireland, Italy, Portugal, Scandinavia, Spain and the United Kingdom)67 or Gohrsmühle (for example, in France, Germany and Italy)68.
132. The market investigation broadly confirms the definition of the notifying party. It should therefore be concluded that the market for premium fine paper or for premium letterhead paper is EEA-wide in scope.
D. Paper distribution
Product market definition
133. The notifying party claims that the market for paper distribution should include all distribution channels and not just the sale of paper by wholesalers. In particular, direct sales by manufacturers to customers should also be included as paper merchants now face increasing competitive pressure from such direct sales.69 In previous Commission decisions70 it was found that paper mills are still not able to provide the high service standards which a paper merchant is able to provide in terms of professional sales teams, networks of local warehouses storing of different types of paper or large fleets of trucks and vans, which together allow the paper merchants to effectively supply at short notice a very large number of different-size customers with a large variety of paper products.71 In this case, the exact market definition may be left open as the proposed merger will not significantly impede effective competition under either market definition.
Geographic market definition
134. As regards the geographic market definition, the notifying party states that the market for paper distribution may be considered to be wider than national in scope, because, despite the need for a local presence, the market is undergoing constant evolution on a major scale.
This evolution, according to the notifying party, is demonstrated on the one hand, by the rise of pan-Europeancustomers and, on the other hand, by constraints exerted by competitors situated in particular in small Member States or in specific regions.72 In the Commission Decision of 24 October 2007 in Case No COMP/M.4753 - Antalis/MAP, it was concluded that a national market for the distribution of fine paper through merchants exists in the United Kingdom. It was also concluded that the relevant geographic market for the other
67 Information on www.conqueror.com and Reply to "Questionnaire to the notifying party re distribution of premium fine paper" of 4 January, 2008
68 Reply to "Questionnaire to the notifying party re distribution of premium fine paper" of 4 January , 2008. 69 Form CO, pages 38 and39. 70 In particular, in the recent case COMP/M.4573 Antalis/MAP. 71 Decision of 24 October 2007 in case COMP/M.4753 - Antalis/MAP, Recital 10. 72 Form CO, page 41; the notifying party refers to the Commission Decisions of 10 October 2003 in Case
COMP/M.3227, Paperlinx Buhrmann Paper Merchanting, at Recital 13, and of 23 July 1999 in Case COMP/M.1556, Mo och Domsjö, at Recital 20, which recognised trends going beyond purely national markets. However, the Commission did not have to decide on the market definition in both cases and clearly excluded an European-wide market in the Paperlinx Burhmann Paper Merchanting Decision.

31
parts of the EEA is at least national if not wider.73 In this case it may be left open as to whether the relevant geographic market is national in scope or EEA-wide, as the proposed merger will not significantly impede effective competition in any part of the common market.
VI. COMPETITIVE ASSESSMENT
A. Carbonless Paper
A.1 Non-coordinated effects
A.1.1 The distribution of carbonless paper
135. In the notification, Arjowiggins describes the carbonless paper supply chain as follows:74
136. Arjowiggins submits that carbonless paper is mainly sold to paper merchants, who then sell to printers, who in turn sell to end-users (mainly banks, insurance companies and big industrials). According to Arjowiggins, sales through paper merchants account for more than [60-70]*% of the sales for carbonless paper reels and [90-100]*% of the total sales for carbonless paper sheets. The remaining part is sold directly by paper producers to printers (“direct sales”). Converters account for a marginal part of the overall sales of carbonless paper.
137. Producers often have long and stable relationships with their paper merchants.75 In the notification Arjowiggins only mentions four examples of merchants switching producer of
73 Commission Decision of 24 October 2007 in case COMP/M.4753, Antalis/MAP, Recital 20. 74 Form CO, p. 63.
Carbonless Paper Supply Chain
Merchants
Printers
End-users
Paper Producer

32
carbonless paper since 1998, the last switch happened in 200276. Arjowiggins also stated that "[a]lthough paper merchants are not bound by exclusivity arrangements with carbonless paper producers, they normally purchase carbonless paper from one producer."77
138. According to Arjowiggins, sheet customers are generally small printers whose activity is not focused on carbonless paper. Nearly all sheets are sold via merchants, as it does not make sense for the small sheets printers to buy directly from the manufacturers. In the six largest EEA countries78 Arjowiggins sells between [90-100]*% and [90-100]*% through merchants, and its estimate for its competitors is 100% for all four competitors for all six countries, except for Italy, where Arjowiggins estimates that Torraspapel sells [30-40]*% of its sheets directly to printers. The information received from the four other major producers confirms that the vast majority of sheets are sold through merchants rather than directly to printers.
139. Arjowiggins argues that reel customers are generally large printers. Some of the largest reel printers buy directly from the paper manufacturer. As regards Arjowiggins' own sales in the six largest EEA countries, the percentage sold directly to printers varies from [20-30]*% in Germany to [50-60]*% in Poland. Arjowiggins explains that variation as due to the percentage of large printers in a country. The estimates of Arjowiggins with respect to the direct sales to printers of its major competitors show more variation, as they range from 0% to 100%. It is noteworthy that Arjowiggins estimates that Torraspapel sells [90-100]*% of its reels in Germany and Poland directly to printers, while Arjowiggins estimates that Torraspapel sells [80-90]*% directly to printers in Italy and [90-100]*% in the United Kingdom. As Torraspapel has its own distribution system in France and Spain, this basically means that Torraspapel sells very little through third-party merchants. Arjowiggins estimates that M-Real Zanders sells all its reels through merchants, except in France where Arjowiggins estimates that M-Real Zanders sells [60-70]*% directly to printers.79
140. In order to have a better overview of the way the distribution of carbonless paper functions, the Commission contacted the biggest customers, both merchants and printers, of the five major carbonless paper manufacturers in four major EEA countries, Germany, France, Italy and the United Kingdom.80 In addition, the Commission Decision in Case No COMP/M.4753 Antalis/Map, contains information about the size of merchants in the distribution of fine paper in various EEA countries.81 Many of the "local" merchants are in fact part of large merchant groups, such as Papyrus (Stora Enso), Paperlinx and Inapa. The Commission has combined this information with views from market participants about the
75 Some of the major paper merchants are even financially connected to specific carbonless producers. Antalis is a sister company to Arjowiggins, while Papyrus is owned by Stora Enso, which is a minority shareholder in Mitsubishi HiTec Paper Group (24% as of 31.12.2007 according to Stora Enso Annual Report 2007).
76 Form CO, p.62. 77 Form CO, p. 80. This is confirmed in a report ("Project MAR") presented to the Commission on 11 January
2008 by a consultant hired by the parties. It states that "merchants are the main customers for paper producers. A merchant normally has only one [carbonless paper] supplier and rarely switches to any other due to investment made in marketing and warehousing".
78 Germany, Spain, France, Italy, Poland and the United Kingdom. 79 Arjowiggins reply to Questionnaire of 25 January 2008 on "Distribution of Carbonless Paper". 80 "Questionnaire Customers of Carbonless Paper" of 17 March 2008. 81 Commission Decision of 24 October 2007 in Case No COMP/M.4753 Antalis/Map

33
most important merchants in the carbonless paper markets in order to have a picture of the paper merchants that is as complete as possible.
Germany
141. The Commission Decision in Case No COMP/M.4753 lists as the most important fine paper merchants in Germany, Papyrus (which is owned by Stora Enso and whose main local merchant in Germany is Schneidersöhne82), Igepa83, Paperlinx (Deutsche Papier), Inapa (which in Germany is Papier Union) and Antalis/Map (which is a sister company of Arjowiggins). Together these merchants represent more than 85% of the fine paper merchant market in Germany.
142. Those same merchants are also consistently among those mentioned by German carbonless paper customers as being important merchants of carbonless paper. Only one other merchant, Berberich, is mentioned. It is interesting that while most of these merchants are mentioned as being important for both sheets and reels, […]* is often mentioned for sheets, but only once for reels, while […]* is mentioned only for reels.
143. Each of the merchants referred to in the previous recitals only sell carbonless paper from one producer, except for one merchant which reports having bought a very small quantity from Arjowiggins but mainly sells the paper of one of the competitors. Papyrus' main merchant in Germany is Schneidersöhne which in 2006 sold Mitsubishi's Giroform paper84. Igepa sold M-Real Zanders' Autocopy paper; Deutsche Papier sold Koehler's Reacto paper; Papier Union sold Arjowiggins' Idem. According to their websites, Antalis and Map both sell Idem. The final merchant mentioned, Berberich, sold Idem. Another merchant, which is not mentioned as being among the important ones is Kreuser, which sold Reacto.
144. It is noteworthy that Torraspapel's carbonless paper is not sold by any of the merchants referred to in the previous recitals Torraspapel, therefore, basically does not distribute carbonless paper through merchants in Germany.
145. The information collected by the Commission shows that switching of carbonless paper supplier is infrequent among the German paper merchants: a clear majority had not switched supplier in the last five years.
France
146. The Commission Decision in Case No COMP/M.4753 Antalis/Map lists as the most important fine paper merchants in France, Antalis, Inapa, Papyrus and Torraspapel. Together those merchants represent more than 60% of the fine paper merchant market in France. Another paper merchant mentioned by market participants as important in the carbonless paper market is Malmenayde.
82 Papyrus also owns another local merchant, Classen-Papier, which is much smaller than Schneidersoehne in carbonless paper.
83 Freytag & Petersen, which is part of the Igepa group, is mentioned separately by some printers, but is here treated as part of Igepa.
84 The smaller Papyrus merchant Classen Papier sold Arjowiggins' Idem paper.

34
147. Each of those merchants, except one, only sells carbonless paper from one producer. Antalis and Inapa both sell Idem, and Papyrus sells Giroform and M-Real Zanders' Zar.85 Torraspapel sells its own Eurocalco paper, while Malmenayde sells Reacto.
Italy
148. The Commission Decision in Case No COMP/M.4753 Antalis/MAP lists as the most important fine paper merchants in Italy, Burgo, Paperlinx, whose local merchants in Italy are Polyedra/Carthago, and Torraspapel. Together those merchants represent more than 50% of the fine paper merchant market in Italy. Other paper merchants mentioned by market participants as important in the carbonless paper market are Z-Cart and Augusto Berni.
149. Burgo mainly sells Giroform but in some parts of Italy sells Autocopy reels instead of Giroform reels. Polyedra sell Idem, Reacto and Autocopy. Torraspapel sells Eurocalco. Z-Cart sells Autocopy and Augusto Berni buys both reels and sheets from Arjowiggins.
150. The information collected by the Commission shows that switching of carbonless paper supplier is infrequent among the Italian paper merchants: a clear majority had not switched supplier in the last five years.
United Kingdom
151. The Commission Decision in Case No COMP/M.4753 Antalis/MAP lists as the most important fine paper merchants in the United Kingdom, Paperlinx, Map and Antalis. Together those merchants represent more than 60% of the fine paper merchant market in the United Kingdom. However, one of Map's two merchants in the United Kingdom, the Premier Paper Group, was recently divested as a commitment in order to get the merger in Case No COMP/M.4753 cleared. The acquirer was Beswick, another United Kingdom paper merchant. The other former United Kingdom Map merchant, McNaughton, is now part of Antalis. Antalis and the Paperlinx merchants were also the only ones mentioned as important in the carbonless market by market participants. Together the merchants mentioned in this recital represent more than 60% of the fine paper merchant market in the United Kingdom.
152. Antalis sells Idem, while McNaughton, the new acquisition from MAP, sells Eurocalco and Reacto. The Paperlinx group has three merchants in the United Kingdom: The Paper Company sells Autocopy, Howard Smith sells Giroform and Robert Horne Idem. Each of those merchants only sells carbonless paper from one producer, except for McNaughton which sells both Eurocalco and Reacto.
153. The information collected by the Commission shows that switching of carbonless paper supplier is infrequent among the United Kingdom paper merchants: a clear majority had not switched supplier in the last five years.
85 M-Real Zanders uses the brand name "Zar" in France instead of "Autocopy" used in other parts of the EEA.

35
A.1.2 Market structure
A.1.2.1 The overall carbonless paper market
EEA-wide market
154. In the notification, Arjowiggins estimated the prevailing market structure as follows:
2003 2004 2005 2006 Carbonless paper in the
EEA Volume (Tons)
Market Share
Volume (Tons)
Market Share
Volume (Tons)
Market Share
Volume (Tons)
Market Share
Arjowiggins [150000-200000]*
[30-40]*% [150000-200000]*
[30-40]*% [150000-200000]*
[30-40]*% [100000-150000]*
[30-40]*%
Zanders [50000-100000]*
[10-20]*% [50000-100000]*
[10-20]*% [50000-100000]*
[10-20]*% [50000-100000]*
[10-20]*%
Combined [200000-250000]*
[40-50]*% [200000-250000]*
[40-50]*% [200000-250000]*
[50-60]*% [200000-250000]*
[50-60]*%
Koehler [50000-100000]*
[10-20]*% [50000-100000]*
[10-20]*% [45000-100000]*
[10-20]*% [50000-100000]*
[10-20]*%
Mitsubishi [50000-100000]*
[10-20]*% [50000-100000]*
[10-20]*% [45000-100000]*
[10-20]*% [50000-100000]*
[10-20]*%
Torraspapel [50000-100000]*
[10-20]*% [50000-100000]*
[10-20]*% [45000-100000]*
[10-20]*% [50000-100000]*
[10-20]*%
AeroCopy [0-25000]*
[0-5]*% [0-25000]*
[0-5]*% [0-25000]*
[0-5]*% [0-25000]* [0-5]*%
Carrs [0-25000]*
[0-5]*% [0-25000]*
[0-5]*% [0-25000]*
[0-5]*% [0-25000]* [0-5]*%
KRPA [0-25000]*
[0-5]*% [0-25000]*
[0-5]*% [0-25000]*
[0-5]*% [0-25000]* [0-5]*%
Pasaco [0-25000]*
[0-5]*% [0-25000]*
[0-5]*% [0-25000]*
[0-5]*% [0-25000]* [0-5]*%
APP [0-25000]*
[0-5]*% [0-25000]*
[0-5]*% [0-25000]*
[0-5]*% [0-25000]* [0-5]*%
Meteksan [0-25000]*
[0-5]*% [0-25000]*
[0-5]*% [0-25000]*
[0-5]*% [0-25000]* [0-5]*%
Total [400000-600000]*
100% [400000-600000]*
100% [400000-600000]*
100% [400000-600000]*
100%
155. Apart from market shares, the Herfindahl-Hirschman Index (HHI) provides a measure of overall market concentration. Based on the 2006 data given in the notification, the transaction leads to the following HHI values:
Market share pre HHI post HHI Delta
Arjowiggins [30-40]*% [900-1600]* Zanders [10-20]*% [100-400]* Combined
[50-60]*% [2500-3600]*
Koehler [10-15]*% [100-225]* [100-225]* Mitsubishi [15-20]*% [225-400]* [225-400]* Torraspapel [10-15]*% [100-225]* [100-225]* AeroCopy [0-5]*% [0-25]* [0-25]*

36
Carrs [0-5]*% [0-25]* [0-25]* KRPA [0-5]*% [0-25]* [0-25]* Pasaco [0-5]*% [0-25]* [0-25]* APP [0-5]*% [0-25]* [0-25]* Meteksan [0-5]*% [0-25]* [0-25]* Total
100 [1600-2500]*
[2500-3600]*
[900-1600]*
156. According to Arjowiggins, the combined entity would in 2006 attain a market share of [50-60]*% of sales and [40-50]*% of overall capacity within the EEA. Arjowiggins would become the clear market leader, with a market share exceeding half the market. The combined entity's most important competitors are significantly smaller: Mitsubishi [10-20]*%, Koehler [10-20]*% and Torraspapel [10-20]*%. There are a number of marginal players with market shares up to [0-5]*%. The respondents to the market investigation have broadly confirmed the prevailing market structure.
157. The parties' very high market share ([50-60]*%), together with the high increase in market share caused by the proposed transaction ([10-20]*%), already by itself provides indications that the merged entity is likely to find it profitable, post-merger, to unilaterally raise prices.86 After the transaction, the merged entity will be by far the largest supplier of carbonless paper on the EEA market. The difference between the market share of the merged entity, and the market shares of the three remaining rivals, Mitsubishi, Koehler and Torraspapel, will be considerable: the merged entity's market share will be higher than that of the three remaining rivals combined.
158. Measured by HHI, the already high concentration level increases by [900-1600]* points to [2500-3600]*, far above the safe harbours provided by the Guidelines on the assessment of horizontal mergers under the Council Regulation on the control of concentrations between undertaking (the Horizontal Merger Guidelines).87 The large increase of [900-1600]* points, or more than 50% of the pre-merger concentration level, is particularly striking. This implies that the merged entity may find it profitable to unilaterally raise prices, as a possible loss of volumes due to a shift of demand to one or several of the rivals would be compensated by the increased price on the very large remaining volumes. In this context, it should be noted that according to the market investigation, many customers cannot change supplier at short notice.88
159. During the Phase II market investigation, Arjowiggins provided new data for the years 2005 and 2006 as well as data for 2007 using information from Arjowiggins but also confidential sales data from M-Real Zanders. The exact market share figures that result
86 Guidelines on the assessment of horizontal mergers under the Council Regulation on the control of concentrations between undertakings (OJ C 31, 5.2.2004, p. 5), at paragraphs 17 and 25.
87 Guidelines on the assessment of horizontal mergers under the Council Regulation on the control of concentrations between undertakings (OJ C 31, 5.2.2004, p. 5), at paragraphs 19 and 20.
88 Out of 21 customers who answered to a question about combining carbonless paper from different suppliers in one customer order, the vast majority saw difficulties in doing so. A clear majority also replied that brands were important to their customers, mainly because of consistency of quality. (Second phase questionnaire to customers of carbonless paper).

37
from such data are therefore confidential to Arjowiggins and can only be given as ranges in this Decision.
160. The new data showed lower market shares for Arjowiggins and Reflex for 2006 than those provided in the notification. They also showed that Arjowiggins would have lost market share in 2007, leading to a lower combined market share of the parties in 2007 than in 2006.
161. According to the revised market shares, Arjowiggins would have had [30-40]% in 2006 and Reflex [10-20]*%, while the market shares for 2007 would be Arjowiggins [30-40]% and Reflex [15-20]%. The combined market share would therefore be [40-50]*% in 2006 (instead of the [50-60]*% given in the notification) and [40-50]*% in 2007.
162. One main difference between the market shares in the notification, and those submitted in Phase II, is that in the new data Arjowiggins attributes a higher combined market share to the smaller competitors in the market. Among other changes, Arjowiggins has identified several minor competitors that it had not mentioned in the notification, the two most important being Divipa with [0-2]% market share in 2007 and Xerox with [0-2]%.
163. The Commission has verified the notifying party's market share estimates by requesting sales data from the main market participants.89 The overall picture given by the notifying party is broadly consistent with the data received from the market participants. Arjowiggins and Reflex would together have either just above or just below 50% with a large increase in the market share coming from Reflex. There would be only three other significant competitors at the EEA level and the new entity would have a larger market share than these three competitors combined. The post-merger HHI would be close to [2500-3600]* with an increase above 50% of its pre-merger value.
164. In respect to the 2007 data it should be noted that […]*90. […]*.Without the […]*, Arjowiggins' market share would likely have been higher in 2007. Because […]* constituted an exogenous event, any temporary reduction in market share caused by the […]* would not reflect a change in competitive conditions or, indeed, Arjowiggins’ market power.
National markets
165. In the notification, Arjowiggins provides country by country market shares for the overall carbonless paper market (both reels and sheets) on a volume basis91. Arjowiggins did not provide data for Cyprus, Estonia, Lithuania, Latvia and Malta, and provided no separate data for Luxembourg, which was included in the Belgium data.
166. During the Phase II investigation, Arjowiggins provided new national market share figures and included also the countries that were missing in the notification.92 The structure that emerges from that data on the various national markets is described below. The extent
89 "Questionnaire to producers of carbonless paper" of 20 December 2007; "Questionnaire to producers of carbonless paper" of 30 January 2008.
90 Email from Arjowiggins of 17 January 2008. 91 Form CO, Annex 7.A. 92 Except for Belgium and Luxembourg for which the data are still given together.

38
to which this structure was confirmed by the Commission's market investigation is discussed later.
Austria
167. In Austria, 5.4kt of carbonless paper was sold in 2007, amounting to 1.4% of EEA sales.
168. The parties would in 2007 have a combined market share of [50-60]%, with Reflex adding [0-5]*% to Arjowiggins' [50-60]%. Mitsubishi had [20-30]% and Koehler had [20-30]%. Reflex had [0-5]*% in 2005 and 2006.
Belgium and Luxembourg
169. In Belgium and Luxembourg 7.8kt of carbonless paper was sold in 2007, amounting to 2% of EEA sales.
170. The parties would in 2007 have a combined market share of [70-80]%, with Reflex adding [10-20]*% to Arjowiggins' [50-60]%. Mitsubishi had [15-20]%, Torraspapel [5-10]% and Koehler had [2-5]%. In addition, a few very small competitors were present. In 2005 the combined market share of the parties would have been [50-60]% and in 2006 [60-70]%.
Bulgaria
171. In Bulgaria 4.5kt of carbonless paper was sold in 2007, amounting to 1.2% of EEA sales.
172. The parties would in 2007 have a combined market share of [10-20]%, with Reflex adding [5-10]% to Arjowiggins' [5-10]%. Koehler had [20-30]%, Mitsubishi [20-30]%, Torraspapel [10-15]% and Koehler [10-15]%. In addition, smaller competitors were present. The combined market share of the parties was [10-20]*% in 2005 and [5-10]% in 2006.
Cyprus
173. In Cyprus 1 kt of carbonless paper was sold in 2007, amounting to 0.3% of EEA sales.
174. The parties would in 2007 have a combined market share of [60-80]%, with Reflex adding [50-60]% to Arjowiggins' [10-20]*%. Koehler had [20-30]% and Torraspapel [5-10]%. The combined market share for the parties was [70-80]% in 2005 and [60-70]% in 2006.
Czech Republic
175. In the Czech Republic 11.2 kt of carbonless paper was sold in 2007, amounting to 2.8% of EEA sales.
176. The parties would in 2007 have a combined market share of [5-10]%, with Reflex adding [0-5]*% to Arjowiggins' [0-5]*%. KRPA had [50-60]% and Mitsubishi and Koehler both [15-20]%. In addition, very small competitors were present. The combined market share of the parties was [5-10]% in 2005 and [5-10]% in 2006.

39
Germany
177. In Germany 68.2 kt of carbonless paper was sold in 2007, amounting to 17.4% of EEA sales.
178. The parties would in 2007 have a combined market share of [50-60]%, with Reflex adding [20-30]% to Arjowiggins' [20-30]%. Mitsubishi had [20-30]%, Koehler [15-20]% and Torraspapel [2-5]%. In addition, very small competitors were present. In 2005, the combined market share of the parties would have been [50-60]% and in 2006 [50-60]%.
Denmark
179. In Denmark 2.4 kt of carbonless paper was sold in 2007, amounting to 0.6% of EEA sales.
180. The parties would in 2007 have a combined market share of [60-70]%, with Reflex adding [30-40]% to Arjowiggins' [20-30]%. Mitsubishi had [15-20]%, Koehler [10-15]% and Pasaco [2-5]%. In 2005 the combined market share would have been [70-80]% and in 2006 [70-80]%.
Estonia
181. In Estonia 0.04 kt of carbonless paper was sold in 2007, amounting to 0.01% of EEA sales.
182. Reflex had [0-5]*% in Estonia in the years 2005 to 2007. Arjowiggins had [50-60]% in 2005, but [0-5]*% in 2006 and 2007.
Greece
183. In Greece 11.2 kt of carbonless paper was sold in 2007, amounting to 2.8% of EEA sales.
184. The parties would in 2007 have a combined market share of [20-30]%, with Reflex adding [10-20]*% to Arjowiggins' [10-20*]%. Mitsubishi had [30-40]%, Torraspapel [15-20]%, Koehler [15-20]%, APP [2-5]% and KRPA [2-5]%. The combined market share of the parties was [30-40]% in 2005 and [20-30]% in 2006.
Spain
185. In Spain 32.2 kt of carbonless paper was sold in 2007, amounting to 8.2% of EEA sales.
186. The parties would in 2007 have a combined market share of [30-40]%, with Reflex adding [0-5]*% to Arjowiggins' [30-40]. Torraspapel had [30-40], Divipa [10-15]%, Koehler [10-15]% and Mitsubishi [0-2]%. The combined market share of the parties was [30-40]% in 2005 and [30-40]% in 2006.
Finland
187. In Finland 3.4 kt of carbonless paper was sold in 2007, amounting to 0.9% of EEA sales.

40
188. Reflex only had [0-5]*% in Finland in the years 2005 to 2007, while Arjowiggins had [40-50]% in 2005, [40-50]% in 2006, and [30-40]% in 2007.
France
189. In France 49.2 kt of carbonless paper was sold in 2007, amounting to 12.5% of EEA sales
190. The parties would in 2007 have a combined market share of [50-60]%, with Reflex adding [5-10]% to Arjowiggins' [40-50]%. Torraspapel had [20-30]%, Koehler [10-15]% and Mitsubishi [10-15]%. In addition, very small competitors were present. The combined market share of the parties was [60-70]% in 2004 and [50-60]% in 2005.
Hungary
191. In Hungary, 7.2kt of carbonless paper was sold in 2007, amounting to 1.8% of EEA sales.
192. The parties would in 2007 have a combined market share of [30-40]%, with Reflex adding [20-30]% to Arjowiggins' [10-20]*%. Koehler had [20-30]%, KRPA [15-20]%, Torraspapel [10-15]% and Mitsubishi [10-15]%. The combined market share of the parties was [30-40]% in 2004 and [20-30]% in 2005.
Ireland
193. In Ireland, 3.2 kt of carbonless paper was sold in 2007, amounting to 0.8% of EEA sales.
194. The parties would in 2007 have a combined market share of [50-60]%, with Reflex adding [0-5]*%. Mitsubishi had [20-30]% and Torraspapel [15-20]%. The combined market share of the parties was [50-60]% in 2005 and [50-60]% in 2006, with Reflex adding [5-10]% in 2005 and [0-5]*% in 2006.
Iceland
195. In Iceland, 0.2 kt of carbonless paper was sold in 2007, amounting to 0.1% of EEA sales.
196. Arjowiggins had a market share of [90-100]% in 2005, [70-80]% in 2006, and [70-80]% in 2007. The main competitors were Koehler and Mitsubishi, while Reflex only had [0-5]*% in Iceland in each of those three years.
Italy
197. In Italy 54.9 kt of carbonless paper was sold in 2007, amounting to 14% of EEA sales.
198. The parties would in 2007 have a combined market share of [60-80]%, with Reflex adding [20-30]% to Arjowiggins' [40-50]%. Mitsubishi had [10-20]%, Torraspapel [5-10]% and Koehler [5-10]%. In addition, a few smaller competitors were present. In both 2005 and 2006, the combined market share of the parties would have been [60-70]%.

41
Lithuania
199. In Lithuania 0.9 kt of carbonless paper was sold in 2007, amounting to 0.2% of EEA sales.
200. Both parties had [0-5]*% in Lithuania in each of the years 2005 to 2007.

42
Latvia
201. In Latvia 1.5 kt of carbonless paper was sold in 2007, amounting to 0.4% of EEA sales.
202. Reflex had a market share of [0-5]*% and Arjowiggins [0-5]*% in each of the years 2005 to 2007.
Malta
203. In Malta 0.1 kt of carbonless paper was sold in 2007, amounting to 0.04% of EEA sales.
204. The parties would in 2007 have a combined market share of [50-60]%, with Reflex adding [30-40]% to Arjowiggins' [10-20]*%. APP had [20-30]%, Mitsubishi [10-15]% and Pasaco [10-15]%. In 2005 the combined market share of the parties would have been [70-80]% and in 2006 [60-70]%.
Netherlands
205. In the Netherlands 12.6 kt of carbonless paper was sold in 2007, amounting to 3.5% of EEA sales.
206. The parties would in 2007 have a combined market share of [30-40]%, with Reflex adding [10-20]*% to Arjowiggins' [20-30]%. Mitsubishi had [20-30]%, Torraspapel [15-20]%, Xerox [10-15]% and Koehler [5-10]%. In 2005 the combined market share of the parties would have been [40-50]%, and in 2006 [40-50]%.
Norway
207. In Norway 1.3 kt of carbonless paper was sold in 2007, amounting to 0.3% of EEA sales.
208. Reflex only had a market share of [0-5]*% in Norway in the years 2005 to 2007. Arjowiggins had [40-50]% in 2005, [40-50]% in 2006, and [30-40]% in 2007.
Poland
209. In Poland 39.8 kt of carbonless paper was sold in 2007, amounting to 10.1% of EEA sales.
210. The parties would in 2007 have a combined market share of [40-50]%, with Reflex adding [10-20]*% to Arjowiggins' [30-40]%. Koehler had [20-30]%, Goricane [15-20]%, Pasaco [10-15]%, Mitsubishi [2-5]% and Torraspapel [2-5]%. In addition, a few very small competitors were present. In 2005 the combined market share of the parties would have been [40-50]% and in 2006 [40-50]%.
Portugal
211. In Portugal 9.2 kt of carbonless paper was sold in 2007, amounting to 2.4% of EEA sales.

43
212. The parties would in 2007 have a combined market share of [20-30]%, with Reflex adding [0-5]*% to Arjowiggins' [20-30]%. Torraspapel had [30-40]%, Mitsubishi [15-20]%, Koehler [10-15]% and Divipa [10-15]%. The combined market share of the parties was [30-40]% in 2005 and [30-40]% in 2006, with Reflex adding [5-10]% in 2005, and [5-10]% in 2006.
Romania
213. In Romania 6.7 kt of carbonless paper was sold in 2007, amounting to 1.7% of EEA sales.
214. The parties would in 2007 have a combined market share of [10-20]*%, with Reflex adding [5-10]% to Arjowiggins' [10-20]*%. Koehler had [30-40]%, Mitsubishi [20-30]%, KRPA [15-20]%% and Torraspapel [5-10]%. In addition, smaller competitors were present. The combined market share of the parties was [5-10]% in 2005 and [10-20]% in 2006.
Sweden
215. In Sweden 3.9 kt of carbonless paper was sold in 2007, amounting to 1% of EEA sales.
216. The parties would in 2007 have a combined market share of [50-70]%, with Reflex adding [20-30]% to Arjowiggins' [30-40]%. Mitsubishi had [30-40]% and Koehler [2-5]%. In both 2005 and 2006, the combined market share of the parties would have been [60-70]%.
Slovakia
217. In Slovakia 3.3 kt of carbonless paper was sold in 2007, amounting to 0.8% of EEA sales.
218. The parties would in 2007 have a combined market share of [60-70]%, with Reflex adding [50-60]% to Arjowiggins' [10-20]*%. Koehler had [20-30]%, KRPA [5-10]%, Pasaco and Torraspapel both [2-5]% and Mitsubishi [2-5]%. The combined market share of the parties was [50-60]% in 2005 and [50-60]% in 2006.
Slovenia
219. In Slovenia 3.2 kt of carbonless paper was sold in 2007, amounting to 0.8% of EEA sales.
220. The parties would in 2007 have a combined market share of [30-40]%, with Reflex adding [20-30]% to Arjowiggins' [5-10]%. Mitsubishi had [40-50]%, Goricane [15-20]% and Pasaco and APP both [2-5]%. The combined market share of the parties was [20-30]% in 2005, and [40-50]% in 2006.
United Kingdom
221. In the United Kingdom 47.1 kt of carbonless paper was sold in 2007, amounting to 12% of EEA sales.

44
222. The parties would in 2007 have a combined market share of [50-60]%, with Reflex adding [20-30]% to Arjowiggins' [20-30]%. Mitsubishi had [20-30]%, Koehler [15-20]% and Torraspapel [2-5]%. In addition, very small competitors were present. The combined market share of the parties would have been [50-60]% in 2005 and [50-60]% in 2006.
The Commission's data
223. The Commission has reconstructed market shares on a national basis for the years 2005 to 2007 based on sales data from the parties and their main competitors. 93 Although not identical in all details with those of the parties, these data confirm the main picture given by the parties for most countries in the EEA. There are, however, certain large differences in the market shares attributed to the various competitors, including those of the parties, where they have not estimated the overall size of the market correctly. In particular, the Commission's data shows that Reflex in Austria had a market share of [10-20]*%, instead of [0-5]*% as submitted by the parties. In France, the parties would have a combined market share slightly below 50% instead of slightly above, as indicated by the parties' data. In Malta, the parties overestimated their combined market share significantly. In the Netherlands, the parties substantially overestimated the size of the market and the sales of competitors; the parties' combined market share is actually [50-60]%. In Poland, the parties have a combined market share of [50-60]%, instead of [40-50]%. In Slovenia, the combined market share is just above 40%, instead of below as submitted by the parties; however, the market share figures for Slovenia seem very volatile.
224. The market share data show significant variations from one national market to the next. The parties would have a high combined market share in many national markets. The parties seem less strong in some of the Eastern European EEA countries and in the Iberian peninsula. This seems often to be related to the presence of some smaller local producers. Torraspapel has a clear geographical focus and is particularly strong in Spain and Portugal, and it has a solid presence in France and also a market share above 10% in the Benelux and Ireland. It has almost no presence in Germany. Koehler and Mitsubishi have a less clear geographical footprint than Torraspapel. However, there are also strong variations for those three competitors from one national market to the next, although they tend to be present in all the major markets, except for Spain where Mitsubishi has very little sales.
225. On a number of markets, the parties would either have a very high combined market share or a moderately high combined market share with a substantial increment. This would be the case in the following national markets: Austria, Belgium/Luxembourg, Cyprus, Germany, Denmark, France, Italy, the Netherlands, Poland, Sweden, Slovakia and the United Kingdom. It is noteworthy that the sales in these countries account for about 75% of 2007 EEA sales of carbonless paper, with four of these countries (Germany, France, Italy and the United Kingdom) accounting for more than 55% of the total sales in the EEA.
93 "Questionnaire to producers of carbonless paper" of 20 December 2007; "Questionnaire to producers of carbonless paper" of 30 January 2008.

45
A.1.2.2 Reels and sheets markets
EEA-wide market
226. As mentioned in the section on product market definition the Commission has concluded that reels and sheets may be separate relevant product markets. In the notification, Arjowiggins did not provide market shares based on such a division. The Commission asked Arjowiggins for such market shares during the Phase II investigation. These data show that the merged entity would have a market share of around 50% in both reels and sheets. However, this position would be achieved in different ways in reels and sheets.
227. The data provided by Arjowiggins in the Phase II investigation give the following market structure for reels:
REELS
2005 2006 2007 Carbonless reels in the EEA Market Share Market Share Market Share
Arjowiggins [30-40]% [30-40]% [20-30]% Reflex [10-20]*% [10-20]*% [10-20]*% Combined [40-50]*% [40-50]*% [40-50]*% Koehler [15-20]% [15-20]% [15-20]% Mitsubishi [15-20]% [15-20]% [15-20]% Torraspapel [10-15]% [10-15]% [10-15]% AeroCopy/Goricane [2-5]% [2-5]% [2-5]% APP [0-2]% [0-2]% [0-2]% Appleton [0-2]% [0-2]% [0-2]% Carrs [0-2]% [0-2]% [0-2]% Divipa [0-2]% [0-2]% [0-2]% Fabriano [0-2]% [0-2]% [0-2]% Glatfelter [0-2]% [0-2]% [0-2]% Hauffe [0-2]% [0-2]% [0-2]% Jujo [0-2]% [0-2]% [0-2]% KRPA [2-5]% [2-5]% [2-5]% Meteksan [0-2]% [0-2]% [0-2]% Pasaco [2-5]% [2-5]% [2-5]% Xerox [0-2]% [0-2]% [0-2]% Total 100% 100% 100%
228. It is noteworthy that Reflex has increased its market share in recent years. The merger would lead to a dramatic change in the structure in the reels market. Based on the 2007

46
market shares, the post-merger HHI would be close to [2500-3600] with an increase in HHI above 60094.
229. The data provided by Arjowiggins in the Phase II investigation give the following market structure for sheets:
SHEETS
2005 2006 2007 Carbonless sheets in the EEA Market Share Market Share Market Share
Arjowiggins [40-50]% [40-50]% [40-50]% Reflex [5-10]% [5-10]% [5-10]% Combined [50-60]% [50-60]% [40-50]*% Koehler [5-10]% [10-15]% [10-15]% Mitsubishi [20-30]% [15-20]% [15-20]% Torraspapel [10-15]% [10-15]% [10-15]% AeroCopy/ Goricane
[0-2]% [0-2]% [0-2]%
APP [0-2]% [0-2]% [0-2]% Appleton [0-2]% [0-2]% [0-2]% Carrs [0-2]% [0-2]% [0-2]% Divipa [0-2]% [0-2]% [2-5]% Fabriano [0-2]% [0-2]% [0-2]% Glatfelter [0-2]% [0-2]% [0-2]% Hauffe [0-2]% [0-2]% [0-2]% Jujo [0-2]% [0-2]% [0-2]% KRPA [0-2]% [0-2]% [0-2]% Meteksan [0-2]% [0-2]% [0-2]% Pasaco [0-2]% [0-2]% [0-2]% Zicunaga [0-2]% [0-2]% [0-2]% Xerox [2-5]% [2-5]% [2-5]% Total 100% 100% 100%
230. In sheets, Arjowiggins is already much larger than any of its rivals, while Reflex here is the smallest of the four other major producers. Together the parties would have just around 50%. The post-merger HHI would be above 3 000 and the change in the HHI above 400.95
94 Here calculated as the change in the HHI if the lower ends of the ranges are applied (2x20x15). 95 Here calculated as the change in the HHI if the lower ends of the ranges are applied (2x40x5).

47
National markets
231. On the basis of national geographic markets, the data provided by Arjowiggins indicate that the following market structures arise.
Austria, reels
232. In Austria 4.6 kt of carbonless paper reels was sold in 2007, amounting to 1.5% of EEA sales of reels.
233. The parties would in 2007 have a combined market share of [50-60]%, with Reflex adding [0-5]*% to Arjowiggins' [50-60]%. Mitsubishi had [20-30]% and Koehler [20-30]%. Reflex also had [0-5]*% in 2005 and 2006.
Austria, sheets
234. In Austria 0.8 kt of carbonless paper sheets was sold in 2007, amounting to 0.9% of EEA sales of sheets.
235. The parties would in 2007 have a combined market share of [40-50]%, with Reflex adding [5-10]% to Arjowiggins' [30-40]%. Mitsubishi had [40-50]% and Koehler [10-15]%. In addition, Arjowiggins attributed a market share of [2-5]% to Xerox. Reflex had [0-5]*% in 2005 and [0-5]*% in 2006.
Belgium and Luxembourg, reels
236. In Belgium and Luxembourg 5.7 kt of carbonless paper reels was sold in 2007, amounting to 1.9% of EEA sales of reels.
237. The parties would in 2007 have a combined market share of [70-80]%, with Reflex adding [10-20]*% to Arjowiggins' [50-60]%. Mitsubishi had [15-20]%, Torraspapel [5-10]%, Koehler [0-2]% and Goricane [0-2]%. In 2005 the combined market share would have been [50-60]% and in 2006 [60-70]%.
Belgium and Luxembourg, sheets
238. In Belgium and Luxembourg 2.2 kt of carbonless paper sheets was sold in 2007, amounting to 2.3% of EEA sales of sheets.
The parties would in 2007 have a combined market share of [50-60]%, with Reflex adding [10-20]*% to Arjowiggins' [40-50]%. Mitsubishi had [20-30]%, Torraspapel [5-10]% and Koehler [5-10]%. In 2005 the combined market share would have been [60-70]%, and in 2006 [50-60]%.
Bulgaria, reels
239. In Bulgaria 3.4 kt of carbonless paper reels was sold in 2007, amounting to 1.1% of EEA sales of reels.
240. The parties would in 2007 have a combined market share of [10-20]*%, with Reflex adding [5-10]% to Arjowiggins' [0-5]*%. Koehler had [30-40]%, Mitsubishi [15-20]% and

48
Torraspapel [5-10]%. In addition, smaller competitors were present. The combined market share of the parties was [5-10]% in 2005 and [5-10]% in 2006.
Bulgaria, sheets
241. In Bulgaria 1.2 kt of carbonless paper sheets was sold in 2007, amounting to 1.2% of EEA sales of sheets.
242. The parties would in 2007 have a combined market share of [10-20]*%, with Reflex adding [0-5]*% to Arjowiggins' [10-20]*%. Mitsubishi had [30-40]%, Torraspapel [20-30]% and Koehler [10-15]%. In addition, smaller competitors were present. The combined market share of the parties was [30-40]% in 2005 and [10-20]*% in 2006.
Cyprus, reels
243. In Cyprus 0.3kt of carbonless paper reels was sold in 2007, amounting to 0.1% of EEA sales of reels.
244. The parties would in 2007 have a combined market share of [above 80]%, with Reflex adding [above 80]% to Arjowiggins' [5-10]%. The only competitor is Koehler with [5-10]%. The combined market share for the parties was [above 80]% in 2005 and [70-80]% in 2006.
Cyprus, sheets
245. In Cyprus 0.7 kt of carbonless paper sheets was sold in 2007, amounting to 0.8% of EEA sales of sheets.
246. The parties would in 2007 have a combined market share of [50-60]%, with Reflex adding [40-50]% to Arjowiggins' [10-20]*%. Koehler had [30-40]% and Torraspapel [5-10]%. The combined market share for the parties was [50-60]% in 2005 and [40-50]% in 2006.
Czech Republic, reels
247. In the Czech Republic 10 kt of carbonless paper reels was sold in 2007, amounting to 3.4% of EEA sales of reels
248. The parties would in 2007 have a combined market share of [5-10]%, with Reflex adding [0-5]*% to Arjowiggins' [0-5]*%. KRPA had [60-70]%, Mitsubishi [15-20]% and Koehler [15-20]%. In addition, very small competitors were present. The combined market share of the parties was [5-10]% in 2005 and [5-10]% in 2006.
Czech Republic, sheets
249. In the Czech Republic 1.1 kt of carbonless paper sheets was sold in 2007, amounting to 1.2% of EEA sales of sheets.
250. The parties would in 2007 have a combined market share of [10-20]*%, with Reflex adding [0-5]*% to Arjowiggins' [10-20]*%. Koehler had [30-40]%, Mitsubishi [20-30]%
49
and Torraspapel [15-20]%. In addition, smaller competitors were present. The combined market share of the parties was [10-20]*% in 2005 and [10-20]*% in 2006.
Germany, reels
251. In Germany 55.7kt of carbonless paper reels was sold in 2007, amounting to 18.6% of EEA sales of reels.
252. The parties would in 2007 have a combined market share of [40-50]%, with Reflex adding [20-30]% to Arjowiggins' [20-30]%. Mitsubishi had [20-30]%, Koehler [20-30]% and Torraspapel [2-5]%. In addition, very small competitors were present. In 2005 the combined market share would have been [50-60]%, and in 2006 [50-60]%.
Germany, sheets
253. In Germany 12.4 kt of carbonless paper sheets was sold in 2007, amounting to 13.3% of EEA sales of sheets.
254. The parties would in 2007 have a combined market share of [70-80]%, with Reflex adding [10-20]*% to Arjowiggins' [50-60]%. Mitsubishi had [20-30]%, Koehler [5-10]% and Torraspapel [0-2]%. In addition, very small competitors were present. In both 2005 and 2006 the combined market share would have been [70-80]%.
Denmark, reels
255. In Denmark 2 kt of carbonless paper reels was sold in 2007, amounting to 0.7% of EEA sales of reels.
256. The parties would in 2007 have a combined market share of [60-70]%, with Reflex adding [40-50]% to Arjowiggins' [20-30]%. Mitsubishi had [15-20]%, Koehler [15-20]% and Pasaco [5-10]%. In 2005, the combined market share would have been [70-80]% and in 2006 [70-80]%.
Denmark, sheets
257. In Denmark 0.4 kt of carbonless paper sheets was sold in 2007, amounting to 0.4% of EEA sales of sheets.
258. The parties would in 2007 have a combined market share of [60-70]%, with Reflex adding [0-5]*% to Arjowiggins' [60-70]%. Mitsubishi had [20-30]%, APP [10-15]% and Xerox [2-5]%. In 2005 the combined market share of the parties would have been [70-80]%,and in 2006 [60-70]%. However, Reflex had only [0-5]*% in 2005 and [0-5]*% in 2006.
Estonia, reels
259. In Estonia 0.04 Kt of carbonless paper reels was sold in 2007, amounting to 0,01% of EEA sales of reels.
260. Both of the parties had market shares in the [0-5]*% range in Estonia in the years 2005 to 2007.

50
Estonia, sheets
261. In Estonia the sales of carbonless paper sheets in 2007 are unknown.
262. Arjowiggins gives very little data for the Estonian sheets market. It stated that Arjowiggins had [above 80]% of the market in 2005, but then gave no figures for the parties, or any of their competitors, in 2006.
Greece, reels
263. In Greece 8.4Kt of carbonless paper reels was sold in 2007, amounting to 2.8% of EEA sales of reels.
264. The parties would in 2007 have a combined market share of [20-30]%, with Reflex adding [10-20]*% to Arjowiggins' [5-10]%. Mitsubishi had [40-50]%, Koehler and Torraspapel both [15-20]% and KRPA [2-5]%. In addition, very small competitors were present. The combined market share of the parties was [20-30]% in 2005 and [20-30]% in 2006.
Greece, sheets
265. In Greece 2.8 Kt of carbonless paper sheets was sold in 2007, amounting to 3.0% of EEA sales of sheets.
266. The parties would in 2007 have a combined market share of [20-30]%, with Reflex adding [5-10]% to Arjowiggins' [10-20]*%. Torraspapel had [20-30]%, Koehler [15-20]%, Mitsubishi [15-20]% and APP [15-20]%. The combined market share of the parties was [30-40]% in 2005,and [20-30]% in 2006.
Spain, reels
267. In Spain 20.6 Kt of carbonless paper reels was sold in 2007, amounting to 6.9% of EEA sales of reels.
268. The parties would in 2007 have a combined market share of [30-40]%, with Reflex adding [0-5]*% to Arjowiggins' [30-40]%. Torraspapel had [30-40]%, Divipa [15-20]%, Koehler [10-15]% and Mitsubishi [0-2]%. The combined market share of the parties was [30-40]% in 2005 and [30-40]% in 2006.
Spain, sheets
269. In Spain 11.7 Kt of carbonless paper sheets was sold in 2007, amounting to 12.4% of EEA sales of sheets.
270. The parties would in 2007 have a combined market share of [30-40]%, with Reflex adding [0-5]*% to Arjowiggins' [30-40]%. Torraspapel had [30-40]%, Divipa [10-15]%, Koehler [10-15]% and Mitsubishi [0-2]%. The combined market share of the parties was [30-40]% in 2005 and [30-40]% in 2006.

51
Finland, reels
271. In Finland 2.1 Kt of carbonless paper reels was sold in 2007, amounting to 0.7% of EEA sales of reels.
272. Reflex only had a market share of [0-5]*% in the years 2005 to 2007, while Arjowiggins had [40-50]% in 2005, [50-60]% in 2006, and [40-50]% in 2007.
Finland, sheets
273. In Finland 1.3 Kt of carbonless paper sheets was sold in 2007, amounting to 1.4% of EEA sales of sheets.
274. Reflex had a market share of [0-5]*% in Finland in the years 2005 to 2007, while Arjowiggins had [20-30]% in 2005, [20-30]% in 2006, and [10-20]*% in 2007.
France, reels
275. In France 36.4 Kt of carbonless paper reels was sold in 2007, amounting to 12.2% of EEA sale of reels.
276. The parties would in 2007 have a combined market share of [40-50]%, with Reflex adding [5-10]% to Arjowiggins' [30-40]%. Torraspapel had [20-30]%, Koehler [15-20%] and Mitsubishi [10-15]%. In addition, very small competitors were present. In 2005 the combined market share would have been [50-60]% and in 2006 [50-60]%.
France, sheets
277. In France 12.8 Kt of carbonless paper sheets was sold in 2007, amounting to 13.7% of EEA sales of sheets.
278. The parties would in 2007 have a combined market share of [60-70]%, with Reflex adding [5-10]% to Arjowiggins' [60-70]%. Torraspapel had [15-20]%, Mitsubishi [10-15]% and Koehler [5-10]%. In addition, very small competitors were present. In 2005 the combined market share would have been [above 80]% and in 2006 [60-70]%.
Hungary, reels
279. In Hungary 5.1Kt of carbonless paper reels was sold in 2007, amounting to 1.7% of EEA sales of reels.
280. The parties would in 2007 have a combined market share of [40-50]%, with Reflex adding [20-30]% to Arjowiggins' [10-20]*%. KRPA had [20-30]%, Koehler [15-20]% and Mitsubishi [10-15]%. The combined market share of the parties was [30-40]% in 2005 and [30-40]% in 2006.
Hungary, sheets
281. In Hungary 2.1 Kt of carbonless paper sheets was sold in 2007, amounting to 2.2% of EEA sales of sheets.

52
282. The parties would in 2007 have a combined market share of [10-20]*%, with Reflex adding [0-5]*% to Arjowiggins' [10-20]*%. Torraspapel had [30-40]%, Koehler [30-40]%, KRPA [5-10]% and Mitsubishi [0-2]%. In addition, very small competitors were present. The combined market share of the parties was [20-30]% in 2005 and [10-20]*% in 2006.
Ireland, reels
283. In Ireland 1.9 Kt of carbonless paper reels was sold in 2007, amounting to 0.6% of EEA sales of reels.
284. Arjowiggins in 2007 had a market share of [60-70]%, while Reflex had a market share of [0-5]*% in Ireland in 2007. Mitsubishi had [20-30]% and Torraspapel [5-10]%. In 2005 Reflex had [0-5]% and in 2006 [0-5]%. The combined market share of the parties would have been [50-60]% in 2005 and [70-80]% in 2006.
Ireland, sheets
285. In Ireland 1.3 Kt of carbonless paper sheets was sold in 2007, amounting to 1.4% of EEA sales of sheets.
286. Reflex had a market share of [0-5]*% in Ireland in 2006 and 2007, while Arjowiggins had [40-50]% in 2006 and [40-50]% in 2007. In 2007 Torraspapel had [30-40]%, and Mitsubishi [20-30]%. In 2005 the parties would have had a combined market share of [50-60]% with Reflex adding [5-10]% to Arjowiggins' [50-60]%.
Iceland, reels
287. In Iceland 0.1Kt of carbonless paper reels was sold in 2007, amounting to 0.05% of EEA sales of reels.
288. Arjowiggins had a market share of [above 80]% in 2005, [above 80]% in 2006 and [70-80]% in 2007. The only major competitor was Mitsubishi, while Reflex had only [0-5]*% in each of the three years.
Iceland, sheets
289. In Iceland 0.1Kt of carbonless paper sheets was sold in 2007, amounting to 0.1% of EEA sales of sheets.
290. Arjowiggins had a market share of [above 80]% in 2005, [70-80]% in 2006 and [70-80]% in 2007. The only competitor was Mitsubishi, while Reflex had only [0-5]*% in each of those three years.
Italy, reels
291. In Italy 44.5Kt of carbonless paper reels was sold in 2007, amounting to 14.9% of EEA sales of reels.
292. The parties would in 2007 have a combined market share of [70-80]%, with Reflex adding [30-40]% to Arjowiggins' [30-40]%. Mitsubishi had [10-15]%, and Koehler and

53
Torraspapel both [5-10]%. In addition, a few smaller competitors were present. In 2005 the combined market share would have been [60-70]% and in 2006 [60-70]%.
Italy, sheets
293. In Italy 10.4Kt of carbonless paper sheets was sold in 2007, amounting to 11.1% of EEA sales of sheets.
294. The parties would in 2007 have a combined market share of [50-60]%%, with Reflex adding [10-20]*% to Arjowiggins' [40-50]%. Mitsubishi had [15-20]%, Torraspapel [10-15]% and Koehler [5-10]%. In addition, very small competitors were present. In 2005 the combined market share would have been [60-70]% and in 2006 [50-60]%.
Lithuania, reels
295. In Lithuania 0.3Kt of carbonless paper reels was sold in 2007, amounting to 0.1% of EEA sales of reels.
296. Both parties had only [0-5]*% market share in the years 2005 to 2007.
Lithuania, sheets
297. In Lithuania 0.6Kt of carbonless paper sheets was sold in 2007, amounting to 0.6% of EEA sales of sheets.
298. Both parties had only [0-5]*% market share in the years 2005 to 2007.
Latvia, reels
299. In Latvia 1.0 Kt of carbonless paper reels was sold in 2007, amounting to 0.3% of EEA sales of reels.
300. Both parties had only [0-5]*% market share in the years 2005 to 2007.
Latvia, sheets
301. In Latvia 0.5Kt of carbonless paper sheets was sold in 2007, amounting to 0.5% of EEA sales of sheets.
302. Arjowiggins had only [0-5]*% market share in the years 2005-2007. Reflex had [10-20]*% in 2005, [5-10]% in 2006 and [5-10]% in 2007.
Malta, reels
303. In Malta 0.1 Kt of carbonless paper reels was sold in 2007, amounting to 0.02% of EEA sales of reels.
304. Arjowiggins had only [0-5]*% market share in the years 2005 to 2007. Reflex had [above 80]% in all three years.

54
Malta, sheets
305. In Malta 0.1 Kt of carbonless paper sheets was sold in 2007, amounting to 0.1% of EEA sales of sheets.
306. Reflex had only [0-5]*% market share in the years 2005 to 2007. Arjowiggins had [40-50]% in 2005, [40-50]% in 2006, and [20-30]% in 2007.
Netherlands, reels
307. In the Netherlands 9.7Kt of carbonless paper reels was sold in 2007, amounting to 3.3% of EEA sales of reels.
308. The parties would in 2007 have a combined market share of [30-40]%, with Reflex adding [10-20]*% to Arjowiggins' [20-30]%. Mitsubishi and Torraspapel both had [20-30]% and Koehler [10-15]%. In 2005 the combined market share of the parties would have been [40-50]% and in 2006 [40-50]%.
Netherlands, sheets
309. In the Netherlands 3.9Kt of carbonless paper sheets was sold in 2007, amounting to 4.1% of EEA sales of sheets.
310. The parties would in 2007 have a combined market share of [40-50]%, with Reflex adding [0-5]*% to Arjowiggins' [40-50]%. Xerox had [30-40]%, Jujo [5-10]%, Mitsubishi [5-10]% and Koehler [0-2]%. In both 2005 and 2006 Reflex had a market share of [0-5]*% in the Netherlands.
Norway, reels
311. In Norway 0.8Kt of carbonless paper reels was sold in 2007, amounting to 0.3% of EEA sales of reels.
312. Reflex had only [0-5]*% market share in the years 2005 to 2007. Arjowiggins had [30-40]% in 2005, [30-40]% in 2006, and 22% in 2007.
Norway, sheets
313. In Norway 0.5Kt of carbonless paper sheets was sold in 2007, amounting to 0.6% of EEA sales of sheets.
314. Reflex had only [0-5]*% market share in the years 2005 to 2007. Arjowiggins had [60-70]% in 2005, [60-70]% in 2006, and [60-70]% in 2007.
Poland, reels
315. In Poland 36.3Kt of carbonless paper reels was sold in 2007, amounting to 12.1% of EEA sales of reels.
316. The parties would in 2007 have a combined market share of [40-50]%, with Reflex adding [10-20]*% to Arjowiggins' [30-40]%. Koehler had [15-20]%, Goricane [15-20]%,

55
Pasaco [10-15]%, Mitsubishi [2-5]% and Torraspapel [0-2]%. In addition, a few very small competitors were present. In 2005 the combined market share of the parties would have been [40-50]% and in 2006 [40-50]%.
Poland, sheets
317. In Poland 3.5 Kt of carbonless paper sheets was sold in 2007, amounting to 3.7% of EEA sales of sheets.
318. The parties would in 2007 have a combined market share of [20-30]%, with Reflex adding [0-5]*% to Arjowiggins' [20-30]%. Koehler had [40-50]%, Torraspapel [20-30]%, Pasaco [5-10]% and Mitsubishi [0-2]%. In addition, a few very small competitors were present. In 2005 the combined market share of the parties would have been [30-40]% and in 2006 [30-40]%.
Portugal, reels
319. In Portugal 6.0Kt of carbonless paper reels was sold in 2007, amounting to 2.0% of EEA sales of reels.
320. The parties would in 2007 have a combined market share of [10-20]*%, with Reflex adding [0-5]*% to Arjowiggins' [10-20]*%. Torraspapel had [30-40]%, Mitsubishi [20-30]%, Koehler [15-20]% and Divipa [10-15]%. The combined market share of the parties was [20-30]% in 2005 and [30-40]% in 2006.
Portugal, sheets
321. In Portugal 3.2Kt of carbonless paper sheets was sold in 2007, amounting to 3.4% of EEA sales of sheets.
322. The parties would in 2007 have a combined market share of [50-60]%, with Reflex adding [0-5]*% to Arjowiggins' [50-60]%. Torraspapel had [20-30]%, Koehler [5-10]%, Divipa [5-10]% and Mitsubishi [0-2]%. The combined market share of the parties was [50-60]% in 2005 and [50-60]% in 2006, with Reflex adding [0-5]*% in both years.
Romania, reels
323. In Romania 5.2 Kt of carbonless paper reels was sold in 2007, amounting to 1.8% of EEA sales of reels.
324. The parties would in 2007 have a combined market share of [10-20]*%, with Reflex adding [5-10]% to Arjowiggins' [5-10]%. Koehler had [40-50]%, Mitsubishi [20-30]%, KRPA [15-20]% and Torraspapel [0-2]%. In addition, smaller competitors were present. The combined market share of the parties was [5-10]% in 2005 and [10-20]*% in 2006.
Romania, sheets
325. In Romania 1.4Kt of carbonless paper sheets was sold in 2007, amounting to 1.5% of EEA sales of sheets.

56
326. The parties would in 2007 have a combined market share of [20-30]%, with Reflex adding [0-5]*%. Mitsubishi had [20-30], KRPA [15-20]%, Torraspapel [15-20]% and Koehler [15-20]%. In addition, smaller competitors were present. The combined market share of the parties was [0-5]*% in 2005 and [5-10]% in 2006 with Reflex only having a [0-5]*% market share in 2006,and [0-5]*% in 2005.
Sweden, reels
327. In Sweden 3.5Kt of carbonless paper reels was sold in 2007, amounting to 1.2% of EEA sales of reels
328. The parties would in 2007 have a combined market share of [50-60]%, with Reflex adding [20-30]% to Arjowiggins' [30-40]%. Mitsubishi had [30-40]% and Koehler [2-5]%. In both 2005 and 2006 the combined market share of the parties would have been [60-70]%.
Sweden, sheets
329. In Sweden 0.5Kt of carbonless paper sheets was sold in 2007, amounting to 0.5% of EEA sales of sheets.
330. The parties would in 2007 have a combined market share of [40-50]%, with Reflex adding [0-5]*% to Arjowiggins' [40-50]%. Mitsubishi had [40-50]%,and Koehler [2-5]%. In 2005 the combined market share of the parties would have been [60-70]% and in 2006 [50-60]%. However, Reflex had [0-5]*% in 2005,and [0-5]*% in 2006.
Slovakia, reels
331. In Slovakia 2.6Kt of carbonless paper reels was sold in 2007, amounting to 0.9% of EEA sales of reels.
332. The parties would in 2007 have a combined market share of [60-70]%, with Reflex adding [60-70]% to Arjowiggins' [5-10]%. Koehler had [20-30]%, KRPA [5-10]%, Pasaco [0-2]% and Mitsubishi [0-2]%. The combined market share of the parties was [50-60]% in 2005 and [60-70]% in 2006.
Slovakia, sheets
333. In Slovakia 0.7Kt of carbonless paper sheets was sold in 2007, amounting to 0.8% of EEA sales of sheets.
334. The parties would in 2007 have a combined market share of [40-50]%, with Reflex adding [20-30]% to Arjowiggins' [20-30]%. Koehler had [20-30]%, Torraspapel [15-20]%, Pasaco [5-10]%, Mitsubishi [5-10]% and KRPA [2-5]%. The combined market share of the parties was [40-50]% in 2005 and [40-50]% in 2006.
Slovenia, reels
335. In Slovenia 2.7 Kt of carbonless paper reels was sold in 2007, amounting to 0.9% of 2007 EEA sales of reels.

57
336. The parties would in 2007 have a combined market share of [30-40]%, with Reflex adding [30-40]% to Arjowiggins' [0-5]*%. Mitsubishi had [40-50]% and Goricane [15-20]%. In addition, smaller competitors were present. The combined market share of the parties was [10-20]*% in 2005 and [40-50]% in 2006.
Slovenia, sheets
337. In Slovenia 0.5Kt of carbonless paper sheets was sold in 2007, amounting to 0.6% of EEA sales of sheets.
338. The parties would in 2007 have a combined market share of [40-50]%, with Reflex adding [5-10]% to Arjowiggins' [30-40]%. Mitsubishi had [40-50]% and APP [10-15]%. The combined market share of the parties was [30-40]% in 2005 and [50-60]% in 2006.
United Kingdom, reels
339. In the United Kingdom 30.2Kt of carbonless paper reels was sold in 2007, amounting to 10.1% of EEA sales of reels.
340. The parties would in 2007 have a combined market share of [50-60]%, with Reflex adding [20-30]% to Arjowiggins' [30-40]%. Koehler had [20-30]%, Mitsubishi [15-20]% and Torraspapel [5-10]%. In addition, very small competitors were present. The combined market share of the parties would have been [50-60]% in both 2005 and 2006.
United Kingdom, sheets
341. In the United Kingdom 16.9Kt of carbonless paper sheets was sold in 2007, amounting to 18.0% of EEA sales of sheets.
342. The parties would in 2007 have a combined market share of [40-50]%, with Reflex adding [10-20]*% to Arjowiggins' [30-40]%. Mitsubishi had [40-50]%, Koehler [2-5]% and Torraspapel [2-5]%. In addition, very small competitors were present. In 2005 the combined market share of the parties would have been [40-50]% and in 2006 [50-60]%.
The Commission's data
343. The Commission has reconstructed market shares on a national basis for reels and sheets for the years 2005 to 2007, based on sales data from the parties and their main competitors. 96 The most important differences to the data submitted by Arjowiggins are the following: In Austria, Reflex would in reels add [10-20]*% to Arjowiggins' [40-50]%, instead of [0-5]*% as submitted by the parties. In sheets, in Bulgaria, the parties would have a combined market share of [40-50]%, with Reflex adding [5-10]%. In sheets, in Cyprus, the parties would have a combined market share of [40-50]%, with Reflex adding [30-40]%. In sheets, in Denmark, Arjowiggins had [50-60]% instead of [60-70]%. In reels,
96 "Questionnaire to producers of carbonless paper" of 20 December 2007; "Questionnaire to producers of carbonless paper" of 30 January 2008.

58
in Hungary, the parties overestimated their combined market share for reels. In Malta, the parties overestimated their combined market share significantly for both reels and sheets. In the Netherlands, the parties substantially overestimated the size of the market and the sales of competitors; the parties' combined market share in reels is actually [40-50]%, with Reflex adding [10-20]*%, and in sheets a combined share of [70-80]%, with Reflex adding [0-5]*%. In Poland, the parties would have a combined market share in reels of [50-60]%, instead of [40-50]%, with Reflex adding [10-20]*%. In sheets, in Slovakia, the combined market share would be [50-60]%, with Reflex adding [20-30]%. In reels, in Slovenia, the combined share would be [40-50]%, with Reflex adding [20-30]%, while the combined share in sheets would be below 40% instead of above, as estimated by the parties.
344. On a number of markets, there is either a very high combined market share or a moderately high combined market share with a substantial increment. This would be the case in the following national markets: reels and sheets in Austria; reels and sheets in Belgium and Luxembourg; sheets in Bulgaria; reels and sheets in Cyprus; reels and sheets in Germany; reels and sheets in Denmark; reels and sheets in France; reels and sheets in Italy; reels and sheets in the Netherlands; reels in Poland; reels in Sweden; reels and sheets in Slovakia; and in reels and sheets in the United Kingdom. Altogether; these national markets represent about 79% of 2007 EEA sales of carbonless paper reels and about 66% of 2007 EEA sales of carbonless paper sheets. It is noteworthy that, both in reels and in sheets, four of these countries (Germany, France, Italy and the United Kingdom) account for more than 55% of the total carbonless sales in the EEA.
Arjowiggins' Reply to the Statement of Objections
345. Arjowiggins did not provide specific arguments about the market shares for the different potential carbonless paper markets but argued in general terms for all the markets, that the Commission "may not simply aggregate" the current market shares of the parties in order to determine the market share of the merged entity following the transaction, as the "loss of a substantial number of current customers" is to be expected. According to Arjowiggins, past acquisitions have shown such a phenomenon, as loss of customers amounted to [40-50]*% in the case of the acquisition by Arjowiggins of Copigraph, and to [50-60]*% in the case of its acquisition of Tenor. According to Arjowiggins, the business plan relating to the transaction was based on the assumption of a reduction of [10-20]*% in volume by 2010, but this assumption may have been unduly optimistic.
346. It is noted that the market shares are not used in such a way that a specific market share determines whether there is a competition problem or not. However, as in the Horizontal Merger Guidelines, at paragraph 14: "Market shares and concentration levels provide useful first indications of the market structure and of the competitive importance of both the merging parties and their competitors."97 Those Guidelines also state at paragraph 15: "…Post-merger market shares are calculated on the assumption that the post-merger combined market share of the merging parties is the sum of their pre-merger market
97 Guidelines on the assessment of horizontal mergers under the Council Regulation on the control of concentrations between undertakings (OJ C 31, 5.2.2004, p. 5), at paragraph 14.

59
shares…"98 Therefore, the practice of the Commission and those Guidelines has been followed in this case.
347. However, the business plan referred to by Arjowiggins assumes only "[0-10]*% loss of volumes until 2010" and then "[10-20]*% volumes lost in 2010". It is unclear, in the business plan, what is behind the jump from [0-10]*% to [10-20]*%. However, it may be linked to […]*. Those losses refer to losses of M-Real Zanders volumes, meaning that even accepting the numbers in the business plan, the combined market share of the parties would only be marginally smaller. Taking, as an example, the 2006 EEA market shares given by Arjowiggins in the notification, the market share addition coming from Reflex would be [10-20]*% instead of [10-20]*% based on a [0-10]*% volume loss and [10-20]*% based on a [10-20]*% volume loss. These would still be substantial additions to Arjowiggins' [30-40]*%.
348. Arjowiggins also argues that on the basis of market data gathered by […]*, a supplier of chemical products to carbonless paper manufacturers, the combined market share of the parties would be [10-20]*% in a worldwide market. At the oral hearing, the parties argued that the […]* report would attribute to the parties an EEA market share in volume of [40-50]*%.
349. Arjowiggins does not, in the Reply to the Statement of Objections, describe the methodology used by […]* to calculate those market shares. The documentation provided is a PowerPoint presentation.99 However, that document clearly states that it provides a "Global Production Summary". Those volumes are, therefore, […]* estimates of production volume and not of volumes sold, as are the market shares used by the Commission. As there are substantial exports out of the EEA, there is no reason to suppose that shares of production and sales in the EEA should be exactly the same.
A.1.3 Link between market structure and market power in carbonless paper markets
350. In this and the following sections some common characteristics of all potential carbonless markets and segments. Where specific considerations apply, they are specifically referred to.
351. According to established case law, although the importance of market shares may vary from one market to another, very large shares are in themselves, and save in exceptional circumstances, evidence of the existence of a dominant position.100 The case law is in line with the economic literature, where there is a broad consensus that horizontal mergers can harm competition if they lead to a high degree of market concentration.
352. In the present case, for an overall carbonless paper market the combined market share of the parties in 2007 would be in the range [40-50]*% at the EEA-level with a substantial increment. In potential national markets, the combined market share would exceed 50% in several EEA countries with a non-negligible increment in market share (Austria,
98 Guidelines on the assessment of horizontal mergers under the Council Regulation on the control of concentrations between undertakings (OJ C 31, 5.2.2004, p. 5), at paragraph 15.
99 Annex IV.8 to the Reply to the Statement of Objections. 100 See Case T-210/01 – General Electric Company v. Commission of the European Communities, ECR [2005]
II-05575, paragraph 115.

60
Belgium/Luxembourg, Cyprus, Germany, Denmark, Italy, the Netherlands, Poland, Sweden, Slovakia and the United Kingdom). In France, the combined market share would be close to [40-50]*% with a substantial increment. In those potential national markets, the market shares indicate a significant impact on competition.
353. In other potential national markets, the combined market share of the parties is low (for example, Bulgaria and the Czech Republic) while in yet other potential national markets, the increment is negligible (for example, Ireland and Iceland).
354. In a market of carbonless paper reels the combined market share of the parties in 2007 would be in the range [40-50]*% at the EEA-level with a substantial increment. In potential national markets, the combined market share would exceed 50% in several EEA countries with a non-negligible increment in market share (Austria, Belgium/Luxembourg, Cyprus, Denmark, Italy, Poland, Sweden, Slovakia and the United Kingdom). In Germany, France, and the Netherlands the combined market share would be in the range [40-50]% with a substantial increment. In those potential national markets, the market shares indicate a significant impact on competition.
355. In other potential national markets for reels, the combined market share of the parties is low (for example, Bulgaria and the Czech Republic), while in yet other potential national markets the increment is negligible (for example, Ireland and Iceland).
356. In a market of carbonless paper sheets the combined market share of the parties in 2007 would be in the range [40-50]*% at the EEA-level with a substantial increment. In potential national markets the combined market share would exceed 50% in several Member States with a non-negligible increment in market share (Belgium/Luxembourg, Germany, Denmark, France, Italy, the Netherlands and Slovakia). In Austria, Bulgaria, Cyprus and the United Kingdom the combined market share would be in the range [40-50]% with a substantial increment. In these potential national markets the market shares indicate a significant impact on competition.
357. In other potential national markets, for sheets the combined market share of the parties is low (for example, Bulgaria and the Czech Republic), while in other potential national markets the increment is negligible (for example, Ireland and Iceland).
358. Given the high combined market shares for many potential markets it thus remains to be assessed whether there exists in the present case exceptional circumstances, or other factors, indicating that market shares are not correlated with market power. This could be the case, for example, in markets where there are no barriers-to-entry. In addition, in certain types of bidding markets, market shares at any given moment may provide little or no guidance about market power. Where most sales are made in a small number of large auctions, where products and suppliers’ costs structures are fairly homogeneous, where output is not constrained by capacity and where suppliers cannot co-ordinate their competitive conduct, markets can generate competitive outcomes even when they are very concentrated.
359. Paper manufacturers aim to run their machines as close to full capacity as possible. They try to distribute the capacity in an optimal way between the various types of paper that can be produced on a given machine taking into account the market conditions of the various paper types in the different geographic markets in which they are sold.
61
360. When deciding on the optimal quantity of output to produce of each type of paper for the different geographic market(s), each supplier must balance the extra sales from increased quantity against the downward effect on prices induced by this extra quantity. The higher a firm's existing market share, the lower is its incentive to expand output in a given market, because the resulting lower prices affect also the profitability of its existing customer base (unless it can perfectly price discriminate). A merger that leads to a high combined market share and a significant increment, hence, provides an incentive for the merged firm to restrict output relative to the pre-merger situation, and thus reap the benefits of higher prices on its enlarged market share. Competitors, too, benefit from the higher market prices and have no interest to see prices decrease to pre-merger levels. They face the same 'trade-off' as the merged firm: expanding output enhances revenue, but it puts downward pressure on prices. Competitors that already had market power pre-merger therefore have no incentive to fully reverse the output reduction (and thus the price increase) caused by the merger. Based on these market characteristics, the HHI levels set out above provide an initial indication of the merger's likely competitive effect. The basic economic characteristics of the carbonless paper market, hence, confirm the concerns raised by Arjowiggins/ Reflex' high combined market share, namely that the merger could lead to increased prices for customers.
361. Arjowiggins argued in the notification101 that a number of mitigating factors are present in the carbonless paper market, which invalidate the concerns raised by an initial assessment of market structure and market characteristics. The notifying party submits, in particular, that western European demand for carbonless paper has declined at an annual rate of approximately 6% and will continue to do so as carbonless paper is increasingly replaced by other types of paper (such as thermal paper and uncoated wood-free paper) and by electronic archiving media. According to the notifying party, this has lead to continuous structural overcapacity. Because paper machines involve substantial fixed costs, manufacturers have a strong incentive to utilise existing capacity even for low-margin orders. Thus, the parties argue, if a producer raised prices, its competitors would have a strong incentive to load their carbonless paper capacity and capture market share.
362. Arjowiggins also argued that its main remaining competitors on the carbonless paper market (Mitsubishi, Koehler and Torraspapel) also produce thermal paper and have significant swing capacities that can be deployed for both carbonless and thermal paper. In the notifying party's own calculations (presented in the notification), an increase in the price of carbonless paper of 5% to 8% would make it profitable for competitors to switch capacity from thermal paper and other lower margin products to carbonless paper102.
363. It is accepted that the notifying party's arguments are valid in principle, if they could be confirmed by the market investigation and if the mitigating factors were sufficient in magnitude to reverse any anticompetitive merger effects: Theoretically, a market where four competitors that are not capacity-constrained supply a more or less homogenous product can generate competitive outcomes, even if one firm has a 50% initial market share. By contrast, if switching thermal paper capacity to carbonless became viable only after a 5% to 8% merger-related price increase, as claimed by Arjowiggins, this would not prevent
101 Form CO, pages 7 and 8. 102 Form CO, pages 47 to 61.

62
a significant impediment to competition, even if it would provide an upper limit on the magnitude of the consumer harm caused by the merger.
364. Accordingly, the Commission's market investigation focused on validating the theory of harm set out above and on testing the parties' defensive arguments.
A.1.4 Market investigation
365. The Commission conducted an extensive market investigation during which it collected qualitative and quantitative evidence from the merging parties and from all suppliers designated by the parties as competitors. It has also surveyed over one hundred customers to obtain their assessment of the proposed merger's competitive impact. Nearly half of the contacted customers submitted detailed replies to the Commission's questionnaires. In addition, the Commission has relied on Arjowiggins' internal documents, its business plan for the Reflex mill and on several independent market reports supplied by Arjowiggins and third parties.
366. While the main weight of the Commission's market survey was on collecting quantifiable, "hard" evidence, such as production capacities, sales, price and cost data, it also requested customers' qualitative assessment of the merger's competitive impact. More than half of the customers who replied to a full questionnaire, raised concerns that the transaction would harm competition through increased prices and decreased product availability. The Commission's market investigation showed that customers from a variety of EEA countries, including those from Germany, the United Kingdom, France and Italy, expressed concerns about the effects of the transaction in the markets for carbonless paper. It is noteworthy that the sales in those countries (Germany, United Kingdom, France and Italy) account for more than 55% of the total sales in the EEA. The following Recitals refer to the concerns raised by customers in those countries and other EEA countries .
367. The majority of the respondents located in Germany103 (sales of carbonless paper in this country amounted in 2007 to 17.4% of total EEA sales) pointed to various anticompetitive effects that the transaction will lead to, including, in particular, price increases. For example, one customer stated that as a result of the concentration "the manufacturers can enforce the price advance easier." Another customer described the structure of the market as follows: "Arjowiggins today has a market share in Germany estimated at [50-60]*%", "sheets are sold via paper merchants" and "reels directly to the printers". Customers also drew attention to the fact that "that sales to the biggest merchants in Germany would be concentrated in the hands of the new entity."
368. The Commission also contacted the biggest customers, both merchants and printers, of the five major carbonless paper manufacturers in four major EEA countries, Germany, France, Italy and the United Kingdom, in order to get further information about the competitive effects of the transaction.104
369. When asked the question whether they thought that the acquisition of Reflex by Arjowiggins would lead to higher prices of reels, of the German customers who answered
103 "Questionnaire to customers" of 20 November 2007 104 "Questionnaire Customers of Carbonless Paper" of 17 March 2008.

63
either "yes" or "no"105, a clear majority answered "yes". When asked whether any other competition problem (than increasing prices) could arise, a printer stated for the reels market, that the "number of suppliers/producers" will be "too small", while another stated that there would be "delivery problems".
370. When asked the question whether they thought that the acquisition of Reflex by Arjowiggins would lead to higher prices of sheets, the answers from the German customers (from those who answered either "yes" or "no") were evenly distributed between "yes" and "no". However, of the merchants that are sheet customers, who answered 'yes' or 'no', a small majority said "yes". When asked whether any other competition problem (than increasing prices) could arise, one merchant stated for the sheets market that the transaction would lead to "decreasing competition on the purchase side, rising purchase prices compared to unchanged high degree of competition on the merchants' side" while another stated that "[t]oday 3 merchants sell carbonless sheets, all produced by Arjowiggins, then it would be 4 out of 6".
371. A majority of the respondents located in France106 (sales of carbonless paper in this country amounted to 12.5% of total EEA sales in 2007) also raised concerns about the transaction's negative impact on competition. Examples of customer replies include concerns that "Arjowiggins will manage price evolution into the whole market", that the transaction "will give to Arjo a high power on the market (about [40-50]*%)" and that "the new entity will represent about [40-50]*% of the capacity of the market". Other customers pointed out that "as the competition will decrease, the prices will increase and the quality of services will decrease". One customer raised the issues of capacity constraints: "If we want to change suppliers, can Torras or Koehler provide additional volumes?" Another French customer summarised his assessment of the merger as follows: "If the two biggest carbonless paper producers Arjowiggins and Reflex merge, they will have the power on this market; capacities production will decrease and prices will increase".
372. Among the French customers that replied in the further investigation107, the answers ( from those who answered either "yes" or "no") were fairly evenly distributed between "yes" and "no"108 to the question of whether the transaction would lead to higher prices of sheets. To the question about "other competition problems", one merchant stated (covering both reels and sheets) that "Arjowiggins tries to clean109 the market, buying a competitor and increasing prices." Another stated (also covering both reels and sheets) that […]*. A printer stated (also seemingly covering both reels and sheets) that "Reflex' buying by AW will lead to less quality" and "paper more expensive".
373. A majority of the respondents located in the United Kingdom (sales of carbonless paper in this country amounted in 2007 to 12% of total EEA sales) pointed to various anticompetitive effects the transaction would lead to. Customers responding to different
105 There were also some "don't knows", as was the case for all countries. 106 "Questionnaire to customers" of 20 November 2007; "Questionnaire customers of carbonless paper" of 20
December 2007. 107 "Questionnaire Customers of Carbonless Paper" of 17 March 2008. 108 Although with a small majority for "yes". 109 Or "clear".

64
questionnaires110 indicated, for example, that the new entity "will control about 55% of the market" and that the new entity "will be in an even greater dominant position". One customer offered the view that "[…]* it will bring demand and supply into greater balance which will result in higher prices."
374. Among the United Kingdom customers that replied in the further investigation, the answers (from those who answered either "yes" or "no") were fairly evenly distributed between "yes" and "no"111 to the question of whether the transaction would lead to higher prices of reels. To the question about "other competition problems", one printer stated that the transaction would lead to "reduced choice of qualities" for reels.
375. Among the United Kingdom customers that replied in the further investigation a small majority (of those who answered either "yes" or "no") answered "no" to the question of whether the transaction would lead to higher prices of sheets. To the question about "other competition problems", one printer stated that the transaction would lead to "potential capacity reduction and increased supplier concentration" for sheets.
376. Customers in Italy112 (the parties' sales in this national market, amounted in 2007 to 14% of EEA sales) pointed to the dominant position which the new entity would have in a post merger scenario, of "up to [60-70]*% of the Italian market" which will allow them to increase prices.
377. Among the Italian customers that replied in the further investigation a clear majority (of those who answered either "yes" or "no") answered "yes" to the question of whether the transaction would lead to higher prices of reels. To the question about "other competition problems", one merchant stated (for both reels and sheets) that "[i]n case of price increase led by the formation of the two leading companies (Arjowiggins/M-Real Zanders) the other producers most likely will take the opportunity to increase their prices as well". A printer stated that for reels the transactions would lead to "a great predominance of the supplier on the total market". Another printer simply listed "delivery supply quantity" as an "other competition issue" for both reels and sheets.
378. Among the Italian customers that replied in the further investigation a clear majority (of those who answered either "yes" or "no") answered "yes" to the question of whether the transaction would lead to higher prices of sheets. To the question about "other competition problems", one merchant stated (for both reels and sheets) that "in case of price increase led by the formation of the two leading companies (Arjowiggins/M-Real Zanders) the other producers most likely will take the opportunity to increase their prices as well". A printer simply listed "delivery supply quantity" as an "other competition issue" for both reels and sheets.
379. Substantiated concerns were also voiced by customers located elsewhere. A customer located in Greece (2.8% of 2007 total EEA sales of carbonless paper) wrote that the two
110 "Questionnaire to customers" of 20 November 2007; "Questionnaire customers of carbonless paper" of 20 December 2007.
111 Although with a small majority for "yes". 112 "Questionnaire to customers" of 20 November 2007; "Questionnaire customers of carbonless paper" of 20
December 2007.

65
main suppliers will be able to "decrease capacities and increase the price level". In addition, a customer located in Austria113 (1.4% of EEA sales) pointed out that "Torraspapel has already no interest in the Austrian market; as the transportation cost are high, the situation will not change; if the merger goes trough there would remain only three reliable manufacturers: the new entity, Koehler and Mitsubishi."
380. Those concerns were also confirmed by a presentation at the Oral Hearing during which Arjowiggins argued that "only 59% of customers indicated adverse effects in the market (questionnaire "carbonless paper")".114 It is noted that 59% is already more than half of the respondents. However, Arjowiggins also explicitly included "ambiguous answers" in its calculations, and these answers account for 18% of the respondents.115 Once these answers are removed, as such answers cannot be attributed to either customers that think that the merger will have a positive or negative effect, Arjowggins' presentation implies that of the customers that unambiguously answered the Commission's questionnaire (with answers "adverse effect", "no effect", or "positive effect"), 72% of respondents indicated adverse effects on the markets. Thus, even Arjowiggins' own analysis confirms that a large majority of the customers, that took a clear position on the question, believe that the merger will have adverse effects on the market.
381. This case does not concern a dynamic market or a bidding market where market shares may give little information about market power. Instead, as referred to in Section A.1.1 on the distribution of carbonless paper, producers often have long and stable relationships with their paper merchants. Switching carbonless paper manufacturer is a major decision for a paper merchant, as shown by the fact that so few merchants actually do switch supplier. Arjowiggins argues that although merchants may not switch often, their customers - the small printers - can easily switch supplier. This is not confirmed by the Commission's market investigation. A clear majority of those final customers who replied to the Commission's question on the importance of brands and the possibility of switching to another manufacturer's product stated that brands are important (although more respondents stated "rather important" than "very important").116 Customers also indicated that switching is not as easy as Arjowiggins claimed. For instance, customers argued that different products perform differently on the printing press, and that switching could lead to inconsistencies of colour.
382. This is confirmed by Arjowiggins to some extent in the notification, where it stated that "carbonless products are not perfectly homogenous for some customers and present various characteristics according to the technology used by manufacturers"117.
383. It should, however, be noted that the Commission's market investigation has also shown that some of the larger printers do switch supplier – and the switching among these printers
113 "Questionnaire to customers" of 20 November 2007; "Questionnaire customers of carbonless paper" of 20 December 2007.
114 See page 12 of Arjowiggins' presentation "Arjowiggins/Zanders Reflex: The Weaknesses of the Commission's file."
115 The actual percentage of ambiguous answers in Arjowiggins' presentation is given as 9%. However, it shows from the absolute numbers given in the presentation that this must be an error.
116 "Questionnaire to customers" of 20 November 2007; "Questionnaire customers of carbonless paper" of 20 December 2007.
117 Form CO, p. 78.

66
certainly seems more frequent that is the case for merchants. The market investigation has also shown that some of the contacted large printers multi-source from more than one supplier.118
384. However, overall, the markets for carbonless paper seem much less dynamic in terms of customer switching than Arjowiggins claims. Both merchants and their customers are rather reluctant to switch supplier. The fact that such a large part of sales go through merchants means that large parts of the markets for carbonless paper look very little like the bidding markets described above. Market shares can therefore be taken to give a good indication of the market power of the paper manufacturers in the various markets.
Arjowiggins' Reply to the Statement of Objections
385. Arjowiggins in its Reply to the Statement of Objections stresses that customers do switch from one producer to another, or pursue a multi-sourcing strategy, and argues that these are common phenomena in the market for carbonless paper. Arjowiggins also provides some examples "based on Arjowiggins' knowledge" of customers switching supplier. Based on these examples, Arjowiggins states that it "clearly appears that the merged entity could not increase its prices to the detriment of customers, as such customers would be likely to cease buying from Arjowiggins to the benefit of another supplier."119
386. Arjowiggins also argues that the current rivalry between Arjowiggins and Reflex is not a significant source of rivalry since (i) the number of customers switching from one of the Parties to the other is relatively small, and (ii) the products offered by Reflex are those which are the most differentiated in comparison to Arjowiggins' Idem range.
The Commission's view
387. It is not argued by the Commission that no switching is taking place. However, the fact that some customers have switched supplier does not in itself show that prices could not be increased as a result of the proposed transaction. It is not an industry characterised by such frequent switching that market shares do not give meaningful indications about market power.
388. As to Arjowiggins' "rivalry" argument, it is accepted by the Commission that there may be limited switching between Arjowiggins and Reflex. However, it is noted that there is, in general, limited switching within this industry. The analysis of Arjowiggins does not provide any evidence that the switching between Arjowiggins and Reflex is lower in relation to the switching between the other suppliers in the industry. Arjowiggins also provides an analysis of "technical differentiation" between its own carbonless paper and that of its main competitors. That analysis concludes that there are technical differences between carbonless products and that the product furthest away from Idem is that of Reflex. The measure of "distance" is found by calculating the average distance to Arjowiggins Idem according to the seven technical attributes as the "square root of the sum of the squares of these distances." Arjowiggins does not, however, explain how this measure of "distance" translates into consumer preferences. Thus, the Commission finds that this argument is
118 "Questionnaire Customers of Carbonless Paper" of 17 March 2008. 119 Reply to Statement of Objections, pages 29 and 30.

67
limited in scope and cannot overturn the other arguments that show likely competition problems as a result of the transaction.
A.1.5 Evolution of demand, capacity and prices
389. According to the data provided by the notifying party, the total demand for carbonless paper on the EEA market was 413 289 tons in 2006 (corresponding to a value of around EUR 500 million) and capacity was at around 645 000 tons in 2006. The market investigation confirms the indications given by the notifying party on total demand. The market investigation also confirms the claim by the parties that demand for carbonless paper has steadily decreased over the last decade. 120
390. That decline in demand has taken place gradually, at a fairly steady rate, rather than a one-off shock. Manufacturers have reacted to this exogenous trend by withdrawing capacity from the carbonless paper market, either by shutting down machines or by switching production to alternative products, such as thermal paper. The parties' main competitors, Mitsubishi, Koehler and Torraspapel, all have paper machines that can switch production between carbonless and thermal paper, whereas according to the parties, Arjowiggins' and Reflex' equipment does not have this flexibility.
391. The following chart is based on data collected from carbonless paper manufacturers during the market investigation. It indicates that installed capacity has followed closely the declining demand trend.
120 In the Form CO, p. 5, Arjowiggins argues that demand has decreased by 4.7% on average per year in the period from 1996 to 2006, after having grown strongly by 13% per year in the period from 1970 to 1991 and having remained stable during the period from 1991 to 1996.

68
Figure 1: Installed capacity, total EU sales, total EU revenue, carbonless EU average net price index
Carbonless paper mkt in EU
0
10
20
30
40
50
60
70
80
1/02 5 9
1/03 5 9
1/04 5 9
1/05 5 9
1/06 5 9
1/07 5
Kt (
or 0
00€
for r
even
ue s
erie
s)
75
80
85
90
95
100
105
110
115
120
125
Jan
2002
=100
Carbonless EU sales (volume)Monthly equiv installed capacityEU revenue (000€)Carbonless EU avg net price INDEX (right scale)
Source: Data collected from carbonless paper manufacturers during the market investigation
392. The close alignment of capacity and demand is particularly remarkable given the prisoners' dilemma faced by competitors when deciding on capacity: While the closure costs (such as redundancies, and write-offs) are borne by the individual firm, any benefits of the reduced capacity in terms of higher prices are enjoyed by all suppliers in proportion to their respective market share. Hence, the capacity reduction constitutes a public good (even though the biggest firm benefit more than smaller suppliers). Firms are thus tempted to delay any closure plans in the hope that a competitor moves first. The evolution of capacity and demand in the carbonless paper market shows no signs of such free riding attempts. The capacity reduction has taken place in a remarkably orderly fashion, tracking closely the demand trend.
393. Hence, there are no indications that the declining demand trend has to any significant extent altered the competitive dynamics of the carbonless paper market. In particular, there is no indication that a demand shock has placed any of the main competitors in a situation of severe overcapacity where they would be forced to make cut-price sales and thus undermine market prices. On the contrary, manufacturers appear to be well aware that excess production would depress prices, and thus they have aligned capacity closely to demand. (Cut-price sales, where they occur, seem to be limited to exports to non-EEA markets.) The declining demand and capacity trend can thus be treated as exogenous to any merger effects.
A.1.6 Arjowiggins' incentives post-merger
394. The substantial increase of concentration brought about by the merger combined with the economic characteristics of the market makes it likely that Arjowiggins will find it

69
profitable post-merger to restrict output and thereby raise prices. This analysis is confirmed by Arjowiggins' original internal documents. […]*.121 […]*122.
A.1.7 Competitors' ability and incentives to expand output, including potential competition from diverted exports, thermal paper capacity, and carbonless paper producers outside of the EEA
395. The main manufacturers in the carbonless paper market were asked about their ability and incentives to increase output. Most manufacturers responded that they run their machines at full capacity and that the only way to increase carbonless production is by reducing the production of other types of paper produced on the same machines where carbonless paper is produced. 123
396. The most important way for the three main competitors to increase sales of carbonless in the EEA is, therefore, to reduce either their exports of carbonless paper or their sales of other types of paper, in particular thermal paper.
397. Apart from idle capacity, there are three sources from which manufacturers could supply additional carbonless paper quantities, for example, in response to a price increase by the merged entity. Firstly, the parties as well as Mitsubishi, Koehler and Torraspapel are all exporting part of their production outside the EEA. This production could be diverted to EEA-customers. Secondly, Mitsubishi, Koehler and Torraspapel have flexible equipment and could switch capacity currently used for thermal paper to the carbonless market. However, when deciding whether to use free capacity or divert production, firms have to take into account that the additional output will put downward pressure on prices.124 Thirdly, importers from outside of the EEA could start supplying carbonless paper in the EEA, or increase their current supplies to the EEA (in the case of the few that are already present).
398. As far as exports outside the EEA are concerned, the market investigation indicates that sheet prices are significantly higher in the EEA than outside, while reels prices are more similar.125 While EEA manufacturers export significant tonnages, imports to the EEA are negligible, despite the absence of import duties or other regulatory impediments to import. At constant prices, it would therefore already be profitable today for carbonless paper manufacturers to sell additional quantities, in particular of sheets, inside the EEA, especially when transportation costs are taken in to account. The fact that this does not happen provides a further indication that the main manufacturers recognise that increased
121 Power Point presentation of 23 March 2007, entitled "MAR Investment Committee" and Excel spreadsheet named "MAR Business plan.xls".
122 Power Point presentation of 23 March 2007, entitled "MAR Investment Committee", p.3. 123 "Follow-up questionnaire to producers regarding capacity" of 10 January 2008. 124 Given that most sales are via merchants, manufacturers' ability to price discriminate is limited, at least within
the EEA. Thus, suppliers must assume that price reductions granted to incremental customers would affect the prices they can charge to their existing customer base.
125 Commission calculations based on price and volume data supplied by the major EEA producers of carbonless paper.

70
EEA-sales would put downward pressure on prices. They appear to use the overseas markets to utilise capacity without "spoiling" domestic prices. Such a trade-off would still exist after the implementation of the notified merger.
399. Arjowiggins argues with respect to the redirection of volumes from exports to be sold instead in the EEA that the "current strength of the euro currency is another element that may reinforce the competitive constraint exerted on the merger entity post-Transaction." The Commission has analysed in the following Figure 2 and Figure 3 how exports by Arjowiggins have reacted to the increase in recent years in value of the euro with respect to the dollar.
Figure 2: Arjowiggins' export share, $/€ exchange rate […]*
Source: Arjowiggins transaction data, Oanda.com
Figure 3: Arjowiggins' export volume, $/€ exchange rate […]*
Source: Arjowiggins transaction data, Oanda.com
400. Figure 2 shows that Arjowiggins' export share (export as a percentage of total sales) has not decreased in the five years from 2002 to 2007 even though the euro has increased dramatically vis-à-vis the dollar during this period. Since 2005, it actually seems that the export share has increased. Figure 3 shows Arjowiggins' absolute export volume over the last five years. During the first few years, the export volume decreased but then seemed to stabilise or even mildly increase. These figures show that there seems to be no direct relationship in the short term between Arjowiggins' exports and the euro/dollar relationship. It is, therefore, unlikely that the increase in the euro currency in itself will result in EEA manufacturers diverting significant sales from outside the EEA into the EEA. As mentioned above this is probably due to EEA manufacturers recognising that increased EEA-sales would put downward pressure on prices.
401. The same disincentives apply also to the diversion of sales from thermal paper. While many exports of carbonless paper do indeed seem to be made on less attractive terms than domestic sales, the thermal paper market has in general been more profitable than carbonless. There are, hence, opportunity costs associated with switching production from thermal paper. Arjowiggins estimates in the notification that thermal paper capacity would constrain carbonless prices only if the latter rose by 5% to 8%.
402. Supply side substitution between carbonless and thermal paper has not in the past been sufficient to ensure that these two paper types are in the same market. This is clear from the chart in Figure 4. The thermal paper prices are based on data from Mitsubishi, Koehler and Torraspapel, the three carbonless producers that are also active in thermal paper production. Together these three producers account for about 60% of the EEA market.

71
Figure 4: Carbonless vs thermal paper prices in EU
Carbonless Vs Thermal paper prices in EU
75
80
85
90
95
100
105
110
115
120
125
1/02 4 7 10
1/03 4 7 10
1/04 4 7 10
1/05 4 7 10
1/06 4 7 10
1/07 4
Jan
2002
=100
1
1.1
1.2
1.3
1.4
1.5
1.6
1.7
1.8
1.9
2
Correlation between thermal and carbonless
prices = 0.4609
Carbonless EU avg net price INDEX (left scale)Thermal EU avg net price INDEX (left scale)
ratio thermal to carbonless price (right scale)
Source: Data from market investigation
403. The chart in Figure 4 shows a correlation coefficient between thermal and carbonless prices of only 0.46. This is clearly insufficient to conclude that the two paper types are in the same market: as referred to in the section on product market definition, a large majority of all the correlation coefficients for the CB, CF and CFB products that were accepted to be in the same product market was above 0.8.126 Figure 4 shows that carbonless prices first fell until the end of 2003 and then started crawling back up. Thermal prices, on the other hand, declined quickly until mid 2003, after which they have been oscillating more or less around the same level. The ratio of thermal to carbonless prices has, therefore, been steadily declining over the period, which confirms that substitution between thermal and carbonless paper is not sufficiently strong to ensure that they should be considered in the same market.
404. The Commission has conducted a detailed analysis of the margins earned by the main manufacturers in the thermal and carbonless paper markets, respectively.127 This investigation shows that margins earned on thermal paper have declined significantly between 2002 and 2005 as the market has matured. Based on a comparison of relative margins, the manufacturers could, over extended periods, have earned higher margins by switching from carbonless to thermal. The fact that thermal paper is a growing market with better long-term prospects than the carbonless market should have made such switching even more attractive. There were also periods where switching from thermal to carbonless paper would have been profitable for some manufacturers. However, such switching did not take place in any significant scale. This indicates that manufacturers either cannot or do not want to react relatively quickly to changes in relative margins when they decide to allocate
126 Moreover, given that reels and sheets are found to be in separate markets, and these products are almost perfectly substitutable on the supply side, it follows that is very unlikely that carbonless and thermal paper could be found to be in the same product market.
127 "Questionnaire to producers re prices and quantities" of 22 November 2007.

72
production to either thermal paper or carbonless paper. Hence, there are no indications that competitors post-merger would be more likely to switch production to carbonless paper to an extent that would defeat a capacity reduction by a dominant supplier controlling 50% of the carbonless paper market than they are today. In this respect, it should also be kept in mind that the better long-term prospects of the thermal paper market means that manufacturers may not want to disappoint thermal paper customers to achieve a short-term gain in the carbonless paper market. Thus, not only are thermal and carbonless paper not in the same relevant market; the possibility that certain manufacturers will switch production from thermal to carbonless paper is not likely to constitute the constraining influence of Arjowiggins' post-transaction behaviour that Arjowiggins claims.
405. Additional carbonless paper could also be supplied by importers outside of the EEA. However, it is not very likely that such imports could be sufficient to make up for any decreases in output. This is because the current imports of carbonless paper into the EEA have not accounted for more than 2% of sales in the last three years on an annual basis. As referred to in the section on product market definition and also elaborated further in the comments to Arjowiggins' Reply to the Statement of Objections, the claims made by Arjowiggins about the competitive importance of potential increases in imports from non-EEA suppliers are not convincing.
A.1.8 Geographic differentiation
406. The competitive assessment set out above applies to the EEA-wide market and to the national markets where competition problems were identified above. Although each supplier operates production capacity only in a limited number of locations in the EEA, the quantity of paper supplied into a given EEA country (most paper merchants operate on a national basis) is determined by the profit maximisation mechanism outlined above, and not by the available production capacity. Firms choose the optimal-price output combination in each market, even if this means that some production has to be exported at comparatively low prices outside the EEA. As the pricing data analysed by the Commission indicate, this results in significant price differences between Member States. Hence, it appears that manufacturers can price separately on a national basis.
407. One explanation for the prices differences is that geographic markets are national in scope. On a national basis, the proposed transaction leads to particularly high market shares, in excess of 50%, in several Member States, including France (sheets), Germany (overall market and in sheets), the United Kingdom (overall market and in reels), Italy (overall market as well as both in reels and sheets) and Denmark (overall market as well as both in sheets and reels) and to combined market shares in excess of 40% in conjunction with high HHI values in several other EEA countries.
408. When analysed on an EEA-basis, the transaction's negative competitive effect is reinforced by the fact that Arjowiggins and Reflex are geographically close competitors, in that they often achieve high market shares in the same EEA countries, such as Germany, Denmark, Italy and the United Kingdom. By contrast, Torraspapel is an important competitor on the Iberian peninsula, but it is comparatively weak outside that area.

73
A.1.9 Other arguments made by Arjowiggins in its Reply to the Statement of Objections
409. In addition to the arguments already referred to above, Arjowiggins sets out several arguments against the Commission's analysis of likely unilateral effects, in its reply to the Statement of Objections.
410. Arjowiggins first argues that the Commission fails to take into account the fact that Arjowiggins and Reflex are amongst the competitors […]* within the industry. According to Arjowiggins, this proves that the proposed merger would not result in the removal of a significant source of competition. Arjowiggins also refers to non-EEA producers such as Gold HuaSheng, Glatfelter and Appleton, which all, according to a study provided by Arjowiggins, would have lower delivered costs in Frankfurt.
411. It is also noted that Arjowiggins' argument would imply that two competitors, that together have around 50% of the sales of carbonless paper in in the EEA, should not be considered as providing "significant sources of competition". It is also noted that the three non-EEA producers referred to in the previous recital, according to the market shares provided by Arjowiggins in the Phase II investigation, together have less than 0.1% of the EEA market. If the cost estimates provided by Arjowiggins are correct, it would thus seem that delivered costs so far have not been shaping the market structure to a significant degree, at least not with respect to the non-EEA producers referred to by Arjowiggins. The Commission has also not found indications that imports are about to become a significantly stronger competitive constraint than has been the case in the past. For instance, one of the companies named by Arjowiggins, Glatfelter, replied to the Commission that "[o]ne significant barrier is the cost to transport paper from the U.S. to the EEA."128 To a question about costs related to organising distribution if it were to start producing carbonless paper in the EEA, Glatfelter mentioned that this would necessitate hiring a sales team to operate within the EU, developing appropriate sales channels with merchants and printers, developing a sales strategy and developing "marketing collateral". Thus it does not seem that Glatfelter considers itself an important competitive factor on the EEA carbonless market(s), neither now nor in the near future.
412. Arjowiggins also argues that the declining demand results in growing spare capacities, which would exercise a strong downward pressure on prices. Arjowiggins argues that the Commission mitigates the impact of the declining demand by stating that competitors closely adapt their capacities to the demand. Arjowiggins disagrees with this view and claims that, if overall capacities have been reduced over the last few years, this decline has been less important than that of demand, and that the main reason for this development is not a gradual adaptation of its capacities by each competitor, but the fact that certain producers have been forced to exit the market due to the negative prospects of the market (such as Carrs or Sappi).
413. In addition, Arjowiggins suggests that parts of the available total capacity may be overlooked due to the fact that, in the absence of sufficient demand for carbonless paper, such capacities are currently used to produce other, low-margin products (so-called “fillers”). These capacities may easily be switched back to the production of carbonless paper in the event of a permanent increase in the price of this latter product.
128 Reply to Commission Questionnaire to competitors.

74
414. The Commission recognises that some of the reductions of capacity have come from producers exiting the market. However, Arjowiggins itself estimates that the main five producers of carbonless paper reduced their production capacity from a total of 710 000 t in 2002 to 590 000 in June 2007.129 A large part of this development comes from […]*. In comparison, Carr had in 2004 before its exit a production capacity of less than 5 000 t.130
415. The Commission maintains its position that the installed capacity has followed the declining demand trend and that there are no indications that the declining demand trend has to any significant degree altered the competitive dynamics of the carbonless paper market in the direction of the main competitors undermining market prices by making cut-price sales. This is particularly well illustrated in Figure 5 to Figure 7 showing Arjowiggins' gross margins for reels and sheets by coating type. While the EEA capacity has been reduced by 22% from its 2002 values (see Figure 1), Arjowiggins' gross margins […]*.
Figure 5: Arjowiggins' EEA CB reels and CB sheets margins […]*
Source: Arjowiggins
Figure 6: Arjowiggins' EEA CF reels and CF sheets margins […]*
Source: Arjowiggins
Figure 7: Arjowiggins' EEA CFB reels and CFB sheets margins […]*
Source: Arjowiggins
416. According to Arjowiggins, any price increases could also be thwarted by additional carbonless paper volumes that would be available due to:131
• "the declining USD/EUR exchange rate, which not only leads to an increasing competition by producers established outside the EEA, but would further encourage a redirection of exports by European producers into the EEA market in case of a non-transitory price increase in the latter"; and
• the possibility to allocate to the production of carbonless paper capacities that are currently used for the production of other products."
417. Arjowiggins submitted an analysis (hereafter, the "Carbonless export analysis") in support of Arjowiggins' argument that the declining USD/EUR exchange rate benefits non-
129 Reply to Commission Questionnaire to Arjowiggins regarding prices and quantities. 130 Form CO, Annex A.1.1 (13th Edition of the Laves Chemie Study on Carbonless Paper), p. 16. 131 Reply to the Statement of Objections, p. 28.

75
EEA producers and also encourages the EEA producers to redirect exports of carbonless paper.132 The Commission already rejected Arjowiggins' argument regarding the redirection of exports in the Statement of Objections, because "such redirection is not noticeable today, while the current exchange rate should, in the Commission’s view, make it profitable".133 However, Arjowiggins submits that " although current market conditions (such as price dispersions within and outside the EEA and the risk of depriving non-EEA customers) do not make it profitable to redirect exports toward the EEA market, a permanent price increase for carbonless paper on this latter market would certainly cause significant redirections."134
418. This has been supplemented by Arjowiggins' Carbonless export analysis, in which Arjowiggins claims that "the Commission misses two fundamental facts of the carbonless paper market in its assertion and jumps to conclusion on the wrong test." Arjowiggins first notes that "there is wide price dispersion both within the EEA and outside of the EEA," and thus it does not follow that it would already be profitable today to sell additional quantities inside the EEA. The first claim should be rejected for a number of reasons. As indicated above and in Annex 1, the Commission does not find Arjowiggins' price dispersions to be convincing tests. Additionally, even looking at the price dispersions presented by Arjowiggins, it is quite evident that particularly sheet prices are offered by Arjowiggins at significantly lower prices outside of the EEA, as opposed to the EEA.135 The Commission performed additional correlation and stationarity tests on EEA vs. non-EEA reels and sheets prices charged by Arjowiggins, as well as by all the five largest carbonless paper producers, to assess whether there is a close relationship between the pricing of EEA carbonless paper producers for EEA- and non-EEA countries. The results, summarised in Annex 2 suggest that there do not appear to be any close links of this kind: the EEA and non-EEA prices are not closely correlated, and the relative prices are found to be non-stationary. Thus, it is unlikely that increases of the EEA prices relative to the non-EEA prices would lead to a significant redirection of exports to the EEA.
419. Secondly, Arjowiggins argues "that there are many other legitimate explanations for lower prices to be charged within the EEA and outside the EEA" other than the Commission's contention that increasing EEA sales would depress prices in the EEA.136 However, the […]* of Arjowiggins implicitly confirmed the Commission's hypothesis during the Oral Hearing. In particular, when asked by Commission officials at the Oral Hearing why it would not be better to sell more in the EEA to [a competitor's]* customers by offering a lower price, rather than to sell in the United States of America at a loss, Arjowiggins' […]* explained that [a competitor]* would in such a case match any offer put forward by Arjowiggins (either discount or some other commercial approach) to keep its
132 Annex 4.6 to the Reply to the Statement of Objections, "Carbonless Exports", 17 March 2008. 133 Statement of Objections, paragraph 313. 134 Reply to the Statement of Objections, p. 28. 135 In this regard, the Commission notes that it is not relevant how wide the tails of the price dispersions are.
Instead, what is relevant, are the prices at which the majority of the sales are made. Taking Arjowiggins' "50% of sales at mid-prices" as an indicator for that, Arjowiggins' price dispersion chart clearly shows that there are only very limited overlaps for sheets sold in and outside of the EEA, and this is also true for reels to some extent.
136 The Carbonless exports analysis, p. 1.

76
customer. The […]* of Arjowiggins thus implicitly recognizes that exporting serves to ensure that prices can be managed in the EEA.
420. Thirdly, Arjowiggins argues that "the Commission did not assess the changed ability and incentives of market players to redirect carbonless-paper exports, should a price increase occur in the EEA." However, as mentioned above, there does not seem to be any relationship between EEA and non-EEA prices charged by the five largest carbonless paper producers. Thus, it is unlikely that significant exports would be re-directed to the EEA, (this is consistent with the remarks of Arjowiggins' […]*). and the Commission also rejects this argument set out in the econometric analysis. Arjowiggins also argues that "with the current weakness of the dollar vis-à-vis the euro, which is expected to persist into the foreseeable future, EEA exports are likely to fall and non-EEA producers will have even more incentives to enter the EEA area." However, this argument has already been already rebutted above. Figure 2 and Figure 3 show that at least since 2005, the dollar/euro exchange rate has been significantly lower than in the three preceding years. However, Arjowiggins has actually been increasing its sales outside of the EEA during this period. Similarly, imports have not amounted to more than 2% in the last three years, although the dollar/euro exchange rate should encourage importers to sell more in the EEA.137
421. With regard to capacities for thermal paper (and other neighbouring products) that could be switched to producing carbonless paper, Arjowiggins notes that "the Commission did not try to test the validity of Arjowiggins’ previous estimate that a permanent increase of 5% to 8% would lead to such effect, the Commission’s response on this issue being limited to the statement that such increase would in any case be significant.138 In addition, Arjowiggins has revised this estimate and further submits that "a swing of capacities from thermal paper to carbonless paper would become profitable to producers even in the case a limited increase by approximately 3% were recorded in the price of carbonless paper." In support of these arguments, Arjowiggins refers to a report in Annex 4.7 to the Reply to the Statement of Objections, in which Arjowiggins argues that “even if one accepts the claim that the two are separate relevant product markets, one cannot preclude the possibility that the two paper types exert significant competitive pressure on each other”.139 In addition, Arjowiggins argues that (i) the investments in thermal capacity production “are likely to lead to further decreases in the price of thermal relative to that of carbonless paper,” and (ii) “due to relatively lower prices attained by thermal-paper exports, production capacities currently allocated to those volumes represent the prime potential to be swung back to carbonless.”140
422. Figure 4 shows that there is almost no relationship between carbonless paper prices and thermal paper prices. This is further supplemented by Figure 8 that examines the relationship between thermal prices and reels and sheets prices for the period from 2004 to 2007. The correlation between sheets and thermal paper prices is 0.45, while the
137 In this regard, it is also noted that the Commission was criticised by Arjowiggins for not performing any analysis for the imports with the exception of merely stating that they have not amounted to more than 2%. However, these imported sales are so small that there do not exist any consistent monthly series that could be used for undertaking any type of a meaningful analysis, including a prospective approach as regards to how the imports will develop over time.
138 Statement of Objections, paragraph 289. 139 "Thermal Paper", 17 March 2008. 140 “Thermal Paper”, 17 March 2008.

77
correlation between reels and thermal prices is -0.11. Thus, given the lack of relationship between the carbonless and thermal prices, it is unlikely that thermal paper could exert much constraint on carbonless paper from antitrust perspective. This also rules out Arjowiggins’ prior or current estimates of price increases of 5% to 8% and more recently of 3% for switching from thermal to carbonless paper production.
Figure 8: Carbonless sheet and reel vs thermal paper prices in EU
Avg EEA Net Prices of Thermal and Carbonless paper
1000
1100
1200
1300
1400
1500
1600
1700
1800
1900
2004
m1
2004
m5
2004
m9
2005
m1
2005
m5
2005
m9
2006
m1
2006
m5
2006
m9
2007
m1
2007
m5
2007
m9
€/to
n
ThermalCarbonless(Sheet)Carbonless(Reel)Carbonless(All)
Source: Data from market investigation
423. As regards Arjowiggins’s additional arguments, Arjowiggins does not provide any support for the claim that additional investments in thermal capacity will lead to decreases in prices of thermal paper relative to carbonless paper. In addition, as shown above there is not even a relationship between the EEA prices and non-EEA prices of carbonless paper. Therefore, it is unlikely that such a relationship could be found for the carbonless and thermal paper given that these products do not belong to the same relevant market. Thus, it is unlikely that the capacity used for thermal paper exports would be 'swung back' to carbonless in response to price increases. It should therefore be concluded carbonless and thermal paper do not belong to the same market, and thermal paper does not exercise an effective constraint on carbonless paper.
424. Arjowiggins also emphasises the importance of an "on-going reduction of European producers' exports of thermal paper into the United States, due in particular to the initiation by the US Department of Commerce of an antidumping investigation against imports from certain countries, including Germany".141 Arjowiggins submits that this decline in European exports of thermal paper should result in additional excess capacity being made available for the market for carbonless paper by EEA producers, as switching being the two kinds of paper is easy from a supply-side perspective.
141 Letter from Arjowiggins of 14 April 2008.

78
425. The anti-dumping investigation against German thermal paper producers started in September 2007. The investigation is being carried out by two agencies, the International Trade Administration (part of the United States Department of Commerce) and the International Trade Commission. If both agencies agree, the Department of Commerce will instruct that an antidumping duty is charged. To date, it is not clear what the final outcome of the investigation will be and how big the antidumping duty would be if such a duty indeed is imposed.142
426. However, not only is the final outcome of the antidumping investigation uncertain, but also its potential consequences for the EEA carbonless market(s). First, it is uncertain how large the antidumping duty would be, and therefore how big the impact will be on the German exports of thermal paper to the US market. Second, it is uncertain how much of these reduced exports would be diverted to the EEA carbonless markets and how much would instead be sold as more thermal paper in the EEA or thermal exports to markets other than the US or as carbonless paper exports. It should in this respect be recalled that the Commission did not find signs of any significant switching as a result of changes in relative prices and margins between carbonless and thermal paper. It should also be noted that the US antidumping investigation is an external event to the merger. Even if Köhler and Mitsubishi sold some more carbonless paper in the EEA this would not in itself change the fundamental economics of the analysis of the proposed transaction. Only if Köhler and Mitsubishi would sell very large extra quantities of carbonless paper might the analysis change. It is difficult to conclude at this stage that this would happen. Thus, even if antidumping duties were to be imposed on thermal paper in the USA, their possible effect on carbonless paper in the EEA remains speculative.
427. Arjowiggins finally argues that the Commission has failed to take into account the significant constraints imposed by the possibility of end-users ceasing to purchase carbonless paper completely. In particular, it argues that the Commission ignores that the decline in the demand for carbonless is materially due to the substitution process by which end users have switched to using thermal, uncoated wood-free grades and paperless solutions for the same applications. According to Arjowiggins, if the merged entity were to attempt to implement a price increase to supra-competitive levels this would just accelerate the trend.
428. Arjowiggins has not argued that the market is wider than carbonless paper. Thus, any competitive pressure exercised by, for instance, thermal paper and uncoated wood-free grades should be understood as pressure coming from outside the relevant market. Such pressure is by nature less significant than that coming from within the relevant market, but should nevertheless be taken into account.
429. The Commission does not contest that there is a gradual switch away from carbonless paper for several applications. However, this switching is driven by a combination of factors, of which the price of carbonless is only one. A switch away from carbonless to thermal paper, uncoated wood-free grades or paperless solutions often involves also a
142 The Department of Commerce on 13 May 2008 published a Notice of Preliminary Determination of Sales at Less than Fair Value and Postponement of Final Determination. In this Notice, the "weighted-average dumping margins" for German thermal paper manufacturers are calculated as 6.49%. In the same Notice the "final determination" is postponed until "no later than 135 days after the publication" of the Notice.

79
change in equipment.143 An increase in the price of carbonless paper obviously increases the relative attractiveness of switching for those applications where a switch is possible. However, it is unlikely that a small price increase would make a significant difference in the switching decision for many customers.
430. In addition, there are applications of carbonless paper where there are no real alternatives at present. In the future, these customers who – at least for the moment - are locked into the use of carbonless are likely to constitute a relatively higher proportion of the demand. Even if the argument given by Arjowiggins would be true for some customers, it is certainly not true for these locked-in customers.
431. To conclude, the Commission cannot agree with Arjowiggins that the possibility of end-users completely ceasing to purchase carbonless paper imposes significant constraints on the producers of carbonless paper.
A.2 Co-ordinated effects
432. As outlined above, the close alignment of capacity reductions with the declining demand trend is remarkable given the prisoners' dilemma competitors face when deciding on plant closures. Independently of the unilateral effects set out above, it is conceivable that manufacturers' competitive conduct is the result of tacit co-ordination.
433. According to the responses to the market investigation, suppliers are fairly well aware of the prices obtained by each other, among other reasons due to the importance of price lists. According to most respondents to the market investigation, rival suppliers of carbonless paper do not try to undercut each other's price offers. The market investigation also suggests that there is considerable transparency on capacity of the carbonless paper producers. This could make co-ordination of plant closures possible in order to maintain prices at higher levels than would prevail otherwise. Through the proposed transaction, the number of significant players on the market for carbonless paper is reduced from five to four. Several respondents to the market investigation have pointed towards the proven history of cartelisation in the particular market, which took place when the number of suppliers was much higher144, while expressing their concern for coordination on the EEA market for carbonless paper.
434. The Commission noted in its Article 6(1)(c) Decision and in the Statement of Objections that these elements point towards a possible risk of coordinated effects without finally concluding on this aspect of the competitive assessment. Arjowiggins in its Reply to the Statement of Objections contested the Commission's arguments on co-ordinated effects. However, for purposes of this Decision it is not necessary to conclude whether any co-ordinated effects would, separately from the already established non-coordinated effects, lead to a significant impediment to effective competition because the remedies submitted by
143 This finds support in a report ("Project MAR") presented to the Commission on 11 January, 2008 by a consultant hired by the parties. It stated that "[t]he decline of carbonless copy paper in many regions results mainly from increasing use of competing technologies such as laser, ink jet and thermal printing as well as electronic transactions".
144 See the Commission Decision 2004/337/EC, referred to in footnote 11 of this Decision, in which participation in a cartel was established for Arjo Wiggins Appleton, Bolloré, Carrs, Vizcaína, Mitsubishi, Zicunaga, Mougeot, Koehler, Sappi, Torraspapel and M-Real Zanders.

80
Arjowiggins (see Section IX.) fully remove the competitive overlap in the carbonless paper market. As they restore the market structure prevailing prior to the notified transaction, the remedies also address any possible competition concerns arising from co-ordinated effects.
A.3 Efficiencies
435. According to Recital 29 of the Merger Regulation145 and Paragraph 76 of the Horizontal Merger Guidelines146, it is possible that efficiencies brought about by a merger counteract the effects on competition and in particular the potential harm to consumers that it might otherwise have. Parties to a concentration may thus detail the efficiency gains generated by the concentration that are likely to enhance the ability and the incentive of the merged entity to act pro-competitively for the benefit of consumers. Typical examples of such efficiencies include cost savings, new product introduction and service or product improvement. Efficiency claims need to be verifiable (namely reasoned, quantified and supported by internal studies and documents if necessary). To counteract the anticompetitive effects of a merger, such efficiencies must be likely to benefit consumers (and in particular, to benefit directly customers in the relevant markets where competition concerns have been identified) and could not have been achieved to a similar extent by means that are less anticompetitive than the proposed concentration (the so called "merger specificity"). The three conditions – verifiability, merger specificity and consumer benefit - are cumulative.
436. Arjowiggins had not included efficiency arguments in its merger notification although it had reserved "the possibility to address efficiencies resulting from the transaction at a later stage of the proceeding, if appropriate." It has not subsequently invoked an explicit "efficiency defence" for the notified transaction; however, in its Reply to the Statement of Objections, it pointed to a number of alleged efficiencies among the elements that, in Arjowiggins' view, should lead to Commission to authorise the proposed transaction. In addition, certain alleged cost savings are also mentioned in […]*. The Commission has, therefore, evaluated whether the efficiencies claimed in these documents meet the requirement set out in the Horizontal Merger Guidelines.
437. In its Reply to the Statement of Objections, Arjowiggins invokes four areas where the notified transaction is alleged to generate benefits. It claimed that
(i) the transaction would benefit Arjowiggins by leading to efficiencies and preventing adverse developments with regard to Arjowiggins' existing activities;
(ii) the transaction would benefit Reflex, in particular by […]*;
(iii) the transaction would benefit customers […]* and the development of new products;
(iv) the transaction would benefit the European industry, through […]*.
438. Arjowiggins' main efficiencies claims are included in the introductory sections of it Reply to the Statement of Objections; they are not presented as an efficiency defence. Only
145 See Recital 29 and Article 2(1)(b) of the Merger Regulation. 146 See the Horizontal Merger Guidelines, Paragraph 76..

81
point (iii) refers to customer benefit and could thus potentially form the basis for an efficiency defence. Points (i), (ii) and (iv) invoke benefits to Arjowiggins, […]*. There are thus no indications that the latter group of alleged efficiencies benefit consumers in a way that consumers will not be worse off as a result of the merger.
439. Arjowiggins' argument on consumer benefit includes only two paragraphs. It argues rather vaguely that "the efficiencies and synergies expected by Arjowiggins from the acquisition of Reflex, as described above, would inevitably benefit consumers. In particular, as explained above, […]*". A second source of alleged efficiencies consists of general claims about rationalisation of R&D efforts.
440. Hence, the merger specificity of the alleged consumer benefit […]*. As to the general claim about R&D synergies, the information provided in an eight-line paragraph in the Reply to the Statement of Objections 147 is far too parsimonious to allow any verification. As a general principle, R&D expenses constitute fixed and sunk costs and are thus not generally likely to lead to merger-specific efficiencies benefiting consumers in accordance with the Horizontal Merger Guidelines. Arjowiggins makes no attempt to demonstrate that the alleged efficiencies in R&D can be verified, are merger-specific and would be passed on to consumers.
441. Arjowiggins also later (on page 32) in the Reply to the Statement of Objections mentions "significant efficiencies" such as "improved purchasing prices on pulp and chemical products and development of synergies […]*". Arjowiggins makes no attempt to explain in any detail how these alleged efficiencies fulfil the criteria for an "efficiency defence" as described in the Horizontal Merger Guidelines.148
442. The introductory section of the Reply to the Statement of Objections also refers to […]*149 […]*.150 […]*.
443. The alleged efficiencies are calculated on the basis of estimates of cost competitiveness of various carbonless paper plants made by a consultancy firm specialised in the forest industry. This is a model used for pulp mills and paper machines active in various parts of the paper industry. In a description of the model the consultancy firm states that "[t]he most accurate results are achieved in the simplest bulk grades like newsprint and testliner. In special grades, like CCP (with varying furnishes and operating models), the results are not so accurate. Modelling process estimates PM/mill cost potential in certain grade, not their actual costs." 151 The consultancy firm itself therefore acknowledges that the model does not obtain its "most accurate results" in carbonless paper and that it estimates "cost potential", not actual costs. However, Arjowiggins makes no attempt to verify that the model actually produces reliable results, for instance by comparing the modelled costs with Arjowiggins' own actual costs.152
147 See Arjowiggins' Reply to the Statement of Objections, p. 4 148 […]*. 149 […]*. 150 […]* 151 CCP means carbonless copy paper, while PM means paper machine. 152 […]*.

82
444. The modelling process applied is quite complicated involving both technical and economic data. The end result is an estimate of manufacturing costs per ton for each grade of carbonless paper (CB, CFB and CF). Based on these estimates (and what the consultants call a "simplified analysis") it is argued in the submission that […]*. It is claimed briefly in the submission that "possible synergies and cost savings could be attained also in R&D, sales and other corporate functions". The submission also states that "as a consequence, the planned concentration also results in a more favourable cost structure for the merged entity, which typically translates into exerting greater competitive pressure on other suppliers".
445. The claimed efficiencies from "R&D, sales and other corporate functions" are not specified in any detail and are anyway likely to be savings in fixed costs that are less likely to bring about consumer benefits.153
446. As to the claimed efficiencies from the […]*, the analysis suffers from several shortcomings. First, the estimated costs are total unit costs, which according to the description of the modelling process consist of variable costs, fixed costs, delivery costs and capital charges. Only the total costs are provided and used for analysis. However, the Horizontal Merger Guidelines are clear that these various cost types differ in their likelihood of bringing benefits to consumers: reductions in variable or marginal costs "are, in principle, more likely to result in lower prices for consumers."154 In theory, specialising of production based on total manufacturing cost could even lead to an increase in variable or marginal costs. The analysis does not allow an assessment of the consequences for the various cost types of the proposed specialisation.
447. Secondly, the analysis is not clear about the reasons for the cost differences. This makes it impossible to assess the merger specificity of the claimed efficiencies. If, for instance, Arjowiggins could achieve similar cost efficiencies in the production of CFB by making a reasonable investment at the Virginal mill, then the alleged efficiencies are not merger specific. Unless a convincing argument for merger specificity is presented, it is not obvious that a merger is necessary to allocate production capacity efficiently. In a competitive market, it would be expected that the least efficient machines exit the market once their marginal cost of production exceeds market prices. Especially if the rationalisation of production capacity is due to an anticompetitive output reduction, a merger decreases, rather than enhances, allocative efficiency. Likewise, a merger is not necessary for companies to reach efficient scale; on the contrary, the incentives to reach efficient scale would normally be greater the more competitive a market is.
448. To conclude, the alleged efficiencies and synergies referred to by the parties in various parts of their submissions do not fulfil the three conditions of the test set out in the Horizontal Merger Guidelines.
A.4 Conclusion on carbonless paper
449. The Commission's analysis of the economic characteristics of the carbonless paper market, the survey of customers and competitors, the quantitative data collected from the main manufacturers and Arjowiggins' internal documents and business plans together lead
153 See the Horizontal Merger Guidelines, paragraph 80. 154 See the Horizontal Merger Guidelines, paragraph 80.

83
to the conclusion that the notified transaction would significantly impede effective competition by giving Arjowiggins the ability and incentive to restrict output and thereby raise prices for consumers.
EEA-wide markets
450. Both on an EEA-wide market for carbonless paper (reels and sheets together), and for separate markets for reels and sheets, the combined market share of the parties in 2007 was in the range [40-50]*% at the EEA-level with a substantial increment. It should be concluded that the notified transaction would significantly impede effective competition on an EEA-wide market for carbonless paper as well as on separate EEA-wide markets for reels and sheets.
Germany
451. In Germany, the combined market share of the parties in 2007 was just above 50% in the overall carbonless paper market while it was in the range of [40-50]*% for reels and close to [60-70]*% for sheets. In the overall carbonless paper market in Germany, Arjowiggins and Reflex are roughly the same size, with Arjowiggins being relatively stronger in sheets and Reflex in reels. A specific feature of the German market is the weak position of Torraspapel which has a very low market share in Germany, probably to a large degree as a result of not having access to any of the important German merchants. This means that post-merger, the German market basically would be served by three suppliers, with Arjowiggins having half of the overall market for carbonless paper and Koehler and Mitsubishi making up almost the other entire half. There are no signs that this situation would improve significantly after the merger.
452. The market investigation clearly showed that customers in Germany are concerned about this development. A majority of the German customers who responded to the Commission's market investigation pointed to various anticompetitive effects of the transaction.
453. On the basis of the specific characteristics of the German market(s), and the general analysis of the EEA carbonless market(s) described in the previous sections, it should be concluded that the notified transaction would significantly impede effective competition on a German market for carbonless paper, as well as on separate German markets for carbonless reels and sheets.

84
France
454. In France, the combined market share of the parties in 2007 was in the range of [40-50]*% in the overall carbonless paper market, while it was in the range of [40-50]*% for reels and at [60-70]*% for sheets. Arjowiggins already has a strong position in France, in particular in sheets (where it already has more than 50% on its own), while it has lost some market share in reels in the last couple of years. France is one of the EEA countries where Torraspapel has a relatively strong presence, whereas Mitsubishi on the other hand is relatively weak in France.
455. The market investigation showed that several French customers were concerned about the transaction and pointed to various anticompetitive effects of the transaction.
456. On the basis of the specific characteristics of the French market(s), and the general analysis of the EEA carbonless market(s) described in the previous sections, it should be concluded that the notified transaction would significantly impede effective competition on a French market for carbonless paper, as well as on separate French markets for reels and sheets.
Italy
457. In Italy, the combined market share of the parties in 2007 was in the range of [60-70]% in the overall carbonless paper market, while it was [70-80]*% in the reels market and at [60-70]*% in the sheets market. In Italy, Arjowiggins is somewhat stronger than Reflex but Reflex still has a market share of [20-30] %, one of the highest it has in any of the major EEA countries. Reflex is especially successful in reels, where it has more than 30% of the Italian market, while it has [10-20]*% in sheets. Arjowiggins on the other hand has [30-40] % in reels but [40-50]% in sheets. Each of the other three major manufacturers has only a market share in the order of 10% in the overall carbonless paper market in Italy.
458. The Commission's market investigation clearly showed that Italian customers are concerned about the transaction. A majority of the Italian customers who responded to the Commission's market investigation pointed to various anticompetitive effects of the transaction.
459. On the basis of the specific characteristics of the Italian market(s), and the general analysis of the EEA carbonless market(s) described in the preivous sections, it should be concluded that the notified transaction would significantly impede effective competition on an Italian market for carbonless paper, as well as on separate Italian markets for reels and sheets.
The United Kingdom
460. In the United Kingdom, the combined market share of the parties in 2007 was in the range of [50-60]% in the overall carbonless paper market. It was slightly higher for reels while it was in the [40-50] % range for sheets. Reflex brings to the transaction a market share of just below 20% in the overall carbonless paper market, which corresponds to market shares of just above 20% in reels and just above 10% in sheets. In the United Kingdom, Torraspapel is relatively weak and has less than 10% in the overall carbonless

85
paper market, while the United Kingdom is one of Mitsubishi's strongest markets. It is noteworthy that Koehler has almost no sales of sheets in the United Kingdom.
461. The Commission's market investigation showed that several United Kingdom customers were concerned about the transaction and pointed to various anticompetitive effects of the transaction.
462. On the basis of the specific characteristics of the United Kingdom market(s), and the general analysis of the EEA carbonless market(s) described in the previous sections, it should be concluded that the notified transaction would significantly impede effective competition on a United Kingdom market for carbonless paper, as well as on separate United Kingdom markets for reels and sheets.
Other national markets
463. The Commission's market investigation also pointed to competition problems similar to those described for Germany, France, Italy and the United Kingdom in a number of other national markets. In potential national carbonless paper markets, the combined market share of the parties would exceed 50% with a non-negligible increment in market share in Austria, Belgium/Luxembourg, Cyprus, Denmark, the Netherlands, Poland, Sweden and Slovakia.
464. In potential national markets of carbonless paper reels, the combined market share would exceed 50%, with a non-negligible increment in market share in Austria, Belgium/Luxembourg, Cyprus, Denmark, Poland, Sweden, and Slovakia. In the Netherlands and Slovenia, the combined market share would be in the range of [40-50] %, with a substantial increment.
465. In potential national markets of carbonless paper sheets the combined market share would exceed 50%, with a non-negligible increment in market share in Belgium/Luxembourg, Denmark, the Netherlands and Slovakia. In Austria, Bulgaria and Cyprus, the combined market share would be in the range of [40-50] %, with a substantial increment.
466. On the basis of those characteristics, and the general analysis of the EEA carbonless market(s), it should be concluded that the notified transaction would significantly impede competition on all these potential markets.
B. Tracing Paper
Market structure
467. In the EEA, Arjowiggins is active in the production of graphic and industrial tracing paper […]*. It also has tracing paper activities in China, where it owns the tracing paper producer Arjowiggins Kan.155 (In response to a Commission's questionnaire156, Arjowiggins Kan stated that in 2007 it achieved sales of EUR [0-10]* million / [0-2000]* tons with
155 The company is also named "Ouzhou Hangbaode" or "Quzhou HengBaoDe Paper Co" and formerly it was called "Halberd".
156 30 January 2008 Questionnaire to producers of tracing paper.

86
industrial tracing paper. The notifying party informed the Commission that Arjowiggins Kan is expected to sell up to [2000-4000]* tons of tracing paper on the Asian market by the end of 2008, and to sell over [4000-6000]* tons in the following years. The theoretical production capacity amounts to [6000-8000]* tons157.
468. In addition, in 2007 Arjowiggins bought the tracing paper machine of Sihl (Diatec Group). Sihl is a former producer of industrial tracing paper that closed its production line in 2007. All of Sihl's tracing paper was produced with the machine that was sold to Arjowiggins. […]*. Sihl would continue to sell tracing paper under its own brands. Sihl is now supplied by […]* with tracing paper158.
469. In addition, Arjowiggins owns a number of patents for the production of tracing paper. […]*.
470. Reflex produces tracing paper on its paper machine, PM […]* in Düren, Germany. Arjowiggins estimates that in 2006, PM […]* produced about [800-1000]* tons of graphic tracing paper. As regards industrial tracing paper, Arjowiggins first stated that PM […]* would not produce any industrial tracing paper. In its Memorandum dated 22 January 2008, Arjowiggins stated that Reflex would be marginally present in the segment for industrial tracing paper. In its submission of 25 January 2008, Arjowiggins stated that in 2006 Reflex achieved sales of about EUR [300000-350000]*, and about [0-200]* tons159 with industrial tracing paper.
471. Initially the proposed concentration included the acquisition by Arjowiggins of a 25% shareholding in the Chinese tracing paper producer, ZMZ. ZMZ is a joint venture between the seller, M-Real Zanders, and Minfeng Special Paper Co ("Minfeng"). ZMZ produces both types of tracing paper, graphic and industrial. However, Arjowiggins and the seller, M-Real Zanders decided to modify the notified transaction and informed the Commission that the 25% shareholding no longer forms part of the proposed transaction. The Commission, therefore, has to base its assessment on the modified transaction which no longer includes the participation in ZMZ.
157 Submission of notifying party of 25 January 2008. 158 Submission of the notifying party of 4 January 2008. 159 Estimate of the notifying party. The exact amount is considered as business secret by the seller.

87
Sales and market shares
472. In its submission of 25 January 2008, supplemented by sales figures submitted by e-mail of 18 February 2008, the notifying party provided the following sales information and estimates:
Sales of industrial and graphic tracing paper in 2006, worldwide:
Industrial TP Graphic TP Company Volume (in t) Value
(in € m) Volume (in t) Value (in € m)
Arjowiggins (UK, France) [6800-8600]* [40-50]*%
[20-25]* [50-60]*%
[6300-8000]* [40-50]*%
[30-36]* [50-60]*%
Arjowiggins Kan (China) […]* […]* […]* […]*
Reflex (DE) [0-1000]* [0-5]*%
[0-2]* [0-5]*%
[800-1600]* [5-10]*%
[3-6]* [5-10]*%
Combined [6800-8600]* [40-50]*%
[20-25]* [50-60]*%
[8000-9500]* [50-60]*%
[30-36]* [50-60]*%
Schoellershammer (DE) [800-1800]* [2-4]* [3200-4800]* [12-18]* ZMZ (China) [3400-6800]* [8-12]* [0-800]* [0-3]* Mitsubishi (Japan) [800-1800]* [2-4]* [800-1600]* [3-6]* Sihl (Diatec) (CH) [1800-3500]* [4-8]* [1500-3200]* [6-12]* Overall [15000-20000]* [35-45]* [12000-18000]* [55-65]* Source: Arjowiggins’ figures + Arjowiggins’ estimates for other suppliers – The figures in brackets are market shares calculated by the Commission Sales of industrial and graphic tracing paper 2006 to customers located in the EEA:
Industrial TP Graphic TP Company Volume
(in t) Value
(in € m) Volume (in t) Value (in € m)
Arjowiggins (UK, France) [1500-1800]* [50-60]*%
[3-4]* [40-50]*%
[3300-4000]* [50-60]*%
[16-19]* [60-70]*%
Arjowiggins Kan (China) […]* […]* […]* […]*
Reflex (DE) [0-150]* [0-5]*%
[0-4]* [0-5]*%
[700-1300]* [10-20]*%
[2.5-5]* [10-20]*%
Combined [1500-1800]* [50-60]*%
[4-5]*% [50-60]*%
[4000-4800]* [60-70]*%
[19-22]* [70-80]*%
Schoellershammer (DE) [600-900]* [1.5-2.5]* [1300-2000]* [2.5-5]* ZMZ (China) […]* […]* […]* […]* Mitsubishi (Japan) […]* […]* […]* […]* Sihl (Diatec) (CH) [600-900]* [1.5-2.5]* [0-600]* [0-2.5]*
Overall [2500-3500]* [7-10]* [6000-7000]* [20-30]*
Source: Arjowiggins’ figures + Arjowiggins’ estimates for other suppliers The figures in brackets market shares calculated by the Commission

88
473. The Commission’s market investigation160 confirmed the approximate range of the market sizes. The sales of the target and the competitors differ to a certain extent from the estimates of the notifying party. In particular, the sales of the target are to a limited extent higher than estimated by the notifying party. In any event, the competitive assessment does not change based on the real sales figures.
Capacities
474. Concerning capacity, Arjowiggins, on 22 November 2007, provided the following information concerning its production of tracing paper161.
Mill Location Machine Capacity (tons)
Production (tons)
Spare Capacity (tons)
[…]* […]* […]* […]* […]* […]* […]* […]* […]* […]*
[…]* […]* […]* […]* […]* […]* TOTAL […]* […]* […]*
475. Based on this information, Arjowiggins' utilisation rate is […]*%. Arjowiggins also stated that its competitors have spare capacities which are estimated at [2000-4000]* tons to [4000-6000]* tons162. The Commission's market investigation confirms that Arjowiggins' competitors have substantial spare capacities. It should be noted in this context that the total volume of the tracing paper market is very small, effectively below the production capacity of a single modern paper machine. It is therefore unlikely that capacity constraints play a significant role in any supplier's output decision. It appears, on the contrary, that manufacturers are struggling to organise production at an efficient scale, which may explain Sihl's decision to outsource production to […]*.
Patents- and licensing agreements
476. A number of licence and distribution agreements concerning graphic tracing paper exist. Arjowiggins is co-owner of a patent with Thibierge&Comar (a premium fine paper producer) for the production of deep coloured transparent paper. This patent is licensed by Arjowiggins and Thibierge&Comar to Schoellershammer163.
477. Arjowiggins also owns two other patents which concern the production of tracing paper for cover or packing applications, as well as the production of tracing paper compatible with a specific Hewlett Packard printing machine. Apart from that, there are several supply agreements.
160 In particular Replies to 30.1.2008 Questionnaire to producers of premium fine paper; 1 February 2008 Questions of 1-2-2008. E-mail of M-Real Zanders of 18 February 2008..
161 Submission of the notifying party of 22 November 2007. […]*. 162 Submission of the notifying party dated 4 January 2008. 163 See submission of notifying party dated 25 January 2008.

89
Assessment
1. Industrial Tracing Paper
478. Assuming a global market for industrial tracing paper, the combined market share of Arjowiggins and Reflex is [40-50]*% by volume and [50-60]*% by value. In the EEA the combined market share is [50-60]*% by volume and value. In 2007, the market shares were somewhat higher due to the fact that Sihl stopped producing industrial tracing paper, while Arjowiggins Kan started its own production.
479. However, after the parties decided to modify the proposed concentration by not acquiring the shareholding ZMZ, the competitive overlap stemming from Reflex’ sales is, indeed, minor in both absolute terms and in terms of market shares: Reflex' sales amount to around EUR [0-1]* million and corresponding to [0-5]*% in terms of market share in the EEA, or [0-5]*% worldwide. Thus, the additional increment to Arjowiggins' pre-merger market share will not lead to any significant changes in the competitive landscape in the EEA or worldwide. In addition, there are no grounds to believe that Reflex can be considered as an important opponent to Arjowiggins’ in the field of industrial tracing paper, neither worldwide nor in the EEA.
480. In consequence, it should be concluded that the proposed concentration would not cause a significant impediment to effective competition in the market for industrial tracing paper.
2. Graphic Tracing Paper
481. The combined market share, for graphic tracing paper, of Arjowiggins and Reflex is [50-60]*% by volume and [50-60]*% by value in a global market, and [60-70]*% by volume and [70-80]*% by value in the EEA. While the incremental market share may be considered small from the global perspective, as Reflex has about [5-10]*% market share by both volume and value, the increment is more substantial at the EEA level, with Reflex’ [10-20]*% volume market share and [10-20]*% value market share.
482. The market for graphic tracing paper is, however, very small and accounts for about EUR 61 million worldwide and EUR 28 million in the EEA (in volume terms, it accounts for 15 900 tons worldwide and 6 600 tons EEA-wide). Due to the small market size, market shares are not necessarily indicative of market power, since even single shipments can significantly change market shares. For example, Reflex’ [5-10]*% worldwide market share amounts to sales of EUR [0-10]*million, and Reflex’s [10-20]*% EEA market share amounts to sales of EUR [0-10]* million. It should also be noted that the existing patent and licensing agreements concern only minor parts of the market.
483. In addition, Arjowiggins and M-Real Zanders decided to modify the transaction. As a result, ZMZ will become an additional competitor on the market. This is true for the worldwide market, but also has to be taken into account concerning the EEA, as ZMZ may wish to use its capacities and may find it attractive to enter the EEA market for graphic tracing paper. This is also in view of its current link with M-Real Zanders, which has distribution capabilities in the EEA. In addition, in view of the small size of the market for graphic tracing paper, even small shipments to the EEA could have a major impact on suppliers' market shares.

90
484. In addition, even though other types of paper for graphic use do not belong to the same product market as graphic tracing paper, it should be acknowledged that other types of graphic paper may exercise constraints on the market for graphic tracing paper. Paper suppliers market these other types of graphic papers, together with graphic tracing paper, and some alternatives have some similar characteristics to graphic tracing paper (for example, certain parchment papers and certain synthetic sheets). This has been confirmed in the Commission's market investigation by a considerable number of respondents. These other types of graphic paper can be used for the same applications for which graphic tracing paper is used, even if prices and the aesthetic characteristics may vary. It should also be noted that switching, for instance, by designers, from graphic tracing paper to other graphic papers, often does not require changes in equipment as, for instance, in the case of the carbonless paper.
485. In addition, Arjowiggins' economic analysis, that is described in Annex 3, implies that the metallics paper of the "other fine paper market for graphic use" may provide some constraint for the graphic tracing paper. The prices of the metallics paper, relative to the prices of the graphic tracing paper, are found to be stationary, although there appear to be some upward trends in the relative prices. This is something that would not normally be expected if there was a stable long-term relationship between the prices of these two products, that would be indicative of the two products being in the same market. Although the correlation between the metallics paper and graphic tracing paper is not sufficiently large to consider these two products to be in the same market, it does, however, indicate the existence of some relationship between the prices of these two products. Thus, on balance, the metallics paper is likely to provide some constraint for the graphic tracing paper.
486. Finally, both existing and potential suppliers of tracing paper are unlikely to face any capacity constraints due to the very small market volume.
487. In consequence, it should be concluded the proposed transaction would not cause competition concerns in the market for graphic tracing paper.
Conclusion
488. It should be concluded that the proposed concentration would not significantly impede effective competition on the market for industrial tracing paper.
489. It should also be concluded that the proposed concentration would not significantly impede effective competition on the market for graphic tracing paper.
C. Premium fine paper
1.1 Market structure of the market for premium fine paper
490. In the EEA, Arjowiggins is active in the production of premium fine paper from various production sites in […]*.164 Its total production capacity amounts to […]* tons per year.
164 Form CO, page 99.

91
491. Reflex, on the other hand, produces premium fine paper on […]* in Düren, Germany. […]*. Arjowiggins estimates that the […]* machines have a production capacity of approximately [20000-25000]* tons per year.165
1.2. Sales and market shares for premium fine paper
492. Assuming an EEA-wide market for premium fine paper in general (tracing paper excluded), Arjowiggins' market share in 2007 was [20-30]*% by volume. Reflex' market share was [0-5]*%. Thus, the combined market share of both Arjowiggins and Reflex would amount to [20-30]*%. In addition, there is a considerable number of competitors remaining post transaction. Fedrigoni is the next strongest competitor, with a market share of 16.5 %. Cordenons has a market share of 9.5%. Arctic, Cropper and Favini have market shares of about 5% each. In addition, as the market is relatively fragmented, there is a large number of smaller competitors who account for about 30%.
493. Even though the merged entity would have a market share almost twice as large as its next strongest competitor, its market shares would still be relatively low. In addition, the competitive overlap stemming from Reflex' sales is minor in terms of market shares. The post-merger HHI would also be [900-1600]* points with a delta of [100-225]* points.166 According to the Commission's Horizontal Merger Guidelines, this HHI level indicates the absence of competition concerns.167
494. The competitive analysis does not change if the relevant market were defined to exclude premium letterhead paper. If the premium letterhead paper was excluded as well, the combined market share would be lower and would amount to [20-30]* %. This limited market share, on the basis of Recital 32 of the Merger Regulation, would indicate the compatibility of the merger with the common market. In addition, the HHI post-merger would be only [900-1600]* points, with a delta of [25-100]* points by volume and [900-1600]* with a delta of [25-100]* points by value.
495. Accordingly, it should be concluded that the proposed concentration would not lead to a significant impediment to effective competition in the market for premium fine paper, regardless of whether the market is defined as excluding premium letterhead paper.
Sub-segments of premium fine paper: premium letterhead paper
496. In the EEA, Arjowiggins operates in the premium letterhead paper market […]*.
497. In the Reply to the Statement of Objections, Arjowiggins presented new data on production volumes and sales in these production sites for 2007. […]*, it also mentioned that the production volumes indicated in the Form CO to be allocated to the "letterhead paper machines" contain not only letterhead but other products such as security paper, other packaging, casting papers or "other printing".
165 Form CO, page 98. 166 Calculated on the basis of the market shares for 2007 in volume. 167 See the Horizontal Merger Guidelines, paragraphs 20 and 21.

92
498. Therefore, the notifying party submitted that the real production volumes of premium letterhead paper in […]* in 2007, […]* would be [4000-6000]* tons (not the previously mentioned [6000-8000]* tons), […]* it would be [8000-10000]* tons (instead of […]* tons) and that the […]* also produces [6000-8000]* tons premium letterhead paper. In addition, the notifying party submitted that there was no production of premium letterhead paper in […]* in 2007 at […]* (the previously mentioned [4000-6000]* tons would mainly be security papers). The notifying party submitted that at […]* the production of premium letterhead paper is [2000-4000]* tons (instead of [4000-6000]*tons).
499. Based on that information, Arjowiggins' total production of premium letterhead paper was [20000-40000]* tons in 2007. While Arjowiggins does not provide similar detailed data for 2006, it submitted that in 2006 the total EEA sales of premium letterhead, 80-130g, were [20000-25000]* tons, of which sales of high end letterhead was [20000-25000]* tons. The sales of standard and premium paper used for letterhead applications are estimated at [20000-25000]* tons.
500. Arjowiggins submitted its monthly transaction data in support of those new sales figures. The Commission used this transaction data to confirm the validity of the newly submitted sales figures. It appears that Arjowiggins' sales of high end letterhead were even somewhat lower than Arjowiggins reports, as they amount to sales of [15000-20000]* tons in the EEA. For sales of standard and premium fine paper used for letterhead applications, the total amounts to [20000-25000]* tons.
501. As regards Reflex' production volumes, the notifying party indicated that in the segment of high end letterhead the production would be [2000-4000]* tons. For the premium letterhead, 80-130g, the notifying party submitted that the production was [4000-6000]* tons. As Reflex does not produce any standard paper, the number for standard and premium paper used for letterhead applications would be identical with the one for high end letterhead.168
Market structure
502. Initially, Arjowiggins estimated the market size of premium letterhead, 80-130g, to be 99 033 tons and indicated own sales of [35000-40000]* tons.169. Later it corrected its own sales figures to [20000-25000]* tons and also submitted an economic study with an adjusted market size estimate of 83 129 tons. As for the high end letterhead paper and standard and premium paper used for letterhead applications, Arjowiggins submits that the size of the EEA market is 86 392 and 317 067 tons respectively. The Commission evaluated the information provided by Arjowiggins and considers that the new data provided is broadly correct.
503. For the reasons stated in Recital 507, Arjowiggins’ market share in the premium letterhead 80-130g market would be [20-30]*%, in high end letterhead [20-30]*%, and in standard and premium paper used for letterhead applications [5-10]*%. Reflex would have a market share of about [0-5]*%, [0-5]*% and [0-5]*% in each of the possible markets/sub-
168 Reflex' sales would be slightly lower. 169 See page 51 of the Statement of Objections.

93
segments respectively. Therefore, the combined market shares would be about [20-30]*%, [20-30]*% and [5-10]*% respectively.
504. Analysing the worst case scenario, in a market of high end letterhead paper the next competitor would be Fedrigoni with a market share of about 14%. Other significantly smaller competitors include Cordenons, Lana, Gmund, Favini, Tullis Russel or Curtis; each of them would have a market share below 5%.
505. During the Commission's market investigation one competitor indicated that the number of suppliers of premium letterhead paper has decreased from ten to "essentially three"170.
506. In addition, two producers of premium letterhead paper171 claimed that the combined entity will have "the most selling brands" in its portfolio and that the combined entity will be able to exercise power on the merchants selling premium letterhead paper" to de-list competing brands.
Assessment
507. If premium letterhead paper was a separate product market, the new entity would have in the narrowest possible sub-segment a [20-30]*% market share. The Commission's market investigation has broadly confirmed the existence of other numerous suppliers of premium letterhead paper. This, combined with the fact that Fedrigoni has a share of at least 14%, and with the fact that customers indicated to have at least two sources of supply, leads to the conclusion that the removal of Reflex as an independent competitor would not significantly alter the current market structure.
508. As regards brands, as stated in Recitals [..], some of them are dedicated to premium letterhead paper. Arjowiggins and Reflex have indeed important brands in this segment (dedicated or not to the premium letterhead paper). However, in view of the low market share of the new entity, foreclosure concerns may be excluded.172
509. Even though the merged entity would have a market share almost twice as large as its next strongest competitor, in the narrowest possible market, high end letterhead, the combined market shares would still be moderate. In addition, the post-merger HHI would be [900-1600]* with a delta of [100-225]*.173
510. Taking these factors into account, it should be concluded that the proposed concentration would not lead to a significant impediment to effective competition in the market for premium letterhead regardless of whether the market is defined as high end letterhead, standard and premium paper used for letterhead applications or premium letterhead, 80-130g.
D. Paper distribution
170 Questionnaire to producers letterhead of 8 February 2008. 171 See letter complainant, of 30 January 2008; see Reply to "Questionnaire to producers letterhead of 8
February2008". 172 See Paragraph 25 of the Guidelines on the assessment of non-horizontal mergers under the Council
Regulation on the control of concentrations between undertakings (the Non-horizontal Guidelines). 173 Calculated on the basis of the market shares for 2006 in volume.

94
511. The downstream market for paper distribution is vertically affected by the proposed merger. Arjowiggins is a 100% subsidiary of Sequana Capital, of which Antalis, a paper distributor, is also a 100% subsidiary.
512. In 2006, Antalis had a market share of [0-10]*% on an EEA-wide overall paper distribution market including direct sales from paper producers. In a number of EEA countries, Antalis had market shares of between [0-10]*% and [0-20]*%. However, in Estonia, Latvia and Lithuania, Antalis had higher market shares of between [20-30]*% and [40-50]*%.174 Direct sales from paper manufacturers excluded, in 2006 Antalis had an EEA-wide market share of [10-20]*%, while the national market shares in general were between [0-10]*% and [20-30]*%. In several EEA countries, however, Antalis had market shares of between [20-30]*% and [50-60]*%.175
513. […]*.176
514. In addition, apart from carbonless paper, the transaction does not lead to a significant impediment to effective competition on the horizontally affected markets for paper production as a result of the merger. In the absence of market power from Arjowiggins in these paper production markets, input foreclosure is unlikely.177 As for the carbonless market, input foreclosure is unlikely due to sufficient capacities in the market.
515. Customer foreclosure is equally unlikely. First of all, it should be noted that concerning carbonless paper, Antalis is already sourcing almost all of its carbonless paper from Arjowiggins. Therefore, the proposed concentration would not lead to any change in this respect. Also, it is highly doubtful whether Antalis would have market power on the paper distribution market. Yet, a significant degree of market power in the vertically related market is necessary for a company to be able to engage in customer foreclosure.178 Antalis still faces strong competitors even in those national markets were it has rather high market shares. Accordingly, there would still be sufficient economic alternatives left for the paper producers to sell their products.179 There is also no indication that the ability of upstream rivals to compete would be impaired and that, as a result, consumers would be harmed even in case of a customer foreclosure strategy.
516. On the basis of the above, it should be concluded that the transaction raises no vertical competition concerns in paper distribution.
VII. […]*
517. […]*180, […]*.
174 Form CO, Annex 7.C, page 3. 175 Form CO, Annex 7.C, page 4. 176 Form CO, page 110. 177 See Decision of 24 October 2007 in case COMP/M.4753, Antalis/MAP, Recital 8. See also the Non-
horizontal Guidelines, at paragraph 35. 178 See the Non-horizontal Merger Guidelines, paragraph 61. 179 See the Non-Horizontal Merger Guidelines, paragraphs 61 and 66. 180 […]*.

95
518. […]*:
i. […]*;
ii. […]*
iii. […]*.
519. […]*. 181
520. […]*.
521. […]*.
522. […]*.
523. […]*.
524. […]*.
i. […]*.
525. […]*182. […]*.
526. […]*.
527. […]*.
528. […]*.183
529. […]*.
530. […]*.184 […]*185, […]*.186 […]*.187
531. […]*ble.
532. […]*.188 […]*.189 […]*.
533. […]*.
ii. […]*
181 […]*. 182 […]*. 183 […]*. 184 […]*. 185 […]*. 186 […]*. 187 […]*. 188 […]*. 189 […]*.

96
534. […]*.
535. […]*.
536. […]*.
537. […]*.
iii. […]*
538. […]*.
539. […]*,190 […]*.
540. […]*.191 […]*
541. […]*.
542. […]*.192 […]*.
543. […]*.
VIII. COMMITMENTS SUBMITTED BY ARJOWIGGINS
544. On 7 April 2008, Arjowiggins submitted undertakings in which it commits itself to divest the carbonless paper business of the Reflex mill ("the Divestment Business" further described in the commitments annexed to this Decision) to a viable purchaser in order to restore effective competition in the carbonless paper market. The divestiture removes the competitive overlap between Arjowiggins and Reflex in carbonless paper.
545. […]*.
546. The Commission has market tested the commitments submitted by Arjowiggins with customers and competitors in order to evaluate their ability to restore effective competition in the markets for carbonless paper. […]*. Most respondents to the market test confirmed that the divestiture of the carbonless paper business of Reflex would eliminate the competitive overlap and thus remove the competition concerns in the market for carbonless paper. […]*.
547. […]*, the commitments also stipulate an up-front divestiture, whereby the notified transaction can be implemented only after a successful sale. If no acquirer has been found at the end of the divestiture period, the merger is abandoned and the entire Reflex business (including the carbonless paper, tracing paper and premium fine paper businesses) remains with M-Real Zanders. A 'hold separate manager' will ensure the continued independent operation of the Reflex mill (including the tracing and premium fine paper businesses to be
190 […]*. 191 […]*. 192 […]*.

97
acquired by Arjowiggins) until either a binding asset purchase agreement is signed with an acquirer or, alternatively, the mill reverts to M-Real Zanders.
548. On 28 April 2008, Arjowiggins, in response to the outcome of the market test, made a number of improvements to the commitments in order to enhance their effectiveness. The improvements concern the procedural provisions of the commitments, including clarifications to the hold-separate obligations and adjustments to certain deadlines.
549. The divestiture stipulated by the final commitments would fully remove the competitive overlap in the carbonless paper market and would restore the market structure prevailing prior to the transaction. The main risks result from the very limited number of potential acquirers who can operate the divested assets as a viable business. For example, the acquirer would need to sustain the plant-level fixed costs arising from the on-site power plant, logistics, warehousing and general facility operation following the removal of the tracing paper and premium fine paper assets by Arjowiggins. Because the viability of the divestment business significantly depends on the identity of the acquirer, the commitments stipulate that Arjowiggins cannot implement the notified transaction until a binding asset purchase agreement with a viable acquirer has been signed. In addition, Arjowiggins commits to abandon the transaction and return the entire Reflex mill to M-Real Zanders in case the sale to a viable competitor within the Divestiture Period fails.
550. Hence, the commitments submitted by Arjowiggins restore the competitive situation prevailing prior to the notified transaction because they either lead to the divestiture of the carbonless paper business to a viable competitor or to a preservation of the status quo ante. It should therefore be concluded that the commitments remove the significant impediment to effective competition caused by the transaction as originally notified.
551. The scope of the required remedy does not change regardless of the definition of relevant product and geographic markets because the divestment business could not be split without affecting its viability.193 The carbonless paper production […]* machine and M-Real Zanders uses substantially the same trademarks for carbonless paper (reels and sheets) across the EEA. Removing trademark rights for individual EEA countries, apart from leading to practical problems due to split brands, would also undermine the Reflex mill's viability because it would reduce capacity utilisation. In any event, under a national market definition, the EEA countries in which the proposed transaction would significantly impede effective competition account for approximately three quarters of the Reflex mill's EEA sales. Even under a national market definition, it would thus not be possible to devise a less intrusive remedy than under an EEA-wide geographic market.
IX. CONDITIONS AND OBLIGATIONS
552. The second subparagraph of Article 8(2) of the Merger Regulation provides that: The Commission may attach to its decision conditions and obligations intended to ensure that the undertakings concerned comply with the commitments they have entered into vis-à-vis
193 […]*.

98
the Commission with a view to rendering the concentration compatible with the common market.'
553. The achievement of the measure that gives rise to the structural change of the market is a condition, whereas the implementing steps which are necessary to achieve this result are generally obligations on the parties. Where a condition is not fulfilled, the Commission decision declaring the merger to be compatible with the common market no longer stands. Where the undertakings concerned commit a breach of an obligation, the Commission may revoke the clearance decision in accordance with Article 8(6) of the Merger Regulation. The undertakings concerned may also be subject to fines and periodic penalty payments pursuant to Articles 14(2)(d) and 15(1)(c) of the Merger Regulation.
554. In view of the foregoing, this Decision should be conditional upon full compliance with the undertaking that the parties will divest the Divestment Business to a purchaser approved by the Commission pursuant to paragraph of "Section B" of the Commitments. The Divested Business is further described in paragraph 4 of "Section B" of the Commitments and in the Schedule attached as Annex 4. to this Decision.
X. CONCLUSION
555. It is concluded that the commitments submitted by the notifying party are sufficient to remove the competition concerns raised by this concentration. Accordingly, subject to the full compliance with the commitments submitted by the notifying party, it should be declared compatible with the common market and the functioning of the EEA Agreement. This Decision is adopted in application of Article 8(2) of the Merger Regulation and of Article 57 of the EEA Agreement.

99
HAS ADOPTED THIS DECISION:
Article 1
The notified operation whereby Arjowiggins acquires sole control of Reflex within the meaning of Article 3(1)(b) of the Regulation (EC) No 139/2004 is hereby declared compatible with the common market and the EEA Agreement.
Article 2
Article 1 is subject to full compliance with the conditions set out in Section B of Annex 4.
Article 3
Article 1 is subject to full compliance with the obligations set out in Sections C, D and E of Annex 4.
Article 4
This Decision is addressed to:
Arjowiggins SAS 117, quai du Président Roosevelt 92442 Issy-les-Moulineaux Cedex France
Done at Brussels, 04-06-2008
For the Commission (signed) Neelie KROES Member of the Commission

100
ANNEX 1: CARBONLESS PAPER MARKET DEFINITION ANALYSIS
1. The Commission obtained monthly volume sales and value sales by country and by product (CB reels, CF reels, CFB reels, CB sheets, CF sheets and CFB sheets) from the five largest producers of carbonless paper (Arjowiggins, Reflex, Mitshubishi, Torras and Koehler) that account for about 90% of the total market sales for the January 2004 to December 2007 period.1 In addition, the Commission also obtained transaction-level data at the invoice level from Arjowiggins for the January 2002 to December 2007 period and from Reflex for the January 2003 to December 2007 period.
2. The market definition proposed by the notifying party defined an “all carbonless” EEA-wide market. However, as the notifying party did not provide any empirical evidence for their market definition, the Commission undertook the analysis on its own using the above-described data. The analysis was performed for six out of the 29 EEA countries: Germany, France, Italy, Poland, Spain and the UK. These countries account for around three quarters of the total carbonless sales in the EEA over the period. In performing the checks on the data submitted by all the different producers and the transaction data submitted by the notifying party, the Commission noted that some of the data appears to be quite noisy.2 Thus, the Commission decided to perform two types of analysis: the first one is based on the data from the five largest producers, and the second one is based on Arjowiggins' transaction data.
3. For the first type of analysis, the data from the five largest producers was aggregated by country, and country-specific prices were created for each of the six products ("the producer-level data set"). The Commission then used those aggregate country prices to perform the market definition tests. Although this type of data is inherently subject to measurement error, as it is submitted by five independent producers (and thus generated by five different independent data generating processes), this is mitigated by averaging over the five producers. The Commission however notes that the producer-level data set appears to be somewhat less reliable for the sheets market than the Arjowiggins transaction data that the Commission was able to clean.3
4. The Arjowiggins' transaction data was aggregated across all the consumers to a country/product level for the second type of analysis.4,5 As the Arjowiggins' transaction
1 One competitor only provided the data from 2005 onwards. Another could not deliver data for December 2007.
2 Indeed, Arjowiggins re-submitted its transaction data twice, as it noted a number of errors in its first submission of the transaction data.
3 There appears to be more noise in the sheets data. This is likely due to the sheets market being significantly smaller than the reels market.
4 In doing this aggregation, the Commission has at first aggregated across all the sales to a particular customer by month at a CF, CFB and CB level, and excluded any outlier observations with negative values or quantities.
5 Although the Commission also had access to data from Reflex, it does not report the results from this analysis, as some of the data appears to be quite noisy. This is because Reflex has a fairly low customer base in a

101
data identified sales to each customer, it was possible to exclude sales to Antalis, a 100% owned merchant subsidiary of Arjowiggins' parent company Sequana Capital, from the analysis.6 This is because those sales could essentially be considered as internal sales, and the Commission is mainly interested in its assessment of the impact of the transaction on third-party customers. However, the Commission also considered the results from the analysis of the Arjowiggins transaction data that includes sales to Antalis in its market definition assessment.
5. The Commission used two techniques in particular to examine the extent to which prices move together over time: correlation analysis and stationarity analysis:
o Correlation analysis measures the extent to which “high”, “medium” and “low” prices for one product are associated with “high”, “medium” and “low” prices for another product. If two prices move perfectly “in step”, then the correlation coefficient is one; if there is no association between the prices, the correlation coefficient is zero. To assess whether the prices of two products are sufficiently correlated to be considered in the same market, it is typical to use as a benchmark the correlation between two products that are accepted as being in the same market. However, if such a benchmark is not readily available, a view must be taken on what level of the correlation coefficient is high enough to indicate that two products are in the same market.
o Stationarity analysis uses sophisticated statistical tests to gauge whether the relative price of two products tends to revert to a constant value over time (that is to say whether the relative price is “stationary”). Essentially, it is a test of whether the “law-of-one-price” holds between the products: if products are close substitutes, then their prices can only deviate from each other for a short period of time. If this law does hold, then this is consistent with these products being in the same market (competing directly with one another) for competition purposes.
6. One important element to correlation analysis is controlling for common shocks to prices across the different products such as common cost movements or currency movements, as it is possible that high correlations could be driven entirely by changes in these common elements. Given that stationarity tests are looking at relative prices, the role of these common elements is reduced to a minimum. Additionally, stationarity tests do not require the use of any benchmarks. Thus, it is important to look at the results of both of these types of analysis together.
number of countries (particularly for sheets), and thus any outliers (for example, credit notes and adjustments) may have a larger impact on monthly prices at the country level. This may make prices look less related than they are in reality.
6 In addition, there were 14 sales to Arjowiggins' internal units that were excluded as well.

102
Arjowiggins' observations and analysis
7. Arjowiggins made a number of comments regarding the procedure the Commission adopted with regard to the data it chose to use, as well as the cleaning techniques that it employed. In particular, Arjowiggins argued that:
"…, the SO does not report results from the analysis of Reflex transaction data on an individual basis. Nevertheless, the Commission has included Reflex data when analyzing the combined data from the largest carbonless producers. To ignore said information in the 'producer-level' analysis is thus inconsistent."7
The Commission disagrees with Arjowiggins' criticism. Given that Reflex has a very small number of customers in some of the markets that the Commission analyzed, it was impossible to use the database consistently across all the months, in all the countries. For example, in some cases the prices differed widely across a very small number of customers in a given month, and thus the Commission decided not to rely on this data, although the results were broadly in line with the rest of the analysis described above. This does not, of course, have that much of an impact when the data are aggregated across the five largest producers, particularly given that the issue the Commission was facing was that Reflex' presence was not large enough.
8. Arjowiggins also argues that the Commission has not cleaned the Arjowiggins data properly, which "… may result in reaching erroneous conclusions."8 As an example, Arjowiggins presents in Figure 1 a graph of sheet prices in France with a large dip occurring prior to March 2003 and argues that this outlier should have been removed in the Commission's analysis. The Commission agrees with this statement, although it finds Arjowiggins' claims unfounded, as this outlier was indeed removed by the Commission in its analysis in the Statement of Objections as is indicated by Figure 21. The Commission, however, notes that Arjowiggins did not apply the same rigor to the data that it used for its own analysis and forwarded to the Commission. The database cleaned by Arjowiggins contains […]* observations with non-positive quantities and additional […]* observations with non-positive revenues. Once the Commission removed those observations with negative revenues and quantities, the Arjowiggins database still contained a number of outliers with resulting net prices ranging from the low of […]* EUR/ton to the high of more than […]* billion EUR/ton. These clearly are not sensible prices and should have been removed by Arjowiggins prior to performing the analysis.
9. An additional general remark is, however, in order with regard to data cleaning and, in particular, with regard to Arjowiggins' practice of what seems to be automatic discarding of the lowest and highest percentile of data (as they are deemed to be outliers). As Arjowiggins correctly points out in its report of January 25, 2008 (see footnote 43), removing all the outliers reduces price variability. Thus one is more likely to find that prices are moving together than if proper care is not taken in removing the outliers. At the
7 See Section 2 of Arjowiggins Report "Carbonless market definition," dated 17 March 2008 (hereafter, the "Market Definition Report").
8 See Section 2 of the Market Definition Report.

103
same time, however, it may be that even "genuine and correct" observations are deleted when performing such an exercise. In other words, the price variability may be reduced too much, and thus the resulting prices may move more closely together than they would in reality. From this perspective, the Commission considers both its own as well as Arjowiggins' cleaning exercise as (probably too) conservative, as it is more likely that the data will confirm that market definition proposed by Arjowiggins (that is to say that prices move closely together across different markets and across different products).
10. Arjowiggins also argues that the Commission's analysis suffers from methodological flaws. With regard to price correlations, Arjowiggins argues that "Price correlation analysis is not conclusive per se. So in any case price correlation per se should not be used to conclude whether two products belongs or not to the same relevant market".9 This appears to be for two reasons:
• "On the one hand, high correlations may suggest that markets should be widely defined when in fact the correlation is spurious. For instance, spurious price correlation arises when two price series are subject to a common influence … without the series being directly related to each other. This problem can be addressed to some extent by computing correlations of margins instead of prices."
• "On the other hand, a low correlation may lead to a narrow market definition when in fact two price series are related but subject to significant random disturbances which break such correlation. For instance, when prices respond to changes in market conditions with a time lag, the correlation between contemporaneous prices will not capture the response of the other goods' prices to the price change of any given good".
11. Again the Commission completely agrees with both of those points. Indeed, the Commission has made this clear in paragraph 18 of the Statement of Objections, where is stated that "…some of the close movement in prices may be driven, for example, by common movements in input costs or exchange rate shocks (the so-called spurious correlations). In addition, the Commission supplements its correlation analysis with stationarity analysis that is precisely designed to uncover any responses with a time lag.10 However, it is not clear why Arjowiggins argues that common costs need to be removed, as the Commission's concern is the finding that the correlation coefficients it obtained from its analysis are not high enough, and the removal of the common costs would make them even lower. In other words, it is not quite clear how (although correct) Arjowiggins' argument applies to the Commission's findings
12. With regard to the stationarity analysis performed by the Commission, Arjowiggins argues that "the implementation of the analysis suffers from certain shortcomings." That is because:
9 See Section 2 of the Market Definition Report.
10 Indeed, even Arjowiggins acknowledges in Section 2 of the Market Definition Report that "it is true that the Commission supplements its price-correlation analysis with a stationarity test."

104
"In order to select the most appropriate specifications they exclusively use the AIC criterion. In almost all cases they conclude that a specification with deterministic trend is preferable in terms of AIC. Adding an additional variable always increases the AIC, regardless of whether or not the additional is statistically significant. For example, the inclusion of a deterministic trend can only be justified that if it is statistically significant."
13. The Commission rejects Arjowiggins' entire statement with the exception of the description of its finding. First, the Commission did not base its finding only on the AIC (Akaike criterion), but also on the visual inspections of the relative prices (there are 20 graphs of relative prices in the Statement of Objections).11 In other words, once a clear trend is seen in the plots, it seems counter-productive to argue over whether a trend is found to be significant or not. Second, it is simply not correct that adding a variable always increases AIC. The basic formula for AIC is 2k – 2ln(L), where k is the number of parameters in the regression, and L is the likelihood function at its maximum. Given that the most preferred model is the model with the lowest value of AIC, AIC "punishes" for adding an additional parameter to the model unless the value of the likelihood function increases by even a higher value (due to the explanatory power of the additional variable).12 In other words, the Commission's regressions "get punished" for an addition of the trend, and it is only the explanatory power of this trend that more than outweighs this and allows the Commission to prefer the specification with the trend. Similarly, it is simply not correct that adding a deterministic trend is only justified if it is significant, as the lag structure of the Dickey-Fuller tests is also not based on the significance of the different parameters but the overall value of the AIC.13
14. The Commission also requested the statistical code that Arjowiggins used for its stationarity analysis, in which Arjowiggins ran the Dickey-Fuller tests for models up to six lags. However, this test was not implemented properly by Arjowiggins, as Arjowiggins failed to note that the likelihood changes as the number of observations changes, which is indeed the case as the number of lags is increased in the Dickey-Fuller tests.14 Thus, the Dickey-Fuller tests that Arjowiggins uses to determine the number of lags and the inclusion of the trend in the stationarity tests are not directly comparable across the different specifications
11 Arjowiggins also seems to confirm that in its presentation at the Oral hearing of March 2008, in which one of its bullet point states "The SO two quantitative approaches for carbonless … analysis of the evolution of relative prices … visual inspection".
12 AIC can be thought of as "adjusted R-squared".
13 For example, an augmented Dickey Fuller test that has both of the lags non-significant for a lag structure with 2 lags, but has the second lag significant for a lag-structure with 3 lags, although the other lags are not significant. In such instance, a pure significance of the parameter estimate provides some very conflicting and inconclusive evidence, and thus the AIC is particularly well suited for the choice of the lag structure in the time-series tests. Given that the time trend is just another parameter in the augmented Dickey-Fuller regressions, the same logic applies.
14 Consider, for example, a data set with 70 monthly observations. Performing a Dickey-Fuller test with one lag implies that the time-series regression will be based on 69 observations, while a Dickey-Fuller test with 6 lags implies that the time-series regression will have 64.

105
implemented by Arjowiggins. As a result, the Commission cannot accept any of Arjowiggins' stationarity analysis.
15. Arjowiggins continues with its criticism of the Commission's analysis and argues that there are other tests in addition to the AIC that the Commission should have implemented and that:
"the most appropriate way of testing whether two products are in the same relevant market using time series information is to test for the existence of cointegration between the prices of products – or regions when defining geographical markets – that potentially belong to the same relevant market. The Commission, however, has not addressed the possibility of applying such test."
16. First, the Commission notes that Arjowiggins has not itself complemented any of this criticism with results from any of these tests in its Market Definition Report. Secondly, as the Commission made it clear, it has also based its analysis on visual inspections of the plots of the relative prices that in many instances quite clearly display non-stationary behavior and deterministic trends, and thus the Commission is satisfied with the findings from the stationarity analysis that are consistent with that. Thirdly, while the Commission agrees that (particularly for the geographic market definition) stationarity analysis should be supplemented by cointegration, this is only in case of the finding that the relative prices in relation to a particular country are stationary (that is to say that it appears that the countries belong to wider geographic markets). Given that the Commission does not find this to be the case, there is no reason to further continue with supplementing the stationarity tests with cointegration.
17. To conclude, the Commission rejects all of Arjowiggins' criticism of its data cleaning techniques or implementation of the correlation/stationarity tests, and thus the Commission's analysis and its results remain unchanged from the analysis in the Statement of Objections.
Product Market Definition
18. The notifying party proposes the product market definition to be an “all carbonless” product market. Without any available empirical evidence for this assertion, the Commission tried to verify this by implementing the hypothetical monopolist test. In principle, this test requires the Commission to start with the smallest candidate product market and to see whether this product market could be considered as a relevant market, or whether the product market is a part of a wider market. In this case, this means that the Commission should start with the products at the CB, CF and CFB level and see whether they comprise larger “sheets” and “reels” markets. However, neither the notifying party nor the market testing has suggested that the Commission should consider such a narrow product market definition.
19. This is also confirmed by the results from simple correlations between the three types of sheets and three types of reels using the producer-level sales data. These suggest that the prices (with few exceptions) move fairly closely together – see Figure 3 through Figure 14 that plot the prices of the CB, CF and CFB products by country, and Table 9 through Table 20 that contain the underlying correlation coefficients. For reels, the correlations range from 0.47 to 0.98, with only two correlation coefficients (out of 18) below 0.8. The

106
correlations for sheets are somewhat lower, as they range from 0.48 to 0.89. This is most likely driven by the noise in the data, as the sheets market is significantly smaller than the reels market (and thus any outlier will have a larger impact on the averages).
20. The results from the analysis using Arjowiggins' data without Antalis are quite similar – see Figure 15 through Figure 25 for the plots of net prices and Table 21 through Table 31 for the correlation coefficients.15 The correlations range from [0-1]* to [0-1]* (with only 3 coefficients out of 18 below [0-1]*, and all of these coefficients are in Poland) for prices of reels, and [0-1]* for prices of sheets.16 17 Thus, the Commission accepts that the carbonless market is not narrower than the “sheets” and “reels” markets. It remains to be assessed whether reels and sheets are themselves part of a wider “all carbonless” product market, or whether the data point to them being separate relevant markets.
21. The Commission then performed a similar market definition exercise for reels and sheets. Figure 26 through Figure 31 plot the reels and sheets prices by country using the producer-level sales data, and Figure 33 through Figure 37 plot these prices for Arjowiggins' transaction data without Antalis. The correlation coefficients that are summarised in Table 1 below range from -0.32 to 0.50 for the producer-level sales data and […]* for Arjowiggins data without Antalis.18
Table 1: Correlations between reels and sheets prices by country
Country Producer-level sales data Arjowiggins (w/o Antalis)
France 0.50 […]*
Germany 0.20 […]*
Italy -0.32 […]*
Poland 0.49 […]*
Spain 0.45 […]*
UK 0.48 […]*
Source: Sales data from the 5 largest producers of carbonless paper
22. If one accepts that the products at the CF, CB and CFB level are in the same market, these correlations can then be used as a benchmark against which to assess the correlations
15 The results are fairly similar for Arjowiggins data that includes Antalis.
16 Sheets are only sold via […]*, and thus […]* is not included in the sheets analysis.
17 While the results for reels are very similar for both the producer-level sales data and the Arjowiggins transaction data, the correlations for the sheets data suggests that the producer-level sales data is more noisy than the Arjowiggins data.
18 If Antalis is included, the results are very similar to those reported.

107
between prices of sheets and reels. The correlations between prices of reels and sheets are significantly lower than the correlation at the CF, CB and CFB level. The largest correlation between prices of reels and sheets is only slightly higher than the lowest correlation at the CF, CB and CFB level for the producer-level sales data. The same is true for Arjowiggins data: with the exception of the correlation of [0-1]* for the UK prices, the correlations range from [0-1]* to [0-1]*. This suggests that reels and sheets are not in the same market.
23. This is also confirmed by the plots of the net prices of reels relative to the net price of sheets in Figure 32 for producer-level sales data, and Figure 38 for Arjowiggins data without Antalis. There seems to be a clear upward trend in the relative prices in both sets of prices, which would suggest that there is no long-term average that the relative prices converge to. In other words, the “law of one price” does not seem to hold, which implies that reels and sheets are likely not part of the same market.
The stationarity tests summarised in Table 32 and
24. Table 33 for the producer-level sales data and the Arjowiggins' transaction data without Antalis confirm this.19 The null hypothesis of stationary relative prices based on the producer-level sales data is rejected in all instances with the exception of the United Kingdom: the Augmented Dickey-Fuller (ADF) tests imply that the relative prices are trend stationary.20 The tests based on the Arjowiggins transaction data without Antalis reject the hypothesis of stationarity in all instances: the ADF tests imply that the relative prices are trend non-stationary for all countries but France and trend-stationary for France. Thus, there is no long-run average value to which the relative prices are converging to (that is to say reels and sheets prices are not closely related).
25. To conclude, there is almost no evidence that would be consistent with reels and sheets being part of the same market. The correlation coefficients between sheets and reel prices are significantly lower than the correlations between the CB, CF and CFB products (sheets and reels) that are accepted to be in the same market by both the notifying party and the Commission. The stationarity analysis also overwhelmingly rejects the hypothesis that the relative prices of reels to sheets are stationary (that is to say that there is a long-term stable relationship between sheets and reels). Thus much of the evidence points to reels and sheets being separate relevant markets.
19 The findings from the stationarity tests on Arjowiggins transaction that include Antalis are exactly the same as without Antalis.
20 The stationarity tests were carried out using augmented Dickey-Fuller tests with up to six lags, and the Akaike information criterion was used to pick the correct length size as well as whether the regressions should include a trend or not. The results are presented for both tests for up to the six lags, and with and without a trend.

108
Arjowiggins' observations and analysis
26. […]*21. […]*22.
Table 2: Gross margin correlations across carbonless varieties
[…]* Source: Arjowiggins
27. While the Commission disagrees with Arjowiggins' methodology for a number of reasons that are described below, let us suppose for a moment that the results in Table 2 are actually taken at a face value. Even then, the Commission believes that these findings are actually supportive of the conclusion that reels and sheets do not belong to the same market. This is because (as the Commission explains above and explained in Paragraph 5 of the Annex to the Statement of Objections) in order to assess whether the prices of two products are sufficiently correlated to be considered in the same market, it is typical to use as a benchmark the correlation between two products that are accepted as being in the same market. This is something that Arjowiggins failed to do. Following this widely accepted principle, the correlations of the three types of reels and sheets coatings can be used as benchmarks against which the correlations between reels and sheets can be assessed.23 The correlations for reels (that is to say between CB reels, CF reels and CFB reels) range from [0-1]* to [0-1]*, and the correlations for sheets (that is to say between CB sheets, CF sheets and CFB sheets) range from [0-1]* to [0-1]*. This implies that [0-1]* is the lowest possible correlation benchmark that is indicative of reels and sheets as being in the same market. The correlation between CB reels and CB sheets is [0-1]*, between CF reels and CF sheets is [0-1]*, and between CFB reels and CFB sheets is [0-1]*. Thus, correlations for two out of the three coating types are clearly lower than [0-1]*. In addition, even the highest of the three correlation coefficients between reels and sheets of the same coating is [0-1]*, which is right at the boundary of a correlation that could possibly indicate that two products are in the same market.
28. The Commission has, however, identified two key methodological problems that strongly suggest that no weight should be placed on the above results even though they support the Commission's case. First, Arjowiggins presents its analysis based on all world-wide sales of the three types of coatings for reels and sheets. However, the hypothetical monopolist test clearly suggests that one should start out with the smallest possible candidate product and geographic market and see whether other products/geographic locations could possibly be added to this candidate market. In this case, this means that the above analysis should have been done at a country level and not at a world-wide level. This is particularly relevant
21 See Section 3 of the Market Definition Report
22 See Section 3 of the Market Definition Report.
23 Recall from the Statement of Objections and the Reply to the Statement of Objections that both Arjowiggins and the Commission agree that (i) CB reels, CF reels and CFB reels belong to the same reels market, and (ii) CB sheets, CF sheets and CFB sheets belong to the same sheets market.

109
here given that there are serious doubts as to how wide the geographic market is and, in particular, given that it is very unlikely that it is world-wide.24
29. Second, Arjowiggins carried out its market definition analysis on percentage margins. This is, however, incorrect, as these tests should be clearly based on price analysis in accordance with the Commission Notice on the definition of the relevant market for the purposes of Community competition law (OJ C 372, 9.12.1997, p. 5) :
30. "There are a number of quantitative tests that have specifically been designed for the purpose of delineating markets. These tests consist of various econometric and statistical approaches: estimates of elasticities and cross-price elasticities for the demand of a product, tests based on similarity of price movements over time, the analysis of causality between price series and similarity of price levels and/or their convergence." (emphasis added) While the Commission agrees with Arjowiggins that common costs should be taken out (and thus the Commission itself performed stationarity tests on relative prices that precisely do that), the proper way of doing this is to adjust the prices for the common costs by subtracting the common costs, that is to say, these adjusted prices can be thought of as margins in monetary (euro) terms. This is significantly different from looking at margins in percentage terms that are defined as (price-cost)/price.
31. Nonetheless, given that the Commission agrees that common costs should be removed, the Commission decided to do Arjowiggins' analysis again, while correcting the shortcomings that have been identified above, to further assess whether reels and sheets are in the same market.25 Table 3 summarises the ranges for the benchmark correlations for reels and sheets, as well as the range of correlations between reels and sheets of the same coating.26 All the correlations between reels and sheets are lower than the benchmark correlations with the exception of the sheets benchmark in the United Kingdom, that is to say, 16 out of 18 correlation coefficients are lower than the benchmark values.27 These results serve as additional evidence that reels and sheets do not belong to the same market from the antitrust perspective.
Table 3: Adjusted price (gross margins in euro) correlations across carbonless varieties by country […]* Source: Arjowiggins data, Commission's calculations
24 Even Arjowiggins' economic advisers do not claim that the geographic market is world-wide. Instead, Arjowiggins' economic advisers merely suggest in Section 5 of the Market Definition Report that "there is by now considerable evidence that the boundaries of the relevant geographic market are in the process of expanding beyond those of the EEA."
25 In this analysis, the Commission also removed all the outliers that Arjowiggins left in the data set, and that the Commission identified above.
26 See Table 58 through Table 63 for the full sets of the underlying correlation coefficients by country.
27 While the Commission disagrees with Arjowiggins use of percentage margins, it has also re-done Arjowiggins' analysis by country for completeness, and the same findings hold. See Table 64 through Table 69.
110
32. Arjowiggins further supplemented its correlation analysis in the Market Definition Report by a memorandum of 28 March 2008, in which Arjowiggins "tested the extent to which relative gross margin of reels and sheets is stationary over time".28 The Commission notes that this stationary analysis is carried out for the three types of coatings by country. In other words, Arjowiggins seems to be in agreement with the Commission that the product market definition analysis should be done for the smallest candidate market possible, which in this case would be a national market rather than the world. However, the Commission notes that it is not sensible to do stationarity tests on relative percentage margins. Assuming there are products A and B with associated prices P1 and P2 and costs C1 and C2, this implies that Arjowiggins is studying convergence of [P2(P1- C1)/ P1(P2- C2)]. This is not the same as looking at the ratio of the prices [P1/P2], or prices excluding the common costs [(P1- C1)/(P2- C2)]. Thus, Arjowiggins' results cannot be used for geographic market definition analysis, as Arjowiggins is not modelling the proper variables of interest.
33. For completeness, however, the Commission discusses the actual findings that Arjowiggins submitted and they are summarised in Table 4.
Table 4: Summary of the stationarity tests controlling by the coating type
[…]*
34. The Commission notes that the series that are identified with asterisks should be regarded as series with a trend given that the Commission rejected Arjowiggins' arguments above regarding how series with a trend should be identified. […]*, because the trend is not found to be significant in the Dickey-Fuller tests. Figure 1 plots the relative margins for […]*. If these relative margins were stationary, it should be expected that the relative margins oscillate around a "flat" line. It is quite clear from this plot that the prices are instead upward-trending over time and thus are not stationary. The only reason why the trend is not estimated precisely is the large dip at the end of 2005/beginning of 2006, which however does not change the conclusion that the relative margins are not stationary as the AIC suggests. The same also holds true for the relative […]*. Thus, the Commission rejects Arjowiggins' claims that any of these relative margins are stationary. This, however, means that, even if Arjowiggins' methodology was accepted, the results suggests that with the exception of the CB coating, there is no robust evidence that reels and sheets are in the same market, and much of the analysis actual points towards the two being in separate markets.
Figure1: […]*
Source: Arjowiggins data
35. In addition, as noted above, Arjowiggins failed to note that the likelihood function (and thus the AIC) changes as the number of lags is increased in the Dickey-Fuller tests. This implies
28 See Arjowiggins' Memorandum of 28 March 2008 "Carbonless paper market definition: Supplementary submission", (hereafter "the Supplementary Analysis").

111
that the test statistics that Arjowiggins calculated are not directly comparable across the different specifications and lag structures, and thus the Commission cannot accept any of Arjowiggins' stationarity analysis on this basis either.
36. To conclude, the Commission rejects both the Market Definition Report, as well as the Supplementary Analysis, due to a number of methodological shortcomings. Thus, the Commission maintains its original conclusion that it reached in the Statement of Objections: there may be separate product markets for reels and sheets of carbonless paper (although the exact market definition can be left open).
Geographic Market Definition
37. The Commission also tested the notifying party's assertion that the geographic market is EEA-wide by assessing how prices developed over time in the six countries. If the market is EEA-wide, it would be expected that the prices of reels and sheets move closely together across the different countries. The intuition behind this test is as follows: if markets are EEA-wide, any "misalignment" in national prices would only be temporary, as prices would be forced back into line due to imports from the "high price country" to the "low price country".
38. Figure 39 and 40 plot the country-level prices for reels and sheets, while Table 34 and Table 35 report the underlying correlation coefficients. For reels, there appears to be some evidence that prices in France, Italy and Poland move together, as the correlations range from 0.86 to 0.94. The correlations between Germany and these three countries range from 0.73 to 0.77, which is somewhat lower. The correlations between the United Kingdom and the four countries range from 0.45 to 0.51, which suggests that the United Kingdom may be systematically different from the other countries. The correlations range from -0.16 to 0.46 for prices of sheets and, at a face value, do not provide much evidence for markets that are wider than national.
39. The findings are very similar for Arjowiggins' transaction data without Antalis. Figure 48 contains the plots of Arjowiggins' net prices by country for sheets, and Table 43 contains the correlation coefficients. The correlations range from [0-1]* to [0-1]* ([0-1]* to [0-1]* excluding the single negative correlation coefficient). These correlation coefficients are also not high enough to provide much evidence for a sheets market that is EEA-wide. The results for reels are broadly similar to the findings from the analysis of the producer-level sales data (see Figure 47 for the plot of the reels prices and Table 42 for the correlation coefficients).29
40. The Commission also undertook a stationarity analysis of relative prices to further strengthen its geographic market tests. This is for three reasons. First, there is no clear benchmark against which to assess the correlations reported above. Secondly, some of the close movement in prices may be driven, for example, by common movements in input costs or exchange rate shocks (the so-called spurious correlations). Thirdly, while contemporaneous correlations may be lower due to the possible presence of outliers, the
29 The findings are quite similar, when sales to Antalis are included: the correlations for sheets range from [0-1]* to [0-1]*, and the correlations for reels range from [0-1]* to [0-1]*.

112
stationarity tests are robust to those, as the stationarity tests examine whether relative prices converge to a stable long-term average. This is particularly important in this case, as prices appear to be quite noisy is some instances.
41. The Commission has chosen Germany, France and Italy, the three largest markets in the EEA, as bases for its construction of the relative prices to ensure that the stationarity tests are not driven by a choice of a particular country. Starting with the results for the producer-level sales data, Figure 41and Figure 42 plot the average net prices of reels and sheets relative to the net prices in France, Figure 43 and Figure 44 plot the average net prices of reels and sheets relative to the average net prices in Germany, and Figure 45 and Figure 46 plot the average net prices of reels and sheets relative to the average net prices in Italy. The relative prices for reels mostly appear to be subject to a clear trend, suggesting that the relative prices are not stationary. There also appears to be a slight trend in the relative prices for sheets.
42. The results from the stationarity tests for the producer-level sales data confirm the findings in the figures. Table 36, Table 38 and Table 40 contain results for the relative prices of reels for France, Germany, and Italy. Table 37, Table 39 and Table 41 contain the results for the relative prices of sheets for France, Germany and Italy. Table 5 summarises the findings from the stationarity tests: there are significant trends in the relative prices, and thus there is not much support for markets that are wider than national.
Table 5: Summary of the stationarity tests (producer-level sales data)
France Germany Italy
Reels Sheets Reels Sheets Reels Sheets
France Trend-stationary Trend-stationary Trend-stationary Trend-stationary
Germany Trend-stationary Trend-stationary Trend-stationary Stationary
Italy Trend-stationary Trend-stationary Trend-stationary Stationary
Poland Non-stationary Stationary Trend-stationary Trend-stationary Trend non-stationary
Trend non-stationary
Spain Non-stationary Trend-Stationary Trend-stationary Trend-stationary Stationary Trend-stationary
UK Trend-stationary Stationary Stationary Trend-stationary Trend-stationary Trend non-stationary
Source: Sales data from the 5 largest producers of carbonless paper
43. The findings from the stationarity tests for Arjowiggins' transaction data without Antalis also point to national markets. The plots of the relative prices suggest that there are trends in the relative prices.30 The results from the ADF tests confirm this: there is only very limited evidence that would point towards markets that are wider than national with the
30 See Figure 49 and Figure 50 for plots of the average net prices of reels and sheets relative to the net prices in France, Figure 951 and Figure 52 for plots of the average net prices of reels and sheets relative to the average net prices in Germany, and Figure 53 and Figure for plots of the average net prices of reels and sheets relative to the average net prices in Italy

113
exception of the French sheet market (see Table 6 for a summary).31 Thus, these results do not provide any evidence that would consistently point towards an EEA-wide market.
Table 6: Summary of the stationarity tests (Arjowiggins, excluding Antalis)
[…]*
Source: Arjowiggins transaction data excluding Antalis
44. The findings from the stationarity tests using the Arjowiggins' transaction data that includes Antalis are also broadly consistent with the above findings.32 Table 7 below summarises the results from the stationarity tests.33 Prices in each country seem to move closely with prices in at most two other countries (for example, […]*). Thus, there is again no conclusive and robust evidence that would point towards an EEA-wide geographic market.
Table 7: Summary of the stationarity tests (Arjowiggins, including Antalis)
[…]* Source: Arjowiggins transaction data including Antalis
45. The findings from the stationarity tests suggest that there is no consistent evidence that would point towards EEA-wide markets. The producer-level sales data does not provide any evidence that the "law of one price" holds across the different markets for both reels and sheets. This is also true (with few exceptions) for the stationarity analysis on the Arjowiggins' data.
46. These results are also documented by the differences in price levels across the different countries.34 […]*.35 […]*.36
31 Table 44, Table 46 and Table 48 contain results for the relative prices of reels for France, Germany, and Italy. Table 45, Table 47 and Table 49 contain the results for the relative prices of sheets for France, Germany and Italy.
32 See Figure 57 and Figure 58 for plots of the average net prices of reels and sheets relative to the net prices in France, Figure 59 and Figure 60 for plots of the average net prices of reels and sheets relative to the average net prices in Germany, and Figure 61and Figure62 for plots of the average net prices of reels and sheets relative to the average net prices in Italy.
33 Table 52, Table 54 and Table 56 contain results for the relative prices of reels for France, Germany, and Italy. Table 53, Table 55 and Table 57 contain the results for the relative prices of sheets for France, Germany and Italy.
34 The Commission also notes that the cross-country price comparisons are suggestive of important differences between sheets and reels. […]*.
35 […]*.
36 […]*.

114
47. The hypothetical monopolist test requires the Commission to start with the smallest possible candidate geographic market (that is to say a national market) and to see whether such market is a relevant market, or whether it is a part of an EEA-wide geographic market as the notifying party suggests. Neither the correlation analysis nor the stationarity tests have provided any consistent evidence that would point towards EEA-wide markets. There also seem to be important differences in price levels among some countries. Thus, the results from the market definition tests are difficult to reconcile with an EEA-wide geographic market, as they provide only limited evidence for markets that are wider than national.
Arjowiggins' observations and analysis
48. Arjowiggins does not perform any stationarity or correlation tests for the geographic market definition in spite of noting in Section 2 of the Market Definition Report that "the most appropriate way of testing whether two products are in the same relevant market using time series information is to test the existence of cointegration between the prices of of products – or regions when defining geographical markets – that potential belong to the same relevant market."37 Instead, Arjowiggins proposes two analyses for delineation of the geographic market: (i) price dispersions within and outside of the EEA; and (ii) comparisons of the volumes sold in other countries at prices lower than those charged in the five largest member states to the maximum volume loss that would make unprofitable a 5% increase in prices.38 The Commission does not find either of these studies very informative or persuasive and thus rejects Arjowiggins' findings that the geographic market is likely to be at least EEA-wide. In addition, the Commission also used Arjowiggins' preferred data that it submitted for the analysis of the product market to further strengthen its geographic market analysis.39
49. In terms of price dispersions, Arjowiggins compared "the price dispersion in the EEA with that outside the EEA [and] … the price dispersions across all the EEA countries".40 The Commission notes that Arjowiggins' analysis (that consists of seven charts) does not seem to contain any conclusions as to how wide the geographic market is with the exception of saying that: (i) "the notion of sales within the EEA as being largely equivalent to 'high-margin', and those outside the EEA as largely equivalent to 'low margin' is not borne out by the data"; and (ii) "there are strong similarities in price dispersions across countries,
37 See Section 2 of the Market Definition Report.
38 See Section 4 of the Market Definition Report.
39 The Commission notes in this regard that it is somewhat inconsistent to perform correlation/stationarity tests for the product market definition analysis and not for the geographic market definition analysis given that both of these techniques are even by Arjowiggins' own admission widely accepted techniques for these analyses. As will be seen below, the results from the correlation analysis for the geographic market definition are even less persuasive of a wider market than the results submitted by Arjowiggins for the product market. However, the fact that the results from a particular technique "do not work" should not be enough in the Commission's view to simply omit such analysis altogether.
40 See Section 4.1 of the Market Definition Report.

115
especially for the larger economies."41 The Commission, however, assumes that what Arjowiggins is trying to say based on these observations is that this supports the hypothesis that markets are wider than national and perhaps at least EEA-wide. The Commission rejects this claim, as similarities in price dispersions do not provide any robust evidence as to whether a hypothetical monopolist could profitable increase prices by 5% to10% in a given national market. This is because price dispersions do not provide any insight in terms of substitution arising from changes in relative prices, which is the key market definition question. In addition, given that customers make purchases on monthly basis, the prices they pay throughout the year may vary widely. For example, Figure , which plots the monthly prices that […]*. Thus, it does not seem meaningful to look at average annual prices given that much of the price variation is smoothed out by the averaging.42
Figure 2: […]*. Source: Arjowiggins transaction data
50. Arjowiggins further argues that "the above analysis of price dispersion shows that for most transactions made in a given country, large volumes are sold at lower prices in another country. […]*."43 Arjowiggins then uses this logic to construct a "competitive potential" that quantifies how much volume could be profitably redirected to a given country from other countries and shows that it would not be profitable for a hypothetical monopolist to increase prices by 5%, as any such price increases would be thwarted by redirection of volumes from other countries. Such analysis is, however, based on the crucial assumption that volumes could be freely shifted from one country to another, and that the carbonless paper producers would have the incentive to do so. This is clearly not a credible assumption to make, as otherwise Arjowiggins' prices would be expected to be closely related to each other in the different countries, a finding that is not consistent with the results from Commission's analysis. Thus, while the Commission agrees with Arjowiggins' claim that in theory "there is sufficient volume available both within and outside the EEA to defeat a 5% increase in a country", such a finding does not say anything about whether the carbonless paper producers would have the ability and incentive to shift these volumes. The examination of the actual market-clearing prices that Arjowiggins submitted to the Commission clearly suggests that this is not the case.
51. To further test its geographic market analysis, the Commission used the margin data submitted by Arjowiggins for its product market definition to test how gross margins in euro (that is to say, prices excluding common costs) move across the EEA. Table 8 summarises the adjusted price correlations across countries for each carbonless variety.44 There is no support in Table 8 for markets that are wider than national, as the correlation
41 See Section 4.1 of the Market Definition Report.
42 Such issue may be further exacerbated if there are sales such as the one […]*.
43 See Section 4.2 of the Market Definition Report.
44 See Table 70 through Table 75 for the underlying correlation coefficients.

116
coefficients are very low and do not by and large attain values such that the countries could be considered to be part of the same market.45
Table 8: Adjusted price (gross margins in Euro) correlations across countries by carbonless variety
[…]* Source: Arjowiggins data, Commission's calculations
52. To conclude, the Commission rejects the geographic market analysis submitted by Arjowiggins, as not only do the techniques employed by Arjowiggins not provide any results that could be interpreted as robust evidence for EEA-wide markets (for example, price dispersions), but also they are based on unrealistic assumptions with results that are contracted by the findings of the actual price movements (that is to say. the competitive potential). In addition, the Commission used Arjowiggins' margin data to further test its own analysis, and its conclusions remain unchanged. That is, the results from the market definition tests are difficult to reconcile with an EEA-wide geographic market, as they provide only limited evidence for markets that are wider than national.
Product market definition
CF, CB and CFB level
1. Producer-level sales data
Figure 3: CB, CF and CFB reels average net prices (France)
Source: Sales data from the 5 largest producers of carbonless paper
45 One can think of correlation coefficients of [0-1]* as being the lowest benchmark that could possibly indicate that two products are in the same market, and even such benchmark is extremely low. Clearly, there are no correlations that satisfy this for sheets and a very limited minority of correlations that satisfy this for reels.

117
Table 9: Correlations between CB, CF and CFB reels average net prices (France)
CB CF CFB
CB 1.00
CF 0.96 1.00
CFB 0.97 0.96 1.00
Source: Sales data from the 5 largest producers of carbonless paper
Figure 4: CB, CF and CFB reels average net prices (Germany)
Source: Sales data from the 5 largest producers of carbonless paper
Table 10: Correlations between CB, CF and CFB reels average net prices (Germany)
CB CF CFB
CB 1.00
CF 0.83 1.00
CFB 0.68 0.47 1.00
Source: Sales data from the 5 largest producers of carbonless paper
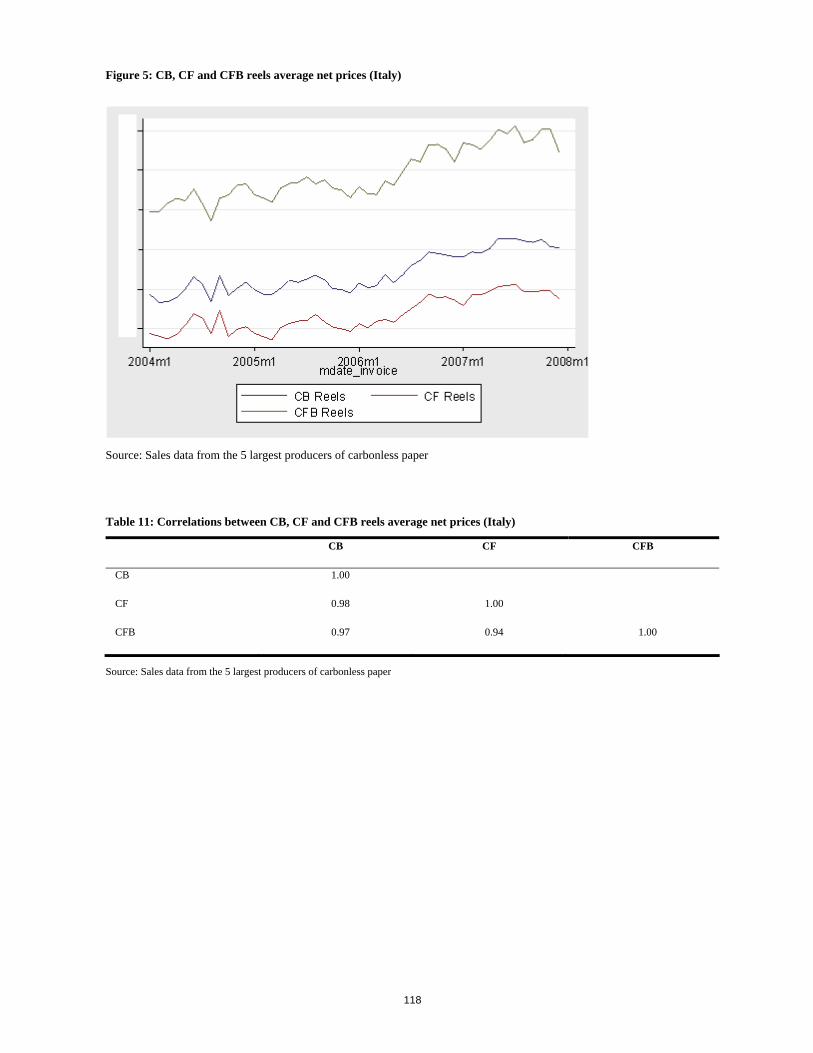
118
Figure 5: CB, CF and CFB reels average net prices (Italy)
Source: Sales data from the 5 largest producers of carbonless paper
Table 11: Correlations between CB, CF and CFB reels average net prices (Italy)
CB CF CFB
CB 1.00
CF 0.98 1.00
CFB 0.97 0.94 1.00
Source: Sales data from the 5 largest producers of carbonless paper

119
Figure 6: CB, CF and CFB reels average net prices (Poland)
Source: Sales data from the 5 largest producers of carbonless paper
Table 12: Correlations between CB, CF and CFB reels average net prices (Poland)
CB CF CFB
CB 1.00
CF 0.88 1.00
CFB 0.91 0.90 1.00
Source: Sales data from the 5 largest producers of carbonless paper

120
Figure 7: CB, CF and CFB reels average net prices (Spain)
Source: Sales data from the 5 largest producers of carbonless paper
Table 13: Correlations between CB, CF and CFB reels average net prices (Spain)
CB CF CFB
CB 1.00
CF 0.98 1.00
CFB 0.97 0.96 1.00
Source: Sales data from the 5 largest producers of carbonless paper

121
Figure 8: CB, CF and CFB reels average net prices (UK)
Source: Sales data from the 5 largest producers of carbonless paper
Table 14: Correlations between CB, CF and CFB reels average net prices (UK)
CB CF CFB
CB 1.00
CF 0.93 1.00
CFB 0.85 0.88 1.00
Source: Sales data from the 5 largest producers of carbonless paper

122
Figure 9: CB, CF and CFB sheets average net prices (France)
Source: Sales data from the 5 largest producers of carbonless paper
Table 15: Correlations between CB, CF and CFB sheets average net prices (France)
CB CF CFB
CB 1.00
CF 0.72 1.00
CFB 0.67 0.74 1.00
Source: Sales data from the 5 largest producers of carbonless paper

123
Figure 10: CB, CF and CFB sheets average net prices (Germany)
Source: Sales data from the 5 largest producers of carbonless paper
Table 16: Correlations between CB, CF and CFB sheets average net prices (Germany)
CB CF CFB
CB 1.00
CF 0.89 1.00
CFB 0.70 0.69 1.00
Source: Sales data from the 5 largest producers of carbonless paper

124
Figure 11: CB, CF and CFB sheets average net prices (Italy)
Source: Sales data from the 5 largest producers of carbonless paper
Table 17: Correlations between CB, CF and CFB sheets average net prices (Italy)
CB CF CFB
CB 1.00
CF 0.81 1.00
CFB 0.85 0.86 1.00
Source: Sales data from the 5 largest producers of carbonless paper

125
Figure 12: CB, CF and CFB sheets average net prices (Poland)
Source: Sales data from the 5 largest producers of carbonless paper
Table 18: Correlations between CB, CF and CFB sheets average net prices (Poland)
CB CF CFB
CB 1.00
CF 0.61 1.00
CFB 0.56 0.48 1.00
Source: Sales data from the 5 largest producers of carbonless paper

126
Figure 13: CB, CF and CFB sheets average net prices (Spain)
Source: Sales data from the 5 largest producers of carbonless paper
Table 19: Correlations between CB, CF and CFB sheets average net prices (Spain)
CB CF CFB
CB 1.00
CF 0.81 1.00
CFB 0.75 0.82 1.00
Source: Sales data from the 5 largest producers of carbonless paper

127
Figure14: CB, CF and CFB sheets average net prices (UK)
Source: Sales data from the 5 largest producers of carbonless paper
Table 20: Correlations between CB, CF and CFB sheets average net prices (UK)
CB CF CFB
CB 1.00
CF 0.56 1.00
CFB 0.57 0.83 1.00
Source: Sales data from the 5 largest producers of carbonless paper

128
2. Arjowiggins' transaction data excluding Antalis
Figure15: CB, CF and CFB reels average net prices (France)
[…]* Source: Arjowiggins transaction data excluding Antalis
Table 21: Correlations between CB, CF and CFB reels average net prices (France)
[…]*
Source: Arjowiggins transaction data excluding Antalis
Figure16: CB, CF and CFB reels average net prices (Germany)
[…]*
Source: Arjowiggins transaction data excluding Antalis
Table 22: Correlations between CB, CF and CFB reels average net prices (Germany)
[…]*
Source: Arjowiggins transaction data excluding Antalis
Figure17: CB, CF and CFB reels average net prices (Italy)
[…]*
Source: Arjowiggins transaction data excluding Antalis
Table 23: Correlations between CB, CF and CFB reels average net prices (Italy)
[…]*
Source: Arjowiggins transaction data excluding Antalis
Figure18: CB, CF and CFB reels average net prices (Poland)
[…]*
Source: Arjowiggins transaction data excluding Antalis

129
Table 24: Correlations between CB, CF and CFB reels average net prices (Poland)
[…]*
Source: Arjowiggins transaction data excluding Antalis
Figure 19: CB, CF and CFB reels average net prices (Spain)
[…]*
Source: Arjowiggins transaction data excluding Antalis
Table 25: Correlations between CB, CF and CFB reels average net prices (Spain)
[…]*
Source: Arjowiggins transaction data excluding Antalis
Figure20: CB, CF and CFB reels average net prices (UK)
[…]*
Source: Arjowiggins transaction data excluding Antalis
Table 26: Correlations between CB, CF and CFB reels average net prices (UK)
[…]*
Source: Arjowiggins transaction data excluding Antalis
Figure21: CB, CF and CFB sheets average net prices (France)
[…]*
Source: Arjowiggins transaction data excluding Antalis
Table 27: Correlations between CB, CF and CFB sheets average net prices (France)
[…]*
Source: Arjowiggins transaction data excluding Antalis

130
Figure22: CB, CF and CFB sheets average net prices (Germany)
[…]*
Source: Arjowiggins transaction data excluding Antalis
Table 28: Correlations between CB, CF and CFB sheets average net prices (Germany)
[…]*
Source: Arjowiggins transaction data excluding Antalis
Figure23: CB, CF and CFB sheets average net prices (Italy)
[…]*
Source: Arjowiggins transaction data excluding Antalis
Table 29: Correlations between CB, CF and CFB sheets average net prices (Italy)
[…]*
Source: Arjowiggins transaction data excluding Antalis

131
Figure24: CB, CF and CFB sheets average net prices (Spain)
[…]*
Source: Arjowiggins transaction data excluding Antalis
Table 30: Correlations between CB, CF and CFB sheets average net prices (Spain)
[…]*
Source: Arjowiggins transaction data excluding Antalis
Figure25: CB, CF and CFB sheets average net prices (UK)
[…]*
Source: Arjowiggins transaction data excluding Antalis
Table 31: Correlations between CB, CF and CFB sheets average net prices (UK)
[…]*
Source: Arjowiggins transaction data excluding Antalis

132
Reels and sheets level
1. Producer-level sales data
Figure26: Average net prices of reels and sheets (France)
Source: Sales data from the 5 largest producers of carbonless paper Figure 27: Average net prices of reels and sheets (Germany)
Source: Sales data from the 5 largest producers of carbonless paper

133
Figure28: Average net prices of reels and sheets (Italy)
Source: Sales data from the 5 largest producers of carbonless paper
Figure29: Average net prices of reels and sheets (Poland)
Source: Sales data from the 5 largest producers of carbonless paper

134
Figure 30: Average net prices of reels and sheets (Spain)
Source: Sales data from the 5 largest producers of carbonless paper
Figure 31: Average net prices of reels and sheets (UK)
Source: Sales data from the 5 largest producers of carbonless paper

135
Figure32: Average net price of reels relative to average net price of sheets by country
Source: Sales data from the 5 largest producers of carbonless paper

136
Table 32: Results of the stationarity tests
Country Lags AIC ADF P-value AIC (trend) ADF (trend) P-value (trend)
0 -191.29 -2.20 0.21 -194.37 -3.09 0.11
1 -193.73 -1.73 0.42 -193.42 -1.84 0.69
2 -191.96 -1.60 0.48 -191.44 -1.64 0.78
3 -190.07 -1.61 0.48 -190.37 -1.86 0.67
4 -188.12 -1.59 0.49 -188.94 -1.97 0.62
5 -188.82 -1.23 0.66 -188.38 -1.44 0.85
Italy
6 -187.06 -1.14 0.70 -186.40 -1.31 0.89
0 -237.89 -1.68 0.44 -243.97 -3.37 0.06
1 -238.09 -1.45 0.56 -241.97 -2.77 0.21
2 -236.45 -1.32 0.62 -240.16 -2.64 0.26
3 -237.27 -0.99 0.76 -239.02 -2.04 0.58
4 -235.34 -0.92 0.78 -237.13 -2.00 0.60
5 -234.01 -0.99 0.76 -237.69 -2.41 0.38
Spain
6 -232.03 -0.98 0.76 -237.34 -2.67 0.25
0 -163.66 -4.78 0.00 -182.12 -7.86 0.00
1 -164.27 -2.73 0.07 -181.57 -5.84 0.00
2 -164.99 -1.74 0.41 -179.78 -4.74 0.00
3 -168.52 -0.77 0.83 -178.60 -3.45 0.05
4 -169.72 -0.13 0.95 -177.51 -2.73 0.22
5 -168.04 0.05 0.96 -175.57 -2.57 0.29
Germany
6 -166.17 0.14 0.97 -173.89 -2.54 0.31
0 -186.74 -1.91 0.33 -195.43 -3.87 0.01
1 -184.80 -1.68 0.44 -194.23 -3.81 0.02
2 -184.24 -1.21 0.67 -192.46 -3.28 0.07
3 -183.51 -0.89 0.79 -190.49 -2.88 0.17
4 -181.57 -0.78 0.83 -188.54 -2.77 0.21
5 -184.36 -0.23 0.93 -189.22 -2.09 0.55
Poland
6 -182.49 -0.16 0.94 -187.30 -2.03 0.59
0 -174.67 -3.63 0.01 -183.19 -5.26 0.00
1 -181.03 -2.05 0.27 -183.37 -2.90 0.16
2 -183.25 -1.63 0.47 -183.15 -1.98 0.61
3 -181.37 -1.63 0.47 -182.23 -2.20 0.49
4 -181.86 -1.97 0.30 -185.23 -2.91 0.16
5 -180.50 -1.67 0.44 -183.24 -2.57 0.29
France
6 -182.72 -1.24 0.66 -183.30 -1.83 0.69
0 -184.06 -5.03 0.00 -182.25 -4.97 0.00
1 -184.00 -3.34 0.01 -182.02 -3.20 0.08
2 -183.22 -2.63 0.09 -181.25 -2.36 0.40
3 -184.56 -3.17 0.02 -182.58 -2.91 0.16
4 -183.68 -2.58 0.10 -181.70 -2.22 0.48
5 -182.21 -2.65 0.08 -180.21 -2.28 0.44
UK
6 -180.39 -2.63 0.09 -178.41 -2.27 0.45
Source: Sales data from the 5 largest producers of carbonless paper

137
2. Arjowiggins' transaction data excluding Antalis
Figure33: Average net prices of reels and sheets (France)
[…]*
Source: Arjowiggins transaction data excluding Antalis
Figure34: Average net prices of reels and sheets (Germany)
[…]*
Source: Arjowiggins transaction data excluding Antalis
Figure35 Average net prices of reels and sheets (Italy)
[…]*
Source: Arjowiggins transaction data excluding Antalis
Figure 36: Average net prices of reels and sheets (Spain)
[…]*
Source: Arjowiggins transaction data excluding Antalis
Figure37: Average net prices of reels and sheets (UK)
[…]*
Source: Arjowiggins transaction data excluding Antalis
Figure38: Average net price of reels relative to average net price of sheets by country
[…]*
Source: Arjowiggins transaction data excluding Antalis
Table 33: Results of the stationarity tests
[…]*
Source: Arjowiggins transaction data excluding Antalis

138
Geographic market definition
1. Producer-level sales data
Figure 39: Average net prices of reels
Source: Sales data from the 5 largest producers of carbonless paper
Table 34: Correlations between average country net prices of reels
France Germany Italy Poland Spain UK
France 1.00
Germany 0.73 1.00
Italy 0.92 0.75 1.00
Poland 0.86 0.76 0.83 1.00
Spain 0.92 0.77 0.94 0.87 1.00
UK 0.48 0.51 0.51 0.49 0.45 1.00
Source: Sales data from the 5 largest producers of carbonless paper

139
Figure 40: Average net prices of sheets
Source: Sales data from the 5 largest producers of carbonless paper
Table 35: Correlations between average country net prices of sheets
France Germany Italy Poland Spain UK
France 1.00
Germany -0.16 1.00
Italy 0.09 -0.01 1.00
Poland 0.23 0.39 -0.12 1.00
Spain 0.33 0.00 0.20 0.30 1.00
UK 0.33 -0.03 0.22 0.08 0.46 1.00
Source: Sales data from the 5 largest producers of carbonless paper

140
Stationarity tests: France is a base country
Figure 41: Average net country prices of reels relative to net prices of reels in France
Source: Sales data from the 5 largest producers of carbonless paper

141
Figure 42: Average net country prices of sheets relative to net prices of sheets in France
Source: Sales data from the 5 largest producers of carbonless paper

142
Table 36: Results of the stationarity tests for reels (France is a base)
Country Lags AIC ADF P-value AIC (trend) ADF (trend) P-value (trend)
0 -183.38 -5.86 0.00 -191.67 -7.34 0.00 1 -181.47 -4.02 0.00 -190.69 -5.67 0.00 2 -186.40 -2.10 0.25 -190.69 -3.28 0.07 3 -185.45 -1.68 0.44 -188.69 -2.80 0.20 4 -183.62 -1.44 0.56 -186.75 -2.59 0.29 5 -181.94 -1.51 0.53 -186.52 -2.87 0.17
Italy
6 -180.45 -1.22 0.66 -184.53 -2.58 0.29 0 -179.30 -5.50 0.00 -181.14 -6.01 0.00 1 -177.38 -4.21 0.00 -179.87 -4.85 0.00 2 -181.01 -2.35 0.16 -181.19 -2.76 0.21 3 -183.75 -1.54 0.52 -182.19 -1.58 0.80 4 -181.77 -1.50 0.54 -180.23 -1.55 0.81 5 -179.78 -1.45 0.56 -178.25 -1.51 0.83
Spain
6 -180.70 -1.82 0.37 -179.33 -1.86 0.67 0 -180.37 -4.01 0.00 -178.38 -3.82 0.02 1 -178.52 -3.03 0.03 -176.53 -2.80 0.20 2 -181.77 -2.12 0.24 -180.20 -1.73 0.74 3 -179.96 -2.00 0.29 -178.63 -1.49 0.83 4 -178.32 -2.00 0.29 -176.82 -1.51 0.83 5 -177.31 -2.06 0.26 -175.57 -1.61 0.79
Poland
6 -175.33 -1.95 0.31 -173.63 -1.46 0.84 0 -153.50 -3.79 0.00 -170.55 -6.71 0.00 1 -155.18 -2.37 0.15 -169.51 -5.13 0.00 2 -159.81 -1.58 0.49 -167.59 -3.56 0.03 3 -158.86 -1.43 0.57 -166.86 -3.46 0.04 4 -164.51 -1.01 0.75 -167.11 -2.22 0.48 5 -162.92 -0.91 0.79 -165.13 -2.07 0.57
Germany
6 -162.03 -0.77 0.83 -163.31 -1.77 0.72 0 -150.43 -3.19 0.02 -163.82 -5.65 0.00 1 -157.22 -1.56 0.51 -163.27 -3.30 0.07 2 -158.53 -1.00 0.75 -161.83 -2.45 0.35 3 -157.46 -1.07 0.73 -163.81 -3.03 0.12 4 -155.51 -1.08 0.72 -165.02 -3.52 0.04 5 -153.87 -1.15 0.70 -172.41 -4.84 0.00
UK
6 -155.53 -0.88 0.79 -171.59 -4.34 0.00
Source: Sales data from the 5 largest producers of carbonless paper

143
Table 37: Results of the stationarity tests for sheets (France is a base)
Country Lags AIC ADF P-value AIC (trend) ADF (trend) P-value (trend)
0 -147.70 -2.96 0.04 -156.86 -4.82 0.00 1 -150.57 -1.90 0.33 -155.25 -3.27 0.07 2 -151.41 -1.37 0.60 -153.92 -2.49 0.33 3 -150.08 -1.14 0.70 -152.06 -2.22 0.48 4 -148.79 -0.94 0.77 -150.22 -1.97 0.62 5 -146.92 -0.98 0.76 -148.50 -2.00 0.60
Italy
6 -144.92 -0.92 0.78 -146.54 -1.96 0.62 0 -163.89 -3.30 0.01 -165.51 -3.87 0.01 1 -162.54 -2.48 0.12 -163.62 -3.04 0.12 2 -161.21 -1.95 0.31 -161.91 -2.50 0.33 3 -159.27 -1.89 0.34 -160.13 -2.46 0.35 4 -157.65 -1.96 0.31 -159.17 -2.63 0.27 5 -158.07 -2.37 0.15 -161.31 -3.25 0.08
Spain
6 -156.24 -2.01 0.28 -159.42 -2.94 0.15 0 -144.36 -4.93 0.00 -143.92 -5.10 0.00 1 -142.81 -4.24 0.00 -142.64 -4.45 0.00 2 -143.82 -2.73 0.07 -143.51 -2.94 0.15 3 -143.03 -2.91 0.04 -143.04 -3.17 0.09 4 -141.70 -2.93 0.04 -142.22 -3.27 0.07 5 -139.71 -2.61 0.09 -140.41 -3.00 0.13
Poland
6 -141.06 -3.14 0.02 -143.44 -3.73 0.02 0 -103.04 -4.92 0.00 -109.80 -6.20 0.00 1 -105.51 -2.57 0.10 -109.34 -3.60 0.03 2 -104.79 -1.87 0.34 -107.90 -2.88 0.17 3 -103.06 -1.54 0.51 -105.96 -2.55 0.31 4 -101.06 -1.42 0.57 -104.11 -2.46 0.35 5 -99.85 -1.61 0.48 -103.94 -2.76 0.21
Germany
6 -98.42 -1.73 0.42 -103.75 -3.02 0.13 0 -151.16 -4.37 0.00 -150.25 -4.49 0.00 1 -149.75 -3.29 0.02 -148.59 -3.39 0.05 2 -147.89 -3.08 0.03 -146.89 -3.21 0.08 3 -146.96 -3.15 0.02 -146.26 -3.32 0.06 4 -145.01 -2.95 0.04 -144.27 -3.12 0.10 5 -143.02 -2.84 0.05 -142.46 -3.03 0.12
UK
6 -141.74 -2.59 0.09 -140.74 -2.67 0.25
Source: Sales data from the 5 largest producers of carbonless paper

144
Stationarity tests: Germany is a base country
Figure 43: Average net country prices of reels relative to net prices of reels in Germany
Source: Sales data from the 5 largest producers of carbonless paper
Figure 44: Average net country prices of sheets relative to net prices of sheets in Germany
Source: Sales data from the 5 largest producers of carbonless paper

145
Table 38: Results of the stationarity tests for reels (Germany is a base)
Country Lags AIC ADF P-value AIC (trend) ADF (trend) P-value (trend)
0 -163.81 -5.19 0.00 -174.01 -6.95 0.00 1 -162.04 -3.77 0.00 -176.35 -6.20 0.00 2 -165.29 -2.43 0.13 -174.41 -4.27 0.00 3 -166.03 -1.92 0.32 -172.58 -3.44 0.05 4 -165.36 -1.67 0.44 -170.90 -3.06 0.12 5 -164.25 -1.50 0.54 -169.22 -2.81 0.19
Italy
6 -167.37 -1.19 0.68 -168.67 -1.88 0.67 0 -157.51 -4.60 0.00 -169.82 -6.73 0.00 1 -156.27 -3.22 0.02 -171.29 -5.86 0.00 2 -160.73 -2.01 0.28 -169.34 -3.95 0.01 3 -162.99 -1.45 0.56 -167.74 -2.92 0.15 4 -165.42 -1.12 0.71 -167.23 -2.12 0.54 5 -163.85 -1.01 0.75 -165.24 -1.94 0.63
Spain
6 -163.46 -0.88 0.80 -163.85 -1.60 0.79 0 -150.85 -3.75 0.00 -161.03 -5.61 0.00 1 -149.36 -2.69 0.08 -159.79 -4.72 0.00 2 -168.39 -0.83 0.81 -171.65 -2.22 0.48 3 -167.15 -0.62 0.87 -169.98 -1.98 0.61 4 -166.83 -0.30 0.93 -169.84 -1.75 0.73 5 -165.23 -0.42 0.91 -168.06 -1.76 0.72
Poland
6 -163.24 -0.38 0.91 -166.09 -1.69 0.75 0 -149.39 -3.92 0.00 -166.97 -6.91 0.00 1 -150.92 -2.45 0.13 -166.36 -5.35 0.00 2 -155.94 -1.60 0.48 -164.40 -3.68 0.02 3 -154.98 -1.43 0.57 -164.10 -3.64 0.03 4 -160.44 -0.97 0.77 -163.93 -2.40 0.38 5 -159.17 -0.82 0.81 -161.93 -2.16 0.51
Germany
6 -158.66 -0.64 0.86 -160.29 -1.82 0.69 0 -161.13 -4.15 0.00 -159.63 -4.17 0.00 1 -159.60 -3.65 0.00 -158.15 -3.68 0.02 2 -157.64 -2.95 0.04 -156.19 -2.98 0.14 3 -155.64 -2.43 0.13 -154.19 -2.47 0.34 4 -153.89 -2.00 0.29 -152.38 -2.05 0.58 5 -154.43 -2.35 0.16 -153.38 -2.46 0.35
UK
6 -153.04 -2.44 0.13 -152.39 -2.61 0.28
Source: Sales data from the 5 largest producers of carbonless paper

146
Table 39: Results of the stationarity tests for sheets (Germany is a base)
Country Lags AIC ADF P-value AIC (trend) ADF (trend) P-value (trend)
0 -125.40 -6.95 0.00 -123.61 -6.89 0.00 1 -123.43 -4.35 0.00 -121.61 -4.29 0.00 2 -121.56 -3.28 0.02 -119.68 -3.17 0.09 3 -119.60 -2.69 0.08 -117.70 -2.53 0.31 4 -118.56 -2.02 0.28 -116.56 -1.76 0.72 5 -119.06 -2.44 0.13 -117.24 -2.25 0.46
Italy
6 -117.09 -2.16 0.22 -115.25 -1.96 0.63 0 -134.28 -7.06 0.00 -137.50 -7.78 0.00 1 -132.52 -4.22 0.00 -135.51 -4.93 0.00 2 -130.62 -3.59 0.01 -134.11 -4.39 0.00 3 -129.50 -2.50 0.12 -132.36 -3.29 0.07 4 -128.50 -1.78 0.39 -130.87 -2.56 0.30 5 -128.82 -2.22 0.20 -132.40 -3.10 0.11
Spain
6 -126.82 -1.98 0.29 -130.62 -2.91 0.16 0 -151.78 -5.95 0.00 -160.41 -7.50 0.00 1 -151.43 -3.30 0.01 -158.43 -4.73 0.00 2 -149.74 -2.54 0.11 -156.91 -4.11 0.01 3 -149.74 -1.60 0.48 -155.17 -3.11 0.10 4 -150.66 -0.76 0.83 -154.56 -2.24 0.47 5 -149.69 -1.05 0.74 -154.22 -2.50 0.33
Poland
6 -147.83 -0.90 0.79 -152.26 -2.34 0.41 0 -116.39 -5.11 0.00 -123.72 -6.47 0.00 1 -118.95 -2.60 0.09 -123.14 -3.68 0.02 2 -117.90 -1.94 0.31 -121.42 -3.00 0.13 3 -116.55 -1.49 0.54 -119.66 -2.54 0.31 4 -114.57 -1.32 0.62 -117.72 -2.41 0.38 5 -113.47 -1.53 0.52 -117.73 -2.73 0.22
Germany
6 -111.92 -1.63 0.47 -117.39 -2.97 0.14 0 -116.14 -5.68 0.00 -119.70 -6.45 0.00 1 -115.20 -3.68 0.00 -118.05 -4.40 0.00 2 -114.21 -2.88 0.05 -116.82 -3.58 0.03 3 -112.22 -2.59 0.10 -114.86 -3.30 0.07 4 -111.20 -2.13 0.23 -114.19 -2.85 0.18 5 -110.26 -2.30 0.17 -112.76 -2.91 0.16
UK
6 -108.81 -2.38 0.15 -111.09 -2.91 0.16
Source: Sales data from the 5 largest producers of carbonless paper

147
Stationarity tests: Italy is a base country
Figure 45: Average net country prices of reels relative to net prices of reels in Italy
Source: Sales data from the 5 largest producers of carbonless paper
Figure 46: Average net country prices of sheets relative to net prices of sheets in Italy
Source: Sales data from the 5 largest producers of carbonless paper

148
Table 40: Results of the stationarity tests for reels (Italy is a base)
Country Lags AIC ADF P-value AIC (trend) ADF (trend) P-value (trend)
0 -163.76 -5.16 0.00 -173.81 -6.89 0.00 1 -162.01 -3.76 0.00 -175.89 -6.12 0.00 2 -164.95 -2.44 0.13 -173.96 -4.26 0.00 3 -165.74 -1.92 0.32 -172.08 -3.41 0.05 4 -165.13 -1.66 0.45 -170.30 -2.99 0.13 5 -164.01 -1.48 0.54 -168.54 -2.73 0.22
Germany
6 -167.22 -1.17 0.69 -168.22 -1.80 0.70 0 -213.63 -4.07 0.00 -212.45 -4.12 0.01 1 -213.07 -2.84 0.05 -211.79 -2.90 0.16 2 -211.47 -2.26 0.19 -210.15 -2.33 0.42 3 -212.21 -2.75 0.07 -210.85 -2.79 0.20 4 -211.36 -2.09 0.25 -209.96 -2.13 0.53 5 -211.57 -1.52 0.52 -210.06 -1.57 0.80
Spain
6 -211.50 -1.80 0.38 -210.30 -1.89 0.66 0 -171.65 -4.41 0.00 -172.57 -4.63 0.00 1 -172.30 -2.61 0.09 -173.29 -2.80 0.20 2 -177.33 -1.51 0.53 -178.95 -1.68 0.76 3 -175.36 -1.48 0.54 -176.96 -1.61 0.79 4 -175.06 -1.67 0.44 -175.87 -1.72 0.74 5 -173.41 -1.73 0.42 -173.95 -1.71 0.74
Poland
6 -171.48 -1.71 0.43 -171.96 -1.66 0.77 0 -183.35 -5.89 0.00 -191.46 -7.34 0.00 1 -181.45 -4.01 0.00 -190.37 -5.62 0.00 2 -185.81 -2.14 0.23 -190.14 -3.32 0.06 3 -184.75 -1.72 0.42 -188.14 -2.85 0.18 4 -182.92 -1.46 0.56 -186.20 -2.62 0.27 5 -181.16 -1.50 0.53 -185.75 -2.87 0.17
France
6 -179.66 -1.21 0.67 -183.75 -2.57 0.29 0 -162.02 -4.47 0.00 -171.69 -6.20 0.00 1 -162.33 -2.93 0.04 -169.71 -4.47 0.00 2 -161.62 -2.15 0.23 -167.77 -3.66 0.03 3 -159.64 -1.98 0.29 -167.18 -3.74 0.02 4 -158.11 -1.83 0.37 -165.55 -3.58 0.03 5 -156.25 -1.83 0.37 -166.85 -4.03 0.01
UK
6 -154.74 -1.73 0.41 -165.81 -3.99 0.01
Source: Sales data from the 5 largest producers of carbonless paper

149
Table 41: Results of the stationarity tests for sheets (Italy is a base)
Country Lags AIC ADF P-value AIC (trend) ADF (trend) P-value (trend)
0 -118.24 -6.98 0.00 -116.45 -6.91 0.00 1 -116.27 -4.36 0.00 -114.45 -4.30 0.00 2 -114.48 -3.24 0.02 -112.58 -3.13 0.10 3 -112.50 -2.68 0.08 -110.58 -2.51 0.32 4 -111.49 -2.01 0.28 -109.49 -1.73 0.74 5 -111.80 -2.40 0.14 -109.96 -2.19 0.49
Germany
6 -109.98 -2.04 0.27 -108.07 -1.79 0.71 0 -171.46 -3.23 0.02 -172.47 -3.70 0.02 1 -171.55 -2.21 0.20 -171.18 -2.49 0.34 2 -169.64 -2.15 0.23 -169.80 -2.53 0.31 3 -167.81 -2.13 0.23 -168.70 -2.65 0.26 4 -165.84 -1.93 0.32 -166.83 -2.50 0.33 5 -167.22 -1.34 0.61 -167.10 -1.81 0.70
Spain
6 -165.45 -1.39 0.59 -165.57 -1.89 0.66 0 -141.04 -4.64 0.00 -144.84 -5.46 0.00 1 -139.06 -3.83 0.00 -145.02 -5.01 0.00 2 -143.98 -2.30 0.17 -145.11 -2.82 0.19 3 -142.30 -2.32 0.17 -144.85 -3.08 0.11 4 -141.00 -1.89 0.34 -142.86 -2.62 0.27 5 -140.47 -1.43 0.57 -141.54 -2.14 0.52
Poland
6 -138.47 -1.36 0.60 -139.74 -2.13 0.53 0 -156.17 -2.94 0.04 -165.55 -4.83 0.00 1 -159.71 -1.85 0.35 -164.10 -3.18 0.09 2 -160.27 -1.36 0.60 -162.62 -2.45 0.35 3 -159.02 -1.12 0.71 -160.80 -2.17 0.51 4 -157.45 -0.96 0.77 -158.85 -1.98 0.61 5 -155.49 -0.96 0.77 -156.97 -1.97 0.62
France
6 -153.51 -0.90 0.79 -154.99 -1.92 0.65 0 -157.27 -2.55 0.10 -158.08 -3.08 0.11 1 -155.57 -2.12 0.24 -156.09 -2.65 0.26 2 -153.61 -2.05 0.27 -154.31 -2.61 0.28 3 -153.00 -2.31 0.17 -155.65 -3.16 0.09 4 -151.71 -1.98 0.30 -154.71 -2.92 0.15 5 -149.93 -1.80 0.38 -153.56 -2.83 0.18
UK
6 -148.46 -1.89 0.34 -152.01 -2.86 0.17
Source: Sales data from the 5 largest producers of carbonless paper

150
2. Arjowiggins' transaction data excluding Antalis
Figure 47: Average net prices of reels
[…]*
Source: Arjowiggins transaction data excluding Antalis
Table 42: Correlations between average country net prices of reels
[…]*
Source: Arjowiggins transaction data excluding Antalis
Figure 48: Average net prices of sheets
[…]*
Source: Arjowiggins transaction data excluding Antalis
Table 43: Correlations between average country net prices of sheets
[…]*
Source: Arjowiggins transaction data excluding Antalis
Stationarity tests: France is a base country
Figure 49: Average net country prices of reels relative to net prices of reels in France
[…]*
Source: Arjowiggins transaction data excluding Antalis
Figure 50: Average net country prices of sheets relative to net prices of sheets in France
[…]*
Source: Arjowiggins transaction data excluding Antalis
Table 44: Results of the stationarity tests for reels (France is a base)
[…]* Source: Arjowiggins transaction data excluding Antalis

151
Table 45: Results of the stationarity tests for sheets (France is a base)
[…]* Source: Arjowiggins transaction data excluding Antalis
Stationarity tests: Germany is a base country
Figure 91: Average net country prices of reels relative to net prices of reels in Germany
[…]*
Source: Arjowiggins transaction data excluding Antalis
Figure 52: Average net country prices of sheets relative to net prices of sheets in Germany
[…]*
Source: Arjowiggins transaction data excluding Antalis
Table 46: Results of the stationarity tests for reels (Germany is a base) […]* Source: Arjowiggins transaction data excluding Antalis
Table 47: Results of the stationarity tests for sheets (Germany is a base)
[…]* Source: Arjowiggins transaction data excluding Antalis
Stationarity tests: Italy is a base country
Figure 53: Average net country prices of reels relative to net prices of reels in Italy
[…]*
Source: Arjowiggins transaction data excluding Antalis

152
Figure 54: Average net country prices of sheets relative to net prices of sheets in Italy
[…]*
Source: Arjowiggins transaction data excluding Antalis
Table 48: Results of the stationarity tests for reels (Italy is a base)
[…]* Source: Arjowiggins transaction data excluding Antalis
Table 49: Results of the stationarity tests for sheets (Italy is a base)
[…]*
Source: Arjowiggins transaction data excluding Antalis
3. Arjowiggins' transaction data including Antalis
Figure 55: Average net prices of reels
[…]*
Source: Arjowiggins transaction data including Antalis
Table 50: Correlations between average country net prices of reels
[…]*
Source: Arjowiggins transaction data including Antalis
Figure 56: Average net prices of sheets
[…]*
Source: Arjowiggins transaction data including Antalis
Table 51: Correlations between average country net prices of sheets
[…]*
Source: Arjowiggins transaction data including Antalis

153
Stationarity tests: France is a base country
Figure 57: Average net country prices of reels relative to net prices of reels in France
[…]*
Source: Arjowiggins transaction data including Antalis
Figure 58: Average net country prices of sheets relative to net prices of sheets in France
[…]*
Source: Arjowiggins transaction data including Antalis
Table 52: Results of the stationarity tests for reels (France is a base)
[…]* Source: Arjowiggins transaction data including Antalis
Table 53: Results of the stationarity tests for sheets (France is a base)
[…]* Source: Arjowiggins transaction data including Antalis
Stationarity tests: Germany is a base country
Figure 59: Average net country prices of reels relative to net prices of reels in Germany
[…]*
Source: Arjowiggins transaction data including Antalis
Figure 60: Average net country prices of sheets relative to net prices of sheets in Germany
[…]*
Source: Arjowiggins transaction data including Antalis
Table 54: Results of the stationarity tests for reels (Germany is a base)
[…]* Source: Arjowiggins transaction data including Antalis
Table 55: Results of the stationarity tests for sheets (Germany is a base)
[…]* Source: Arjowiggins transaction data including Antalis

154
Stationarity tests: Italy is a base country
Figure 61: Average net country prices of reels relative to net prices of reels in Italy
[…]*
Source: Arjowiggins transaction data including Antalis
Figure 62: Average net country prices of sheets relative to net prices of sheets in Italy
[…]*
Source: Arjowiggins transaction data including Antalis
Table 56: Results of the stationarity tests for reels (Italy is a base)
[…]*
Source: Arjowiggins transaction data including Antalis
Table 57: Results of the stationarity tests for sheets (Italy is a base)
[…]*
Source: Arjowiggins transaction data including Antalis
Product market definition: Arjowiggins' analysis
Adjusted prices (gross margins in Euro)
Table 58: Correlations between adjusted prices (gross margins in Euro) by coating type in France
[…]*
Source: Arjowiggins' data, Commission's analysis
Table 59: Correlations between adjusted prices (gross margins in Euro) by coating type in Germany
[…]*
Source: Arjowiggins' data, Commission's analysis
Table 60: Correlations between adjusted prices (gross margins in Euro) by coating type in Italy
[…]*
Source: ARJOWIGGINS's data, Commission's analysis

155
Table 61: Correlations between adjusted prices (gross margins in Euro) by coating type in Poland
[…]*
Source: ARJOWIGGINS's data, Commission's analysis
Table 62: Correlations between adjusted prices (gross margins in Euro) by coating type in Spain
[…]*
Source: ARJOWIGGINS's data, Commission's analysis
Table 63: Correlations between adjusted prices (gross margins in Euro) by coating type in the UK
[…]*
Source: ARJOWIGGINS's data, Commission's analysis
Percentage gross margins
Table 64: Correlations between percentage gross margins by coating type in France
[…]*
Source: ARJOWIGGINS's data, Commission's analysis
Table 65: Correlations between percentage gross margins by coating type in Germany
[…]*
Source: ARJOWIGGINS's data, Commission's analysis
Table 66: Correlations between percentage gross margins by coating type in Italy
[…]*
Source: ARJOWIGGINS's data, Commission's analysis
Table 67: Correlations between percentage gross margins by coating type in Poland
[…]*
Source: ARJOWIGGINS's data, Commission's analysis
Table 68: Correlations between percentage gross margins by coating type in Spain
[…]*
Source: ARJOWIGGINS's data, Commission's analysis
Table 69: Correlations between percentage gross margins by coating type in the UK
[…]*

156
Source: ARJOWIGGINS's data, Commission's analysis
Geographic market definition: ARJOWIGGINS' analysis
Table 70: Correlations between adjusted prices (gross margins in Euro) by country for CB Reels
[…]*
Source: ARJOWIGGINS's data, Commission's analysis
Table 71: Correlations between adjusted prices (gross margins in Euro) by country for CB Sheets
[…]*
Source: ARJOWIGGINS's data, Commission's analysis
Table 72: Correlations between adjusted prices (gross margins in Euro) by country for CFB Reels
[…]*
Source: ARJOWIGGINS's data, Commission's analysis
Table 73: Correlations between adjusted prices (gross margins in Euro) by country for CFB Sheets
[…]*
Source: ARJOWIGGINS's data, Commission's analysis
Table 74: Correlations between adjusted prices (gross margins in Euro) by country for CF Reels
[…]*
Source: ARJOWIGGINS's data, Commission's analysis
Table 75: Correlations between adjusted prices (gross margins in Euro) by country for CBF Sheets
[…]*
Source: ARJOWIGGINS's data, Commission's analysis

157
ANNEX 2: RELATIONSHIP BETWEEN EEA AND NON-EEA CARBONLESS PAPER PRICING
1. If the hypothesis is accepted that increases in the EEA prices relative to non-EEA prices will lead to redirection of exports by EEA carbonless paper producers from the outside of the EEA into the EEA, there must be a close relationship between EEA and non-EEA prices which EEA carbonless paper producers apply to the sale of their products. In particular, prices would be expected to move closely together over time, as the EEA carbonless paper producers would shift their production between EEA and non-EEA countries in response to changes in relative prices between the two regions. Much like in Annex 1, correlation and stationarity tests lend themselves particularly well to establishing whether there is a close relationship between EEA and non-EEA prices. This Annex describes the Commission's findings from such tests using both Arjowiggins' transaction data and the sales data from the five largest producers of carbonless paper.1
Arjowiggins' transaction data
2. Following Arjowiggins' preferred approach, the Commission examines Arjowiggins' transaction data at the coating level for both reels and sheets. Table 1 contains the correlations between EEA and non-EEA prices for each product by coating type, while Figure 1 to Figure 6 plot EEA and non-EEA prices. The correlations range from […]* to […]*. These values suggest that there is no evidence for the hypothesis that there is a close relationship between EEA and non-EEA prices […]*. This is also true for reels prices to some extent for some periods.
Table 1: Correlations between EEA and non-EEA prices
[…]*
Source: Arjowiggins transaction data
3. The Commission also performed stationarity tests on non-EEA prices relative to EEA prices to further supplement its analysis. Table 2 contains the results from the stationarity tests, while Figure 7 plots the underlying relative prices that exhibit downward trends in number of instances. The hypothesis of stationarity is rejected in all instances, […]*.
4. To conclude, there is no evidence in Arjowiggins' pricing that would suggest that the EEA and markets outside of the EEA are interconnected. Thus, the Commission does not consider Arjowiggins argument as to the redirection of exports in response to price increase in the EEA as valid.
1 See Annex 1 for description of the data.

158
Sales data from the 5 largest data producers
5. The Commission also performed a similar analysis based on the sales data from the five largest data producers at the reels and sheets level. The correlation between the EEA and and non-EEA prices are found to be 0.65 for reels and 0.56 for sheets. Again, these correlations are not high enough to suggest that there is a close relationship between the EEA and non-EEA prices. Figure 8 and Figure 9 plot the prices for reels and sheets. Much like for Arjowiggins, it seems a standard industry practice that sales to non-EEA countries are at lower prices levels than at which the products are sold in the EEA.
6. The Commission further supplemented its correlation analysis with stationarity tests. The results from these tests are summarised in Table 3, and Figure 10 plots the relative prices. In both instances, the hypothesis of stationarity is rejected, and thus there is no long-run relationship between the EEA and non-EEA prices.
7. The findings from the analysis of the sales data from the five largest data producers are consistent with the findings using Arjowiggins transaction data. As a result, the Commission maintains its position that it is unlikely that increases of the EEA prices relative to the non-EEA prices would lead to a significant redirection of exports to the EEA.
Arjowiggins' transaction data
Figure 1: Arjowiggins' CB reels average EEA and non-EEA prices
[…]*
Source: Arjowiggins transaction data
Figure 2: Arjowiggins' CB sheets average EEA and non-EEA prices
[…]*
Source: Arjowiggins transaction data
Figure 3: Arjowiggins' CFB reels average EEA and non-EEA prices
[…]*
Source: Arjowiggins transaction data

159
Figure 4: Arjowiggins' CFB sheets average EEA and non-EEA prices
[…]*
Source: Arjowiggins transaction data
Figure 5: Arjowiggins' CF reels average EEA and non-EEA prices
[…]*
Source: Arjowiggins transaction data
Figure 6: Arjowiggins' CF sheets average EEA and non-EEA prices
[…]*
Source: Arjowiggins transaction data
Figure 7: Arjowiggins' non-EEA prices relative to EEA prices
[…]*
Source: Arjowiggins transaction data
Table 2: Results of the stationarity tests
[…]*
Source: Arjowiggins transaction data

160
Sales data from the 5 largest producers
Figure 8: EEA and non-EEA reels average prices 95
010
0010
5011
0011
50
2004m1 2005m1 2006m1 2007m1 2008m1Date
EEA non-EEA
Source: Sales data from the 5 largest producers

161
Figure 9: EEA and non-EEA sheets average prices 12
0013
0014
0015
0016
00
2004m1 2005m1 2006m1 2007m1 2008m1Date
EEA non-EEA
Source: Sales data from the 5 largest producers
Figure 10: Non-EEA average prices relative to EEA average prices
.8.8
5.9
.95
11.
05
2004m1 2005m1 2006m1 2007m1 2008m1Date
Sheets Reels
Source: Sales data from the 5 largest producers

162
Table 3: Results of the stationarity tests
Country Lags AIC ADF P-value AIC (trend) ADF (trend) P-value (trend)
0 -181.69 -2.94 0.04 -181.66 -3.05 0.12
1 -180.14 -2.21 0.20 -180.46 -2.22 0.48
2 -182.01 -1.38 0.59 -183.05 -1.35 0.88
3 -182.91 -1.87 0.35 -183.15 -1.74 0.73
4 -181.39 -1.52 0.52 -182.00 -1.33 0.88
5 -181.44 -1.85 0.36 -181.48 -1.61 0.79
Sheets
6 -182.92 -1.25 0.65 -183.54 -0.98 0.95
0 -181.04 -2.11 0.24 -181.62 -2.64 0.26
1 -179.76 -1.57 0.50 -180.19 -2.12 0.54
2 -177.81 -1.36 0.60 -178.22 -1.91 0.65
3 -175.99 -1.11 0.71 -176.42 -1.65 0.77
4 -174.66 -1.27 0.64 -175.21 -1.80 0.71
5 -172.76 -1.28 0.64 -173.35 -1.79 0.71
Reels
6 -170.81 -1.13 0.70 -171.41 -1.62 0.78
Source: Sales data from the 5 largest producers
163
ANNEX 3: ARJOWIGGINS' ANALYSIS OF THE TRACING PAPER MARKET
1. This Annex discusses the technical econometric analyses that Arjowiggins submitted for the tracing paper market:
• Annex 5.1 of the Reply to the Statement of Objections – Tracing paper: industrial v. graphic applications, 17 March 2008
• Annex 5.2 of the Reply to the Statement of Objections - Graphic tracing papers v. other fine papers for graphic use, 17 March 2008
• Graphic tracing paper and other fine papers for graphic purposes (Supplement), 28 March 2008
Tracing paper: industrial v. graphic applications
2. The study uses Arjowiggins’ EEA transaction data to perform a product market definition test, using correlation and stationarity analysis for the prices of industrial and graphic tracing paper. Arjowiggins calculates the correlation coefficient of […]* for the prices of industrial and graphic tracing papers in the EEA. The Commission confirms that it has arrived at a similar value using the statistical code and data submitted by Arjowiggins to the Commission (the actual value found was […]*). In addition, the Commission agrees with Arjowiggins that this implies that graphic and tracing papers do not belong to the same market.
3. Arjowiggins also submits stationarity analysis to further support this conclusion. Arjowiggins shows that neither the relative prices nor the logarithm of the relative prices is found to be stationary. The Commission agrees with this finding, as Figure 1 suggests that the relative prices are not stationary due to the visible downward trends. For completeness, the Commission notes that Arjowiggins’ stationarity tests are not comparable across different lags as already discussed in Annex 1. However, the corrected results from the stationarity tests that are reported in Table 1 confirm that the relative prices are not stationary.
4. To conclude, the Commission confirms the findings from the analysis submitted by Arjowiggins that imply that graphic and industrial tracing paper does not belong to the same relevant market.
Graphic tracing papers v. other fine papers for graphic use
5. The study provided by Arjowiggins further examines whether the market for graphic tracing paper is as narrow as graphic tracing paper, or whether it can be enlarged to include “other fine papers for graphic use.” The Commission notes that Arjowiggins does not properly define what this market encompasses. Arjowiggins uses correlation and stationarity techniques to assess whether graphic tracing paper and “fine papers for graphic use” belong to the same market.

164
6. Arjowiggins argues that the data needs to be aggregated to quarterly levels to perform correlation tests. This is because “monthly data are affected by significant variations in volumes sold each month which undermined their relevance.”1 Based on these aggregations, Arjowiggins calculates a correlation coefficient of […]* and argues that such correlation levels are suggestive of the two product markets being part of the same market. The Commission rejects this argument. Arjowiggins' correlation analysis is based on [1-100]* data points. This sample is clearly not large enough to permit any meaningful and robust conclusions being drawn from such analysis. Additionally, the Commission notes that the correlation for the monthly data is […]*, and this does not seem to be supportive of the two products being in the same market.2
7. Arjowiggins further supplements the correlation analysis with stationarity tests. The Commission notes that these are performed at monthly levels rather than at quarterly levels unlike the correlation tests. However, it is precisely the variation in the monthly price data that allows Arjowiggins to conclude that the relative prices are stationary. This is clearly seen in Figure 2 that plots the relative prices that exhibit clear downward trend, which is not consistent with stationary prices. The only reason why the relative prices are found to be stationary are the two outlying values in January 2005 and February 2006 (see Table 2 for the results of the stationarity test). In other words, Arjowiggins on the one hand discards these outlying monthly values by aggregating to quarterly levels to obtain high correlations, but on the other hand Arjowiggins' analysis uses this monthly variation to obtain stationary prices. Thus, the Commission does not find such analysis convincing.
8. To further test its hypothesis regarding the two outlying values, the Commission re-ran the stationarity analysis under the assumption that the prices of both products in the two months were replaced with an average price based on the prices in the adjoining months. As both Figure 3 that plots the adjusted relative prices and Table 3 that contains the results of the stationarity tests suggest, there are clear downward-trends, and the prices are found to be non-stationary.
9. To conclude, the Commission does not find the analysis submitted by Arjowiggins convincing. This is because: (i) even correlations that include common movements and thus can be subject to spurious movements are not high enough; and (ii) the results from the stationarity tests are not very robust. Thus, the Commission does not accept that graphic tracing paper and “other fine paper for graphic use” belong to the same product market.
1 See page 2 of LECG’s memo.
2 LECG reports a value of […]* instead of […]*. However, regardless of whether the value is […]* or […]*, the Commission would arrive at the same conclusion.

165
Graphic tracing paper and other fine papers for graphic purposes (Supplement)
10. Arjowiggins also supplements its analysis with an assessment that examines whether metallics, particles and touch, three sub-categories that Arjowiggins identifies as comprising the “other fine papers for graphic use” market, belong to the same market as graphic tracing paper.3 This assessment is also based on correlation and stationarity tests.
11. Arjowiggins derives correlation for both quarterly and monthly values. However, as explained above, the Commission does not find the results from the quarterly analysis convincing. The monthly correlations between graphic tracing paper and the three subcategories range from the low of […]* (for Particles) to the high of […]* (for metallics). These coefficients are clearly not high enough to consider the three subcategories and graphic tracing paper to be in the same market. In addition, the Commission notes that the correlations between the prices of the three subcategories are themselves quite low. They range from […]* (for correlation between particles and touch) to […]* (for correlation between particles and metallics). This implies that it is unlikely that these subcategories are part of the same market, which puts further doubt as to whether an “other fine papers for graphic purposes” market exists from an antitrust perspective. Indeed, Figure 4 suggests that there also appear to be important differences in price levels between the three different subcategories, which is also not consistent with these products being in the same relevant market.
12. The stationarity analysis that Arjowiggins performed implies that the prices of the three subcategories relative to the tracing paper price are stationary. As explained above and in Annex 1, Arjowiggins' stationarity analysis is in general not implemented properly, and thus the Commission performed its own tests. As Figure 6 and Figure 7 suggest, the relative prices for both particles and touch subcategories are subject to downward trends. This is also confirmed by the results from the stationarity tests in Table and Table that suggest that neither of these relative prices is stationary. The only prices that are found to be stationary are the relative prices for the metallics subcategory. This is however likely driven by the high volatility of the relative prices as there appears to be a visible upward trend (see Figure 5).
13. To conclude, the Commission notes that neither the correlation nor the stationarity analysis suggests that either the touch or particles subcategories are in the same relevant market as the graphic tracing paper. Although the evidence for the metallics category is more conflicting, it also does not on balance suggest that the metallics subcategory and graphic tracing paper are in the same product market. The correlations are not high enough to indicate the two products are in the same market, and while the relative prices are found to be stationary, they are also quite volatile and subject to some upward trends. However, while metallics and graphic tracing papers are likely not in the same market, it does appear that there may be some relationship between these two products. Thus, the
3 The Commission again notes that neither Arjowiggins not LECG properly define these three subcategories of the other fine papers market.

166
products in the metallics subcategory may provide some constraint for the graphic tracing paper.
Tracing paper: industrial v. graphic applications
Figure 1: Price of industrial tracing paper relative to the price of graphic tracing paper
[…]*
Source: Arjowiggins transaction data
Table 1: Results of the stationarity tests
[…]*
Source: Arjowiggins transaction data
Figure 2: Price of graphic tracing paper relative to price of other fine paper for graphic use
[…]*
Source: Arjowiggins transaction data
Table 2: Results of the stationarity tests
[…]*
Source: Arjowiggins transaction data
Figure 3: Price of graphic tracing paper relative to price of other fine paper for graphic use (adjusted prices)
[…]*
Source: Arjowiggins transaction data
Table 3: Results of the stationarity tests (adjusted prices)
[…]*
Source: Arjowiggins transaction data

167
Figure 4: EEA metallics, particles and touch price
[…]*
Source: Arjowiggins transaction data
Figure 5: EEA graphic tracing paper price relative to EEA metallics price
[…]*
Source: Arjowiggins transaction data
Table 4: Results of the stationarity tests (metallics)
[…]*
Source: Arjowiggins transaction data
Figure 6: EEA graphic tracing paper price relative to EEA particles price
[…]*
Source: Arjowiggins transaction data
Table 5: Results of the stationarity tests (particles)
[…]*
Source: Arjowiggins transaction data
Figure 7: EEA graphic tracing paper price relative to EEA touch price
[…]*
Source: Arjowiggins transaction data
Table 6: Results of the stationarity tests (touch)
[…]*
Source: Arjowiggins transaction data

168
NON-CONFIDENTIAL VERSION
By hand and by fax: 00 32 2 296 43 01 European Commission – Merger Task Force DG Competition Rue Joseph II 70 B-1000 Brussels
Case M. 4513 – Arjowiggins/Zanders Reflex
COMMITMENTS TO THE EUROPEAN COMMISSION
Pursuant to Article 8(2) of Council Regulation (EEC) No. 139/2004 (the “Merger Regulation”), Arjowiggins hereby provides the following Commitments (the “Commitments”) in order to enable the European Commission (the “Commission”) to declare the acquisition of Zanders Reflex (the “Target”), Germany, by Arjowiggins from M-Real compatible with the common market and the EEA Agreement by its decision pursuant to Article 8(2) of the Merger Regulation (the “Decision”).
The Commitments shall take effect upon the date of adoption of the Decision.
This text shall be interpreted in the light of the Decision to the extent that the Commitments are attached as conditions and obligations, in the general framework of Community law, in particular in the light of the Merger Regulation, and by reference to the Commission Notice on remedies acceptable under Council Regulation (EEC) No 139/2004 and under Commission Regulation (EC) No 802/2004. A. DEFINITIONS For the purpose of the Commitments, the following terms shall have the following meaning: Affiliated Undertakings: undertakings controlled by Arjowiggins S.A.S., and/or by the ultimate parents of Arjowiggins S.A.S., whereby the notion of control shall be interpreted pursuant to Article 3 Merger Regulation and in the light of the Commission Notice on the concept of concentration under Council Regulation (EEC) No 139/2004; Arjowiggins: Arjowiggins S.A.S., incorporated under the laws of France, with its registered office at 117, Quai du Président Roosevelt, 92130, Issy-Les-Moulineaux, France, and registered with the Commercial/Company Registry (Registre du Commerce et des Sociétés) at Nanterre under number 602 018 822; or any company duly registered and directly or indirectly controlled by Arjowiggins S.A.S.;

169
Asset Purchase Agreement: binding agreement, according to which Arjowiggins transfers the Divestment Business to the Purchaser; Closing: the transfer of the legal title of the Divestment Business to the Purchaser; Divestment Business: the carbonless paper business and the digital paper business, as defined in Section B and the Schedule, that Arjowiggins commits to divest; Effective Date: the date of adoption of the Decision; Divestiture Period: the period of [Confidential]* from the Effective Date; Hold Separate Manager: the person appointed by Arjowiggins, from the date upon which Arjowiggins acquires effective control over the Zanders Reflex mill until Closing, to manage the day-to-day business of the Zanders Reflex mill under the supervision of the Monitoring Trustee; Key Personnel: all personnel necessary to maintain the viability and competitiveness of the Divestment Business, as listed in the Schedule; M-Real: M-Real Zanders GmbH, incorporated under the laws of Germany, with its registered office at An der Gohrsmühle, 51465 Bergisch Gladbach, Germany; and its parent or affiliate companies; Monitoring Trustee: one or more natural or legal person(s), independent from the Parties, who is approved by the Commission and appointed by Arjowiggins, and who has the duty to monitor Arjowiggins’ compliance with the conditions and obligations attached to the Decision; Parties: Arjowiggins and M-Real; Personnel: all personnel currently employed by the Divestment Business, including Key Personnel, staff seconded to the Divestment Business, shared personnel and the additional personnel listed in the Schedule; Premium Fine Paper Business: activities of the Zanders Reflex mill located in Düren that are dedicated to the production and distribution of premium fine paper, including letterhead, tracing, text & cover and crepe paper. Purchaser: the entity approved by the Commission as acquirer of the Divestment Business in accordance with the criteria set out in Section D; Transaction: the acquisition by Arjowiggins from M-Real of Zanders Reflex, which consists of assets pertaining to the Reflex mill located in Düren (Germany); Trustee: the Monitoring Trustee;

170
B. THE COMMITMENTS
Definition of the Divestiture Commitment 1.1 Arjowiggins commits to divest the Divestment Business, by the end of the Divestiture
Period, to a Purchaser approved by the Commission in accordance with the criteria set out in paragraph 14.
1.2 To carry out the divestiture, Arjowiggins commits to find a Purchaser and, by the end of
the Divestiture Period, to enter into an Asset Purchase Agreement approved by the Commission in accordance with the criteria set out in paragraph 15.
1.3 If Arjowiggins has not entered into an Asset Purchase Agreement with the Purchaser at
the end of the Divestiture Period, Arjowiggins commits to abandon the notified Transaction.
1.4 Arjowiggins commits not to close the Transaction before having entered into an Asset
Purchase Agreement with a Purchaser approved by the Commission.
1.5 Arjowiggins acknowledges that (i) full compliance with the Divestiture Commitment is mandatory in order for the Transaction to be declared compatible with the common market and with the functioning of the EEA Agreement; and that (ii) it will not be authorized to close the Transaction, if it has not entered into an Asset Purchase Agreement within the Divestiture Period.
2. Arjowiggins shall be deemed to have complied with the Divestiture Commitment if the
following cumulative conditions are met:
(i) By the end of the Divestiture Period, Arjowiggins has entered into an Asset Purchase Agreement for the sale of the Divestment Business;
(ii) By the end of the Divestiture Period, the Commission has approved the Purchaser
in accordance with criteria set in paragraph 14 and the Asset Purchase Agreement in accordance with criteria set in paragraph 15;
(iii) Closing of the sale of the Divestment Business has taken place within a period not
exceeding [Confidential] months after the approval by the Commission of the terms of the Asset Purchase Agreement;
(iv) Arjowiggins has not closed the Transaction before entering into an Asset Purchase
Agreement with the Purchaser under terms approved by the Commission in accordance with the procedure set out in paragraph [15] below.
3. In order to maintain the structural effect of the Commitments, Arjowiggins or any of its
subsidiaries shall, for a period of [Confidential]* years after the Effective Date, not acquire direct or indirect influence over the whole or part of the carbonless paper business pertaining to the Divestment Business, unless the Commission has previously found that

171
the structure of the market has changed to such an extent that the absence of influence over the carbonless paper business pertaining to the Divestment Business is no longer necessary to render the proposed concentration compatible with the common market. For the avoidance of doubt, the foregoing shall not apply to the digital paper business pertaining to the Divestment Business, since the statement of objections issued by the European Commission on March 4, 2008, does not contain any objections in relation with such business.
Structure and definition of the Divestment Business
4.1 The Divestment Business consists of the activities dedicated to the production and
distribution of (i) carbonless paper and (ii) digital paper at the Zanders Reflex mill located in Düren, Germany.
4.2 The present legal and functional structure of the Divestment Business as operated to date
is described in the Schedule. The Divestment Business, described in more detail in the Schedule, includes:
(a) All tangible and intangible assets (including intellectual property rights), which
contribute to the current operation or are necessary to ensure the viability and competitiveness of the Divestment Business;
(b) All licenses, permits and authorizations issued by any governmental organization
for the benefit of the Divestment Business; (c) All contracts, leases, commitments and customer orders of the Divestment
Business; all customer, credit and other records of the Divestment Business (items referred to under (a)-(c) hereinafter collectively referred to as “Assets”);
(d) The Personnel; and (e) [Confidential]*
C. RELATED COMMITMENTS
Preservation of Viability, Marketability and Competitiveness 5. From the date on which it acquires effective control over the Target until Closing,
Arjowiggins shall preserve the economic viability, marketability and competitiveness of the Divestment Business, in accordance with good business practice, and shall minimize as far as possible any risk of loss of competitive potential of the Divestment Business. In particular Arjowiggins undertakes:
(a) Not to carry out any act upon its own authority that might have a significant
adverse impact on the value, management or competitiveness of the Divestment Business or that might alter the nature and scope of activity, or the industrial or commercial strategy or the investment policy of the Divestment Business;

172
(b) To make available sufficient resources for the development of the Divestment
Business, on the basis and continuation of the existing business plans;
(c) To take all reasonable steps, including appropriate incentive schemes (based on industry practice), to encourage all Key Personnel to remain with the Divestment Business.
Hold-separate obligations of Arjowiggins
6. Arjowiggins commits, until Closing (or withdrawal of the notified Transaction in
accordance with point 1.3 above, as the case may be), to keep the Divestment Business separate from Arjowiggins and to ensure that Key Personnel of the Divestment Business – including the Hold Separate Manager – have no involvement in any Arjowiggins business and vice versa. Arjowiggins shall also ensure that the Personnel does not report to any individual outside the Divestment Business.
7. Until Closing, Arjowiggins shall assist the Monitoring Trustee in ensuring that the
Divestment Business is managed as a distinct and saleable business separate from Arjowiggins. Arjowiggins shall appoint a Hold Separate Manager who shall be responsible for the management of the Zanders Reflex mill, under the supervision of the Monitoring Trustee. The Hold Separate Manager shall manage the Divestment Business independently and in the best interest of the business with a view to ensuring its continued economic viability, marketability and competitiveness and its independence from Arjowiggins.
Ring-fencing
8. Arjowiggins shall implement all necessary measures to ensure that it does not after the
Effective Date obtain any business secrets, know-how, commercial information, or any other information of a confidential or proprietary nature relating to the Divestment Business. From the date on which Arjowiggins acquires effective control over the Target, the participation of the Divestment Business in a central information technology network shall be severed to the extent possible, without compromising the viability of the Divestment Business.
9. Arjowiggins may obtain information relating to the Divestment Business which is
reasonably necessary for the divestiture of the Divestment Business, in particular information needed by potential purchasers to implement a due diligence of the Divestment Business and to negotiate an Asset Purchase Agreement relating to the divestiture of the Divestment Business, or whose disclosure to Arjowiggins is required by law.

173
Non-solicitation clause 10. Arjowiggins undertakes, subject to customary limitations, not to solicit, and to procure
that any of its subsidiaries do not solicit, the Key Personnel transferred with the Divestment Business for a period of [Confidential]* years after Closing.
Due Diligence
11. In order to enable potential purchasers to carry out a reasonable due diligence of the
Divestment Business, Arjowiggins shall, subject to customary confidentiality assurances and dependent on the stage of the divestiture process:
(a) Provide to potential purchasers sufficient information as regards the Divestment
Business; (b) Provide to potential purchasers sufficient information relating to the Personnel and
allow them reasonable access to the Personnel.
Reporting 12. Arjowiggins shall submit written reports in English on potential purchasers of the
Divestment Business and developments in the negotiations with such potential purchasers to the Commission and the Monitoring Trustee no later than ten (10) days after the end of every month following the Effective Date (or otherwise at the Commission’s request).
13.1 Arjowiggins shall inform the Commission and the Monitoring Trustee on the preparation
of the data room documentation and the due diligence procedure. [Confidential]*
13.2 [Confidential]* D. THE TRANSFER OF THE DIVESTMENT BUSINESS TO THE PURCHASER 14. In order to ensure the immediate restoration of effective competition, the Purchaser, in
order to be approved by the Commission, must:
(a) Be independent of and unconnected to the Parties;
(b) Have the financial resources, proven expertise and incentive to maintain and develop the Divestment Business as a viable and active competitive force in competition with the Parties and other competitors;
(c) Neither be likely to create, in the light of the information available to the
Commission, prima facie competition concerns nor give rise to a risk that the implementation of the Commitments will be delayed, and must, in particular, reasonably be expected to obtain all necessary approvals from the relevant

174
regulatory authorities for the acquisition of the Divestment Business (the before-mentioned criteria for the purchaser hereafter the “Purchaser Requirements”).
Arjowiggins will make its best effort to demonstrate to the Commission that the Purchaser meets the Purchaser Requirements, it being understood that Arjowiggins has no access to the Purchaser’s confidential business information.
15. The Asset Purchase Agreement shall be conditional on the Commission’s approval.
When Arjowiggins has reached an agreement with a Purchaser, it shall submit a fully documented and reasoned proposal, including copy of the Asset Purchase Agreement, to the Commission and the Monitoring Trustee. Arjowiggins must be able to demonstrate to the Commission that the Purchaser meets the Purchaser Requirements and that the Divestment Business is being sold in a manner consistent with the Commitments. For the approval, the Commission shall verify that the Purchaser fulfills the Purchaser Requirements and that the Divestment Business is being sold in a manner consistent with the Commitments. The Commission may approve the sale of the Divestment Business without one or more Assets or parts of the Personnel, if this does not affect the viability and competitiveness of the Divestment Business after the sale, taking account of the proposed Purchaser.
E. TRUSTEE
I. Appointment Procedure 16. Arjowiggins shall appoint a Monitoring Trustee to carry out the functions specified in the
Commitments for a Monitoring Trustee. 17. The Trustee shall be independent of the Parties, possess the necessary qualifications to
carry out its mandate, for example as an investment bank or consultant or auditor, and shall neither have nor become exposed to a conflict of interest. The Trustee shall be remunerated by Arjowiggins in a way that does not impede the independent and effective fulfillment of its mandate.
Proposal by Arjowiggins
18. No later than one week after the Effective Date, Arjowiggins shall submit a list of one or
more persons whom Arjowiggins proposes to appoint as the Monitoring Trustee to the Commission for approval. The proposal shall contain sufficient information for the Commission to verify that the proposed Trustee fulfils the requirements set out in paragraph 17 and shall include:
(a) The full terms of the proposed mandate, which shall include all provisions
necessary to enable the Trustee to fulfill its duties under these Commitments;

175
(b) The outline of a work plan which describes how the Trustee intends to carry out its assigned tasks.
Approval or rejection by the Commission
19. The Commission shall have the discretion to approve or reject the proposed Trustee(s)
and to approve the proposed mandate subject to any modifications it deems necessary for the Trustee to fulfill its obligations. If only one name is approved, Arjowiggins shall appoint or cause to be appointed, the individual or institution concerned as Trustee, in accordance with the mandate approved by the Commission. If more than one name is approved, Arjowiggins shall be free to choose the Trustee to be appointed from among the names approved. The Trustee shall be appointed within one week of the Commission’s approval, in accordance with the mandate approved by the Commission.
New proposal by Arjowiggins
20. If all the proposed Trustees are rejected, Arjowiggins shall submit the names of at least two more individuals or institutions within one week of being informed of the rejection, in accordance with the requirements and the procedure set out in paragraphs 16 and 19.
Trustee nominated by the Commission
21. If all further proposed Trustees are rejected by the Commission, the Commission shall
nominate a Trustee, whom Arjowiggins shall appoint, or cause to be appointed, in accordance with a trustee mandate approved by the Commission.
II. Functions of the Monitoring Trustee
22. The Trustee shall assume its specified duties in order to ensure compliance with the
Commitments. The Commission may, on its own initiative or at the request of the Trustee or Arjowiggins, give any orders or instructions to the Trustee in order to ensure compliance with the conditions and obligations attached to the Decision.
23. The Monitoring Trustee shall:
(i) Propose in its first report to the Commission a detailed work plan describing how it intends to monitor compliance with the obligations and conditions attached to the Decision;
(ii) Oversee the on-going management of the Divestment Business with a view to
ensuring its continued economic viability, marketability and competitiveness and monitor compliance by Arjowiggins with the conditions and obligations attached to the Decision. To that end the Monitoring Trustee shall:
(a) Monitor the preservation of the economic viability, marketability and
competitiveness of the Divestment Business, and the keeping separate of the

176
Divestment Business from the business retained by Arjowiggins, in accordance with paragraphs [5 and 6] of the Commitments;
(b) Supervise the management of the Divestment Business as a distinct and
saleable entity, in accordance with paragraph [7] of the Commitments; (c) (i) In consultation with Arjowiggins, determine all necessary measures to
ensure that Arjowiggins does not, after the Effective Date, obtain any business secrets, knowhow, commercial information, or any other information of a confidential or proprietary nature relating to the Divestment Business, and strive, from the date upon which Arjowiggins acquires effective control over the Target, for the severing of the Divestment Business’ participation in a central information technology network to the extent possible, without compromising the viability of the Divestment Business, and (ii) decide whether such information may be disclosed to Arjowiggins as the disclosure is reasonably necessary to allow Arjowiggins to carry out the divestiture or as the disclosure is required by law;
(d) Monitor the splitting of assets and the allocation of Personnel between the
Divestment Business and Arjowiggins;
(iii) Assume the other functions assigned to the Monitoring Trustee under the conditions and obligations attached to the Decision;
(iv) Propose to Arjowiggins such measures as the Monitoring Trustee considers
necessary to ensure Arjowiggins’ compliance with the conditions and obligations attached to the Decision, in particular the maintenance of the full economic viability, marketability or competitiveness of the Divestment Business, the holding separate of the Divestment Business and the non-disclosure of competitively sensitive information;
(v) Review and assess potential purchasers as well as the progress of the divestiture
process and verify that, dependent on the stage of the divestiture process, (a) potential purchasers receive sufficient information relating to the Divestment Business and the Personnel, in particular by reviewing, if available, the data room documentation and the due diligence process, and (b) potential purchasers are granted reasonable access to the Personnel;
(vi) Provide to the Commission, sending Arjowiggins a non-confidential copy at the
same time, a written report within 15 days after the end of every month. The report shall cover the operation and management of the Divestment Business, so that the Commission can assess whether the Divestment Business is held in a manner consistent with the Commitments, and the progress of the divestiture process as well as potential purchasers. In addition to these reports, the Monitoring Trustee shall promptly report in writing to the Commission, sending Arjowiggins a non-confidential copy at the same time, if it concludes on reasonable grounds that Arjowiggins is failing to comply with these Commitments.

177
(vii) Within one week after receipt of the documented proposal referred to in paragraph
15, submit to the Commission a reasoned opinion as to the suitability and independence of the proposed purchaser and the viability of the Divestment Business after the sale and as to whether the Divestment Business is sold in a manner consistent with the conditions and obligations attached to the Decision, in particular, if relevant, whether the sale of the Divestment Business without one or more Assets or not all of the Personnel affects the viability of the Divestment Business after the sale, taking account of the proposed purchaser.
III. Duties and obligations of Arjowiggins
24. Arjowiggins shall provide and shall cause its advisors to provide the Trustee with all such
cooperation, assistance and information as the Trustee may reasonably require to perform its tasks. The Trustee shall have full and complete access to any of Arjowiggins’ or the Divestment Business’ books, records, documents, management or other personnel, facilities, sites and technical information necessary for fulfilling its duties under the Commitments and Arjowiggins and the Divestment Business shall provide the Trustee upon request with copies of any document. Arjowiggins and the Divestment Business shall make available to the Trustee one or more offices on their premises and shall be available for meetings in order to provide the Trustee with all information necessary for the performance of its tasks.
25. Arjowiggins shall provide the Monitoring Trustee with all managerial and administrative
support that it may reasonably request on behalf of the management of the Divestment Business. This shall include all administrative support functions relating to the Divestment Business which are currently carried out at headquarters level. Arjowiggins shall provide and shall cause its advisors to provide the Monitoring Trustee, on request, with the information submitted to potential purchasers, in particular give the Monitoring Trustee access to the data room documentation and all other information granted to potential purchasers in the due diligence procedure. Arjowiggins shall inform the Monitoring Trustee on possible purchasers, submit a list of potential purchasers, and keep the Monitoring Trustee informed of all developments in the divestiture process.
26. Arjowiggins shall indemnify the Monitoring Trustee and its employees and agents (each
an “Indemnified Party”) and hold each Indemnified Party harmless against, and hereby agrees that an Indemnified Party shall have no liability to Arjowiggins for any liabilities arising out of the performance of the Trustee’s duties under the Commitments, except to the extent that such liabilities result from the wilful default, recklessness, gross negligence or bad faith of the Trustee, its employees, agents or advisors.
27. At the expense of Arjowiggins, the Monitoring Trustee may appoint advisors (in
particular for corporate finance or legal advice), subject to Arjowiggins’ approval (this approval not to be unreasonably withheld or delayed) if the Trustee considers the appointment of such advisors necessary or appropriate for the performance of its duties and obligations under the Mandate, provided that any fees and other expenses incurred by the Trustee are reasonable. Should Arjowiggins refuse to approve the advisors proposed

178
by the Trustee, the Commission may approve the appointment of such advisors instead, after having heard Arjowiggins. Only the Trustee shall be entitled to issue instructions to the advisors. Paragraph [26] shall apply mutates mutandis.
IV. Replacement, discharge and reappointment of the Trustee 28. If the Trustee ceases to perform its functions under the Commitments or for any other
good cause, including the exposure of the Trustee to a conflict of interest:
(a) the Commission may, after hearing the Trustee, require Arjowiggins to replace the Trustee; or
(b) Arjowiggins, with the prior approval of the Commission, may replace the Trustee.
29. If the Trustee is removed according to paragraph [28], the Trustee may be required to continue in its function until a new Trustee is in place to whom the Trustee has effected a full hand over of all relevant information. The new Trustee shall be appointed in accordance with the procedure referred to in paragraphs [16-21].
30. Beside the removal according to paragraph [28], the Trustee shall cease to act as Trustee
only after the Commission has discharged it from its duties after all the Commitments with which the Trustee has been entrusted have been implemented. However, the Commission may at any time require the reappointment of the Monitoring Trustee if it subsequently appears that the relevant remedies might not have been fully and properly implemented.
F. THE REVIEW CLAUSE 31. The Commission may, where appropriate, in response to a request from Arjowiggins
showing good cause and accompanied by a report from the Monitoring Trustee:
(i) Grant an extension of the time periods foreseen in the Commitments, or (ii) Waive, modify or substitute, in exceptional circumstances, one or more of the
undertakings in these Commitments.

179
Where Arjowiggins seeks an extension of a time period, it shall submit a request to the Commission no later than one month before the expiry of that period, showing good cause. Only in exceptional circumstances shall Arjowiggins be entitled to request an extension within the last month of any period. Paris, on April 28, 2008
…………………………………… Charles Dehelly President of Arjowiggins’ Management Board (Président du Directoire) Duly authorized for and on behalf of Arjowiggins

180
SCHEDULE I. Legal and functional structure of the Divestment Business
The Divestment Business corresponds to the activities dedicated to the production and distribution of (i) carbonless paper and (ii) digital paper at M-Real’s Zanders Reflex mill located in Düren, Germany.
The Divestment Business does not include the activities of the Zanders Reflex
mill that are dedicated to the production and distribution of premium fine paper, corresponding to letterhead, tracing, text & cover and crepe paper (the “Premium Fine Paper Business”). The Premium Fine Paper Business includes, in particular, but is not limited to, [Confidential]* located in the Zanders Reflex mill and all intangibles assets attributable to the Premium Fine Paper Business.
The following diagram describes the scope of the Divestment Business in light of
the current operational structure of the Zanders Reflex mill:
II. Scope of the Divestment Business
Following paragraph [4] of these Commitments, the Divestment Business
includes, but is not limited to:
2.1. Tangible assets (i) All movable tangible assets (bewegliche Sachanlagen) dedicated to the production
and distribution of carbonless paper and digital paper, in the meaning of § 266 (2) A. II. Nos. 2, 3 and 4 of the German Commercial Code, consisting, in particular, of
Zanders Reflex Mill
Carbonless Paper Business
Digital Paper Business
Premium Fine Paper Business
Scope of the Divestment Business

181
(i) [Confidential]*; (ii) other technical, factory or office equipment; (iii) assets under construction; and (iv) vehicles and other mobile equipment;1
(ii) All inventories (Vorräte) dedicated to the production and distribution of
carbonless paper and digital paper, in the meaning of § 266 (2) B. I. Nos. 1 to 3 of the German Commercial Code, consisting, in particular, of (i) raw materials, auxiliary materials and supplies; (ii) unfinished goods and work in progress; and (iii) finished goods and merchandise; in case any of such inventories are subject to retention of title in favor of a supplier, the respective expectancy rights (Anwartschaftsrechte) shall be transferred;
(iii) The tradable emission allowances (Emissionsberechtigungen) dedicated to the
production and distribution of carbonless paper and digital paper, pursuant to § 3 para. 4 sentence 1 of the German Greenhouse Gas Emission Trading Act (Treibhausgas-Emissionshandelsgesetz), [Confidential]*;
(iv) All books and records and all other documents and data (whether in hard copy or
electronic format) dedicated to the production and distribution of carbonless paper and digital paper, including drawings, manuals, sales and promotional material, correspondence and lists of customers and suppliers;
(v) [Confidential]*
2.2. Intangible assets
(i) All patents and patent applications, all utility models (Gebrauchsmuster) and
utility model applications, registered designs (Geschmacksmuster) and design applications, copyrights, trade, business and domain names, software protection rights, protected know-how, recipes, tools, and other intellectual property rights (gewerbliche Schutzrechte) transferred from M-Real to Arjowiggins as a result of the Transaction and attributable to the Divestment Business; [Confidential]*;
(ii) In case Arjowiggins or the Divestment Business is not the owner of any of the
aforementioned intangible assets or intellectual property right but benefits from a license for use of such asset or right, a sublicense for an indefinite period for use of such intangible asset or intellectual property right in the Divestment Business (absent termination of the license agreement between Arjowiggins and the licensor and any contractual or statutory prohibition applicable to such sublicense). For the avoidance of doubt, this paragraph shall not be construed as creating an obligation for Arjowiggins to grant any sublicenses relating to licenses other than those granted to Arjowiggins as a result of the Transaction.
2.3. Licenses, permits and authorizations
1 [Confidential]*

182
All licenses, permits, authorizations and emission rights attributable to the Divestment Business (including all rights and obligations thereunder), it being understood that where the transfer of such license, permit, authorization or emission rights requires the consent of the authority or where a new license, permit or authorization or new emission rights have to be applied for, the Purchaser shall bear the risks and expenses related thereto and that Arjowiggins shall make all declarations required and shall, in cooperation with the Purchaser, make its best effort to obtain such consent prior to or on the Closing date;
2.4. Contracts, agreements, leases, commitments and understandings
(i) [Confidential]*
(ii) [Confidential]* (iii) All contracts for the supply of trade goods or services to the Divestment Business;
(iv) All contracts for the delivery of trade goods by the Divestment Business to
customers.
2.5. Customer, credit and other records
(i) The list of the Divestment Business’ customers as well as any information related to the relationship between such customers and the Divestment Business, including, but not limited to, credit records, order and invoice history;
(ii) The list of the Divestment Business’ suppliers as well as any information related
to the relationship between such suppliers and the Divestment Business, including, but not limited to, credit records, order and invoice history;
2.6. Personnel The employment contracts of all employees attributable to the Divestment Business together with all rights and obligations (including pension obligations) there under. [Confidential]* This shall not include the employees dedicated to the Premium Fine Paper Business.

183
2.7. Key Personnel
The Key Personnel of Zanders Reflex working, in particular, in the production and distribution of carbonless paper and digital paper, which includes [Confidential]*, provided that the Key Personnel discloses to Arjowiggins information that is required: (i) To manage the operations of the Premium Fine Paper Business; (ii) [Confidential]*; (iii) To transfer the Divestment Business to the Purchaser; (iv) By law.
2.8. Arrangements for the supply with the following services by Arjowiggins after
Closing
[Confidential]*
3. Assets excluded from the scope of the Divestment Business
The Divestment Business shall not include, in particular:
3.1. Tangible assets (i) All movable tangible assets dedicated to the production and distribution of
Premium Fine Paper, consisting, in particular, of (i) [Confidential]*; (ii) other technical, factory or office equipment; (iii) assets under construction; and (iv) vehicles and other mobile equipment;
(ii) All inventories dedicated to the production and distribution of Premium Fine
Paper, consisting, in particular, of (i) raw materials, auxiliary materials and supplies; (ii) unfinished goods and work in progress; and (iii) finished goods and merchandise;
(iii) All books and records and all other documents and data (whether in hard copy or
electronic format) dedicated to the production and distribution of Premium Fine Paper, including drawings, manuals, sales and promotional material, correspondence and lists of customers and suppliers;
(iv) [Confidential]*.

184
3.2. Intangible assets (i) [Confidential]*
(ii) All patents and patent applications, all utility models (Gebrauchsmuster) and
utility model applications, registered designs (Geschmacksmuster) and design applications, copyrights, trade, business and domain names, software protection rights, protected know-how, recipes, tools, and other intellectual property rights (gewerbliche Schutzrechte) attributable to the production and distribution of Premium Fine Paper.
3.3. Licenses, permits and authorizations
All licenses, permits, authorizations and emission rights attributable to the production and distribution of Premium Fine Paper;
3.4. Contracts, agreements, leases, commitments and understandings
All arrangements exclusively dedicated to the production and distribution of Premium Fine Paper.
3.5. Customer, credit and other records
(i) The list of Zanders Reflex’s Premium Fine Paper customers as well as any
information related to the relationship between such customers and Zanders Reflex, including, but not limited to, credit records, order and invoice history;
(ii) The list of Zanders Reflex’s suppliers for the production and distribution of
Premium Fine Paper as well as any information related to the relationship between such suppliers and Zanders Reflex, including, but not limited to, credit records, order and invoice history.
3.6. Personnel
The employment contracts of all employees attributable to the production and distribution of Premium Fine Paper together with all rights and obligations (including pension obligations) there under. [Confidential]*
3.7 Key personnel The key personnel dedicated to the production and distribution of Premium Fine
Paper.