Embed Size (px)
Citation preview

7/22/2019 Carlsberg Breweries Annual Report 2012
http://slidepdf.com/reader/full/carlsberg-breweries-annual-report-2012 1/152
Carlsberg Breweries A/S
CVR No. 25 50 83 43
Annual Report for 2012(13th financial year)

7/22/2019 Carlsberg Breweries Annual Report 2012
http://slidepdf.com/reader/full/carlsberg-breweries-annual-report-2012 2/152
Contents
Management Review ................................................................................................................................. 3Carlsberg Breweries Group financial statements .................................................................................... 16
Income statement ................................................................................................................................. 17Statement of comprehensive income ................................................................................................... 18Statement of financial position .............................................................................................................. 19Statement of changes in equity ............................................................................................................ 21Statement of cash flows........................................................................................................................ 22Notes..................................................................................................................................................... 23
Financial statements, Parent Company Carlsberg Breweries A/S ........................................................ 113Company information ............................................................................................................................. 147Management statement ......................................................................................................................... 150The independent auditors' report ........................................................................................................... 151
2

7/22/2019 Carlsberg Breweries Annual Report 2012
http://slidepdf.com/reader/full/carlsberg-breweries-annual-report-2012 3/152
Carlsberg Breweries Group
Management Review
Five-year summary
DKK million 2008 2009 2010 2011 2012
Sales volumes, gross (million hl)
Beer 126.8 137.0 136.5 139.8 140.9 Other beverages 22.3 22.2 22.5 22.2 22.0
Sales volumes, pro rata (million hl)
Beer 109.3 116.0 114.2 118.7 120.4 Other beverages 19.8 19.8 19.3 19.2 19.1
Income statementNet revenue 59,944 59,382 60,054 63,561 67,201 Operating profit before special items 7,604 9,460 10,246 9,877 9,909 Special items, net -1,641 -262 -249 605 -1,812 Financial items, net -3,455 -2,980 -2,137 -1,908 -1,735
Profit before tax 2,508 6,218 7,860 8,574 6,362 Corporation tax 383 -1,561 -1,847 -2,156 -1,529 Consolidated profit 2,891 4,657 6,013 6,418 4,833
Attributable to:Non-controlling interests 572 565 609 543 638 Shareholders in Carlsberg Breweries A/S 2,319 4,092 5,404 5,875 4,195
Statement of financial position
Total assets 129,668 121,886 132,148 136,195 141,948 Invested capital 106,740 97,354 104,873 105,992 109,096
Interest-bearing debt, net 45,771 36,122 32,847 30,780 31,639
Equity, shareholders in Carlsberg Breweries A/S 41,367 42,613 52,544 55,572 59,529
Statement of cash flows
Cash flow from operating activities 8,037 13,420 11,225 9,789 10,138 Cash flow from investing activities -57,427 -2,409 -6,242 -4,876 -5,888
Free cash flow -49,390 11,011 4,983 4,913 4,250
Financial ratiosOperating margin % 12.7 15.9 17.1 15.5 14.7
Return on average invested capital (ROIC) % 8.9 9.3 9.8 9.4 9.0
Equity ratio % 31.9 35.0 39.8 40.8 41.9
Debt/equity ratio (financial gearing) x 0.97 0.76 0.57 0.50 0.50
Interest cover x 2.20 3.17 4.80 5.18 5.71
Stock market ratios*
Earnings per share (EPS) DKK 4,629 8,168 10,786 11,727 8,373 Cash flow from operating activities per share (CFPS) DKK 16,042 26,786 22,405 19,539 20,236
Free cash flow per share (FCFPS) DKK -98,583 21,978 9,946 9,806 8,483 Dividend per share (proposed) DKK - - - - 1,827.0 Pay-out ratio % - - - - 22
Employees
Full-time employees (average) 45,364 45,364 41,278 42,552 41,614
Financial ratios are calculated in accordance with the Danish Society of Financial Analysts’ guidelines “Recommendations and Financial
Ratios 2010”.
* Stock market ratios for 2008 are adjusted for bonus factor from rights issue in June 2008 in accordance with IAS 33. Number of shares
(period-end) is not adjusted.
3

7/22/2019 Carlsberg Breweries Annual Report 2012
http://slidepdf.com/reader/full/carlsberg-breweries-annual-report-2012 4/152
ACTIVITIES OF THE GROUP
The Carlsberg Breweries Group is one of the leading brewery groups in the world, with a large portfolio ofbeer and other beverage brands. Carlsberg Breweries’ activities are focused on the markets where theGroup has the expertise and the right products to secure a leading position. Due to the variation of the
markets, the contribution to growth, earnings and development within the Group differs, both at present andin the longer-term projections.
The parent company's main activities are investments in national and international breweries as well aslicense and export business.
BUSINESS DEVELOPMENT
A key part of the Group’s strategy is to drive both our international premium brands – Carlsberg, Tuborg,Kronenbourg 1664, Grimbergen and Somersby – and our strong local power brands. We will continue thedevelopment, enhancement and deployment of our sales and marketing tools across our markets andensure that best practices are embedded across all relevant markets.
The repositioning of the Carlsberg brand, initiated in 2011, continued to be strongly supported in 2012. Animportant event was the EURO 2012 sponsorship, which was successfully activated and an important driverof the 8% volume growth of the Carlsberg brand in its premium markets. The brand grew across all threeregions.
An important initiative behind Tuborg was the rejuvenation of the brand in early 2012 in selected markets,including a new campaign with a new tagline, new visual identity and new communication. The brand grew6% for the year. Major commercial activities were the introduction of Tuborg in China in the spring and thelaunch of the new 3G Tuborg bottle in Russia and India. All initiatives yielded very good results.
Kronenbourg 1664 grew its volume both in France and outside France. We continued to introduce the brandin new markets and saw particularly good results in Russia, Denmark, Canada and in several Asian markets.The wheat beer Kronenbourg Blanc contributed significantly to overall brand development.
Our cider brand, Somersby, almost doubled its volumes and became the fastest growing global top 10 ciderbrand in 2012 (source: Canadean). The strong growth was driven by both category growth and a significantgeographical expansion throughout the Group. The Somersby portfolio was extended with Somersby DoublePress, a premium, naturally refreshing dry cider. Somersby was launched in 15 new markets in 2012 and isnow available in 35 markets worldwide.
Grimbergen, our super-premium Belgian abbey ale, was launched in nine new markets across Europe and Asia. This, coupled with the introduction of a new proprietary Grimbergen bottle, livery, an impactfulmarketing activation programme and strong performance in the French market, resulted in solid double-digitvolume growth for the Grimbergen brand.
As a result of the strong performance of our international premium portfolio as well as our local power brands,
in 2012 the Group once again grew market share across a substantial part of its business, including verysolid market share performance in Western Europe (approximately +40bp). In Eastern Europe, our marketshare developed favourably throughout the year and continued the positive trend seen since Q4 2011. In
Asia, we continued to increase our market share across most markets.
During the year, we invested alongside the United Nations Industrial Development Organization (UNIDO) inan initiative to improve the environment in Russia; through the International Centre for Alcohol Policy (ICAP)we pledged a 5-year commitment to strengthen our efforts to reduce the misuse of alcohol; and wecontinued to make good progress in lowering our energy and water consumption and CO2 emissions.
2012 results
For 2012, overall market growth was mixed across our three regions. Impacted by a challenging macro andconsumer environment and bad weather during the summer, the Western European market declined overall
4

7/22/2019 Carlsberg Breweries Annual Report 2012
http://slidepdf.com/reader/full/carlsberg-breweries-annual-report-2012 5/152
by around 3% (excluding the strong-performing Polish market). The Russian beer market was flat for theyear. The Asian markets continued to grow.
Group organic beer volumes were flat. Volume development in Q1 and Q4 was impacted by destocking inRussia in Q1, stocking in France in Q4 and less stocking in Russia in Q4 than in 2011. Adjusted for this
disruption, organic beer volume growth would have been +1%. Reported beer volumes grew by 1%. Theacquisition impact related to Asia. The pro rata volume for other beverages was flat.
Net revenue grew by 6% to DKK 67,201m as a result of 3% organic growth (total beverage volume of -1%and positive price/mix of 4%), +2% from currencies and a net acquisition impact of +1%.
Cost of sales per hl for the year grew organically by 4% in line with expectations. Gross profit per hl greworganically by 3% as the positive price/mix and production efficiencies more than offset the higher inputcosts. Due to the higher input costs across all regions, gross profit margin decreased by 30bp to 49.7%
Operating expenses grew organically by 4% for the year, largely in line with the organic growth in netrevenue. The increase was driven by several factors, including higher logistics costs in Eastern Europe,increased trade marketing investments in Russia and growth in Asia.
Consequently, Group operating profit was flat at DKK 9,909m with a 4% organic decline and reportedoperating margin declined to 14.7%. The positive currency impact was mainly due to the weakness of theDKK versus Eastern European and Asian currencies. The acquisition impact was due to the 2011acquisitions in Laos and Vietnam. Adjusted for the stocking/destocking disruptions in Russia and France andthe suspended production in Uzbekistan, organic operating profit would have declined by an estimated 1-2%.
Reported net profit declined to DKK 4,195m (2011: DKK 5,875m).
Cash flow
Average trade working capital to net revenue was reduced to 1.0% at the end of 2012 versus 1.9% at theend of 2011.
Free operating cash flow was DKK 5,070m, down 3% from 2011. Free cash flow declined to DKK 4,250m(DKK 4,913m in 2011), driven by slightly higher capital expenditures and financial investments.
The Group invested significant resources in structural changes such as the buyout of minority shareholdersin Russia and the Balkans. The net interest-bearing debt is at DKK 31.6bn, an increase of DKK 0.9m from2011.
The Group took advantage of the attractive market for corporate bonds and issued three bonds during 2012.In July, the Group placed a 7-year EUR 500m bond with a coupon of 2.625%. The principal amount of thisissue was increased in November to EUR 750m, together with the issue of a 10-year EUR 750m bond with acoupon of 2.625%.
Structural changesDuring 2012, the Group took several important steps to further focus and strengthen the company’s growthprofile.
In Q1, the Group increased its ownership in several businesses in the Balkan area and now has 100%ownership of the subsidiaries in Serbia, Croatia and Bulgaria.
In 2012 the Group initiated and completed the buyout of the remaining minority shareholders in BaltikaBreweries. Following a successfully executed voluntary offer and compulsory purchase, the Groupannounced on 29 November that the transaction was complete and that it had obtained 100% ownership ofBaltika Breweries at a total purchase price of DKK 4.3bn.
5

7/22/2019 Carlsberg Breweries Annual Report 2012
http://slidepdf.com/reader/full/carlsberg-breweries-annual-report-2012 6/152
On 14 November, the Group announced the signing of an agreement to acquire a further shareholding ofapproximately 19% in Chongqing Jianiang Brewery Co. Ltd., taking the total shareholding close to 50%. Ourpartner in this joint venture is Chongqing Brewery Co. Ltd.
The supply chain integration and business standardisation project
2013 will be a year in which the Group will start implementing one of its largest and most important projectsin recent years. The roll-out of the supply chain integration and business standardisation project in WesternEurope will start with our Swedish subsidiary going live with the system in the spring, followed later byNorway and the UK.
The project will be a key enabler for the transformation of our Western European operating model, with allprocurement, production, planning and logistics across the region being centrally managed, supported bystandardised processes and data, and full transparency. The purpose is to improve capabilities, customerservice and efficiency, increase speed and optimise asset utilisation. This project will yield significant long-term benefits when fully implemented in Western Europe, but will also require significant resources andentail substantial implementation costs.
For 2013, 2014 and 2015, additional costs related to this project are expected to be approximately DKK 300-400m, DKK 400-500m and DKK 500m respectively.
FINANCIAL REVIEW
Income statement
The Group generated total net revenue of DKK 67,201m, an increase of 6% compared with 2011. Grossprofit was DKK 33,370m (DKK 31,773m in 2011), and the gross profit margin declined by 30bp to 49.7% dueto higher input costs.
Sales and distribution expenses increased by DKK 1,162m to DKK 19,645m, primarily due to higher salesand marketing investments in Eastern Europe and Asia and higher logistics costs, mainly in Eastern Europe.
Administrative expenses amounted to DKK 4,174m (DKK 3,944m in 2011) and other operating income, netwas DKK 246m (DKK 357m in 2011). The Group’s share of profit after tax in associates was DKK 112m(DKK 174m in 2011).
Group operating profit before special items was DKK 9,909m (DKK 9,877m in 2011). Strong growth in Asiaand Northern & Western Europe was not enough to offset the decline in Eastern Europe.
Net special items (pre-tax) amounted to DKK -1,812m against DKK 605m in 2011. The main items impactingspecial items were the impairment of Vena Brewery, production and sales equipment in Russia (DKK -589m),impairment and restructuring of our business in Uzbekistan (DKK -290m), restructuring in Norway (DKK -262m) and restructuring of the Nordic Getränke joint venture in Germany (DKK -118m). Generally, specialitems include costs in connection with the restructuring measures implemented across the Group.
Net financial costs declined to DKK -1,735m against DKK -1,908m in 2011. Net interest costs were DKK -1,529m (2011: DKK 1,707m) due to lower average funding costs coming from lower short-term interest ratesand the maturity of a GBP 250m bond in December 2011. Other net financial items decreased to DKK -206m(2011: DKK -201m), primarily due to currency and fair value adjustments.
Tax totalled DKK -1,529m against DKK -2,156m in 2011. The reported tax rate was 24.0% versus 25.2% in2011 impacted by non-taxed gains within special items.
Non-controlling interests were DKK -638m, an increase of DKK -95m versus 2011 (DKK -543m) due to theincreased shareholding in Lao Brewery in 2011, since when the company has been fully consolidated (51%ownership) versus previous proportional consolidation. This more than offset lower non-controlling interestsfrom Baltika Breweries following the buyout of minority shareholders during the year.
Carlsberg’s share of net profit was DKK 4,195m versus DKK 5,875m in 2011.
6

7/22/2019 Carlsberg Breweries Annual Report 2012
http://slidepdf.com/reader/full/carlsberg-breweries-annual-report-2012 7/152
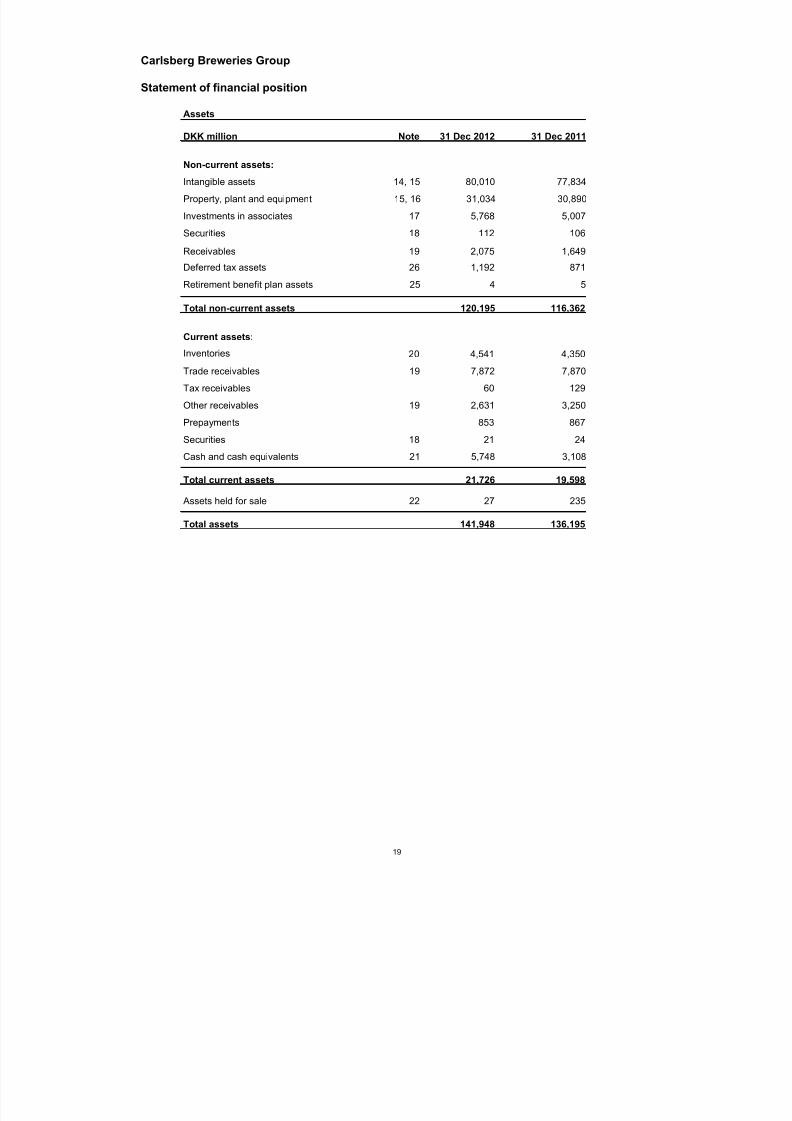
Statement of financial position
At 31 December 2012, Carlsberg had total assets of DKK 141.9bn against DKK 136.2bn at 31 December2011.
Assets
Intangible assets increased to DKK 80.0bn against DKK 77.8bn at 31 December 2011, driven by currencyimpact from Russia.
Property, plant and equipment increased to DKK 31.0bn against DKK 30.8bn at 31 December 2011, mainlydue to investments being on a par with depreciation, an exchange rate difference of DKK 0.7bn andimpairment of DKK -0.9bn, mainly related to activities in Russia and Norway.
Financial assets increased to DKK 9.1bn against DKK 7.6bn at 31 December 2011. The increase was largelyrelated to investments in the 48.58% shareholding in Chongqing Jianiang Brewery Co. Ltd. In China and the25% shareholding in the consortium developing the Copenhagen brewery site.
Current assets increased to DKK 21.7bn against DKK 19.6bn at 31 December 2011. The increase was
primarily related to cash.
Liabilities
Total equity increased to DKK 62.9bn versus DKK 61.3bn at 31 December 2011. DKK 59.5bn can beattributed to shareholders in Carlsberg Breweries A/S and DKK 3.4bn to non-controlling interests.
The increase in equity of DKK 1.6bn was mainly due to profit for the period of DKK 4.8bn and foreignexchange gains of DKK 1.9bn, actuarial losses to DKK -0.7bn and acquisition of non-controlling interests toDKK -4.6bn, mainly related to the acquisition of minority shares in Baltika Breweries.
Liabilities increased to DKK 79.0bn against DKK 74.7bn at 31 December 2011. The increase was in bothcurrent and non-current liabilities.
Non-current liabilities increased to DKK 51.6bn (DKK 48.2bn at 31 December 2011), principally due to higherborrowings related to increased financial investments in associated entities and non-controlling interests.
Current liabilities increased to DKK 27.4bn (DKK 26.5bn at 31 December 2011) due to a DKK 1.9bn bondthat matures February 2013 and thus became a current liability, and an increase in trade payables of DKK0.8bn as a result of our continued focus on reducing average trade working capital.
Cash flow
Operating profit before depreciation and amortisation was DKK 13,917m (DKK 13,643m in 2011).
The change in trade working capital was DKK 865m (DKK 361m in 2011). Average trade working capital tonet revenue was 1.0% at the end of 2012 versus 1.9% at the end of 2011.
Paid net interest etc. amounted to DKK -1,873m (DKK -2,049m in 2011).Cash flow from operating activities was DKK 10,138m against DKK 9,789m in 2011. The 4% increase wasdriven by improved trade working capital.
Cash flow from investing activities was DKK -5,888m against DKK -4,876m in 2011. Total operationalinvestments of DKK -5.1bn were above 2011 (DKK -4.6bn in 2011) and primarily included sales investmentsand capacity expansion in Asia. Total financial investments of DKK -798m (DKK -314m in 2011) were mainlyrelated to the acquisition of associates, including the establishment of the Chongqing Jianiang Brewery Co.Ltd. joint venture and the subsequent acquisition of an additional 18.58% shareholding.
Free cash flow was DKK 4,250m against DKK 4,913m for 2011.
7

7/22/2019 Carlsberg Breweries Annual Report 2012
http://slidepdf.com/reader/full/carlsberg-breweries-annual-report-2012 8/152
Financing
At 31 December 2012, gross interest-bearing debt amounted to DKK 39.8bn and net interest-bearing debtamounted to DKK 31.6bn. The difference of DKK 8.2bn was other interest-bearing assets, including DKK5.8bn in cash and cash equivalents. Net interest-bearing debt was impacted by DKK 4.9bn from acquisitionof non-controlling interests, mainly related to the increased shareholding in Baltika Breweries.
Of the gross interest-bearing debt, 92% (DKK 36.5bn) was long term, i.e. with maturity after more than oneyear. The net interest-bearing debt consisted primarily of facilities in EUR and approximately 86% was atfixed interest (fixed-interest period exceeding one year).
The Group issued three bonds during 2012. In July, the Group placed a 7-year EUR 500m bond with acoupon of 2.625%. The principal amount of this issue was increased to EUR 750m in November togetherwith the issue of a 10-year EUR 750m bond with a coupon of 2.625%.
INCENTIVE PROGRAMMES
In 2012, a total of 131,500 share options were granted to members of the Executive Board of the CarlsbergGroup.
In addition, a total of 202,955 performance share units (PSUs) have been granted to other managementpersonnel as part of the long-term incentive programme. The number of PSUs in this programme ispreliminary, as the final number will be determined on the basis of a per-unit value calculated as an averageof the share price on the first five trading days after publication of the present Company announcement.
The share options were granted to a total of two employees with an exercise price of DKK 444.60 (2011:61,200 share options to three employees with an exercise price of DKK 566.78). The PSUs were granted toa total of 319 employees with an exercise price of DKK 0 (2011: no grant).
Long-term incentive awards for the Executive Board for 2013 will be determined following the AnnualGeneral Meeting.
RISK MANAGEMENT
At Carlsberg we consider effective risk management an integral part of our business operations as it reducesuncertainty, helps the group achieve its strategic ambition and facilitates value creation for all stakeholders.
Carlsberg’s comprehensive approach to risk management involves the identification, assessment,prioritisation and economic management of risks that might prevent the Group from achieving its strategicambition. The Risk Management Policy sets out the requirements for the risk management process in theGroup.
Risk management framework
Carlsberg’s risk management fr amework is a systematic process of risk identification, analysis and
evaluation, providing a comprehensive overview of strategic risks and enabling the Group to mitigate andmonitor the most significant risks.
Our risk management approach is top-down and covers all major entities across regions, markets andfunctions. The framework is based at the strategic level to ensure that the risks related to carrying out theGroup’s strategy – both short-term and long-term – are identified and that relevant preventive actions aretaken.
Risk management governance structure
Ultimately, the Supervisory Board is responsible for risk management. The Supervisory Board has appointedthe Audit Committee to act on behalf of the Supervisory Board. The Audit Committee monitors the overallstrategic risk exposure and the individual risk factors associated with the Group’s activities. Monitoring ismainly performed in connection with the quarterly reporting process. The Audit Committee adopts guidelines
8

7/22/2019 Carlsberg Breweries Annual Report 2012
http://slidepdf.com/reader/full/carlsberg-breweries-annual-report-2012 9/152
for key areas of risk, monitors developments and sees that plans are in place for the management ofindividual risk factors, including commercial and financial risks.
The Executive Committee (ExCom) is responsible for reviewing the overall risk exposure associated with theGroup’s activities. Strategic risks are assessed according to a two -dimensional heat map rating system that
estimates the impact of the risk on net revenue or brand/image and the likelihood of the risk materialising.Based on this assessment, ExCom updates the existing heat map to reflect changes in perceived risks to thebusiness, and a number of high-risk issues for the coming year are identified. In addition, any risks in relationto the Group strategy for the subsequent three-year period are identified and appropriate actions are agreedupon.
In accordance with the Risk Management Policy, ExCom identifies owners of short-term and long-term riskswho are responsible for mitigating the risks through a programme of risk-reducing activities.
Local entities and Group functions are responsible for the identification, evaluation, qualification, recordingand reporting of the management of strategic risks at local level. Local-level risk assessment follows thesame principles as Group- level risk assessment and is based upon the heat map described above. Thelocal risk review is carried out regularly, and, following the review, local risk owners are appointed and given
responsibility for mitigating the risks through a programme of risk-reducing activities.
A formal procedure is in place for on-going identification, assessment and reporting during the year of anynew or emerging risks that are determined to have a material impact upon the business.
Group Internal Audit is responsible for facilitating and following up on risk-reducing activities/action plans forthe most significant risks in the Group.
The financial risks, including foreign exchange, interest rate, and credit and liquidity risks, are described inthe notes to the consolidated financial statements.
Risk assessment 2013
In October 2012, ExCom carried out the annual risk management workshop to evaluate the adequacy of theexisting heat map. The review resulted in a revision of the identified high risks, and a revised set of high risksfor 2013-2017 were defined. Local risk management workshops and heat mapping were carried out duringthe third quarter of 2012.
The correlation between the high risks identified at Group level and at local level was significant, whichindicates that the strategy and associated risks at local and regional level are aligned with the overall Groupstrategy.
Among the risks identified, the change agenda related to the supply chain integration, legal restrictions inEastern Europe and increased promotional pressure from retail customers were classifi ed as high risks for2013. These three risks are presented on the opposite page. The other strategic high risks identifi edincluded declining beer markets and the image of beer in Europe, increasing excise taxes, tightened
regulation and lack of top-line growth. The Group closely monitors and undertakes risk-reducing activities inorder to minimise the likelihood and potential impact of strategic high risks.
Economic do wnturn . The uncertain global environment and an economic downturn impacting consumersentiment were considered a high risk at the end of 2011.
A number of risk-reducing activities were initiated to mitigate the impact of an economic downturn. Theseincluded a revision of the regional structure of the Group, which led to the Northern and Western Europeentities being combined into one managed region to allow more focused allocation of resources, thedevelopment and deployment of various tools to extract maximum return on investments, accelerationof working capital initiatives, and on-going cost reduction initiatives.
9

7/22/2019 Carlsberg Breweries Annual Report 2012
http://slidepdf.com/reader/full/carlsberg-breweries-annual-report-2012 10/152
The mitigation initiatives alongside other Group projects, such as the supply chain integration and the focuson investment opportunities in growth markets outside Europe, mean that “economic downturn” is no longerdealt with as a high risk for the Group.
Russian consum er sent iment and Russian dependency. Russia is the Group’s largest market,
accounting for approximately 30% of beer volumes and 40% of operating profit. All other markets account forless than 10% of Group operating profi t. Group earnings are therefore highly exposed to the performance ofthe Russian business.
For 2012, the dependency on Russia and the Russian consumer sentiment was viewed as a high risk. Tocounter the risk, a number of changes were undertaken during 2011 and early 2012, including the roll-out ofa number of Group tools, a sharpened focus on public affairs, structural changes, the appointment of a newCEO and other management changes, particularly within sales. In addition, the planning for 2012 was basedon detailed analyses and modelling of anticipated developments in consumer sentiment, inflation and othermacroeconomic indicators, pricing, changes in regulation etc. to allow a fast response if assumptions did notmaterialise.
The many changes implemented in our Russian business have yielded satisfying results and,
notwithstanding the fact that the dependency on Russia remains high and, consequently, a strategic risk, it isnot as such deemed a high risk for 2013.
Abi l i ty to inc rease pr ices. Lack of ability to raise prices was identified as a high risk for 2012 as a largenumber of our input costs increased and we therefore had to increase our sales prices accordingly.
Risk-mitigating activities included sophisticated value management tools to increase net sales/hl. Valuemanagement levers embrace price, customer investment, promotions, value engineering and product mix.Systems were established to allow ExCom to regularly monitor net sales/hl and deviation from budgets andestimates. In addition, the Group invested in key account capability building.
The measures and actions taken to mitigate the risk of being able to increase prices were consideredadequate, and the risk is not considered a high risk for 2013.
CORPORATE SOCIAL RESPONSIBILITY
Integrating CSR into our business functions is necessary to maintain our licence to operate, address risks,and create commercial and efficiency opportunities. Across the Carlsberg Group, we make decisions thathave a positive impact on our business and the communities in which we operate and we are committed toconducting our operations in a socially and environmentally responsible way.
In 2012, we further developed our CSR strategy and priorities and will consequently increase our efforts withsustainable packaging and responsible drinking. Furthermore, we will continue our efforts to reduceconsumption of water and energy to maintain our position – according to the most recent data available – asthe world’s most efficient global brewer from this perspective.
10
7/22/2019 Carlsberg Breweries Annual Report 2012
http://slidepdf.com/reader/full/carlsberg-breweries-annual-report-2012 11/152
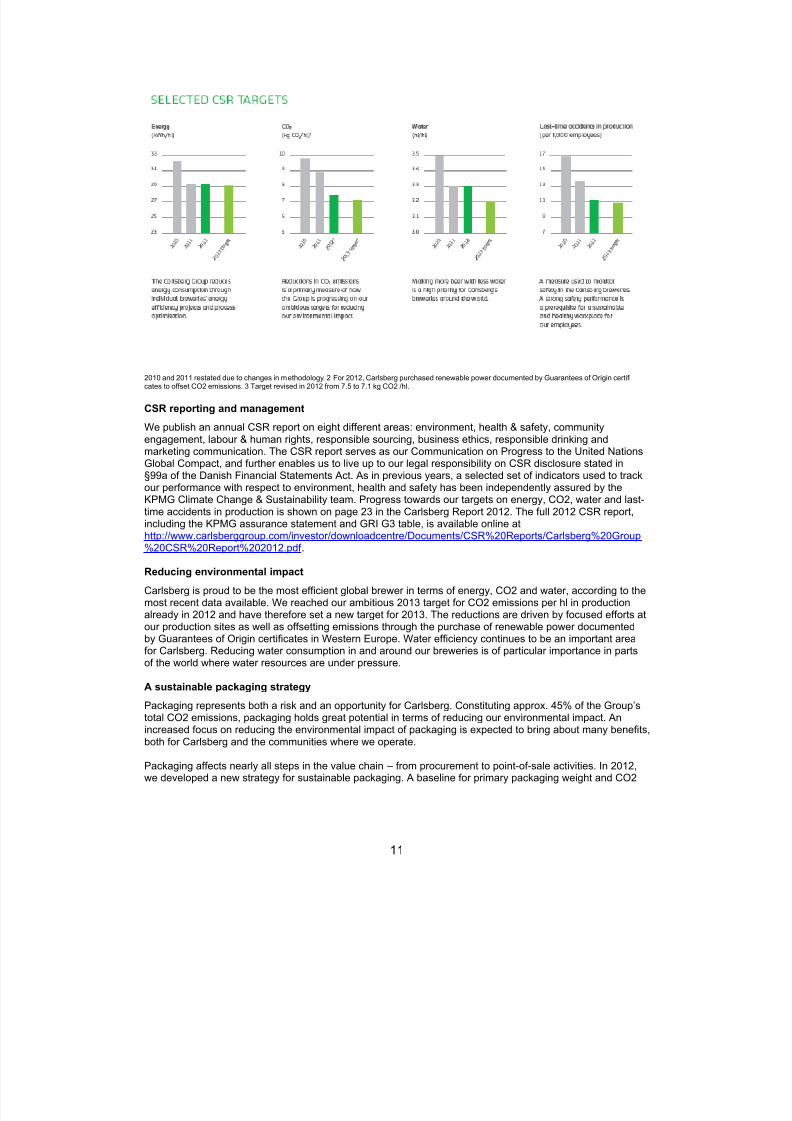
2010 and 2011 restated due to changes in methodology. 2 For 2012, Carlsberg purchased renewable power documented by Guarantees of Origin certificates to offset CO2 emissions. 3 Target revised in 2012 from 7.5 to 7.1 kg CO2 /hl.
CSR reporting and management
We publish an annual CSR report on eight different areas: environment, health & safety, communityengagement, labour & human rights, responsible sourcing, business ethics, responsible drinking andmarketing communication. The CSR report serves as our Communication on Progress to the United Nations
Global Compact, and further enables us to live up to our legal responsibility on CSR disclosure stated in§99a of the Danish Financial Statements Act. As in previous years, a selected set of indicators used to trackour performance with respect to environment, health and safety has been independently assured by theKPMG Climate Change & Sustainability team. Progress towards our targets on energy, CO2, water and last-time accidents in production is shown on page 23 in the Carlsberg Report 2012. The full 2012 CSR report,including the KPMG assurance statement and GRI G3 table, is available online athttp://www.carlsberggroup.com/investor/downloadcentre/Documents/CSR%20Reports/Carlsberg%20Group%20CSR%20Report%202012.pdf .
Reducing environmental impact
Carlsberg is proud to be the most efficient global brewer in terms of energy, CO2 and water, according to themost recent data available. We reached our ambitious 2013 target for CO2 emissions per hl in productionalready in 2012 and have therefore set a new target for 2013. The reductions are driven by focused efforts at
our production sites as well as offsetting emissions through the purchase of renewable power documentedby Guarantees of Origin certificates in Western Europe. Water efficiency continues to be an important areafor Carlsberg. Reducing water consumption in and around our breweries is of particular importance in partsof the world where water resources are under pressure.
A sustainable packaging strategy
Packaging represents both a risk and an opportunity for Carlsberg. Constituting approx. 45% of the Group’stotal CO2 emissions, packaging holds great potential in terms of reducing our environmental impact. Anincreased focus on reducing the environmental impact of packaging is expected to bring about many benefits,both for Carlsberg and the communities where we operate.
Packaging affects nearly all steps in the value chain – from procurement to point-of-sale activities. In 2012,
we developed a new strategy for sustainable packaging. A baseline for primary packaging weight and CO2
11

7/22/2019 Carlsberg Breweries Annual Report 2012
http://slidepdf.com/reader/full/carlsberg-breweries-annual-report-2012 12/152
emissions was established and reduction potentials were estimated. In 2013, we will implement a number ofprojects and initiatives to reduce the environmental impact of our packaging. Read more about oursustainable packaging efforts on page 38 in the Carlsberg Report 2012.
Promoting responsible drinking
While the vast majority of consumers enjoy beer in moderation as part of a healthy lifestyle, we recognisethat a minority of consumers may have a harmful drinking pattern leading to unwanted health and socialeffects. As a responsible brewer, we are committed to fighting the harmful consumption of beer andpromoting responsible drinking.
THE AUDIT COMMITTEE
In 2012, the Audit Committee consisted of three members of the Supervisory Board. Jess Søderberg(Chairman) and Richard Burrows were members of the Committee for the entire year. Povl Krogsgaard-Larsen was a member of the Committee until he retired from the Supervisory Board in March 2012, afterwhich Flemming Besenbacher became a member of the Committee.
The Audit Committee is appointed for one year at a time. For 2013, Jess Søderberg, Richard Burrows,Donna Cordner and Flemming Besenbacher have been appointed to the Committee. Jess Søderberg,Richard Burrows and Donna Cordner all qualify as being independent of the Company and all possess therelevant financial expertise.
The Audit Committee works according to Terms of Reference, which are reviewed and approved annually bythe Supervisory Board, and a detailed annual meeting plan approved by the Supervisory Board prior to thebeginning of each financial year. The Supervisory Board approved the current Terms of Reference and the
Audit Committee meeting plan for 2012 at its meeting in December 2011. The Terms of Reference areavailable on the Company’s website.
In 2012, the Audit Committee held five meetings. All members participated in three of the meetings. At twomeetings, one member was absent. In accordance with its Terms of Reference and annual meeting plan, the
Audit Committee has primarily carried out the following work:
a) Monitored the financial reporting process. The presentations to the Audit Committee and the AuditCommittee’s discussions had special focus on management judgements, estimates, and changes inaccounting policies and procedures and the clarity of disclosures. In addition, they focused on compliancewith accounting standards and stock exchange and other legal requirements related to the financial reporting.The Audit Committee also discussed the assumptions behind the Company’s full-year profit expectationsbefore all releases of financial statements.
b) Monitored the effectiveness of the internal control and risk management systems. This work includedregular updates from Group Finance with regard to Carlsberg’s financial control framework. The AuditCommittee reviewed the company’s relevant Group-wide policies in relation to internal control and risk
management systems and the financial reporting process and received reports and presentations fromGroup Finance about the effectiveness of these systems as well as the scope, plans and status for controlsthroughout the year. The Audit Committee also reviewed quarterly reports from Group Internal Audit on riskmanagement, including the risk management process at Carlsberg and the status of risks identified in thestrategic risk map and heat map.
c) Monitored the internal audit function. The work included a review and approval of internal audit plans, areview of the internal audit function and competences and an evaluation of the independence of GroupInternal Audit. The Audit Committee was presented with several of the tools used by Group Internal Audit inits work and a benchmarking report comparing Carlsberg’s internal audit function with other internal auditfunctions worldwide.
d) Monitored the external audit of financial reporting and the independence of the external audit. The work
included discussions regarding audit planning and scope, terms of engagement, audit fees and a review ateach meeting of the external auditors’ work and findings.
12

7/22/2019 Carlsberg Breweries Annual Report 2012
http://slidepdf.com/reader/full/carlsberg-breweries-annual-report-2012 13/152
In accordance with the Terms of Reference, four of the Audit Committee meetings were held prior to theapproval and announcement of the external financial reporting.
In addition, and in accordance with the Terms of Reference, all minutes and material were made available to
the Supervisory Board, internal and external auditors and the Executive Board. The Audit CommitteeChairman also reported at each Supervisory Board meeting on the key findings and conclusions from theprevious Audit Committee meeting.
At each Audit Committee meeting, the Audit Committee examines relevant issues with the external auditorsand the head of Group Internal Audit, and the Committee invites other relevant function heads from theCarlsberg organisation depending on the topics being discussed at the meeting. The heads of GroupFinance and Group Accounting are usually invited to participate in the Audit Committee meetings. In 2012,the Audit Committee held regular meetings with the external auditors and Group Internal Audit as well aswith other relevant internal function heads without the presence of the Executive Board of the Company.
INTERNAL CONTROLS OF FINANCIAL REPORTING
Overall control environment
The Supervisory Board and the Executive Board have overall responsibility for the Group’s controlenvironment. The Audit Committee appointed by the Supervisory Board is responsible for monitoring theinternal control and risk management systems related to the financial reporting process on an on-going basis.
The Company has a number of policies and procedures in key areas of financial reporting, including theFinance Manual, the Controller Manual, the Chart of Authority, the Risk Management Policy, the TreasuryPolicy, the Information Security Policy and the Business Ethics Policy. The policies and procedures apply toall subsidiaries, and similar requirements are set out in collaboration with the partners of the joint ventures.
The internal control and risk management systems are designed to mitigate rather than eliminate the risksidentified in the financial reporting process. Internal controls related to the financial reporting process areestablished to mitigate, detect and correct material misstatements in the consolidated financial statements.
The monitoring of risk and internal controls in relation to the financial reporting process are anchored by thereporting of the maturity level of the control environment using Carlsberg’s financial control framework.
Risk assessment
The risk assessment process related to the risk in relation to the financial reporting process is assessedannually and approved by the Audit Committee.
The risk related to each accounting process and account in the consolidated financial statements isassessed based on quantitative and qualitative factors. The associated financial reporting risks are identifiedbased on the evaluation of the impact of the risks materialising and the likelihood of the risks materialising.
The identified areas are divided into accounts with high, medium or low risk. High-risk areas are accountsthat include significant accounting estimates, including goodwill and special items, and the sales andpurchase process. Carlsberg’s financial control framework reporting covers relevant Group companies andfunctions to the level where high-risk accounts are covered at least 80% and medium-risk accounts at least60%. Low-risk accounts are not covered.
Control activities
The Group has implemented a formalised financial reporting process for the strategy process, budgetprocess, quarterly estimates and monthly reporting on actual performance. The accounting informationreported by all Group companies is reviewed both by controllers with regional or functional in-depthknowledge of the individual companies/functions and by technical accounting specialists. In addition,significant Group companies have controllers with extensive commercial and/or accounting knowledge and
insight.
13

7/22/2019 Carlsberg Breweries Annual Report 2012
http://slidepdf.com/reader/full/carlsberg-breweries-annual-report-2012 14/152
Based on the risk assessment, the Group has established minimum requirements for the conducting anddocumentation of IT and manual control activities to mitigate identified significant financial reporting risks.Carlsberg’s financial control framework covers 132 controls relating to 23 accounting processes and areas.The relevant Group companies and functions must ensure that Carlsberg’s financial control framework is
implemented in their business and that individual controls are designed to cover the predefined specific risk.The local management is responsible for ensuring that the internal control activities are performed anddocumented, and is required to report the compliance quarterly to the Group’s finance organisation.
The entities in the Group are dependent on IT systems. Any weaknesses in the system controls or ITenvironment are compensated for by manual controls in order to mitigate any significant risk relating to thefinancial reporting. This includes the implementation of compensating controls during the implementation ofthe supply chain integration and business standardisation project given that an increased number of peoplewill have access to systems. Sweden will be the first country to implement the project in the spring of 2013.
Information and communication
The Group has established information and communication systems to ensure that accounting and internal
control compliance are established, including a finance manual, a controller manual and internal controlrequirements.
Besides this, the Group has implemented a formalised reporting process for reporting monthly, quarterly,budget and estimate figures from all countries and functions.
Monitoring
The Audit Committee’s monitoring covers both the internal control environment and business risk. Themonitoring of the internal control environment is covered by Carlsberg’s financial control framework. Thebusiness risk is assessed and reviewed at multiple levels in the Group, such as periodic review of controldocumentation, controller visits and audits performed by Group Internal Audit. Additionally, business risksare discussed and monitored at business review meetings between the Executive Committee, regionalmanagement and local management, at which potential financial impacts are identified.
The Audit Committee’s Terms of Reference outline its roles and responsibilities concerning supervision andmonitoring of the internal control and risk management systems related to financial reporting. The monitoringis performed on the basis of periodical reporting from the finance organisation, internal and external audit.
2013 EARNINGS EXPECTATIONS
For 2013, the Group expects beer market dynamics for all three regions to be similar to 2012.
2013 volumes are expected to be impacted by destocking in France and Russia in Q1 and stock building inRussia in Q4 ahead of the RUB 3 excise tax increase in January 2014.
Reported cost of sales per hl is expected to be flat with limited variation between the three regions. In
organic terms, cost of sales per hl is expected to grow by low single-digit percentages.
The Group will continue to drive a focused commercial agenda, balancing volume and value share. For 2013,we expect sales and marketing investments to revenue at the level of last year.
Costs associated with roll-out of the integrated supply chain and business standardisation project in WesternEurope will impact Group profits in 2013 by approximately DKK 300-400m.
Average all-in cost of debt will decline by some 50-75bp due to the maturity of a GBP 200m bond inFebruary 2013 and the bond issues during 2012.
The tax rate is expected to be 24-25%.
Capital expenditures are expected to remain at the level of 2012.
14

7/22/2019 Carlsberg Breweries Annual Report 2012
http://slidepdf.com/reader/full/carlsberg-breweries-annual-report-2012 15/152
The outlook is based on an average EUR/RUB exchange rate of 42 (a EUR/RUB change of+/- 1 impacts Group operating profit by slightly less than +/- DKK 100m).
Based on the above, for 2013 the Group expects:
Operating profit before special items of around DKK 10bn. Adjusted net profit to increase by a mid-single-digit percentage.
COMPANY ANNOUNCEMENTS
Date Event
27.02.2012 Carlsberg Group looks to strengthen and diversify Supervisory Boardwith three new appointments
06.03.2012 Clarification as to Carlsberg’s statement of intention to delist Baltika as soon as possible
23.03.2012 Carlsberg Breweries Annual Report 2011
04.04.2012 Delisting of Baltika Breweries15.05.2012 Voluntary offer to minority shareholders in Baltika Breweries submitted
to Russian authorities
31.05.2012 Voluntary offer to minority shareholders of Baltika Breweries
26.06.2012 Carlsberg issues 7-year EUR Notes
17.07.2012 MICEX approves delisting of Baltika Breweries
21.08.2012 Ownership of Baltika Breweries increased to 96.77%
17.09.2012 Compulsory purchase of outstanding shares in Baltika Breweries initiated
08.11.2012 Successful placement of two notes
14.11.2012 Carlsberg Group increases its ownership in Chinese joint venture
29.11.2012 Full ownership of Baltika Breweries
DISCLAIMER
This Annual Report contains forward-looking statements, including statements about the Group’s sales, revenues, earnings, spending,margins, cash flow, inventory, products, actions, plans, strategies, objectives and guidance with respect to the Group’s future operatingresults. Forward looking statements include, without limitation, any statement that may predict, forecast, indicate or imply future results,performance or achievements, and may contain the words “believe, anticipate, expect, estimate, intend, plan, project, will be, willcontinue, will result, could, may, might” , or any variations of such words or other words with similar meanings. Any such statements aresubject to risks and uncertainties that could cause the Group’s actual results to differ materially from the results discussed in suchforward-looking statements. Prospective information is based on management’s then current expectations of forecasts. Suchinformation is subject to the risk that such expectations or forecasts, or the assumptions underlying such expectations or forecasts, maychange. The Group assumes no obligation to update any such forwardlooking statements to reflect actual results, changes inassumptions or changes in other factors affecting such forward-looking statements. Some important risk factors that could cause theGroup’s actual results to differ materially from those expressed in its forward -looking statements include, but are not limited to:economic and political uncertainty (including interest rates and exchange rates), financial and regulatory developments, demand for theGroup’s products, increasing industry consolidation, competition from other breweries, the availability and pricing of raw materials andpackaging materials, cost of energy, production- and distribution related issues, information technology failures, breach or unexpectedtermination of contracts, price reductions resulting from market-driven price reductions, market acceptance of new products, changesin consumer preferences, launches of rival products, stipulation of market value in the opening balance sheet of acquired entities,litigation, environmental issues and other unforeseen factors. New risk factors can arise, and it may not be possible for management topredict all such risk factors, nor to assess the impact of all such risk factors on the Group’s business or the extent to which anyindividual risk factor, or combination of factors, may cause results to differ materially from those contained in any forward-lookingstatement. Accordingly, forward-looking statements should not be relied on as a prediction of actual results.
15

7/22/2019 Carlsberg Breweries Annual Report 2012
http://slidepdf.com/reader/full/carlsberg-breweries-annual-report-2012 16/152
Carlsberg Breweries Group
Consolidated financial statements 2012
Income statement
Statement of comprehensive income
Statement of financial position
Statement of changes in equity
Statement of cash flows
Notes to the consolidated financial statements
1 Significant accounting estimates and judgements
2 Segment information
3 Cost of sales
4 Sales and distribution expenses
5 Fees to auditors appointed at the Annual General Meeting
6 Other operating income and expenses
7 Special items
8 Financial income and financial expenses
9 Corporation tax
10 Non-controlling interests
11 Earnings per share
12 Staff costs and remuneration of the Supervisory Board and the Executive Board
13 Share-based payment14 Intangible assets
15 Impairment test
16 Property, plant and equipment
17 Associates
18 Securities
19 Receivables
20 Inventories
21 Cash and cash equivalents
22 Assets held for sale and associated liabilities
23 Share capital
24 Borrowings
25 Retirement benefit obligations and similar obligations
26 Deferred tax assets and deferred tax liabilities
27 Provisions
28 Other l iabil it ies etc.
29 Cash flows
30 Acquisition and disposal of entities
31 Acquisition and disposal of non-controlling interests
32 Specification of invested capital
33 Specification of net interest-bearing debt
34 Investments in proportionally consolidated entities
35 Financial risks
36 Financial instruments
37 Related party disclosures
38 Contingent liabilities and other commitments
39 Operating lease liabilities
40 Events after the reporting period
41 Parent company
41 Accounting policies
42 Group companies
16

7/22/2019 Carlsberg Breweries Annual Report 2012
http://slidepdf.com/reader/full/carlsberg-breweries-annual-report-2012 17/152
Carlsberg Breweries Group
Income statement
DKK million Note 2012 2011
Revenue 93,100 86,555
Excise duties on beer and soft drinks etc. -25,899 -22,994
Net revenue 67,201 63,561
Cost of sales 3 -33,831 -31,788
Gross profit 33,370 31,773
Sales and distribution expenses 4 -19,645 -18,483
Administrative expenses 5 -4,174 -3,944
Other operating income 6 538 575
Other operating expenses 6 -292 -218
Share of profit after tax, associates 17 112 174
Operating profit before special items 9,909 9,877
Special items, net 7 -1,812 605Financial income 8 918 634
Financial expenses 8 -2,653 -2,542
Profit before tax 6,362 8,574
Corporation tax 9 -1,529 -2,156
Consolidated profit 4,833 6,418
Attributable to:
Non-controlling interests 10 638 543
Shareholders in Carlsberg Breweries A/S 4,195 5,875
DKK Note 2012 2011
Earnings per share 11
Basic earnings per share 8,373 11,727
Diluted earnings per share 8,373 11,727
17

7/22/2019 Carlsberg Breweries Annual Report 2012
http://slidepdf.com/reader/full/carlsberg-breweries-annual-report-2012 18/152
Carlsberg Breweries Group
Statement of comprehensive income
DKK million Note 2012 2011
Profit for the year 4,833 6,418
Other comprehensive income:
Foreign exchange adjustments of foreign entities 8 1,904 -1,839
Value adjustments of hedging instruments 8, 35, 36 111 -52
Retirement benefit obligations 25 -739 -1,081
Share of other comprehensive income in associates 17 4 3
Effect of hyperinflation 8 75 175
Other -2 -12
Corporation tax 9 87 321
Other comprehensive income 1,440 -2,485
Total comprehensive income 6,273 3,933
Attributable to:
Non-controlling interests 582 639
Shareholders in Carlsberg Breweries A/S 5,691 3,294
Foreign exchange adjustments arise on the translation of the financial statements of foreign entities with afunctional currency other than the Group’s presentation currency, foreign exchange adjustments of assetsand liabilities which constitute part of the Group’s net investment in a foreign entity and foreign exchangeadjustments of hedging transactions related to the Group’s net investment in a foreign entity.
Value adjustments of hedging instruments comprise changes in the fair value of hedging transactions thatqualify for recognition as cash flow hedges and for which the hedged transaction has not yet been realisedand hedging transactions related to the Group’s net investment in foreign entities.
18
7/22/2019 Carlsberg Breweries Annual Report 2012
http://slidepdf.com/reader/full/carlsberg-breweries-annual-report-2012 19/152

7/22/2019 Carlsberg Breweries Annual Report 2012
http://slidepdf.com/reader/full/carlsberg-breweries-annual-report-2012 20/152
Carlsberg Breweries Group
Statement of financial position
Equity and liabilities
DKK million Note 31. Dec 2012 31. Dec 2011
Equity:
Share capital 23 501 501
Reserves -6,368 -8,632
Retained earnings 65,396 63,703
Equity, shareholders in Carlsberg Breweries A/S 59,529 55,572
Non-controlling interests 3,389 5,763
Total equity 62,918 61,335
Non-current liabilities:
Borrowings 24 36,479 34,137
Retirement benefit obligations and similar obligations 25 3,917 3,218 Deferred tax liabilities 26 8,930 8,870
Provisions 27 1,097 965
Other liabilities 28 1,201 1,087
Total non-current liabilities 51,624 48,277
Current liabilities:
Borrowings 24 3,352 2,591
Trade payables 11,906 11,039
Deposits on returnable packaging 1,381 1,291
Provisions 27 574 503
Corporation tax 551 533 Other liabilities, etc. 28 9,624 10,570
Total current liabilities 27,388 26,527
Liabilities associated with assets held for sale 22 18 56
Total liabilities 79,030 74,860
Total equity and liabilities 141,948 136,195
20

7/22/2019 Carlsberg Breweries Annual Report 2012
http://slidepdf.com/reader/full/carlsberg-breweries-annual-report-2012 21/152
Carlsberg Breweries Group
Statement of changes in equity
2012
DKK million
Share
capital
Currency
translation
Hedging
reserves
Available-
for-sale-
investments
Total
reserves
Retained
earnings
Equity,
shareholders
in Carlsberg
Breweries
A/S
Non-
controlling
interests
Total
equity
Equity at 1 January 2012 501 -7,622 -1,134 124 -8,632 63,703 55,572 5,763 61,335
Profit for the period - - - - - 4,195 4,195 638 4,833
Other comprehensive income:
Foreign exchange adjustments of foreign entities - 1,952 - - 1,952 - 1,952 -48 1,904
Value adjustments of hedging instruments - -216 327 - 111 - 111 - 111
Retirement benefit obligations - - - - - -727 -727 -12 -739
Share of other comprehensive income in associates - - - - - 4 4 - 4
- 71 - - 71 - 71 4 75
Other - - - - - -2 -2 - -2
Corporation tax - 56 74 - 130 -43 87 - 87
Other comprehensive income - 1,863 401 - 2,264 -768 1,496 -56 1,440
- 1,863 401 - 2,264 3,427 5,691 582 6,273
Refund to parent company for exercise of share options - - - - - -33 -33 - -33
Change in expected fu ture refunds for exerc ise of share options - - - - - 148 148 - 148
Share-based payment - - - - - 48 48 - 48
Dividends paid to shareholders - - - - - - - -282 -282
Acquisition of non-controlling interests - - - - - -1,897 -1,897 -2,674 -4,571
Total changes in equity - 1,863 401 - 2,264 1,693 3,957 -2,374 1,583
Equity at 31 December 2012 501 -5,759 -733 124 -6,368 65,396 59,529 3,389 62,918
DKK million
Share
capital
Currency
translation
Hedging
reserves
Available-
for-sale-
investments
Total
reserves
Retained
earnings
Equity,
shareholders
in Carlsberg
Breweries
A/S
Non-
controlling
interests
Total
equity
Equity at 1 January 2011 501 -5,943 -1,099 124 -6,918 58,961 52,544 5,381 57,925
Profit for the period - - - - - 5,875 5,875 543 6,418
Other comprehensive income:
Foreign exchange adjustments of foreign entities - -1,941 - - -1,941 - -1,941 102 -1,839
Value adjustments of securities - -20 -32 - -52 -52 - -52
Retirement benefit obligations - - - - - -1,067 -1,067 -14 -1,081
Share of other comprehensive income in associates - - - - - 3 3 - 3
- 166 - - 166 - 166 9 175
Other - - - - - -11 -11 -1 -12
Corporation tax - 116 -3 - 113 208 321 - 321
Other comprehensive income - -1,679 -35 - -1,714 -867 -2,581 96 -2,485
- -1,679 -35 - -1,714 5,008 3,294 639 3,933
Refund to parent company for exercise of share options - - - - - -39 -39 - -39
Change in expected fu ture refunds for exerc ise of share options - - - - - -78 -78 - -78
Share-based payment - - - - - -5 -5 - -5
Share buy-back - - - - - - - -417 -417
Dividends paid to shareholders - - - - - - - -121 -121
Acquisition of non-controlling interests - - - - - -176 -176 -1,353 -1,529
- - - - - 32 32 2 34
Acquisition of entities - - - - - - - 1,632 1,632
Total changes in equity - -1,679 -35 - -1,714 4,742 3,028 382 3,410
Equity at 31 December 2011 501 -7,622 -1,134 124 -8,632 63,703 55,572 5,763 61,335
Currency translation comprises accumulated foreign exchange adjustments arising on the translation of the financial statements of foreign entities with a functional currency other than the
Group’s presentation currency, foreign exchange adjustments of assets and liabilities which constitute part of the Group’s net investment in a foreign entity and foreign exchange
adjustments of hedging transactions related to the Group’s net investment in foreign entities.
Total comprehensive income for the year
The proposed dividend of DKK 1,827 per share, in total DKK 915m (2011: DKK 0.00 per share, in total DKK 0m), is included in retained earnings at 31 December
2012. No dividends are paid out in 2012 for 2011 (paid out in 2011 for 2010: No dividend). Dividends paid out to shareholders of Carlsberg Breweries A/Sdo not impact taxable income in
Carlsberg Breweries A/S.
Shareholders in Carlsberg Breweries A/S
Total comprehensive income for the year
2011
Effect of hyperinflation
Effect of hyperinflation
Effect of hyperinflation
Shareholders in Carlsberg Breweries A/S
21

7/22/2019 Carlsberg Breweries Annual Report 2012
http://slidepdf.com/reader/full/carlsberg-breweries-annual-report-2012 22/152
Carlsberg Breweries Group
Statement of cash flows
DKK million Note 2012 2011
Operating profit before special items 9,909 9,877
Adjustment for depreciation and amortisation 3,980 3,762
Adjustment for impairment losses1 28 4
Operating profit before depreciation, amortisation and impairment losses 13,917 13,643
Adjustment for other non-cash items 29 323 382
Change in trade working capital 29 865 361
Change in other working capital 29 -505 -466
Restructuring costs paid -324 -441
Interest etc. received 378 209
Interest etc. paid -2,251 -2,258
Corporation tax paid -2,265 -1,641
Cash flow from operating activities 10,138 9,789
Acquisition of property, plant and equipment and intangible assets -5,061 -4,320
Disposal of property, plant and equipment and intangible assets 440 276
Change in trade loans 29 -447 -518
Total operational investments -5,068 -4,562
Free operating cash flow 5,070 5,227
Acquisition and disposal of entities, net 30 -27 -260
Acquisitions of associates -825 -75
Disposals of associates 3 15
Acquisition of financial assets -38 -9
Disposal of financial assets 21 7
Change in financial receivables 29 -28 -46
Dividends received 96 54
Total financial investments -798 -314
Disposal of other property, plant and equipment -22 -
Total other activities2
-22 -
Cash flow from investing activities -5,888 -4,876
Free cash flow 4,250 4,913
Non-controlling interests 29 -5,198 -1,876
External financing 29 3,263 -2,781
Cash flow from financing activities -1,935 -4,657
Net cash flow 2,315 256
Cash and cash equivalents at 1 January3
2,798 2,546
Foreign exchange adjustment of cash and cash equivalents -65 -4
Cash and cash equivalents at 31 December 3
21 5,048 2,798
1 Impairment losses excluding those reported in special items.
2 Other activities cover real estate and assets under construction, separate from beverage activities.
3 Cash and cash equivalents less bank overdrafts.
22

7/22/2019 Carlsberg Breweries Annual Report 2012
http://slidepdf.com/reader/full/carlsberg-breweries-annual-report-2012 23/152
In preparing the Carlsberg Breweries Group’s consolidated financial statements, management makesvarious accounting estimates, judgements and assumptions which form the basis of presentation,recognition and measurement of the Group’s assets and liabilities. The most significant accounting estimatesand judgements are performed in relation to the accounting treatment of:• Business combinations • Impairment testing • Useful lives and residual values for intangible assets with finite useful life and property, plant andequipment• Restructurings • Deferred tax assets
• Receivables • Retirement benefit obligations and similar obligations • Provisions and contingencies
The Group’s accounting policies are described in detail in note 41 to the consolidated financial statements.
Estimation uncertainty
Determining the carrying amount of some assets and liabilities requires judgements, estimates andassumptions concerning future events.
The judgements, estimates and assumptions made are based on historical experience and other factorswhich management assesses to be reliable, but which, by their very nature, are associated with uncertainty
and unpredictability. These assumptions may prove incomplete or incorrect, and unexpected events orcircumstances may arise.
The slow recovery of most European economies continues causes a challenging consumer environment.The consumption in some markets, including Denmark, France and Russia, has been significantly impactedby excise duty increases in recent years and this will also be the case for 2013. The impact on businessdevelopment and the 2012 financials is described in the Management review, especially the sectionsdescribing the segment developments.
Estimates in the consolidated financial statements for 2012 have been prepared taking the recovery in theeconomic and financial markets into consideration, but still ensuring that one-off effects, which are notexpected to exist in the long term, do not affect estimation and determination of factors, including discountrates and expectations of the future.
The assessment of the value of assets, including breweries, brands and goodwill, should be viewed with thelong-term perspective of the investment in mind.
The Group is also subject to risks and uncertainties which may lead to actual results differing from theseestimates, both positively and negatively. Specific risks for the Group are discussed in the relevant sectionsof the Management review and in the notes.
Assumptions about the future and estimation of uncertainty at the end of the reporting period are describedin the notes when a significant risk of changes could result in material adjustments to the carrying amount ofassets or liabilities within the next financial year.
Business combinations
Carlsberg Breweries Group
Note
1 Significant accounting estimates and judgements
23

7/22/2019 Carlsberg Breweries Annual Report 2012
http://slidepdf.com/reader/full/carlsberg-breweries-annual-report-2012 24/152
Purchase pr ice al locat ion. For acquisitions of new entities, the assets, liabilities and contingent liabilities ofthe acquiree are recognised using the acquisition method. The most significant assets acquired generallycomprise goodwill, trademarks, non-current assets, receivables and inventories. No active market exists forthe majority of the acquired assets and liabilities, in particular in respect of acquired intangible assets. Accordingly, management makes estimates of the fair value of acquired assets, liabilities and contingent
liabilities. Depending on the nature of the item, the determined fair value of an item may be associated withuncertainty and possibly adjusted subsequently.
The unallocated purchase price (positive amount) is recognised in the statement of financial position asgoodwill, which is allocated to the Group’s cash-generating units. Management makes estimates of theacquired cash-generating units, the cash-generating units that already existed in the Group and theallocation of goodwill. The allocation of goodwill is based on the expected future cash flows for each activity.In each business combination, management decides whether or not to recognise goodwill related to non-controlling interests. If such goodwill is recognised, it is estimated based on the fair value of the non-controlling interests less the non-controlling interests’ share of the fair value of acquired assets, liabilities andcontingent liabilities. The fair value of the non-controlling interests is estimated based on the net presentvalue of expected future cash flows from the entity, the cost of newly acquired shareholdings in the entityexcluding a control premium paid, and other fair value models as applicable for the transaction.
In a step acquisition, the Group gains control of an entity in which the Group already holds a shareholdingimmediately before the step acquisition. In 2011 the Group gained control of Lao Brewery, Laos, and HueBrewery, Vietnam, through step acquisitions. The purchase price allocation of these transactions wascompleted during 2012.
Management estimates the total fair value of the shareholding in the entity held immediately after thecompletion of the step acquisition. The estimated total fair value is accounted for as the cost of the totalshareholding in the entity. The shareholding held immediately before the step acquisition is re-measured atfair value at the acquisition date. The resulting gain or loss is recognised in the income statement underspecial items. The fair value of the shareholding held immediately before the step acquisition is calculated asthe estimated total fair value less the fair value of consideration paid for the shareholdings acquired in thestep acquisition and the fair value of non-controlling interests.
The total fair value is based on various valuation methods, including the net present value of expected futurecash flows from the entity, the cost of newly acquired shareholdings in the entity including a control premiumpaid and other fair value models as applicable for the transaction, e.g. multiples.
The net present value of expected future cash flows (value in use) is based on budgets and business plansfor the next three years and projections for subsequent years as well as management’s expectations for thefuture development following the gain of control of the business. Key parameters are revenue growth,operating margin, future capital expenditure and growth expectations beyond the next three years. Budgetsand business plans for the next three years are based on concrete commercial initiatives. Projectionsbeyond the next three years are based on general expectations and risks. As the risk on cash flows is notincluded in the expected cash flows for newly acquired entities, the expected future cash flows arediscounted using a WACC rate, cf. the description below.
Management believes that the purchase price accounted for in the consolidated financial statements reflectsthe best estimate of the total fair value of the business and the fair value of the non-controlling interests, andhence the allocation of goodwill to controlling and non-controlling interests.
Trademarks. The value of the trademarks acquired and their expected useful lives are assessed based onthe trademarks’ market position, expected long-term developments in the relevant markets and thetrademarks’ profitability. The estimated value of acquired trademarks includes all future cash flowsassociated with the trademarks, including the value of customer relations etc. related to the trademarks. Formost entities acquired there is a close relationship between trademarks and sales. The consumers’ demand for beer and other beverages drives sales, and therefore the value of the brand is closely linked to consumerdemands, while there is no separate value attached to customers (shops, bars etc.) as their choice ofproducts is driven by consumer demand.
24

7/22/2019 Carlsberg Breweries Annual Report 2012
http://slidepdf.com/reader/full/carlsberg-breweries-annual-report-2012 25/152
When the value of a well-established trademark is expected to be maintained for an indefinite period in therelevant markets, and these markets are expected to be profitable for a long period, the useful life of thetrademark is determined to be indefinite. In the opinion of management, there is usually only a minimal riskof the current situation in the markets reducing the useful life of trademarks, primarily due to the respectivemarket share in each market and the current and planned marketing efforts, which are helping to maintain
and increase the value of these trademarks.
For each trademark or group of trademarks, measurement is based on the relief from royalty method underwhich the value is calculated based on expected future cash flows for the trademarks on the basis of keyassumptions about expected useful life, royalty rate and growth rate and a theoretically calculated tax effect. A post-tax discount rate is used which reflects the risk-free interest rate with the addition of a risk premiumassociated with the particular trademark.
The estimates of the expected useful life of each trademark are based on its relative local, regional andglobal market strength. This assessment will also influence the estimate of the expected future royalty ratethat may be obtained for each trademark in a royalty agreement entered into with a third party on marketterms for each of the markets.
Customer agreements and port fo l ios. In business combinations, the value of acquired customeragreements and customer portfolios is assessed based on the local market and trading conditions. Therelationship between trademarks and customers is carefully considered so that trademarks and customeragreements are not both recognised on the basis of the same underlying cash flows. Usually there is aparticularly close relationship between trademark and sales, and no separate value for customer relationswill be recognised in these cases, as these relations are closely associated with the value of the acquiredtrademarks.
Fair value of prop erty, plant and equipm ent. In business combinations, the fair value of land and buildings,standard production and office equipment is based, as far as possible, on the fair value of assets of similartype and condition that may be bought and sold in the open market.
Property, plant and equipment for which there is no reliable evidence in the market of the fair value (in
particular breweries, including production equipment) are valued using the depreciated replacement costmethod. This method is based on the replacement cost of a similar asset with similar functionality andcapacity. The calculated replacement cost for each asset is then reduced to reflect functional and physicalobsolescence.
The expected synergies and the user-specific intentions for the expected use of assets are not included inthe determination of the fair value.
Impairment testing
Goodwi l l . In performing the annual impairment test of goodwill, an assessment is made as to whether theindividual units of the entity (cash-generating units) to which goodwill is allocated will be able to generatesufficient positive net cash flows in the future to support the value of goodwill and other net assets of the
entity.
The cash-generating units are determined based on the Group structure, linkage of the cash flows betweenentities and the individual entities’ integration in regions or sub-regions. The structure and cash-generatingunits are reassessed each year.
The estimates of future free cash flows (value in use) are based on budgets and business plans for the nextthree years and projections for subsequent years. Key parameters are revenue growth, operating margin,future capital expenditure and growth expectations beyond the next three years. Budgets and business plansfor the next three years are based on concrete commercial initiatives. Projections beyond the next threeyears are based on general expectations and risks.
The cash flows used incorporate the effect of relevant future risks. Accordingly these risks are not
incorporated in the discount rates used. Potential upsides and downsides identified during the budget
25

7/22/2019 Carlsberg Breweries Annual Report 2012
http://slidepdf.com/reader/full/carlsberg-breweries-annual-report-2012 26/152
process and in the daily business are reflected in scenarios for possible future cash flows for each individualcash-generating unit. The scenarios reflect, among other things, factors such as assumptions on market,price and input cost developments. Budgets and business plans do not incorporate the effect of futurerestructurings and non-contracted capacity increases.
Pre-tax discount rates which reflect the risk-free borrowing interest rate in each particular geographical areafor the cash-generating units are used to calculate recoverable amounts.
Trademarks. Management performs an annual impairment test of trademarks with an indefinite life and anassessment of whether the current market situation in the relevant market has reduced the value oftrademarks with a finite useful life. Management also assesses trademarks for changes in their useful lives.When there is an indication of a reduction in the value or useful life, the trademark is tested for impairmentand is written down if necessary or the amortisation period is reassessed and if necessary, adjusted in linewith the trademark’s changed useful life. The impairment test of trademarks is based on the same approachused to determine the fair value at the acquisition date in business combinations.
Estimates of future earnings from trademarks are made using the same approach used to measuretrademarks in business combinations, cf. above. Assessment of indications of impairment of trademarks with
indefinite useful lives is based on the Group’s total royalty income for each trademark.
The impairment test of trademarks resulted in an impairment loss of DKK 11m in 2012 (2011: DKK 450m)related to a trademark having difficult market conditions and poor performance.
The useful life of trademarks is assessed yearly, especially in relation to trademarks which have beenimpaired.
The discount rate is an after-tax WACC calculated country by country based on long-term expectations foreach trademark.
For a description of impairment testing for intangible assets, see note 15.
Property, plant and equipment. Property, plant and equipment are impairment-tested when there areindications of impairment. Management performs an annual assessment of the assets’ future application, e.g. in relation to changes in production structure, restructurings or closing of breweries. The impairment test isbased on budgeted and estimated cash flows from the cash-generating unit. The assessment is based onthe lowest cash-generating unit affected by the changes that indicate impairment. The pre-tax discount ratereflects the risk-free interest rate with the addition of a risk premium associated with the particular asset.
For a description of impairment testing for property, plant and equipment, see note 15.
Associates. Management performs an impairment test of investments in associates when there areindications of impairment, e.g. due to loss-making activities or major changes in the business environment.The impairment test is based on budgeted and estimated cash flows from the associate and related assetswhich form an integrated cash-generating unit. The pre-tax discount rate reflects the risk-free interest rate
with the addition of a risk premium associated with the particular investments.
Discount and growth rates appl ied for 2012. The risk-free interest rates used in impairment testsperformed at year-end 2012 were based on observed market data. For countries where long-term risk-freeinterest rates are not observable or valid due to specific national or macroeconomic changes affecting thecountry, the interest rate is estimated based on observations from other markets and/or long-termexpectations expressed by major international credit institutions.
The risk premium for the risk-free interest rate (spread) was fixed at market price or slightly lower than thecurrent market level, which is comparable to the market level. The total interest rate, including spread,thereby reflected the long-term interest rate applicable to the Group’s investments in the individual markets.
For each country the applied growth rates for projections and discount rates were compared to ensure a
reasonable link between the two (real interest rate).
26

7/22/2019 Carlsberg Breweries Annual Report 2012
http://slidepdf.com/reader/full/carlsberg-breweries-annual-report-2012 27/152
Useful lives and residual values for intangible assets with finite useful life and property, plant andequipment. Intangible assets with finite useful life and property, plant and equipment are measured at costless accumulated amortisation, depreciation and impairment losses. Amortisation and depreciation arerecognised on a straight-line basis over the expected useful lives, taking into account any residual value. The
expected useful lives and residual values are determined based on past experience and expectations of thefuture use of the assets. Reassessment of the expected future use is as a minimum made in connection withan evaluation of changes in production structure, restructuring and brewery closures. The expected futureuse and residual values may not be realised, which will require reassessment of useful lives and residualvalues and recognition of impairment losses or losses on disposal of non-current assets. The amortisationand depreciation periods used are described in the accounting policies in note 41 and the value of non-current assets is specified in notes 14 and 16.
For operating equipment in the on-trade, a physical inspection of assets is carried out and the continuing useevaluated in order to assess any indications of impairment.
Restructurings. In connection with restructurings, management reassesses useful lives and residual valuesfor non-current assets used in the entity undergoing restructuring. The extent and amount of onerous
contracts as well as employee and other obligations arising in connection with the restructuring are alsoestimated.
Deferred tax assets. The Group recognises deferred tax assets, including the expected tax value of tax losscarryforwards if management assesses that these tax assets can be offset against positive taxable income inthe foreseeable future. This judgement is made annually and based on budgets and business plans for thecoming years, including planned commercial initiatives.
Receivables. Receivables are measured at amortised cost less impairment.
Write-downs are made for bad debt losses due to inability to pay. If the ability to pay deteriorates in thefuture, further write-downs may be necessary. Management performs analyses on the basis of customers’expected ability to pay, historical information on payment patterns, doubtful debts, customer concentrations,
customers’ creditworthiness, including the impact of the economic downturn on the markets in general aswell as on the individual customer, collateral received and the financial situation in the Group’s saleschannels.
With regard to loans to the on-trade, the individual Group companies manage and control these loans as wellas standard trade credits in accordance with Group guidelines.
Derecognition of groups of receivables, e.g. in business combinations or other structured transactions, isbased on management’s judgement of contractual terms and other factors related to the transaction.
Write-downs made are expected to be sufficient to cover losses. The financial uncertainty associated withwrite-downs for bad debt losses is usually considered to be limited. As a result of the international economiccrisis, the risk of bad debt losses has increased. This has been taken into consideration in the assessment of
impairment at the end of the reporting period and in the general management and monitoring of usual tradecredits and loans to the on-trade.
Retirement benefit obligations and similar obligations. When calculating the value of the Group’s definedbenefit plans, a number of significant actuarial assumptions are made, including discount rates, expectedreturn on plan assets, expected growth in wages and salaries, mortality and retirement benefits. The rangeand weighted average for these assumptions are disclosed in note 25.
The value of the Group’s defined benefit plans is based on valuations from external actuaries.
Provisions and contingencies. Management assesses provisions, contingent assets and contingentliabilities and the likely outcome of pending or probable lawsuits etc. on an ongoing basis. The outcomedepends on future events, which are by nature uncertain. In assessing the likely outcome of lawsuits and tax
disputes etc., management bases its assessment on external legal assistance and established precedents.
27

7/22/2019 Carlsberg Breweries Annual Report 2012
http://slidepdf.com/reader/full/carlsberg-breweries-annual-report-2012 28/152
In connection with large restructurings, management assesses the timing of costs to be incurred, whichinfluences the classification as current or non-current liabilities respectively. Provision for losses on onerousprocurement contracts is based on agreed terms with the supplier and expected fulfilment of the contractbased on the current estimate of volumes and use of raw materials. Warranty provisions are based on thesubstance of the agreements entered into, including the guarantees issued covering customers in the on-
trade. Provisions are disclosed in note 27 and contingent liabilities in note 38.
Assessment in applied accounting policies
In applying the Group’s accounting policies, management makes judgements which may significantlyinfluence the amounts recognised in the consolidated financial statements. Such judgements are performedin relation to the accounting treatment of:
• Business combinations • Financial instruments • Revenue • Loans to the on-trade• Special items
• Inventories• Deposit liabilities • Leases and service contracts
Business combinations. When accounting for business combinations, new cooperation agreements andchanges in shareholder agreements, judgement is made concerning the classification of the acquired entityas a subsidiary, joint venture or associate. This judgement is made on the basis of the agreements enteredinto on the acquisition of ownership interests or voting rights in the entity and on the basis of shareholderagreements etc. stipulating the actual level of influence over the entity.
This classification is significant as the recognition of proportionally consolidated joint ventures impacts thefinancial statements differently from full consolidation of subsidiaries or recognition of associates using theequity method. The amendment to IFRS preventing the use of proportional consolidation will have an impact
on the consolidated financial statements as of 1 January 2014 which is not material to the Group. Key figuresfor proportionally consolidated entities are disclosed in note 34.
Financial instruments. When entering into financial instruments, management assesses whether theinstrument is an effective hedge of recognised assets and liabilities, expected future cash flows or financialinvestments. The effectiveness of recognised hedge instruments is assessed at least quarterly. Anyineffectiveness is recognised in the income statement.
Revenue recognition. Revenue from the sale of finished goods and goods for resale is recognised whenthe risk has been transferred to the buyer. Revenue is measured excluding discounts, VAT and duties(including excise duties on beer and soft drinks).
Management assesses the local rules on the imposition of duties for the purpose of classification either as
sales-related duties, which are deducted from revenue, or as part of cost of sales. Customer discounts arerecognised in the same period as the sales to which they relate. Customer discounts are deducted fromrevenue.
Customer discounts based on accumulated sales volumes over a period of time are calculated on the basisof expected total sales based on experience from previous sales, sales up to that date and other currentinformation about trading with the customer. These calculations are performed by management incooperation with sales managers.
Loans to the on-trade. Under certain circumstances the Group grants loans to on-trade customers in some
markets. The agreements are typically complex and cover several aspects of the relationship between theparties. Management assesses the recognition and classification of income and expenses for each of theseagreements, including the allocation of revenue from the loan between income, customer discounts and
other operating income. Management also assesses whether developments of importance to the on-trade
28
7/22/2019 Carlsberg Breweries Annual Report 2012
http://slidepdf.com/reader/full/carlsberg-breweries-annual-report-2012 29/152
could indicate impairment of on-trade loans in a market in general. Such developments also include changesin local legislation, which may have an adverse effect on the earnings in the industry as a whole and wherethe effect cannot be allocated to individual loans.
Special items. The use of special items entails management judgement in the separation from other items
in the income statement, cf. the accounting policies. Special items constitute items of income and expenseswhich cannot be attributed directly to the Group’s ordinary operating activities but concern fundamentalstructural or process-related changes in the Group and any associated gains or losses on disposal.Management carefully considers such changes in order to ensure the correct distinction between theGroup’s operating activities and restructuring of the Group carried out to enhance the Group’s futureearnings potential.
Special items also include other significant non-recurring items, such as impairment of goodwill andtrademarks, gains and losses on the disposal of activities, revaluation of shareholdings in an entity heldimmediately before a step acquisition of that entity and transaction cost in a business combination.
Inventories. The cost of finished goods and work in progress comprises the cost of raw materials,consumables, direct labour and indirect production overheads. Indirect production overheads comprise
indirect supplies, wages and salaries as well as maintenance and depreciation of the machinery, plant andequipment used for production and costs of plant administration and management. Entities in the Groupwhich use standard costs in the measurement of inventories review these costs at least once a year. Thestandard cost is also revised if it deviates by more than 5% from the actual cost of the individual product.
Indirect production overheads are calculated on the basis of relevant assumptions as to capacity utilisation,production time and other factors pertaining to the individual product.
The net realisable value of inventories is calculated as the selling price less costs of completion and costsnecessary to make the sale and is determined taking into account marketability, obsolescence anddevelopments in expected selling price. The calculation of net realisable value is mainly relevant to packingmaterials, packaging and spare parts. Net realisable value is normally not calculated for beer and soft drinksbecause their limited shelf-life means that slow-moving goods must be scrapped instead. Following the
economic downturn, the individual entities in the Group have paid special attention to inventory turnover andthe remaining shelf-life when determining net realisable value and scrapping.
Deposit liabilities. In a number of countries, the local entities have a legal or constructive obligation to buyback returnable packaging from the market. When invoicing customers, a deposit is added to the sales priceand the entity recognises a deposit liability. The deposit is paid out on return of bottles. The deposit liabilityprovided for is estimated based on movements during the year in recognised deposit liabilities and onhistorical information about return rates and loss of bottles in the market.
Leases and service contracts. The Group has entered into a number of leases and service contracts.When entering into these agreements, management considers the substance of the service being renderedin order to classify the agreement as either a lease or a service contract. In making this judgement, particularimportance is attached to whether fulfilment of the agreement depends on the use of specific assets. The
Group’s leases and significant service contracts are disclosed in notes 38 and 39.
For leases an assessment is made as to whether the lease is a finance lease or an operating lease. TheGroup has mainly entered into operating leases for standardised assets with a short duration relative to thelife of the assets and accordingly the leases are classified as operating leases.
29

7/22/2019 Carlsberg Breweries Annual Report 2012
http://slidepdf.com/reader/full/carlsberg-breweries-annual-report-2012 30/152
Carlsberg Breweries Group
Note
2 Segment information
2012
DKK million
Western
Europe
Eastern
Europe Asia
Not
allocated
Carlsberg
Breweries
Group, total
Income statement:
Net revenue 37,672 20,222 9,114 193 67,201
Intra-segment revenue 55 14 - -69 -
Total net revenue 37,727 20,236 9,114 124 67,201
4 4 104 - 112
5,121 4,302 1,685 -1,199 9,909
Special items, net -1,812
Financial items, net -1,735
Profit before tax 6,362
Corporation tax -1,529
Consolidated profit 4,833
Operating margin 13.6% 21.3% 18.5% 14.7%
Other segment items:
52,061 77,698 21,818 -9,629 141,948
27 - - - 27
Invested capital, cf. note 32 28,002 67,194 17,075 -3,175 109,096
2,114 1,233 1,339 374 5,060
Depreciation and amortisation 1,835 1,582 508 55 3,980
Impairment losses 316 679 - - 995
Not allocated operating profit before special items, DKK -1,199m, consists of DKK -1,217m from other companies and activities and
DKK 18m from eliminations.
Total assets
Not allocated net revenue, DKK 124m, consists of DKK 7,641m net revenue from other companies and activities and DKK 7,517m
from eliminations of sales between these other companies and the segments.
Not allocated total assets, DKK -9,629m, comprise entities that are not business segments and eliminations of investments in
subsidiaries, receivables, loans etc.
Assets held for sale
The Group’s activities are segmented on the basis of geographical regions in accordance with the management reporting structure for
2012.
For segment reporting purposes, the Chief Operating Decision Maker is the Executive Committee. The Executive Committee manages
and makes business decisions based on geographical segments. Segments are managed and decisions are made based on business
performance measured as operating profit before special items. Decisions on intra-Group sale of trademarks
and activities, financing and tax planning are made based on information for the Group as a whole and therefore not segmented. The
“Not allocated” segment relates mainly to headquarters functions which consist of management fees, royalty charges, centralmarketing, sponsorships, receivables etc. and of eliminations. Intra-segment revenue is based on arm’s length prices.
The non-beverage activities are managed separately and therefore also shown separately. The segmentation reflects the structure
used for internal reporting and monitoring of the strategic and financial targets of the Group.
Non-current segment assets comprise intangible assets and property, plant and equipment used directly in the operating activities of
the segment. Current segment assets are allocated to the segments to the extent that they can be allocated directly to the individual
segment, including inventories, trade receivables, other receivables and prepayments. Allocated goodwill and trademarks by segment
are specified in note 15.
Acquisition of property, plant and equipment and intangibleassets
A segment’s operating profit/loss before special items includes revenue, operating costs and share of profit/loss in associates to the
extent that they can be allocated directly to the individual segment. Income and expenses related to Group functions have not been
allocated and, as is the case with eliminations and non-brewing activities, are not included in the operating profit/loss before special
items of the segments.
Share of profit after tax, associates
Operating profit before special items
30

7/22/2019 Carlsberg Breweries Annual Report 2012
http://slidepdf.com/reader/full/carlsberg-breweries-annual-report-2012 31/152
Carlsberg Breweries Group
Note
2 Segment information
2011
DKK Million
Western
Europe
Eastern
Europe Asia
Not
allocated
Carlsberg
Breweries
Group, total
Income statement:
Net revenue 36,840 19,702 6,838 181 63,561
Intra-segment revenue 39 17 - -56 -
Total net revenue 36,879 19,719 6,838 125 63,561
42 5 127 - 174
5,419 4,286 1,286 -1,114 9,877
Special items, net 605
Financial items, net -1,908
Profit before tax 8,574
Corporation tax -2,156
Consolidated profit 6,418
Operating margin 14.7% 21.7% 18.8% 15.5%
Other segment items:
52,113 76,703 20,388 -13,009 136,195
235 - - - 235
Invested capital, cf. note 32 27,754 65,285 15,631 -2,678 105,992
1,946 1,153 889 332 4,320
Depreciation and amortisation 1,884 1,467 356 55 3,762
Impairment losses 379 750 - 250 1,379
Information on geographical allocation of net revenue and non-current assets
2012 2011 2012 2011
Denmark (Carlsberg Breweries A/S's domicile) 4,572 4,722 2,053 2,086
Russia 16,520 16,070 62,397 60,945
Other countries 46,109 42,769 53,987 51,628
Total 67,201 63,561 118,437 114,659
Non-current assets comprise non-current assets other than financial instruments, deferred tax assets and retirement benefit plan assets.
Information about major customersThe Carlsberg Breweries Group does not have customers that account for more than 10% of the Group's net revenue.
The geographical allocation is made on the basis of the selling countries’ domicile and comprises countries each accounting for morethan 10% of the Group’s consolidated net revenue as well as that of the domicile country.
Acquisition of property, plant and equipment and intangible
assets
Assets held for sale
Share of profit after tax, associates
Operating profit before special items
Not allocated total assets, DKK -13,009m, comprise entities that are not business segments and eliminations of investments in
subsidiaries, receivables, loans etc.
Net revenue Non-current assets
Not allocated operating profit before special items, DKK -1,114m, consists of DKK -1,169m from other companies and activities and
DKK 55m from eliminations.
Not allocated net revenue, DKK 125m, consists of DKK 6,433m net revenue from other companies and activities and DKK 6,308m
from eliminations of sales between these other companies and the segments.
Total assets
31

7/22/2019 Carlsberg Breweries Annual Report 2012
http://slidepdf.com/reader/full/carlsberg-breweries-annual-report-2012 32/152
Carlsberg Breweries Group
Note
3 Cost of sales
DKK million 2012 2011
Cost of materials 19,566 18,699Direct staff costs 1,375 1,270
Machinery costs 902 839
Depreciation, amortisation and impairment losses 2,815 2,671
Indirect production overheads 3,682 3,432
Purchased finished goods and other costs 5,491 4,877
Total 33,831 31,788
Of which is staff costs, cf. note 12 2,830 2,652
4 Sales and distribution expenses
DKK million 2012 2011
Marketing expenses 7,009 6,554
Sales expenses 5,277 4,937
Distribution expenses 7,359 6,992
Total 19,645 18,483
Of which is staff costs, cf. note 12 5,068 5,872
5 Fees to auditors appointed at the Annual General Meeting
DKK million 2012 2011
KPMG:Statutory audit 24 26 Assurance engagements - - Tax advisory 3 4 Other services 14 3
Assurance engagements include fees for assurances in relation to opinions to third parties, including fee for assurances inrelation to bond issue. Tax advisory services mainly relate to fees for assistance on Group restructuring projects and general taxconsultancy.
Other services include fee for advice and services in relation to acquisition and disposal of entities, which includes accountingand tax advice and due diligence.
32

7/22/2019 Carlsberg Breweries Annual Report 2012
http://slidepdf.com/reader/full/carlsberg-breweries-annual-report-2012 33/152
Carlsberg Breweries Group
Note
6 Other operating income and expenses
DKK million 2012 2011
Other operating income:157 123
Interest and amortisation of on-trade loans 91 102
Rental income, real estate 42 73
Income from grants and subsidies 28 33
Other 220 244
Total 538 575
Other operating expenses:
-45 -56
Losses and write-downs on on-trade loans -55 -1
Real estate costs -45 -43
Expenses relating to research centres -44 -53
Other -103 -65
Total -292 -218
Of which is staff costs, cf. note 12 -3 -14
Gains on disposal of property, plant and equipment and intangible assets
Loss on disposal of property, plant and equipment and intangible assets within beverage activities
33

7/22/2019 Carlsberg Breweries Annual Report 2012
http://slidepdf.com/reader/full/carlsberg-breweries-annual-report-2012 34/152
Carlsberg Breweries Group
Note
7 Special items
DKK million 2012 2011
Special items, income:
Gain on disposal of entities and adjustment to gain in prior year 107 64
Revaluation gain on step acquisition of entities - 1,300
Other restructuring income etc., other entities - 40
Gain on disposal of subsidiaries - 866
Income total 107 2,270
Special items, cost:
Impairment of trademarks - -450
Impairment and restructuring of Carlsberg Uzbekistan -290 -300
Impairment of Nordic Getränke GmbH, Germany -118 -260
Impairment of the business standardisation project - -250
Impairment of Vena Brewery, production and sales equipment in
connection with restructuring. Baltika Breweries, Russia -589 -
Impairment of other non-current assets -93 -31
Restructuring of Carlsberg Sverige (2011: Impairment of non-current
assets in connection with change of production structure) -76 -47 Restructuring of Ringnes AS, Norway -262 -
Termination benefits and impairment of non-current assets in connection with restructuring
at Carlsberg Deutschland -37 -94
Impairment and res tructuring in relation to op tim isa tion of packaging standardisation in Western Europe - -36
Termination benefits in connection with restructuring in central headquarter functions -10 -70
Restructuring of Leeds Brewery, Carlsberg UK -4 -57
Termination benefits in connection with restructuring of sales force,
logistic and administration, Carlsberg UK - -16
Termination benefits and impairment of non-current assets in connection with new administration structure
at Brasseries Kronenbourg, France -76 -32
Termination benefit etc., Carlsberg Italia -16 -10
Termination benefits etc. in connection with Operational Excellence Programmes -86 -57
Loss on sale of Sorex, France - -86
Provision for onerous malt contracts, including reversal of unused provision from previous year - 150
- -14
-176 -
Other restructuring costs etc., other entities -86 -5
Cost total -1,919 -1,665
Special items, net -1,812 605
Cost of sales -1,366 -857
Sales and distribution expenses -83 -5
Administrative expenses -67 -372
Other operating income - 2,270
Other operating expenses -176 -86
Share of profit after tax in associates -120 -254 -1,812 696
Impairment of goodwill - -91
Special items, net -1,812 605
Special items also include gains on revaluation of shareholdings in associates prior to a step acquisition of the entities.
The impairment and restructuring of Carlsberg Uzbekistan, DKK 290m, Nordic Getränke GmbH, DKK 118m, and Vena Brewery, production and
sales equipment in Russia DKK 589m, are related to non-current assets in the entities due to difficult market conditions, poor performance and profitoutlook.
If special items had been recognised in operating profit before special items, they would have been
included in the following items:
Costs in relation to acquisition of Hue Brewery ltd., Vietnam
Special items, costs, amounted to DKK -1,919m (2011: DKK -1,665m).
Loss on disposal of subsidiary
Special items include significant income and costs of a special nature in terms of the Group’s revenue-generating operating activities, such as the
cost of extensive structuring of processes and fundamental structural adjustments, as well as any gains or losses arising from disposals in thisconnection which have a material effect over a given period. This item also includes significant non-recurring items, including impairment of goodwilland trademarks and gains and losses on the disposal of activities.
Special items, income, amounted to DKK 107m (2011: DKK 2,270m) and relate to adjustment of gains and losses on disposal of entities in prioryears.
34

7/22/2019 Carlsberg Breweries Annual Report 2012
http://slidepdf.com/reader/full/carlsberg-breweries-annual-report-2012 35/152
Carlsberg Breweries Group
Note
8 Financial income and financial expenses
Financial items recognised in the income statement
DKK million 2012 2011
Financial income:
Interest income 361 201 Dividends from securities 4 10 Fair value adjustments of financial instruments, net, cf. note 36 191 11 Foreign exchange gains, net - 54 Realised gains on disposal of associates and securities 16 - Expected return on plan assets, defined benefit plans 323 327 Other financial income 23 31
Total 918 634
Interest income relates to interest from cash and cash equivalents measured at amortised cost.
Financial expenses:
Interest expenses -1,890 -1,908 Foreign exchange losses, net -172 - Realised losses on disposal of securities -22 -1 Impairment of financial assets -2 -5 Interest cost on obligations, defined benefit plans -380 -376 Effect of hyperinflation -9 -59 Other financial expenses -178 -193 Total -2,653 -2,542
Financial items, net, recognised in the income statement -1,735 -1,908
Interest expenses primarily relate to interest on borrowings measured at amortised cost.
Financial items recognised in other comprehensive income
DKK million 2012 2011
Foreign exchange adjustments of foreign entities:
Foreign currency translation of foreign entities 1,904 -1,837
- -2
Effect of hyperinflation 75 175 Total 1,979 -1,664
Value adjustments of hedging instruments:
Change in fair value of effective portion of cash flow hedges -295 -453 Change in fair value of cash flow hedges transferred to the income statement 622 421 Change in fair value of net investment hedges -216 -20 Total 111 -52
Financial items, net, recognised in other comprehensive income 2,090 -1,716
Financial items, net, recognised in statement of comprehensive income 355 -3,624
Of net change in fair value of cash flow hedges transferred to the income statement DKK 266m (2011: DKK 99m) is included incost of sales and DKK 356m (2011: DKK 322m) is included in financial items.
Interest, losses and write-downs on trade loans, which are measured at amortised cost, are included as revenue and cost inother operating income and expenses (cf. note 6), as such loans are seen as a prepaid discount to the customer.
Recycling to income statement of cumulative translation differences related toforeign operations acquired in step acquisitions/disposed of during the year
35

7/22/2019 Carlsberg Breweries Annual Report 2012
http://slidepdf.com/reader/full/carlsberg-breweries-annual-report-2012 36/152
Carlsberg Breweries Group
Note
9 Corporation tax
Total compre-hensive
income
Othercompre-hensive
income
Income
statement
Total compre-hensive
income
Othercompre-hensive
income
Income
statementTax for the year can be specified as follows:
Current tax 1,742 -189 1,553 1,913 -9 1,904
Change in deferred tax during the year -183 193 10 -6 211 205
Change in deferred tax from change in tax rate 27 - 27 -15 - -15
Adjustments to tax for previous years -144 83 -61 -57 119 62
Total 1,442 87 1,529 1,835 321 2,156
Reconciliation of the effective tax rate for the year: % DKK million % DKK million
Nominal weighted tax rate for Carlsberg Breweries Group 20.5% 1,302 22.7% 1,944
Change in tax rate 0.4% 27 -0.2% -15
Adjustments to tax for previous years -0.9% -61 0.7% 62
Non-capitalised tax assets, net movements -1.9% -119 3.0% 264
Non-taxable income -0.4% -26 -0.7% -64
Non-deductible expenses 3.4% 216 2.3% 194
Tax incentives etc. -1.7% -109 -1.4% -121
Special items/tax in associates 0.7% 43 -1.8% -156
Withholding taxes 4.1% 269 1.0% 86
Other -0.2% -13 -0.4% -38
Effective tax rate for the year 24.0% 1,529 25.2% 2,156
Tax recognised in other comprehensive income:
DKK millionRecognised
item before tax
Tax
(expense)benefit Net of tax
Recognised
item beforetax
Tax
(expense)benefit Net of tax
Foreign exchange adjustments 1,904 - 1,904 -1,839 - -1,839
Hedging instruments 111 133 244 -52 113 61
Retirement benefit obligations -739 130 -609 -1,081 205 -876
Share of other comprehensive income in associates 4 - 4 3 - 3
Effect of hyperinflation 75 - 75 175 - 175
Other -2 -176 -178 -12 3 -9
Total 1,353 87 1,440 -2,806 321 -2,485
An interest ceiling reduces the tax deduction for value adjustments of hedging instruments recognised in other comprehensive income.
DKK million 2012 2011
The change in deferred tax recognised in the income statement can be broken down as follows:
Tax losses 32 93
Deferred tax from change in tax rate 27 -15
Intangible assets and property, plant and equipment etc. -22 112
Change in deferred tax recognised in the income statement 37 190
Adjustment to tax for prev ious years DKK 83m (2011: DKK 119m) is included in the tax income/expense for hedging instruments .
2011
Nominal weighted tax rate for the Group is calculated as domestic tax rates applicable to profits in the entities as a proportion of each entity's shareof the Group's profit before tax.
2012 2011
2012
2012 2011
36

7/22/2019 Carlsberg Breweries Annual Report 2012
http://slidepdf.com/reader/full/carlsberg-breweries-annual-report-2012 37/152

7/22/2019 Carlsberg Breweries Annual Report 2012
http://slidepdf.com/reader/full/carlsberg-breweries-annual-report-2012 38/152
Carlsberg Breweries Group
Notes
12
DKK million 2012 2011
Salaries and other remuneration 7,926 8,860
Severance pay 351 192
Social security costs 1,240 1,220
Retirement benefit costs - defined contribution plans 192 190
Retirement benefit costs - defined benefit plans 113 73
Share-based payment 48 -5
Other employee benefits 305 218
Total 10,175 10,748
Staff costs are included in the following items in the income statement:
Cost of sales 2,830 2,652
Sales and distribution expenses 5,068 5,872
Administrative expenses 1,975 2,037
Other operating expenses 3 14
Special items (restructuring) 298 173
Total 10,175 10,748
DKK million
2012 2011
Jørgen Buhl
Rasmussen
Jørn P.
Jensen
Jørgen Buhl
Rasmussen
Jørn P.
Jensen
Jørgen Buhl
Rasmussen
Jørn P.
Jensen
Fixed salary 10.5 9.1 10.5 9.1 10.5 9.1 50.5 52.1
Cash bonus 6.3 5.5 - - 6.3 5.5 21.3 22.1
Non-monetary benefits 0.3 0.3 0.3 0.3 0.3 0.2 5.5 3.4
Share-based payment 5.7 5.4 4.0 4.0 3.5 3.5 11.2 4.2
Total 22.8 20.3 14.8 13.4 20.6 18.3 88.5 81.8
Granted
Jørgen Buhl Rasmussen:
2007 2010-2015 12,388 - - 12,388 12,388 1
2008 2011-2016 44,776 - - 44,776 44,776 6
2009 2012-2017 30,000 - - 30,000 30,000 11
2010 2013-2018 15,000 - - 15,000 - 3
2011 2014-2019 30,000 - - 30,000 - 4
2012 2015-2020 69,500 - 69,500 - 14
Total 132,164 69,500 - 201,664 87,164 39
Jørn P. Jensen:
2004 2007-2012 13,008 - -13,008 - -
2005 2008-2013 12,388 - - 12,388 12,388 4
2006 2009-2014 12,388 - - 12,388 12,388 3
2007 2010-2015 12,388 - - 12,388 12,388 1
2008 2011-2016 44,776 - - 44,776 44,776 6
2009 2012-2017 30,000 - - 30,000 30,000 11
2010 2013-2018 15,000 - - 15,000 - 3
2011 2014-2019 30,000 - - 30,000 - 4
2012 2015-2020 62,000 - 62,000 - 12
Total 169,948 62,000 -13,008 218,940 111,940 44
Executive Board total 302,112 131,500 -13,008 420,604 199,104 83
2011 2010
Key management personnel
Remuneration of the Executive Board andkey management personnel is based on a fixed salary, cash bonus payments andnon-monetary benefitssuch as company car, telephone
etc. Furthermore, share option programmes and incentive schemes have been established for the Executive Board and other management personnel as defined in note 13. These
programmes and schemes cover a number of years.
Employment contracts for members of the Executive Board contain terms and conditions that are considered common to executive board members in Danish listed companies,
including terms of notice and non-competition clauses.
Key management personnel comprise Senior Vice Presidents and Vice Presidents heading regions and Group business functions and CEOs in significant Group entities. The key
management personnel are, together with the Executive Board, responsible for the planning, directing and controlling of the activities of the Group.
In respect of other benefits and bonus schemes, the remuneration of CEOs in foreign subsidiaries is based on local terms and conditions.
DKK millionNumber
Grantyear Exercise year
1 Jan.2012 Exercised
31 Dec.2012
For exercise31 Dec. Fair value
The Supervisory Board of Carlsberg Breweries A/S received remuneration of DKK 0m (2011: DKK 0m). The Supervisory Board is not included in share optionprogrammes, retirement benefit plans and other schemes.
Staff costs and remuneration of the Supervisory Board and the Executive Board
The Group had an average of 41,614 (2011: 42,552) full-time employees during the year.
Remuneration of Executive Board and Key management personnel:
Executive Boards share options
2012
38

7/22/2019 Carlsberg Breweries Annual Report 2012
http://slidepdf.com/reader/full/carlsberg-breweries-annual-report-2012 39/152
Carlsberg Breweries Group
Notes
13 Share-based payment
Exercise price
Executive
board
Key
management
personnel
Other
management
personnel
Resigned
employees Total
Fixed,
weighted
average
Share options outstanding at 31 December 2010 255,120 164,174 600,455 270,391 1,290,140 372.40
Granted 60,000 1,200 - - 61,200 566.78
Forfeited/expired - -3,342 -13,530 - -16,872 360.03
Exercised -13,008 -21,387 -102,873 -55,439 -192,707 347.85
Transferred - -34,752 -35,029 69,781 - 388.75
Share options outstanding at 31 December 2011 302,112 105,893 449,023 284,733 1,141,761 387.16
Granted 131,500 - - - 131,500 444.60
Forfeited/expired - - -4,707 - -4,707 270.91
Exercised -13,008 -11,191 -71,545 -70,786 -166,530 259.52
Transferred - -17,946 -23,162 41,108 - 412.95
Share options outstanding at 31 December 2012 420,604 76,756 349,609 255,055 1,102,024 413.92
Exercisable at 31 December 2011 152,112 79,220 255,081 232,789 719,202 277.90
Exercised options as % of share capital of Carlsberg A/S 0.01% 0.01% 0.07% 0.04% 0.13%
Exercisable at 31 December 2012 199,104 68,369 193,902 329,859 791,235 396.49
Exercised options as % of share capital of Carlsberg A/S 0.01% 0.01% 0.05% 0.05% 0.12%
Assumptions 2012 2011
Grant date
Expiring
date Programme
Exercise
price
Expected
volatility
Risk-free
interest rate
Expected
dividend yield
Expected life
of options,
years
Fair value at
grant date
Options
outstanding
Options
outstanding
01.03.2004 01.03.2012 Grant 2004 216.65 29% 3.5% 1.8% 5.5 81.51 - 21,463
01.03.2005 01.03.2013 Grant 2005 232.71 27% 3.1% 1.7% 5.5 74.27 39,881 62,934
01.03.2006 01.03.2014 Grant 2006 306.89 19% 3.3% 1.3% 5.5 89.37 87,812 107,116
01.03.2007 01.03.2015 Grant 2007 472.11 19% 3.9% 1.0% 5.5 136.67 148,161 157,143
01.03.2008 01.03.2016 Grant 2008 457.82 22% 3.6% 1.1% 5.5 141.72 157,281 169,501
01.06.2008 01.06.2016 Special grant 531.80 23% 4.3% 0.9% 5.5 181.08 161,044 161,044 01.09.2008 01.09.2016 Special grant 448.18 27% 4.3% 1.3% 5.5 128.83 40,000 40,000
01.03.2009 01.03.2017 Grant 2009 203.50 52% 3.0% 1.7% 5.5 88.41 157,056 238,407
01.03.2010 01.03.2018 Grant 2010 417.34 30% 3.1% 0.8% 8.0 154.23 118,089 122,952
01.03.2011 01.03.2019 Grant 2011 566.78 25% 2.9% 0.9% 8.0 180.50 61,200 61,200
01.03.2012 01.03.2020 Grant 2012 444.60 34% 0.9% 1.2% 8.0 146.67 131,500
Outstanding share options under the share options programme 1,102,024 1,141,761
The Carlsberg Breweries Group has set up share option programmes to attract, retain and motivate the Group’s Executive Board and other levels of management personnel and to align their
interests with those of the shareholders. Key management personnel comprise Senior Vice Presidents and Vice Presidents heading regions and Group business functions and CEOs in the
most significant Group entities. Other management personnel comprise Vice Presidents and other key employees as well as the management of significant subsidiaries. No share option
programme has been set up for Carlsberg Breweries A/S’s Supervisory Board.
Since 2001 the Group has issued share options yearly as part of its remuneration packages. In 2011 the Group introduced a new long-term incentive programme. The value of the remuneration
received under the long-term incentive programmes is calculated as a predetermined percentage of the employee’s yearly salary. The new long-term programme can be settled in performanceshare units (PSUs).
A participant in the long-term incentive programme w ill receive a number of PSUs, each giving the right to receive one B share in Carlsberg A/S. The exact number of PSUs granted is
determined after the publication of the Annual Report for the year in which the PSUs are granted.
The general terms and conditions for the two programmes:
Share option programme Long-term incentive programme
Earliest time of exercise 3 years from grant date -
Vesting conditions 3 years of service 3 years of service and Group's financial
performance for the grant year
Time of valuation of option Immediately after publication of the Annual
Repor t for the Group for the prior repor ting
period
Immediately after publication of the Annual
Report for the Group for the grant year
Latest time of exercise 8 years from grant date Shares are transferred to the recipient
immediately after PSUs have vested
Share option programme:
Upon resignation, a proportion of the options may be exercised within one to three months unless special severance terms are agreed. Special terms and conditions apply in the case of
retirement, illness, death or changes in Carlsberg A/S’s capital resources. Each share option entitles the holder to purchase one class B share in Carlsberg A/S. The options may only be settled
in shares (equity-settled scheme).
Share option programme
In 2012, a total of 131,500 (2011: 61,200) share options were granted to 2 (2011: 3) employees. The fair value at grant date of these options was a total of DKK 19m (2011: DKK 11m). The fair
value is recognised in the income statement over the vesting period of three years. In 2012, DKK 5m (2011: DKK 3m) was recognised in respect of share options granted in the year. The total
cost of share-based payment was DKK 17m (2011: DKK 22m) in respect of options granted in the period 2009-2012 (2011: 2008-2011). The cost of share-based payment is included in staff
costs. At 31 December 2012, an amount of DKK 19m (2011: DKK 17m) has not been recognised in respect of current share option programmes.
The average share price at the exercise date for share options was DKK 494 (2011: DKK 571). At 31 December 2012, the exercise price for outstanding share options was in the range of DKK
203.50 to DKK 566.78 (2011: DKK 203.50 to DKK 566.78). The average remaining contractual life was 3.8 years (2011: 4.2 years).
Refunds etc. between Carlsberg A/S, Carlsberg Breweries A/S and subsidiaries in the Carlsberg Breweries Group are recognised directly in equity and total DKK -33m (2011: DKK -39m).
Change in expected future refunds based on the fair value of share options at year end are recognised directly in equity by DKK 148m (2011: DKK -78m).
Share option programme Number
39

7/22/2019 Carlsberg Breweries Annual Report 2012
http://slidepdf.com/reader/full/carlsberg-breweries-annual-report-2012 40/152
Carlsberg Breweries Group
Notes
13 Share-based payment
Long-term incentive programme
Exercise price
Executive
board
Key
management
personnel
Other
management
personnel
Resigned
employees Total
Fixed,
weighted
average
Performance share units outstanding at 31 December 2011 - - - - - -
Granted - 28,455 174,500 - 202,955 0.00
Transferred - -3,860 -5,670 9,530 - 0.00
Performance share units outstanding at 31 December 2012 - 24,595 168,830 9,530 202,955 0.00
Assumptions 2012 2011
Grant date
Expiring
date Programme
Exercise
price
Expected
volatility
Risk-free
interest rate
Expected
dividend yield
Expected lifeof options,
years
Fair value atmeasurement
date
Options
outstanding
Options
outstanding
01.01.2012 01.01.2015 LTI 2012-2014 (preliminary) None 284% 0.3% 1.2% 3.2 542.22 202,955 -
Outstanding performance share units under the long-term incentive programme 202,955 -
General information
The expected life of share options granted prior to 2010 was based on exercise in the middle of the exercise period. For share options or measured after 1 January 2010 the expected life was
based on exercise at the end of the exercise period.
The granted number of PSUs included in the specification below is the estimated number of PSUs that would be granted when applying the assumptions available at 31 December of the
reporting year. When the actual value per PSU is determined after the publication of the Annual Report for Carlsberg A/S in February of the next year, the number of granted PSUs will be
adjusted.
In 2012 202,955 (2011: 0) PSUs were granted under the long-term incentive programme. In 2012 PSUs were granted to 319 employees. The fair value at the grant date of the PSUs granted in
2012 was a total of DKK 112m. The fair value is recognised in the income statement over the vesting period of three years. In 2012, DKK 37m was recognised in respect of PSUs granted in the
year. The cost/(income) of share-based payment is included in staff costs. At 31 December 2012, an amount of DKK 75m has not been recognised in respect of PSUs granted under the long
term incentive programme.
Number
Long-term incentive programme:
There are no exercisable PSUs in the long-term incentive programme as at 31 December 2012.
The fair value of granted share options and PSUs is estimated using the Black-Scholes call option pricing model based on the exercise price. The fair value at 31 December 2012 was DKK
275m (2011: DKK 131m), which is DKK 144m higher than at year-end 2011.
The assumptions underlying the calculation of the grant date fair value for share options outstanding at year-end are stated above. The stated exercise prices and number of outstanding share
options are adjusted for the bonus element in connection with the share rights issues in 2004 and 2008.
The calculation of the number of PSUs where no value has been determined at year-end is based on the assumptions available at year-end (preliminary). The final number of PSUs will be
adjusted to reflect the assumptions available after the publication of the Annual Report for Carlsberg A/S in February of the next year.
The share price and exercise price for share options and value of PSUs are calculated as the average price of Carlsberg A/S’s class B shares on NASDAQ OMX Copenhagen during the first
five trading days after the publication of Carlsberg A/S’s Annual Report following the granting of the options or PSUs (for PSUs in the following year). The preliminary share price and value for
PSUs granted under the long-term incentive programme is the last available price before 31 December of the reporting year.
The expected volatility for share options granted prior to 2010 was based on the historical volatility in the price of Carlsberg A/S’s class B shares over the previous two years. For share options
and PSUs granted or measured after 1 January 2010, the volatility is based on presently observed data on Bloomberg’s Options Valuation Function.
The risk-free interest rate is the interest rate on Danish government bonds of the relevant maturity, while the dividend yield is calculated as DKK 5.50 per share (2011: DKK 5.0 per share)
divided by the share price.
40

7/22/2019 Carlsberg Breweries Annual Report 2012
http://slidepdf.com/reader/full/carlsberg-breweries-annual-report-2012 41/152
Carlsberg Breweries Group
Note
14 Intangible assets
2012
DKK million Goodwill Trademarks
Other
intangible
assets
Under
development Total
Cost:
Cost at 1 January 2012 44,895 32,941 2,383 797 81,016
Acquisition of ownership in terest in proportionally consolidated entities 17 - - - 17
Additions/(-) adjustments to prior period -23 2 141 329 449
Disposals - - -132 - -132
Transfers - - 51 -34 17
Transfer to/from assets held for sale - - - -1 -1
Effect of hyperinflation 43 7 - - 50
Foreign exchange adjustments etc. 872 1,093 -22 - 1,943
Cost at 31 December 2012 45,804 34,043 2,421 1,091 83,359
Amortisation and impairment losses:
Amortisation and impai rment losses at 1 January 2012 105 1,070 2,007 - 3,182
Disposals - - -130 - -130
Amortisation - 25 214 - 239
Impairment losses - 11 28 - 39
Foreign exchange adjustments etc. -9 10 18 - 19
Amortisation and impairment losses at 31 December 2012 96 1,116 2,137 - 3,349
Carrying amount at 31 December 2012 45,708 32,927 284 1,091 80,010
DKK million 2012 2011
Amortisation and impairment losses for the year are included in:
Cost of sales 49 66
Sales and distribution expenses 47 56
Administrative expenses 169 141
Special items 13 791 Total 278 1,054
41
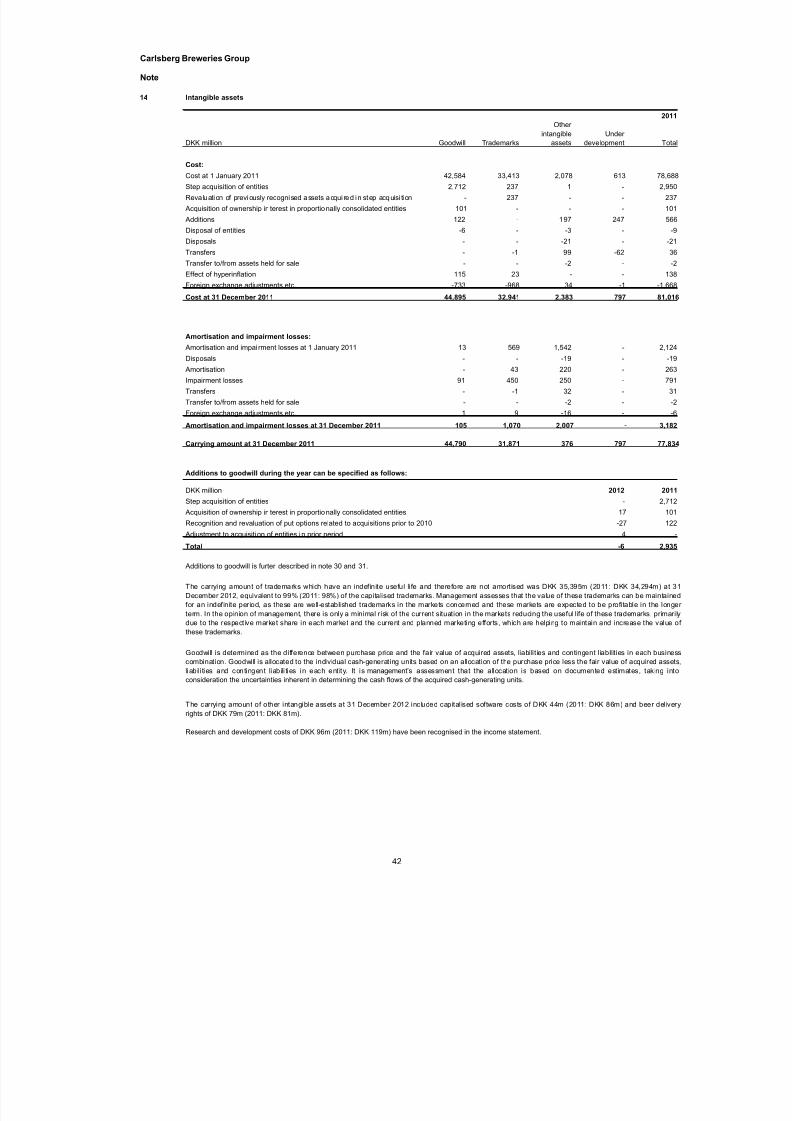
7/22/2019 Carlsberg Breweries Annual Report 2012
http://slidepdf.com/reader/full/carlsberg-breweries-annual-report-2012 42/152
Carlsberg Breweries Group
Note
14 Intangible assets
2011
DKK million Goodwill Trademarks
Other
intangible
assets
Under
development Total
Cost:
Cost at 1 January 2011 42,584 33,413 2,078 613 78,688
Step acquisition of entities 2,712 237 1 - 2,950
Revaluation of previously recognised assets acqui red in step acquisi tion - 237 - - 237
Acquisition of ownership in terest in proportionally consolidated entities 101 - - - 101
Additions 122 - 197 247 566
Disposal of entities -6 - -3 - -9
Disposals - - -21 - -21
Transfers - -1 99 -62 36
Transfer to/from assets held for sale - - -2 - -2
Effect of hyperinflation 115 23 - - 138
Foreign exchange adjustments etc. -733 -968 34 -1 -1,668
Cost at 31 December 2011 44,895 32,941 2,383 797 81,016
Amortisation and impairment losses:
Amortisation and impai rment losses at 1 January 2011 13 569 1,542 - 2,124
Disposals - - -19 - -19
Amortisation - 43 220 - 263
Impairment losses 91 450 250 - 791
Transfers - -1 32 - 31
Transfer to/from assets held for sale - - -2 - -2
Foreign exchange adjustments etc. 1 9 -16 - -6
Amortisation and impairment losses at 31 December 2011 105 1,070 2,007 - 3,182
Carrying amount at 31 December 2011 44,790 31,871 376 797 77,834
Additions to goodwill during the year can be specified as follows:
DKK million 2012 2011
Step acquisition of entities - 2,712
Acquisition of ownership in terest in proportionally consolidated entities 17 101
Recognition and revaluation of put options related to acquisitions prior to 2010 -27 122
Adjustment to acquisition of entities in prior period 4 -
Total -6 2,935
The carrying amount of other intangible assets at 31 December 2012 included capitalised software costs of DKK 44m (2011: DKK 86m) and beer delivery
rights of DKK 79m (2011: DKK 81m).
Research and development costs of DKK 96m (2011: DKK 119m) have been recognised in the income statement.
Additions to goodwill is furter described in note 30 and 31.
The carrying amount of trademarks which have an indefinite useful life and therefore are not amortised was DKK 35,395m (2011: DKK 34,294m) at 31
December 2012, equivalent to 99% (2011: 98%) of the capitalised trademarks. Management assesses that the value of these trademarks can be maintained
for an indefinite period, as these are well-established trademarks in the markets concerned and these markets are expected to be profitable in the longer
term. In the opinion of management, there is only a minimal risk of the current situation in the markets reducing the useful life of these trademarks, primarily
due to the respective market share in each market and the current and planned marketing efforts, which are helping to maintain and increase the value of these trademarks.
Goodwill is determined as the difference between purchase price and the fair value of acquired assets, liabilities and contingent liabilities in each business
combination. Goodwill is allocated to the individual cash-generating units based on an allocation of the purchase price less the fair value of acquired assets,
liabili ties and contingent liabili ties in each entity. It is management’s assessment that the allocation is based on documented estimates, taking into
consideration the uncertainties inherent in determining the cash flows of the acquired cash-generating units.
42

7/22/2019 Carlsberg Breweries Annual Report 2012
http://slidepdf.com/reader/full/carlsberg-breweries-annual-report-2012 43/152
Carlsberg Breweries Group
Note
15 Impairment test Goodwill and trademarks with an indefinite useful life
General assumptions. The Carlsberg Breweries Group annually performs impairment tests of goodwill andtrademarks with an indefinite useful life. Intangible assets with a finite useful life and property, plant andequipment are tested if indications of impairment exist. The Carlsberg Breweries Group has performedimpairment tests of the carrying amounts based on the budget and target plans approved by the SupervisoryBoard and the Executive Board in December 2012.
Goodwill and trademarks related to Baltika Breweries (Russia), Brasseries Kronenbourg (France) or more ofthe total carrying amount of goodwill and trademarks with an indefinite useful life at 31 December 2012. Noother goodwill and trademarks comprise 10% or more of the total carrying amount of goodwill andtrademarks with indefinite useful life at 31 December 2012.
Goodwill
The impairment test of goodwill is performed for Northern Europe, Western Europe and Eastern Europe,while entities in Asia are tested at sub-regional levels. Entities that are less integrated in regions or sub-regions are tested at individual entity level. The cash-generating units are based on the managementstructure and reflect the smallest identifiable group of assets that are largely independent of cash inflowsfrom other cash-generating units. The management of the Group is centralised and driven through theregional managements, which are responsible for performance, investments and growth initiatives in theirrespective regions.
The management structure and responsibilities support and promote optimisations across countries focusingon the Group or region as a whole and not just on the specific country. Changes in procurement andsourcing between countries increase intra-group trade/transactions, which will also have an increasingimpact on the allocation of profits.
For the Group’s cash-generating units, the carrying amount of goodwill at 31 December was as follows:
DKK million 2012 % 2011 %
Western Europe:
Northern Europe 4.413 10% 4.360 10%
Western Europe excl. Unicer-Bebidas de Portugal 10.281 22% 10.259 23%
Unicer-Bebidas de Portugal 536 1% 534 1%
Eastern Europe:
Eastern Europe 24.573 54% 23.683 53%
Asia:
Greater China and Malaysia 1.777 4% 1.771 4%
Indochina 3.526 8% 3.567 8%
India 247 0% 243 0%
Nepal 355 1% 373 1%
Total 45.708 100% 44.790 100% The impairment test of goodwill for each cash-generating unit is based on the discounted value of expected
future free cash flows (value in use), based on budgets and target plans for the next three years andprojections for subsequent years (the terminal period). Key parameters include assumptions about revenue
43

7/22/2019 Carlsberg Breweries Annual Report 2012
http://slidepdf.com/reader/full/carlsberg-breweries-annual-report-2012 44/152
growth, operating margin, future capital expenditure and growth expectations beyond the next three years.Budgets and target plans do not incorporate the effect of future restructurings and non-contracted capacityincreases.
Budgets and target plans for the next three years are based on concrete commercial initiatives, and the risks
associated with the key parameters are assessed and incorporated in expected future free cash flows. Theimpairment test is based on scenarios for possible future cash flows. Potential upsides and downsidesidentified during the budget process and in the daily business are reflected in the future cash flow scenariosfor each individual cash-generating unit. The scenarios reflect, among other things, different assumptionsabout combinations of market, price and input cost developments. Projections for the terminal period arebased on general expectations and risks, taking into account the general growth expectations for the brewingindustry in the relevant segments. The growth rates applied are not expected to exceed the average long-term growth rate for the Group’s individual geographical segments. The average growth rates for the terminalperiod are presented in the table on the following page.
In calculating the recoverable amounts, the Group uses pre-tax discount rates that reflect the risk-freeborrowing rate in each particular geographical segment.
The impairment test of cash-generating units is based on a comparison of the recoverable amount,corresponding to the discounted value of the expected future free cash flow, with the carrying amount of theindividual cash-generating unit. The carrying amount comprises goodwill and other net assets.
Trademarks
The carrying amount of the Group’s trademarks with an indefinite useful life at 31 December was as follows:
Trademarks with an indefinite useful life
DKK million 2012 % 2011 %
Western Europe 3,411 11% 3,396 11%
Eastern Europe 28,479 88% 27,410 88%
Asia 505 1% 488 1%
Total 32,395 100% 31,294 100% Trademarks are allocated to the segment that owns the individual trademark. Royalty income generated bythe trademark is based on the Group’s total income and earned globally, i.e. the income is also earnedoutside the segment that owns the trademark.
Trademarks are impairment-tested individually at Group level. The impairment test is performed using therelief from royalty method and is based on expected future free cash flows from the Group’s calculatedroyalty income generated by the individual trademark for the next 20 years and projections for subsequentyears. Key assumptions include revenue, royalty rate, expected useful life, growth rate and a theoreticallycalculated tax effect. A post-tax discount rate is used which reflects the risk-free interest rate with theaddition of a risk premium associated with the individual trademark.
The royalty rate is based on the actual market position of the individual trademark in the global, regional andlocal markets. If external licence agreements for the individual trademark already exist, the market terms ofsuch agreements are considered when assessing the royalty rate which the trademark is expected togenerate in a transaction with independent parties.
For each individual trademark a 20-year curve is projected reflecting the expected future growth in revenueper year. Depending on the expectations for the individual trademark, the growth in individual years is eitherabove, equal to or below the current inflation level in the countries where the individual trademark is sold.The curve for each individual trademark is determined with reference to its market position, the overallcondition of the markets where the trademark is marketed, as well as regional and national macroeconomictrends etc. For some trademarks, national, regional and international potential has been linked to the value
44

7/22/2019 Carlsberg Breweries Annual Report 2012
http://slidepdf.com/reader/full/carlsberg-breweries-annual-report-2012 45/152
of the trademark, and investments in terms of product development and marketing strategy are expected tobe made. For these trademarks the expected growth is generally higher than for comparable trademarks,especially at the beginning of the 20-year period. The growth rates determined for the terminal period are inline with the expected rate of inflation.
The tax rate is the expected future tax rate in each country, based on current legislation. The impairment testat year-end 2012 incorporates tax rates of 15-34%.
The impairment test of trademarks is based on a comparison of the recoverable amount, corresponding tothe discounted value of the expected future free cash flow, with the carrying amount of the individualtrademark. This corresponds to the approach used for determining the fair value of the trademark at theacquisition date.
Significant assumptions for goodwill and trademarks
The main growth in the terminal period and discount rates applied in the impairment tests can besummarised as follows:
Significant assumptions
2012 2011 2012 2011
Goodwill:
Northern Europe 1.5% 1.5% 2.3% 2.8%
Western Europe excl. Unicer-Bebidas de Portugal 1.5% 1.5% 2.6% 2.6%
Unicer-Bebidas de Portugal 1.5% 1.5% 1.6% 2.4%
Eastern Europe 2.5% 2.5% 7.0% 8.5%
Asia 2.5 - 3.5% 2.5 - 3.5% 3,5 - 12,1% 3.4%-12,7%
2012 2011 2012 2011
Trademarks:
Western Europe 2.0 - 3.0% 2.0% 4.5 - 7.0% 5.0 - 9.0%
Eastern Europe 2.0 - 5.0% 2.0 - 5.0% 8.5 - 18.9% 10.2 - 18.8%
Asia 2.0 - 2.5% 2.0% 6.5 - 12.9% 6.0%
Growth in the
terminal period
Discount rates
(WACC)
Growth in the
terminal period
Discount rates
(risk-free interest rate)
Growth rates are determined for each individual cash-generating unit and trademark. The growth ratesapplied for the terminal period are in line with the expected rate of inflation.
For the impairment testing of goodwill, the Group uses a pre-tax risk-free interest rate.
For the impairment testing of trademarks the Group uses a post-tax discount rate for each country. Indetermining the discount rate, a risk premium on the risk-free interest rate (spread) is fixed at a level thatreflects management’s expectations of the spread for future borrowings.
The risk-free interest rate is based on observable long-term interest rates for the individual countries. Forcountries where long-term risk-free interest rates are not observable or valid due to specific national ormacroeconomic changes affecting the country, the interest rate is estimated based on observations fromother markets and/or long-term expectations expressed by major international credit institutions.
45

7/22/2019 Carlsberg Breweries Annual Report 2012
http://slidepdf.com/reader/full/carlsberg-breweries-annual-report-2012 46/152
The WACC rates in Asia vary within a wide range with the lowest rate for China and developed countries,whereas the subcontinent, a.o. India and Nepal, has the highest WACC rates in the region.
For each region, sub-region or individually tested entity, the applied growth rates for projections and discountrates are compared to ensure a reasonable link between the two (real interest rate).
Western Europe is generally characterised by stable volumes and by growth markets in the central andeastern parts of the region. The entire region continues to experience strong competition, requiring ongoingoptimisation of cost structures and use of capital. A slight increase in revenue is expected in the next threeyears, while the ongoing restructuring initiatives already implemented in key countries and underimplementation in other countries, the initiative to establish a fully integrated supply chain across all marketsand the roll-out of the business standardisation project (BSP) are expected to contribute to productivityimprovements and cost savings. Some countries will continue to be characterised by a high level ofinvestment as a result of changes to the production structure.
Eastern Europe showed fluctuations between quarters, but overall the beer markets were flat. In addition,Russia saw some transitional disruption following the closures ahead of the sales restrictions coming intoeffect on 1 January 2013. Other markets in the region faced a worsening of macroeconomic conditions. In
the longer run increases in revenue are expected in the region.
Asia is a growth area, with significant growth in China in particular. Increases in revenue in the emerging
markets are expected, while more stable earnings are expected in the more mature markets.
Sensitivity test
Sensitivity tests have been performed to determine the lowest growth rates and/or highest discount rates thatcan occur in the cash-generating units and for trademarks with indefinite useful life without resulting in anyimpairment loss.
Goodwill Sensitivity tests show that for the cash-generating unit with the lowest margin between recoverableamount and carrying amount, the growth rate in the terminal period can decline by around 3.7 percentage
points (2011: 0.4 percentage points). Alternatively, the discount rate can increase by around 3.2 percentagepoints (2011: 0.4 percentage points) without resulting in any impairment losses.
Trademarks Sensitivity tests show that for trademarks with an indefinite useful life, the growth rate in theterminal period can decline by around 0.6 percentage points (2011: 0.8 percentage points) without resultingin any additional impairment losses. Alternatively, the discount rate can increase by around 0.3 percentagepoints (2011: 0.3 percentage points) without resulting in any additional impairment losses.
In 2012 several of the WACCs in - Western Europe are impacted by relatively low interest rates due to thecurrent economic climate and associated outlooks. The lower WACC is mainly driven by lower observed risk-free interest rates. In addition to the impairment test and to ensure that a potential impairment in notoverlooked, an additional impairment sensitivity calculation has been prepared. This sensitivity calculationhas tested the impact of a higher interest rate, reflecting a reasonable assumption of a higher risk-free
interest level. This additional sensitivity test did not identify impairment needs.
As recently impaired trademarks will have less ability to absorb changes in the risk-free interest rate or adecline in growth, these trademarks are sensitivity-tested separately. For the recently impaired trademark(indefinite useful life) with the lowest margin between recoverable amount and carrying amount, the growthrate in the terminal period can decline by around 0.1 percentage points without resulting in any additionalimpairment losses. Alternatively, the discount rate can increase by around 0.1 percentage points withoutresulting in any additional impairment losses.
Property, plant and equipment
Property, plant and equipment are impairment-tested if there are indications of impairment, e.g. whenrestructuring programmes are considered. Each individual impairment test is based on the lowest cash-
generating unit affected by the changes that indicate impairment. The impairment test is based on budgeted
46

7/22/2019 Carlsberg Breweries Annual Report 2012
http://slidepdf.com/reader/full/carlsberg-breweries-annual-report-2012 47/152
and estimated cash flows from the cash-generating unit. The pre-tax discount rate reflects the risk-freeinterest rate with the addition of a risk premium associated with the particular asset.
Impairment losses
Based on the impairment tests performed, the following impairment losses have been recognised in respectof goodwill, trademarks and other non-current assets:
DKK million 2012 2011
Goodwill
Impairment of Carlsberg Uzbekistan - 91
Trademarks:
Trademarks with finite useful life - 198
Trademarks with indefinite useful life 11 252
Other intangible assets:
Impairment of the business standardisation project - 250
Impairment of Carlsberg Uzbekistan 2 -
Other 26 -
Property, plant and equipment:
Impairment of Carlsberg Uzbekistan 78 209
Impairment of Vena Brewery, production and sales equipment, Russia 589 -
Impairment of Aldaris Brewery, Latvia 93 -
Impairment of plant, machinery and equipment, Ringnes, Norway 76 -
Impairment of prodution lines in Western Europe 54 83
Other 2 36
Investments in associates:Impairment of Nordic Getränke, Germany 64 260
Total 995 1,379
The impairment losses on Carlsberg Uzbekistan, DKK 91m (2011: DKK 300m), Nordic Getränke, Germany,DKK 64m (2011: DKK 260m), and Vena Brewery, production and sales equipment, Russia DKK 589m, relateto intangible assets and property, plant and equipment and are a consequence of difficult market conditionsand poor performance. The trademark Sarbast has been fully impaired as part of the DKK 91m impairment inUzbekistan.
In 2011 the impairment losses on trademarks (indefinite and finite useful life) related to Nevskoye, Russia,and Slavutich, Ukraine. These trademarks suffered from the economic crisis and were not expected to fully
recover. For Slavutich this has furthermore led to a change in the brand strategy. The trademarks werewritten down to the lower recoverable amount.
Other impairments of property, plant and equipment are a consequence of restructuring and processoptimisations, especially in Northern & Western Europe and Eastern Europe.
The impairment losses of DKK 967m (2011: DKK 1,375m) are recognised under special items in the incomestatement, while DKK 28m (2011: DKK 4m) has been included in cost of sales. The impairment losses areincluded in the relevant segments, cf. note 2.
Based on the impairment tests performed, there were no indications of further impairment of goodwill andtrademarks at 31 December 2012.
47

7/22/2019 Carlsberg Breweries Annual Report 2012
http://slidepdf.com/reader/full/carlsberg-breweries-annual-report-2012 48/152
Carlsberg Breweries Group
Note
16 Property, plant and equipment
2012
DKK million
Land and
buildings
Plant and
machinery
Fixtures andfittings, other
plant and
equipment
Under
construction Total
Cost:
Cost at 1 January 2012 17,015 27,925 11,788 1,248 57,976
Increase in ownership interest in proportionally consolidated entities 8 28 10 5 51
Additions 318 1,228 1,520 1,465 4,531
Disposals -88 -752 -1,247 -4 -2,091
Transfers 104 410 358 -887 -15
Transfer to/from assets held for sale -1 - -1 - -2
Effect of hyperinflation 8 18 10 - 36
Foreign exchange adjustments etc. 265 363 -4 -38 586
Cost at 31 December 2012 17,629 29,220 12,434 1,789 61,072
Depreciation and impairment losses:
Depreciation and impairment losses at 1 January 2012 4,851 14,469 7,766 - 27,086
Disposals -34 -709 -1,238 - -1,981
Depreciation 538 1,764 1,439 - 3,741
Impairment losses 289 522 81 - 892
Transfers 4 4 -8 - -
Transfer to/from assets held for sale - - -1 - -1
Effect of hyperinflation 1 7 4 - 12
Foreign exchange adjustments etc. 61 188 40 - 289
5,710 16,245 8,083 - 30,038
Carrying amount at 31 December 2012 11,919 12,975 4,351 1,789 31,034
Assets held under finance leases:
Cost 7 92 11 - 110
Depreciation and impairment losses -7 -55 -2 - -64
Carrying amount at 31 December 2012 - 37 9 - 46
Carrying amount of assets pledged as security for loans 107 338 3 28 476
DKK million 2012 2011
Depreciation and impairment losses are included in:
Cost of sales 2,766 2,605
Sales and distribution expenses 820 737
Administrative expenses 157 161
Special items 890 324
Total 4,633 3,827
Depreciation and impairment losses at 31 December 2012
48

7/22/2019 Carlsberg Breweries Annual Report 2012
http://slidepdf.com/reader/full/carlsberg-breweries-annual-report-2012 49/152
Carlsberg Breweries Group
Note
16 Property, plant and equipment
2011
DKK million
Land and
buildings
Plant and
machinery
Fixtures andfittings, other
plant and
equipment
Under
construction Total
Cost:
Cost at 1 January 2011 17,626 27,227 10,736 1,123 56,712
Step acquisition of entities -287 145 63 64 -15
Revaluat ion of previously recognised assets acquired in step acquisition -1 -41 - - -42
Increase in ownership interes t in proportionally consolidated entities 30 91 2 12 135
Additions 278 1,256 1,350 1,032 3,916
Disposal of entities -52 -2 -8 -2 -64
Disposals -218 -496 -563 -12 -1,289
Transfers 69 465 277 -929 -118
Transfer to/from assets held for sale -284 -473 -11 - -768
Effect of hyperinflation 23 52 21 1 97
Foreign exchange adjustments etc. -169 -299 -79 -41 -588
Cost at 31 December 2011 17,015 27,925 11,788 1,248 57,976
Depreciation and impairment losses:
Depreciation and impairment losses at 1 January 2011 4,869 13,556 7,000 - 25,425
Disposals of entities -293 -1 -5 - -299
Disposals -102 -412 -518 - -1,032
Depreciation 527 1,692 1,280 - 3,499
Impairment losses - 275 53 - 328
Transfers -49 -69 -11 - -129
Transfer to/from assets held for sale -107 -538 -11 - -656
Effect of hyperinflation 3 15 8 26
Foreign exchange adjustments etc. 3 -49 -30 - -76
4,851 14,469 7,766 - 27,086
Carrying amount at 31 December 2011 12,164 13,456 4,022 1,248 30,890
Assets held under finance leases:
Cost 7 95 12 - 114
Depreciation and impairment losses -5 -52 -3 - -60
Carrying amount at 31 December 2011 2 43 9 - 54
Carrying amount of assets pledged as security for loans 659 257 4 78 998
Leased assets with a carrying amount of DKK 46m (2011: DKK 54m) have been pledged as security for lease liabilities totalling DKK 38m (2011: DKK53m).
Depreciation and impairment losses at 31 December 2011
Fixtures and fittings, other plant and equipment include rolling equipment such as cars and trucks, draught beer equipment, coolers, returnablepackaging and office equipment.
49

7/22/2019 Carlsberg Breweries Annual Report 2012
http://slidepdf.com/reader/full/carlsberg-breweries-annual-report-2012 50/152
Carlsberg Breweries Group
Note
17 Associates
DKK million 2012 2011
Cost:
Cost at 1 January 5,012 4,742
Acquisition of entities 775 26
Additions 51 50 Disposals -3 -1
Foreign exchange adjustments etc. -12 195
Cost at 31 December 5,823 5,012
Value adjustments:
Value adjustments at 1 January -5 93
Dividends -95 -42
Impairment losses -64 -260
Share of profit after tax 112 174
Share of other comprehensive income 4 3
Reversal of impairment 3 -
Foreign exchange adjustments etc. -10 27
Value adjustments at 31 December -55 -5
Carrying amount at 31 December 5,768 5,007
2012
DKK million Revenue
Profit after
tax Assets Liabilities
Ownership
interest
Profit after
tax Equity
Key figures for associates:
Chongqing Group 2,866 57 15,630 2,567 29.7% 17 4,201
Tibet Lhasa Brewery Co. Ltd. 426 81 680 48 33% 27 209
Lanzhou Huanghe Jianjiang Brewery Company 337 23 501 109 30% 7 118
Hanoi Beer Company 1,639 210 4,360 827 17% 37 601
The Lion Brewery Ceylon 560 56 433 324 25% 14 27
Other associates, Asia (3 entities) 245 15 338 82 30-33% 5 84
International Breweries BV 560 -45 723 652 23% -11 16
Nuuk Imeq A/S 207 26 266 119 31.9% 8 47
Nordic Getränke GmbH 2,246 -18 715 715 50% -9 -
Other 1,581 51 1,924 1,511 20-50% 17 465
112 5,768
The acquisition of the shareholding in Chongqing Jianiang Brewery Co. Ltd. consists of contributed cash at the formation of the entity and a subsequent acquisition of
18.58% of the shares in the entity. Chongqing Jianiang Brewery Co. Ltd. is a subsidiary of Chongqing Brewery Co. Ltd. and an associate of the Carlsberg Group,
Carlsberg Breweries Group share
50
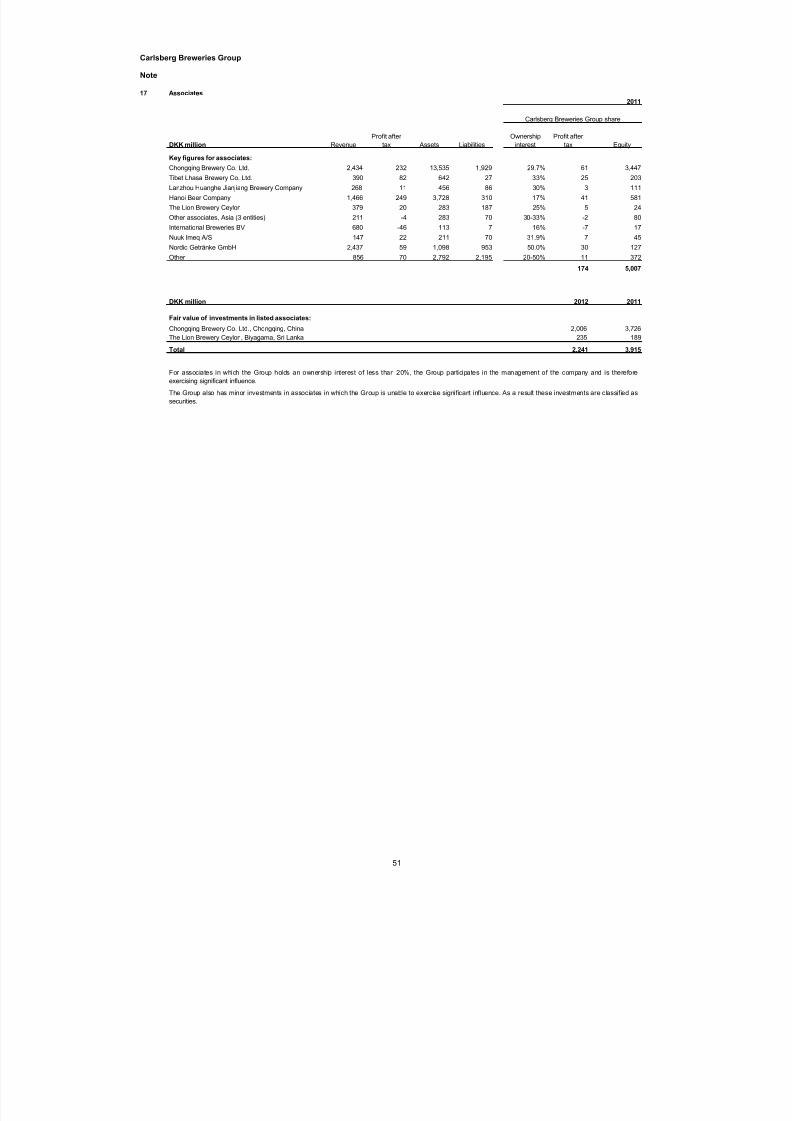
7/22/2019 Carlsberg Breweries Annual Report 2012
http://slidepdf.com/reader/full/carlsberg-breweries-annual-report-2012 51/152
Carlsberg Breweries Group
Note
17 Associates
2011
DKK million Revenue
Profit after
tax Assets Liabilities
Ownership
interest
Profit after
tax Equity
Key figures for associates:
Chongqing Brewery Co. Ltd. 2,434 232 13,535 1,929 29.7% 61 3,447
Tibet Lhasa Brewery Co. Ltd. 390 82 642 27 33% 25 203
Lanzhou Huanghe Jianjiang Brewery Company 268 11 456 86 30% 3 111
Hanoi Beer Company 1,466 249 3,728 310 17% 41 581
The Lion Brewery Ceylon 379 20 283 187 25% 5 24
Other associates, Asia (3 entities) 211 -4 283 70 30-33% -2 80
International Breweries BV 680 -46 113 7 16% -7 17
Nuuk Imeq A/S 147 22 211 70 31.9% 7 45
Nordic Getränke GmbH 2,437 59 1,098 953 50.0% 30 127
Other 856 70 2,792 2,195 20-50% 11 372
174 5,007
DKK million 2012 2011
Chongqing Brewery Co. Ltd., Chongqing, China 2,006 3,726
The Lion Brewery Ceylon, Biyagama, Sri Lanka 235 189
Total 2,241 3,915
The Group also has minor investments in associates in which the Group is unable to exercise significant influence. As a result these investments are classified as
securities.
For associates in which the Group holds an ownership interest of less than 20%, the Group participates in the management of the company and is therefore
exercising significant influence.
Fair value of investments in listed associates:
Carlsberg Breweries Group share
51

7/22/2019 Carlsberg Breweries Annual Report 2012
http://slidepdf.com/reader/full/carlsberg-breweries-annual-report-2012 52/152
Carlsberg Breweries Group
Note
18 Securities
DKK million 2012 2011
Securities are classified in the statement of financial position as follows:Non-current assets 112 106
Current assets 21 24
Total 133 130
Types of security:
Listed shares 1 23
Unlisted shares 132 107
Total 133 130
Securities classified as current assets are those expected to be sold within one year after the end of the reporting period.
Shares in unlisted entities comprise a number of small holdings. Most of these shares are not recognised at fair value as thefair value cannot be calculated on a reliable basis. Instead the assets are recognised at cost.
52

7/22/2019 Carlsberg Breweries Annual Report 2012
http://slidepdf.com/reader/full/carlsberg-breweries-annual-report-2012 53/152
Carlsberg Breweries Group
Note
19 Receivables
DKK million 2012 2011
Receivables are included in the statement of financial position as follows:
Trade receivables 7,872 7,870Other receivables 2,631 3,250
Total current receivables 10,503 11,120
Non-current receivables 2,075 1,649
Total 12,578 12,769
DKK million 2012 2011
Receivables by origin:
Receivables from the sale of goods and services 7,117 7,115
On-trade loans 2,022 2,066
Loans to associates 137 123
Loans to partners 226 230
Fair value of hedging instruments 584 499
Other receivables 1,813 1,267
Intercompany receivables 679 1,469
Total 12,578 12,769
Hedging instruments are measured at fair value. All other receivables are measured at amortised cost.
2012 2011
% %
Average effective interest rates:
Loans to associates 4.4 2.9
On-trade loans 4.9 5.8
Trade receivables comprise invoiced goods and services as well as short-term loans to customers in the on-trade.
Other receivables comprise VAT receivables, loans to partners and associates, interest receivables and other financial receivables.
Non-current receivables consist mainly of on-trade loans. Non-current receivables fall due more than one year from the end of thereporting period, with DKK 142m (2011: DKK 145m) falling due more than five years from the end of the reporting period.
On-trade loans are usually repaid through discounts during the continuing sales relationship with the individual customer, which is reflectedin the repayment scheme and the discounting of the loans. There are therefore no significant overdue on-trade loans.
53

7/22/2019 Carlsberg Breweries Annual Report 2012
http://slidepdf.com/reader/full/carlsberg-breweries-annual-report-2012 54/152
Carlsberg Breweries Group
Note
20 Inventories
DKK million 2012 2011
Raw materials and consumables 2,332 2,316
Work in progress 304 303
Finished goods 1,905 1,731
Total 4,541 4,350
Production costs of inventories sold amount to DKK 33,532m (2011: DKK 31,367m).
21 Cash and cash equivalents
DKK million 2012 2011
Cash at bank and in hand 5,748 3,108Total 5,748 3,108
Cash and cash equivalents 5,748 3,108Bank overdrafts -700 -310Cash and cash equivalents, net 5,048 2,798
Of which pledged as security - -
Proportionally consolidated entities’ share of cash and cash equivalents is specified in note 34.
Short-term bank deposits amounted to DKK 3,579m (2011: DKK 1,506m). The average interest rate on these deposits was6.6% (2011: 6.4%).
In the statement of cash flows, bank overdrafts are offset against cash and cash
equivalents as follows:
Raw materials, packaging and spare parts are measured at the lower of net realisable value and cost. Write-downs of inventories to net realisable value amount to DKK 8m (2011: DKK 47m) and are included in cost of sales.
Obsolete beer and soft drinks and raw materials are generally scrapped due to limited shelf-life and are fully written down. Thecost of scrapped goods is included in production costs.
54
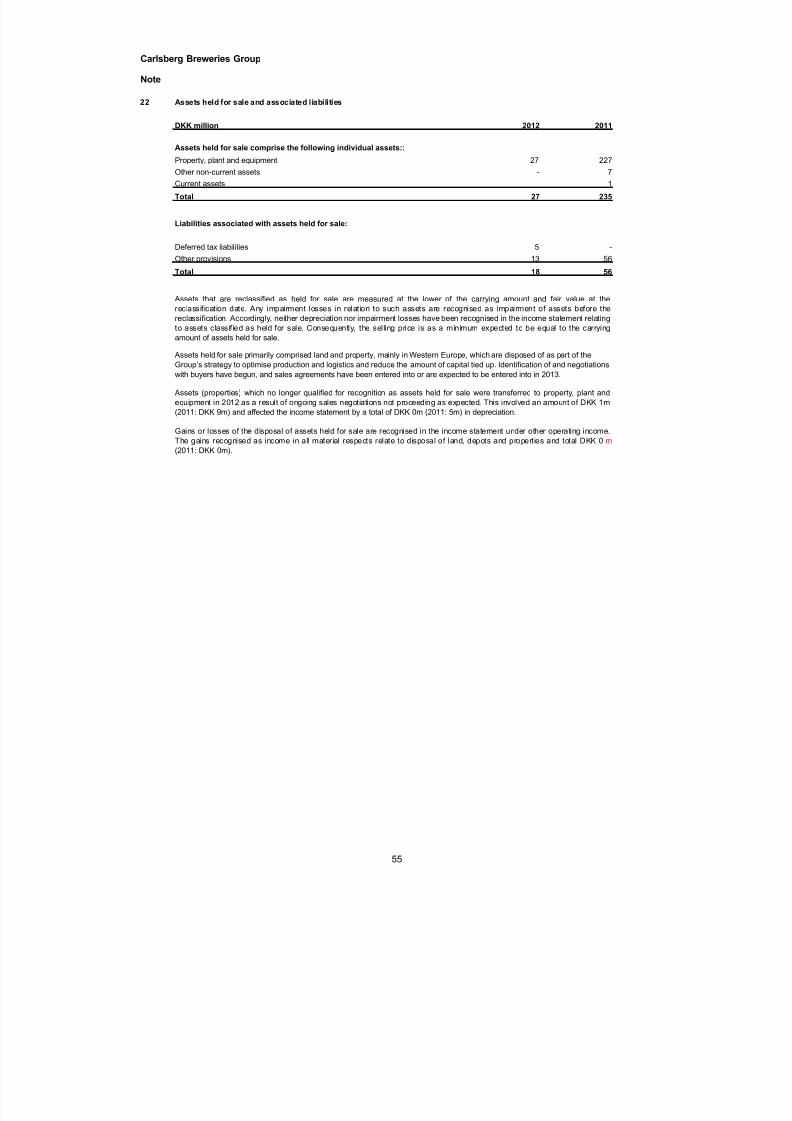
7/22/2019 Carlsberg Breweries Annual Report 2012
http://slidepdf.com/reader/full/carlsberg-breweries-annual-report-2012 55/152
Carlsberg Breweries Group
Note
22 Assets held for sale and associated liabilities
DKK million 2012 2011
Property, plant and equipment 27 227
Other non-current assets - 7
Current assets - 1
Total 27 235
Liabilities associated with assets held for sale:
Deferred tax liabilities 5 -
Other provisions 13 56
Total 18 56
Assets (properties) which no longer qualified for recognition as assets held for sale were transferred to property, plant andequipment in 2012 as a result of ongoing sales negotiations not proceeding as expected. This involved an amount of DKK 1m(2011: DKK 9m) and affected the income statement by a total of DKK 0m (2011: 5m) in depreciation.
Gains or losses of the disposal of assets held for sale are recognised in the income statement under other operating income.The gains recognised as income in all material respects relate to disposal of land, depots and properties and total DKK 0m(2011: DKK 0m).
Assets held for sale comprise the following individual assets::
Assets held for sale primarily comprised land and property, mainly in Western Europe, which are disposed of as part of theGroup’s strategy to optimise production and logistics and reduce the amount of capital tied up. Identification of and negotiations
with buyers have begun, and sales agreements have been entered into or are expected to be entered into in 2013.
Assets that are reclassified as held for sale are measured at the lower of the carrying amount and fair value at the
reclassification date. Any impairment losses in relation to such assets are recognised as impairment of assets before thereclassification. Accordingly, neither depreciation nor impairment losses have been recognised in the income statement relatingto assets classified as held for sale. Consequently, the selling price is as a minimum expected to be equal to the carryingamount of assets held for sale.
55

7/22/2019 Carlsberg Breweries Annual Report 2012
http://slidepdf.com/reader/full/carlsberg-breweries-annual-report-2012 56/152
Carlsberg Breweries Group
Note
23 Share capital
Total share capital
Shares ofDKK 1.000
Nominalvalue, DKK
'000
1 January 2011 501 501,000
No change in 2011 - -
31 December 2011 501 501,000
No change in 2012 - -
31 December 2012 501 501,000
The share capital amounts to DKK 501m divided into shares in denominations of DKK 1,000 and multiples thereof.None of the shares confer any special rights. The share capital is fully owned by Carlsberg A/S, Copenhagen, Denmark.
56

7/22/2019 Carlsberg Breweries Annual Report 2012
http://slidepdf.com/reader/full/carlsberg-breweries-annual-report-2012 57/152
Carlsberg Breweries Group
Note
24 Borrowings
DKK million 2012 2011
Non-current borrowings:
Issued bonds 29,021 19,478
Mortgages 1,248 1,248 Bank borrowings 5,722 13,071
Financial lease liabilities 35 38
Other non-current borrowings 453 302
Total 36,479 34,137
Current borrowings:
Issued bonds 1,826 -
Current portion of other non-current borrowings 283 159
Bank borrowings 1,179 1,386
Financial lease liabilities 4 14
Borrowings from Group Companies - 699
Other current borrowings 60 333
Total 3,352 2,591
Total non-current and current borrowings 39,831 36,728
Fair value 41,330 37,492
Borrowings are measured at amortised cost. The Group has designated a fixed-interest rate GBP 300m bond issue as the hedged item in the fair valuehedge with the designated risk being movements in a benchmark interest rate (floating interest rate). The carrying amount of this borrowing is thereforeadjusted for movements in the fair value due to movements in the benchmark rate. The carrying amount of this borrowing was DKK 2,999m in 2012.
57

7/22/2019 Carlsberg Breweries Annual Report 2012
http://slidepdf.com/reader/full/carlsberg-breweries-annual-report-2012 58/152
Carlsberg Breweries Group
Note
24 Borrowings
(Continued)
Time to maturity for non-current borrowings
DKK million 2012
1-2 years 2-3 years 3-4 years 4-5 years > 5 years Total
Issued bonds 7,443 - 2,999 7,402 11,177 29,021
Mortgages - - - - 1,248 1,248
Bank borrowings 400 5,263 56 3 - 5,722
Financial lease liabilities 4 4 4 4 19 35
Other non-current borrowings 204 150 56 30 13 453
Total 8,051 5,417 3,115 7,439 12,457 36,479
DKK million 2011
1-2 years 2-3 years 3-4 years 4-5 years > 5 years TotalIssued bonds 1,780 7,406 - 2,927 7,365 19,478
Mortgages - - - - 1,248 1,248
Bank borrowings 792 426 11,753 100 - 13,071
Financial lease liabilities 4 4 4 4 22 38
Other non-current borrowings 73 190 9 4 27 303
Total 2,649 8,026 11,766 3,035 8,662 34,138
58

7/22/2019 Carlsberg Breweries Annual Report 2012
http://slidepdf.com/reader/full/carlsberg-breweries-annual-report-2012 59/152
Carlsberg Breweries Group
Note
24 Borrowings
(Continued)
Interest rate risk at 31 December
2012
DKK million Interest rate
Average
effective
interest ra te Fixed for
Carrying
amount
Interest
rate risk
Issued bonds:
GBP 200m maturing 26 February 2013 Fixed 7.01% 0-1 year 1,826 Fair value
EUR 1,000m maturing 28 May 2014 Fixed 6.22% 1-2 years 7,443 Fair value
GBP 300m maturing 28 November 2016 Fixed 7.41% 3-4 years 2,999 Fair value
EUR 1,000m maturing 13 October 2017 Fixed 3.55% 4-5 years 7,402 Fair value
EUR 750m maturing 03 Juli 2019 Fixed 2.49% >5 years 5,629 Fair value
EUR 750m maturing 15 November 2022 Fixed 2.71% >5 years 5,548 Fair value
Total issued bonds 4.43% 30,847
Mortgages:
Floating rate Floating 1.51% 0-1 year 1,248 Cash flow
Total mortgages 1.51% 1,248
Bank borrowings:
Fixed rate Fixed 0-3 years 6,901 Fair value
Total bank borrowings 6,901
All interest rates stated in the table includes margin.
Interest rate**
DKK million Floating Fixed Floating % Fixed %
EUR 29,855 748 29,107 3% 97%
DKK -680 -680 - 100% -
PLN 1,504 1,504 - 100% -
USD 1,180 1,180 - 100% -
CHF 1,892 1,892 - 100% -
RUB -3,049 -3,049 - 100% - Other 3,381 3,314 67 98% 2%
Total 34,083 4,909 29,174 14% 86%
* After swaps and currency derivatives. ** Before currency derivatives.
e nanc a
interest-bearing
debt*
A cross-currency swap (GBP 300m) has been used to change the interest from fixed to floating 6-month EURIBOR +4.01%. The bond and the swap aredesignated as a fair value hedge relationship, meaning that the carrying amount of the bond is the fair value.
The floating-rate mortgage was repriced in December 2012 at a rate of 0.86%(excl. margin) commencing in January 2013 and will be repriced again in July
2013. The time to maturity is more than five years. The floating-rate mortgage is repriced semi-annually with reference to 6-month CIBOR.
The main part of the bank borrowings presented as having a fixed rate was originally a floating rate but has been swapped to a fixed rate of 5.24%. Theborrowing itself have a variable interest rate which have been swapped to fixed. The maturity of these interest rate swaps is between 6 month and 2½years.
EUR 750m maturing 3 July 2019 consists of two bonds of EUR 250m and EUR 500m. The EUR 500m bond was issued in July 2012, while the EUR 250mwas issued in November 2012.
59

7/22/2019 Carlsberg Breweries Annual Report 2012
http://slidepdf.com/reader/full/carlsberg-breweries-annual-report-2012 60/152
Carlsberg Breweries Group
Note
24 Borrowings(Continued)
2011
DKK million Interest rate
Average
effective
interest ra te Fixed for
Carrying
amount
Interest
rate risk
Issued bonds:
GBP 200m maturing 26 February 2013 Fixed 7.01% 1-2 year 1,780 Fair value
EUR 1,000m maturing 28 May 2014 Fixed 6.22% 2-3 year 7,406 Fair value
GBP 300m maturing 28 November 2016 Fixed 7.41% 4-5 years 2,927 Fair value
EUR 1,000m maturing 13 October 2017 Fixed 3.55% >5 years 7,365 Fair value
Total issued bonds 5.46% 19,478
Mortgages:
Floating rate Floating 1.73% 0-1 year 1,248 Cash flow
Total mortgages 1.73% 1,248
Bank borrowings:
Floating rate Floating 0-1 year 3,931 Cash flow
Fixed rate Fixed 1-4 years 10,526 Fair value
Total bank borrowings 14,457
All interest rates stated in the table are including margin.
Interest rate**
DKK million Floating Fixed Floating % Fixed %
EUR 30,415 4,924 25,491 16% 84%
DKK -2,450 -2,450 - 100% -
PLN 710 707 3 100% -
USD 1,601 1,588 13 99% 1%
CHF 2,469 2,469 - 100% -
RUB -1,249 -1,249 - 100% -
Other 2,124 283 1,841 -11% 111%
Total 33,620 6,272 27,348 19% 81%
* After swaps and currency derivatives. ** Before currency derivatives.
e nanc a
interest-bearing
debt*
The main part of the bank borrowings presented as having a fixed rate was originally at floating rate but has been swapped to a fixed rate of 5.36%.
The floating-rate mortgage was repriced in December 2011 at a rate of 1.28% (excl. margin) commencing in January 2012 and was repriced again in July2012. The time to maturity is more than five years. The floating-rate mortgage is repriced semi-annually with reference to 6-month CIBOR.
Carlsberg has repaid two mortgages (a total of DKK 525m) with a time to maturity of more than five years, which were originally at floating rates but wereswapped to fixed rates.
A cross-currency swap (GBP 300m) has been used to change the interest from fixed to floating 6-month EURIBOR +4.01%. The bond and the swap aredesignated as a fair value hedge relationship, meaning that the carrying amount of the bond is the fair value.
In December 2011 a GBP 250m bond matured and was repaid.
60

7/22/2019 Carlsberg Breweries Annual Report 2012
http://slidepdf.com/reader/full/carlsberg-breweries-annual-report-2012 61/152
Carlsberg Breweries Group
Note
24 Borrowings(Continued)
2012
Currency profile of borrowings before and after der ivat ive f inancial instruments Next repric ing (of principal before currency swaps)
DKK million Original principal
Effect of
swap After swap 2013 2014 2015 2016 2017 2018-CHF 52 1,853 1,905 52 - - - - -
DKK 1,243 -1,895 -652 1,243 - - - - -
EUR 30,237 290 30,527 1,130 7,499 2,988 4 7,406 11,210
GBP 5,240 -4,521 719 5,240 - - - - -
NOK 143 229 372 143 - - - - -
PLN 86 1,425 1,511 86 - - - - -
RUB 9 -634 -625 9 - - - - -
SEK 132 70 202 132 - - - - -
SGD 1 -342 -341 1 - - - - -
USD 2,173 34 2,207 2,173 - - - - -
Other 515 3,491 4,006 448 4 4 56 3 -
Total 39,831 - 39,831 10,657 7,503 2,992 60 7,409 11,210
Cf. also note 35, Financial risks.
2011
Currency profile of borrowings before and after der ivat ive f inancial instruments Next repric ing (of principal before currency swaps)
DKK million Original principalEffect ofswap After swap 2012 2013 2014 2015 2016 2017-
CHF 29 2,441 2,470 29 - - - - -
DKK 1,976 -4,422 -2,446 1,979 - - - - -
EUR 27,543 3,425 30,968 2,052 7,608 7,474 2,986 9 7,414
GBP 4,693 -4,489 204 2,913 1,780 - - - -
NOK -53 632 579 -53 - - - - -
PLN 58 658 716 54 1 2 - - -
RUB 9 -1,098 -1,089 9 - - - - -
SEK 81 -313 -232 81 - - - - -
SGD 24 -424 -400 24 - - - - -
USD 1,773 592 2,365 1,760 13 - - - -
Other 596 2,998 3,594 533 9 - 27 25 -
Total 36,729 - 36,729 9,381 9,411 7,476 3,013 34 7,414
61

7/22/2019 Carlsberg Breweries Annual Report 2012
http://slidepdf.com/reader/full/carlsberg-breweries-annual-report-2012 62/152
Carlsberg Breweries Group
Note
25 Retirement benefit obligations and similar obligations
DKK million 2012 2011
Retirement benefit obligations and similar obligations 3,917 3,218
Plan assets -4 -5
Net obligations 3,913 3,213
Specification of net obligations:
Present value of funded plans 9,983 8,893
Fair value of plan assets -7,648 -7,099
Net obligation for funded plans 2,335 1,794
Present value of unfunded plans 1,567 1,401
Payment in transit 11 18
Net obligations recognised 3,913 3,213
Specification of total obligations:
Present value of funded plans 9,983 8,893
Present value of unfunded plans 1,567 1,401
Total obligations 11,550 10,294
A number of plans are unfunded, primarily in Germany, Sweden and Italy.For these plans the retirement benefit obligations amount to approximately 14% (2011: 14%) of the total gross liability.
The defined benefit plans typically guarantee the employees covered a retirement benefit based on the final salary atretirement.
Defined benefit plans are recognised in the statement of financial position
as follows:
A number of the Group’s employees are covered by retirement benefit plans. The nature of the retirement benefit plans variesdepending on labour market conditions, legal requirements, tax legislation and economic conditions in the individual countries.Benefits are generally based on wages and salaries and length of employment. Retirement benefit obligations cover both
present and future retirees’ entitlement to retirement benefits.
Approximately 63% (2011: 73%) of the Group’s retirement benefit costs relate to defined contribution plans, which limit theGroup’s obligation to the contributions paid. The retirement benefit plans are funded by payments from the Group’s companiesand employees to funds that are independent of the Group.
The other plans are defined benefit plans. A retirement benefit obligation is recognised in the statement of financial positionbased on an actuarial calculation of the present value at the end of the reporting period less the plan assets. For defined benefitplans, the Group assumes the risk associated with future developments in interest rates, inflation, mortality and disability etc.
The retirement benefit plans in among other countries Switzerland, Norway, the United Kingdom and Hong Kong have assetsplaced in independent pension funds.
62

7/22/2019 Carlsberg Breweries Annual Report 2012
http://slidepdf.com/reader/full/carlsberg-breweries-annual-report-2012 63/152
Carlsberg Breweries Group
Note
25 Retirement benefit obligations and similar obligations
DKK million 2012 2011
Changes in obligations:
Total obligations at 1 January 10,294 9,294
Current service cost 115 176
Interest cost 380 376
Actuarial gains (-) and losses (+) 1,001 837
Benefits paid -511 -474
Curtailments and settlements -1 -103
Employee contributions to pension scheme 15 14
Transfer from other provisions 61 -3
Disposal of entities - -7
Foreign exchange adjustments etc. 196 184
Total obligations at 31 December 11,550 10,294
Changes in plan assets:
Fair value of assets at 1 January 7,099 6,904
Expected return 323 327
Actuarial gains (-) and losses (+) 262 -244
Contributions to plans 245 331
Benefits paid -415 -391
Foreign exchange adjustments etc. 134 172
Fair value of assets at 31 December 7,648 7,099
The Group expects to contribute DKK 23m (2011: DKK 23m) to the plan assets in 2013.
Actual return on plan assets:
Expected return 323 327
Actuarial gains (+) and losses (-) 262 -244
Actual return 585 83
Breakdown of plan assets:
DKK million % DKK million %
Shares 2,490 33% 2,172 31%
Bonds and other securities 3,460 45% 3,251 45%
Real estate 1,170 15% 1,346 19%
Cash and cash equivalents 528 7% 330 5%
Total 7,648 100% 7,099 100%
Plan assets do not include shares in or properties used by Group companies.
Calculation of the expected return on plan assets is based on a low-risk investment in bonds in the relevant countries. The rateof return is increased if the plan assets comprise shares and properties, which despite the increased risks are expected toprovide a higher rate of return than bonds.
2012 2011
Actuarial assumptions. The actuarial assumptions underlying the calculations and valuations vary from country to country dueto local economic conditions and labour market conditions.
63

7/22/2019 Carlsberg Breweries Annual Report 2012
http://slidepdf.com/reader/full/carlsberg-breweries-annual-report-2012 64/152
Carlsberg Breweries Group
Note
25 Retirement benefit obligations and similar obligations
2012 2011
Assumptions applied: RangeWeightedaverage Range
Weightedaverage
Discount rate 1.0 - 16.5% 3.0% 1.0 - 5.3% 3.6%
Expected return on plan assets 2.2 - 8.5 % 4.1% 0.4 - 5.4% 4.4%
Future salary increases 2.0 - 16.0 % 2.8% 2.0 - 8.0% 2.9%
Future retirement benefit increases 1.0 - 3.4 % 1.6% 1.0 - 3.8% 2.0%
DKK million 2012 2011
Recognised in income statement:
Current service cost 115 176
Expected return on plan assets -323 -327
Interest cost on obligations 380 376
Curtailments and settlements -1 -103
Total recognised in income statement 171 122
The cost is recognised in the income statement as follows:
Cost of sales 23 9
Sales and distribution expenses 64 42
Administrative expenses 26 25
Special items (restructuring) - -3
Total staff costs, cf. note 12 113 73
Financial income -323 -327
Financial expenses 381 376
Total 171 122
Recognised in other comprehensive income:
Recognised at 1 January -2,503 -1,410
Actuarial gains/losses -739 -1,081
Foreign exchange adjustment of foreign entities -62 -12
Recognised in other comprehensive income during the period -801 -1,093
Recognised at 31 December -3,304 -2,503
Of which accumulated actuarial gains/losses -3,329 -2,590
2012 2011 2010 2009 2008
DKK million
Five-year overview
Obligations 11,550 10,294 9,294 7,948 7,009
Plan assets -7,648 -7,099 -6,905 -5,823 -5,245
Deficit 3,903 3,195 2,389 2,125 1,764
Experience adjustments to obligations 231 82 108 -34 -492
Experience adjustments to plan assets -881 -506 -815 -544 100
64

7/22/2019 Carlsberg Breweries Annual Report 2012
http://slidepdf.com/reader/full/carlsberg-breweries-annual-report-2012 65/152
Carlsberg Breweries Group
Note
26 Deferred tax assets and deferred tax liabilities
DKK million 2012 2011
Deferred tax at 1 January, net 7,999 7,908
Adjustments to previous years -30 47 Entities acquired in a step acquisition - 60
Revaluation of previously recognised deferred tax acquired in a step acquisition - 43
Disposal of entities - 11
Recognised in other comprehensive income -193 -211
Recognised in income statement 10 205
Change in tax rate 27 -15
Effect of hyperinflation - 16
Foreign exchange adjustments -71 -65
7,742 7,999
Of which is transferred to Assets held for sale -4 -
Deferred tax at 31 December, net 7,738 7,999
Specified as follows:
Deferred tax liabilities 8,930 8,870
Deferred tax assets -1,192 -871
Deferred tax at 31 December, net 7,738 7,999
Specification of deferred tax assets and liabilities at 31 December:
DKK million 2012 2011 2012 2011
Intangible assets 502 549 7,107 6,959
Property, plant and equipment 403 241 2,528 2,676
Current assets 109 84 52 45
Provisions and retirement benefit obligations 840 690 261 359
Fair value adjustments 20 120 150 212
Tax losses etc. 1,573 1,495 1,091 926
Total before set-off 3,447 3,179 11,189 11,178
Set-off -2,255 -2,308 -2,255 -2,308
Transferred to assets held for sale 0 - -4 -
Deferred tax assets and liabilities at 31 December 1,192 871 8,930 8,870
Expected to be used as follows:
Within 12 months after the end of the reporting period 219 150 507 277
More than 12 months after the end of the reporting period 973 721 8,423 8,593
Total 1,192 871 8,930 8,870
Deferred tax on temporary differences relating to investments in subsidiaries, joint ventures and associates amounts to DKK 0m (2011: DKK 0m).
Deferred tax of DKK160m (2011:DKK 0m) has been recognised in respect of earnings in the Eastern Europe regionwhichare intended for distributionin the short term, as tax of 5% is payable on distributions. For other subsidiaries where distributable reserves are planned to be distributed, anydistribution of earnings will not trigger a significant tax liability based on current tax legislation.
Deferred tax assets Deferred tax liabilities
Deferred tax assets and liabili ties are offset in the consolidated statement of financial position if the Group has a legally enforceable right to set off current tax liabilities, and the deferred tax assets and liabilities relate to the same legal tax entity/consolidation.
Of the total deferred tax assets recognised, DKK 705m (2011: DKK 836m) relate to tax loss carryforwards, the uti lisation of which depends on futurepositive taxable income exceeding the realised deferred tax liabilities.
Tax assets of DKK 1,248m (2011: DKK 1,435m) were not recognised. These relate primarily to tax losses which are not expected to be uti lised in theforeseeable future. Tax losses that will not expire amount to DKK 1,000m (2011: DKK 1,138m).
65
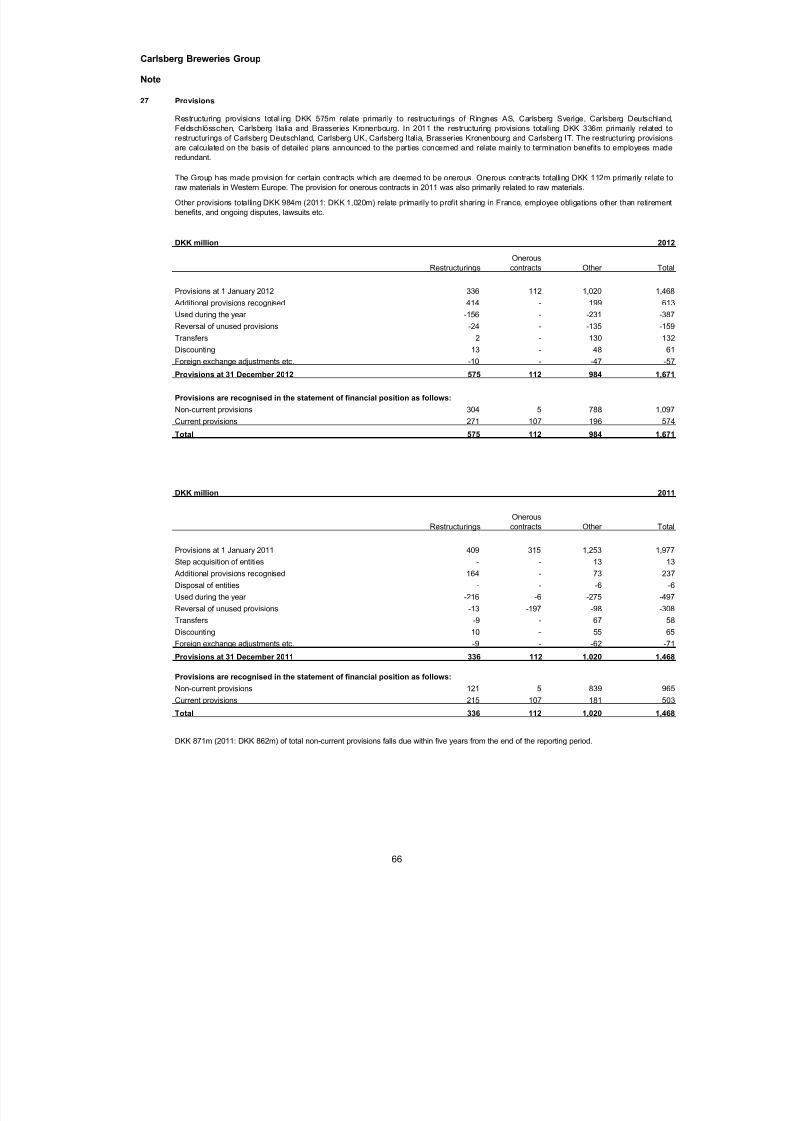
7/22/2019 Carlsberg Breweries Annual Report 2012
http://slidepdf.com/reader/full/carlsberg-breweries-annual-report-2012 66/152
Carlsberg Breweries Group
Note
27 Provisions
DKK million 2012
RestructuringsOnerouscontracts Other Total
Provisions at 1 January 2012 336 112 1,020 1,468
Additional provisions recognised 414 - 199 613
Used during the year -156 - -231 -387
Reversal of unused provisions -24 - -135 -159
Transfers 2 - 130 132
Discounting 13 - 48 61
Foreign exchange adjustments etc. -10 - -47 -57
Provisions at 31 December 2012 575 112 984 1,671
Provisions are recognised in the statement of financial position as follows:
Non-current provisions 304 5 788 1,097
Current provisions 271 107 196 574
Total 575 112 984 1,671
DKK million 2011
RestructuringsOnerouscontracts Other Total
Provisions at 1 January 2011 409 315 1,253 1,977
Step acquisition of entities - - 13 13
Additional provisions recognised 164 - 73 237
Disposal of entities - - -6 -6
Used during the year -216 -6 -275 -497
Reversal of unused provisions -13 -197 -98 -308
Transfers -9 - 67 58 Discounting 10 - 55 65
Foreign exchange adjustments etc. -9 - -62 -71
Provisions at 31 December 2011 336 112 1,020 1,468
Provisions are recognised in the statement of financial position as follows:
Non-current provisions 121 5 839 965
Current provisions 215 107 181 503
Total 336 112 1,020 1,468
DKK 871m (2011: DKK 862m) of total non-current provisions falls due within five years from the end of the reporting period.
Restructuring provisions totalling DKK 575m relate primarily to restructurings of Ringnes AS, Carlsberg Sverige, Carlsberg Deutschland,Feldschlösschen, Carlsberg Italia and Brasseries Kronenbourg. In 2011 the restructuring provisions totalling DKK 336m primarily related torestructurings of Carlsberg Deutschland, Carlsberg UK, Carlsberg Italia, Brasseries Kronenbourg and Carlsberg IT. The restructuring provisionsare calculated on the basis of detailed plans announced to the parties concerned and relate mainly to termination benefits to employees made
redundant.
The Group has made provision for certain contracts which are deemed to be onerous. Onerous contracts totalling DKK 112m primarily relate toraw materials in Western Europe. The provision for onerous contracts in 2011 was also primarily related to raw materials.
Other provisions totalling DKK 984m (2011: DKK 1,020m) relate primarily to profit sharing in France, employee obligations other than retirementbenefits, and ongoing disputes, lawsuits etc.
66

7/22/2019 Carlsberg Breweries Annual Report 2012
http://slidepdf.com/reader/full/carlsberg-breweries-annual-report-2012 67/152
Carlsberg Breweries Group
Note
28 Other liabilities etc.
DKK million 2012 2011
Other liabilities are recognised in the statement of financial position as follows:
Non-current liabilities 1,201 1,087
Current liabilities 9,624 10,570
Total 10,825 11,657
Other liabilities by origin:
Excise duties and VAT payable 3,690 3,512
Staff costs payable 1,590 1,555
Interest payable 812 731
Fair value of hedging instruments 606 1,197
Liabilities related to the acquisition of entities 1,129 1,459
Amounts owed to associates 2 1
Deferred income 1,139 1,117 Other 1,857 2,085
Total 10,825 11,657
67

7/22/2019 Carlsberg Breweries Annual Report 2012
http://slidepdf.com/reader/full/carlsberg-breweries-annual-report-2012 68/152
Carlsberg Breweries Group
Note
29 Cash flows
DKK million 2012 2011
Adjustment for other non-cash items:Share of profit after tax, associates -112 -174
Gains on disposal of property, plant and equipment and intangible assets, net -112 -67
Amortisation of on-trade loans etc. 547 623
Total 323 382
Change in trade working capital:
Inventories -202 -206
Receivables 206 -1,236
Trade payables and other liabilities 861 1,803
Total 865 361
Change in other working capital:
Other receivables -164 117
Other payables -36 240
-294 -687
Adjusted for unrealised foreign exchange gains/losses -11 -136
Total -505 -466
Change in on-trade loans:
Loans provided -1,089 -1,052
Repayments 642 534
Total -447 -518
Change in financial receivables:
Loans and other receivables -65 -83
Other financial receivables - -17
Repayments 37 54
Total -28 -46
Non-controlling interests:
Acquisition of non-controlling interests -4,916 -1,338
Dividends to non-controlling interests -282 -121
Share buy-back - -417
Total -5,198 -1,876
External financing:
Proceeds from issue of bonds 11,160 -
Repayment of bonds including cross-currency swap - -2,965
Debt institutions, long term -7,187 1,418
Debt institutions, short term -848 533
Intercompany loans, long term 42 -
Intercompany loans, short term 144 -1,476
Loans from associates -65 -30
Finance lease liabilities -14 -12
Other financing liabilities 31 -249
Total 3,263 -2,781
Retirement benefit obligations and other liabilities related to operating activities before special items
68

7/22/2019 Carlsberg Breweries Annual Report 2012
http://slidepdf.com/reader/full/carlsberg-breweries-annual-report-2012 69/152
2011
DKK million
Previous
method of
consolidation
Previously held
ownership
interest
Acquired
ownership
interest
Total
Carlsberg
interest
Acquisition
date
Main
activity Cost
Acquired entity:
Lao Brewery Co. Ltd. Proportionate 50.00% 1.00% 51.00% 30 Aug. 2011 Brewery 33
Hue Brewery Ltd. Proportionate 50.00% 50.00% 100.00% 23 Nov. 2011 Brewery 485
Total 518
DKK million
Lao Brewery
Co. Ltd.
Hue Brewery
Ltd. Total
Intangible assets 130 108 238 237 475
Property, plant and equipment 251 91 342 -42 300
Inventories 24 14 38 -3 35
Loans and receivables, current 20 3 23 - 23
Cash and cash equivalents 125 66 191 - 191
Provisions -13 - -13 - -13
Deferred tax assets and liabilities, net -31 -29 -60 -43 -103
Borrowings -18 -17 -35 - -35
Trade payables and other payables -52 -81 -133 - -133
Net assets 436 155 591 149 740
Lao Brewery
Co. Ltd. Hue Brewery Ltd. Total
Fair value of consideration transferred for acquired ownership interest 33 485 518
Fair value of previously held ownership interest 1,665 451 2,116
Fair value of non-controlling ownership interest 1,632 - 1,632
Fair value of entities acquired in stages, total 3,330 936 4,266
Carrying amount of identified assets and liabilities recognised before step acquisition 368 74 442
Revaluation of identified assets and liabilities recognised before step acquisition 68 81 149
Fair value of acquired identified assets, liabilities and contingent liabilities 436 155 591
Fair value of identified assets, liabilities and contingent liabilities 872 310 1,182
Total goodwill 2,458 626 3,084
Goodwill recognised before a step acquisition 344 28 372
Change in total recognised goodwill 2,114 598 2,712
Goodwill is attributable to:
Shareholders in Carlsberg A/S 1,253 626 1,879
Non-controlling interests 1,205 - 1,205
Total goodwill 2,458 626 3,084
Gain on revaluation of previously held ownership interest in entities acquired in a step acquisition:
Carrying amount of previously held ownership interest -712 -102 -814
Fair value of previously held ownership interest 1,665 451 2,116
Recycling of cumulative exchange differences 44 -46 -2
Total 997 303 1,300
- 485 485
-125 -66 -191
Total cash consideration paid -125 419 294
Capital injection in kind 33 - 33
Total consideration transferred -92 419 327
Contingent consideration
In 2012 Carlsberg revalued contingent considerations for the previous acquisition of shareholdings in Gorkha Brewery, Nepal, South Asian Breweries Pte. Ltd., Singapore and
Olivaria, Belarus. The revaluations are based on updated information since the initial recognition of the liabilities including new budgets and sales forecasts , discount rates etc. The
total revaluation recognised in 2012 is DKK 17m (2011: DKK 349m).
DKK million
Cash and cash equivalents, acquired
Acquired cash only comprised the additional consolidated share in the step acquisition due to the change from proportional to full consolidation equalling the difference between the
previous ownership interest and 100%.
Total recognised
net assets
from acquisition
Acquired share of net assets recognised at fair value Revaluation of
previously recognised
net assets at fair value
Elements of cash consideration paid:
Cash
69

7/22/2019 Carlsberg Breweries Annual Report 2012
http://slidepdf.com/reader/full/carlsberg-breweries-annual-report-2012 70/152
Carlsberg Breweries Group
Note
30 Acquisition and disposal of entities
The fair value of the non-controlling ownership interest was estimated based on the net present value of expected future cash flows f rom the entity, the cost of newly acquired
shareholdings in the entity, excluding control premium, and other fair value models as applicable for the transaction. The key assumptions applied for the Lao Brewery Co. Ltd.
transaction were an after-tax WACC of 11.4% and a terminal growth rate of 2.5%.
Acquired net assets of entities acquired in a step acquisition included receivables from customers at a fair value of DKK 11m. None of the acquired receivables from customers
were considered irrecoverable at the time of acquisition.
In Q4 2011, Carlsberg acquired additional 50% of the shareholding in the joint venture Hue Brewery Ltd. and thereby gained control through a step acquisition. The shareholdings
held immediately before obtaining control was recognised at fair value with the revaluation adjustment, DKK 303m, recognised in special items. The purchase price allocation of the
fair value of identified assets, liabilities and contingent liabilities has been completed, which has not resulted in any changes to the recognised amounts.
This step acquisition was a natural step for Carlsberg and in line with the strategy of obtaining full control of key operating activities. The calculation of goodwill represents staff
competences as well as expectations of positive growth.
The acquired entities contributed positively to operating profit before special items for 2011 by approximately DKK 61m and to the profit for the year by approximately DKK 29m. The
net profit for the year, had the acquisitions been completed at 1 January 2011, was es timated at DKK 5,966m.
During 2011, Carlsberg acquired 22.5% in Q2 and an additional 4% in Q4 of the shares in the jointly controlled entity South Asian Breweries Pte. Ltd., which is recognised by
proportional consolidation due to terms in the shareholder agreement with the partner. The purchase price allocation of the fair value of identified assets, liabilities and contingent
liabilities in both acquisitions has been completed. The fair value of identified assets, liabilities and contingent liabilities less the cost of the acquisitions, DKK 101m in total, was
recognised as goodwill.
Step acquisition of entities
In 2011, Carlsberg gained control of Lao Brewery Co. Ltd. in Laos and Hue Brewery Ltd. in Vietnam. Previously both entities were proportionally consolidated.
Goodwill recognised regarding transactions completed in 2011 was not deductible for tax purposes.
Revaluation of previously recognised net assets at fair value includes revaluation at fair value of net assets that were proportionally consolidated prior to the step acquisition of the
entity.
In Q3 2011, Carlsberg acquired an additional 1% of the shareholding in the joint venture Lao Brewery Co. Ltd. in a disproportionate capital increase where Carlsberg contributed
assets in kind, thus gaining control of the entity in a step acquisition. The fair value of the consideration injected amounted to DKK 33m. The shareholdings held immediately before
obtaining control was recognised at fair value with the revaluation adjustment, DKK 997m, recognised in special items. The purchase price allocation of the fair value of identified
assets, liabilities and contingent liabilities has been completed, which has not resulted in any changes to the recognised amounts.
This step acquisition was a natural step for Carlsberg and in line with the strategy of obtaining full control of key operating activities. The calculation of goodwill represents staff
competences as well as expectations of positive growth. Goodwill related to the non-controlling interests’ share of Lao Brewery Co. Ltd. was recognised as part of goodwill.
The Group has not completed any acquisitions of entities during 2012.
Acquisition of entities
In 2012, the purchase price of part of the act ivities in S&N (acquired in 2008) has been adjusted by DKK 4m as a result of allocation of debt according to agreement. The
adjustment was recognised as goodwill. The purchase price is expected to be further adjusted depending on the final allocation of debt according to agreement.
Acquisition of proportionally consolidated entities
In Q2 2012, Carlsberg acquired 6% of the shares in the jointly controlled entity South Asian Breweries Pte. Ltd., which is recognised by proportional consolidation. The purchase
price allocation of the fair value of identified assets, liabilities and contingent liabilities in the acquisition has not yet been completed. The fair value of identified assets, liabilities and
contingent liabilities less the cost of the acquisition, (DKK 23m), is recognised as goodwill (DKK 17m). Accounting for the acquisition will be completed within the 12-month period
required by IFRS 3.
70

7/22/2019 Carlsberg Breweries Annual Report 2012
http://slidepdf.com/reader/full/carlsberg-breweries-annual-report-2012 71/152
Carlsberg Breweries Group
Note
30 Acquisition and disposal of entities
DKK million 2012 2011
Net assets disposed of - 336
Gains/losses recognised under special items - -76
Cash consideration received - 260
Cash and cash equivalents disposed of - -51
Cash inflow, net - 209
DKK million 2012 2011
Acquisition and disposal of entities, net:
Step acquisitions, cash outflow - -294 Acquisitions of proportionally consolidated entities, cash outflow -23 -175
Payment regarding acquisition in prior period -4 -
Disposals, cash inflow - 209
Net -27 -260
Disposal of entities
No entities were disposed of in 2012.
In Q1 2011, Carlsberg disposed of the subsidiary Dresden Brauerei, Germany, at a sales price of DKK 126m.The entity had a carrying amount of DKK 116m, resulting in a gain of DKK 10m, which was recognised inspecial items. Prior to the sale, an impairment loss of DKK 128m had been recognised in 2010 on the breweryassets, corresponding to the difference between the carrying amount and the expected sales price.
In Q2 2011, Carlsberg disposed of the subsidiary Sorex Holding SAS, a logistical company in France, at asales price of DKK 134m. The entity had a carrying amount of DKK 220m, including goodwill of DKK 6m,resulting in a loss of DKK 86m, which was recognised in special items.
71

7/22/2019 Carlsberg Breweries Annual Report 2012
http://slidepdf.com/reader/full/carlsberg-breweries-annual-report-2012 72/152
Carlsberg Breweries Group
Note
31 Acquisition and disposal of non-controlling interests
2012
DKK million
Entity
Baltika
Breweries1
PJSCCarlsberg
Ukraine
UAB Svyturys-Utenos
Alus2 JSC Aldaris3
CarlsbergSouth East
Europe4
The Bottlingand Brewing
Group Ltd.
Other
entities5
Country Russia Ukraine Lithuania Latvia Malawi
Paid -4,296 -15 20 -27 -393 -35 -170 -4,916
Change in provision for put option - - - 26 393 - -46 373
Proportionate share of equity acquired 2,650 1 3 - - 21 -1 2,674
Difference recognised directly in equity -1,646 -14 -2 -1 - -14 -220 -1,897
Difference recognised in goodwill - - 25 - - - 3 28
Effects of changes in Carlsberg's ownership interest on the equity attributable to Carlsberg:
1 January 2012 31,065 1,839 954 232 881 - 1,603 36,574
Effect of acquisition 2,650 1 3 - - 21 -1 2,674
Comprehensive income 3,749 272 57 -109 11 - 169 4,149
Dividends, capital injections etc. 400 -155 1 1 -26 -21 -106 94
31 December 2012 37,864 1,957 1,015 124 866 - 1,665 43,491
2011
DKK million
Entity
Baltika
Breweries6
CarlsbergSerbia
d.o.o.7
CarlsbergCroatia
d.o.o.7
CarlsbergBulgaria
AD7
PJSCCarlsberg
Ukraine
UAB Svyturys-Utenos
Alus8
Other
entities9
Country Russia Serbia Croatia Bulgaria Ukraine Lithuania
Paid -866 - - - -59 -373 -40 -1,338
Change in provision for put option - -194 -92 -107 - 482 -402 -313
Proportionate share of equity acquired/disposed 1,127 80 56 48 39 -21 24 1,353
Difference recognised directly in equity 261 - - - -20 - -417 -176
Difference recognised in goodwill - -114 -36 -59 - 88 -1 -122
Effects of changes in Carlsberg's ownership interest on the equity attributable to Carlsberg:
1 January 2011 30,590 285 232 180 1,551 1,126 1,609 35,573
Effect of acquisition/disposal 1,127 80 56 48 39 -21 24 1,353
Comprehensive income 1,649 25 9 -6 366 54 -168 1,929
Dividends, share buy-back, capital injections etc. -2,301 -1 -22 -5 -117 -205 -29 -2,680
31 December 2011 31,065 389 275 217 1,839 954 1,436 36,175
8) Non-controlling interests of UAB Svyturys-Utenos Alus (Lithuania) exercised put options held against the Group. Carlsberg also derecognised a put liability related to a smaller shareholding.
9) Comprises transactions with shareholdings in OJSC Olivaria Brewery (Belarus), Carlsberg South Asia Pte. Ltd. (Singapore), Carlsberg Kazakhstan, JSC Aldaris (Latvia), Lao Soft Drinks Co. Ltd.and Parag Breweries Limited (India).
5) Comprises transactions with shareholdings in OJSC Olivaria Brewery (Belarus), Carlsberg South Asia Pte. Ltd. (Singapore), Carlsberg Kazakhstan, Lao Brewery Co. Ltd. (Laos) and CarlsbergDistributers Taiwan Ltd.
6) In addition to acquiring non-controlling interests, Carlsberg transferred title of some of its ownership interests in Baltika Breweries as part of an arrangement to provide financing for Carlsberg’s
operating activities. In accordance with IFRS, the ownership interest was not derecognised in the consolidated financial statements.
7) Non-controlling interests of Carlsberg Serbia d.o.o., Carlsberg Croatia d.o.o. and Carlsberg Bulgaria AD negotiated sale of their shareholdings to Carlsberg.
2) Adjustment to the acquisition price for non-controlling interests acquired in 2011 is due to dividens received for 2011 (see item 8). In addition the Group acquired a small portion of non-controllinginterests in 2012.
3) In January 2012 Carlsberg completed the voluntary offer to the non-controlling interests in JSC Aldaris (Latvia) that was initiated in December 2011 .
4) In January 2012 Carlsberg settled the acquisition of non-controlling interests in Carlsberg Serbia d.o.o., Carlsberg Croatia d.o.o. and Carlsberg Bulgaria AD negotiated in 2011 (see item 7).
Increase in ownership
Increase in ownership
1) In June 2012 Baltika Breweries completed a cancellation of 7,954,071 treasury shares acquired in the share buy-back in 2011. After the cancellation, Carlsberg completed a voluntary offer to thenon-controlling interests in Baltika Breweries in August 2012, followed by a compulsory purchase of all outstanding shares completed in November 2012. In total Carlsberg increased the shareholdingby 13,058,025 shares in the two transactions, leaving Carlsberg as the sole shareholder of Baltika Breweries.
72

7/22/2019 Carlsberg Breweries Annual Report 2012
http://slidepdf.com/reader/full/carlsberg-breweries-annual-report-2012 73/152
Carlsberg Breweries Group
Note
32 Specif ication of invested capital
DKK million 2012 2011
Invested capital is calculated as follows:
Total assets 141,948 136,195
Less:
Deferred tax assets -1,192 -871
Loans to associates (current) -126 -105
Loans to Group companies (current) -634 -1,451
Interest income receivable, fair value of hedging instruments and financial receivables -612 -528
Securities (current and non-current) -133 -130
Cash and cash equivalents -5,748 -3,108
Assets held for sale -27 -235
Assets included 133,476 129,767
Trade payables -11,906 -11,039
Deposits on returnable packaging -1,381 -1,291
Provisions, excluding restructuring -1,096 -1,132
Corporation tax -551 -533 Deferred income -1,139 -1,117
Finance lease liabilities, included in borrowings -39 -52
Other l iabilities, excluding deferred income, interest payable and fair value of hedging instruments -8,268 -8,611
Liabilities offset -24,380 -23,775
Invested capital 109,096 105,992
73

7/22/2019 Carlsberg Breweries Annual Report 2012
http://slidepdf.com/reader/full/carlsberg-breweries-annual-report-2012 74/152
Carlsberg Breweries Group
Note
33 Specification of net interest-bearing debt
DKK million 2012 2011
Net interest-bearing debt is calculated as follows:
Non-current borrowings 36,479 34,137
Current borrowings 3,352 2,591
Gross interest-bearing debt 39,831 36,728
Cash and cash equivalents -5,748 -3,108
Loans to associates, interest-bearing portion -110 -97
Loans to partners -226 -230
On-trade loans -2,022 -2,066
Non-interest-bearing portion 1,015 1,033
Other receivables -1,813 -1,267
Non-interest-bearing portion 1,346 1,238
Receivables from group companies, interest-bearing portion -634 -1,451 Net interest-bearing debt 31,639 30,780
Changes in net interest-bearing debt:
Net interest-bearing debt at 1 January 30,780 32,847
Cash flow from operating activities -10,138 -9,789
Cash flow from investing activities, excl acquisition of entities, net 5,861 5,136
Cash flow from acquisition of entities, net 27 -260
Share buy-back - 417
Dividends to shareholders and non-controlling interests 282 121
Acquisition of non-controlling interests 4,916 1,338
Acquired net interest-bearing debt from acquisition/disposal of entities -9 53
Change in interest-bearing lending 18 18
Settlement of financial instruments in relation to loan agreements - 805
Effect of currency translation 326 289
Other -424 -195
Total change 859 -2,067
Net interest-bearing debt at 31 December 31,639 30,780
74
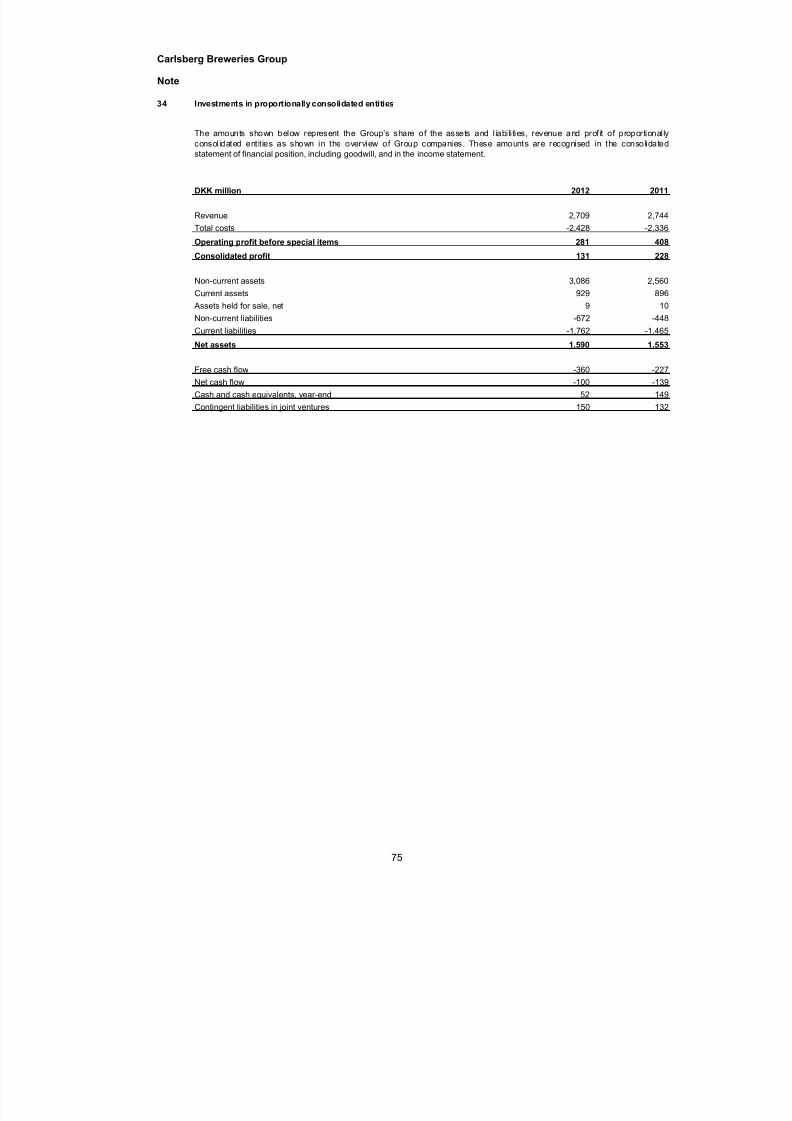
7/22/2019 Carlsberg Breweries Annual Report 2012
http://slidepdf.com/reader/full/carlsberg-breweries-annual-report-2012 75/152
Carlsberg Breweries Group
Note
34 Investments in proportionally consolidated entities
DKK million 2012 2011
Revenue 2,709 2,744
Total costs -2,428 -2,336
Operating profit before special items 281 408
Consolidated profit 131 228
Non-current assets 3,086 2,560
Current assets 929 896
Assets held for sale, net 9 10
Non-current liabilities -672 -448
Current liabilities -1,762 -1,465
Net assets 1,590 1,553
Free cash flow -360 -227
Net cash flow -100 -139
Cash and cash equivalents, year-end 52 149
Contingent liabilities in joint ventures 150 132
The amounts shown below represent the Group’s share of the assets and liabilities, revenue and profit of proportionallyconsolidated entit ies as shown in the overview of Group companies. These amounts are recognised in the consolidated
statement of financial position, including goodwill, and in the income statement.
75

7/22/2019 Carlsberg Breweries Annual Report 2012
http://slidepdf.com/reader/full/carlsberg-breweries-annual-report-2012 76/152
Carlsberg Breweries Group
Note
35 Financial risks
The Group’s activities create exposure to a variety of financial risks. These risks include market risk (foreignexchange risk, interest rate risk and raw material risk), credit risk and liquidity risk.
The Group’s financial risks are managed by Group Treasury in accordance with the Financial RiskManagement Policy approved by the Supervisory Board and are an integrated part of the overall riskmanagement process in Carlsberg. The risk management framework is described in the Management review.
As the Group did not identify any additional financial risk exposures in 2012, the risk management activitieswere unchanged compared to 2011.
Capital structure
Management regularly assesses whether the Group’s capital structure is in the interests of the Group and itsshareholders. The overall objective is to ensure a continued development and strengthening of the Group’scapital structure which supports long-term profitable growth and a solid increase in key earnings andstatement of financial position ratios.
This includes the assessment of and decision on the split of financing between share capital and loans,which is a long-term strategic decision to be made in connection with major acquisitions and similartransactions.
As an element of strategic capital structure decisions, management assesses the risk of changes in theGroup’s investment grade rating. In 2006 the Carlsberg Breweries Group was awarded investment-graderatings by Moody’s Investor Service and Fitch Ratings. In February 2011 these ratings were upgraded one
notch each by both rating agencies. The current rating is Baa2 from Moody’s and BBB from Fitch, both witha stable outlook.
Other operational decisions relate to the issue of bonds, and the entering into and changing of bank loanagreements. To facilitate these decisions and manage the operational capital structure, managementassesses committed credit facilities, expected future cash flows and the net debt ratio.
At 31 December 2012, the Carlsberg Breweries Group had net interest-bearing debt totalling DKK 31,639m(2011: DKK 30,780m). The credit resources available and the access to unused committed credit facilitiesare considered reasonable in the light of the Group’s current needs in terms of financial flexibility.
Comitted non-current credit facilities at 31 December
DKK million 2012 2011
1-2 years 8 050 3.430
2-3 years 14 313 8.026
3-4 years 9 083 13.129
4-5 years 7.439 8.985
>5 years 12.457 8.638
Total 51.342 42.208
Current borrowings 3 352 2.591
Non-current borrowings 36.479 34.137
Total 39.831 36.728
76

7/22/2019 Carlsberg Breweries Annual Report 2012
http://slidepdf.com/reader/full/carlsberg-breweries-annual-report-2012 77/152
Market riskMarket risk is the risk of changes in market prices, such as foreign exchange rates and interest rates, thatwill affect the Group’s net result and/or equity.
To minimise the exposure to these risks, the Group enters into a variety of financial instruments and
generally seeks to apply hedge accounting to minimise volatility in profit and loss.
Foreign exchange risk
A significant part of the Group’s activities and investments take place outside Denmark and in currenciesother than DKK. Foreign exchange risk is therefore a principal financial risk for the Group and, as such,exchange rate fluctuations can have a significant impact on the income statement and the statement offinancial position.
The Group is exposed to foreign exchange risks on revenue and purchases, as the predominant part ofrevenue and purchases originates from foreign entities and is translated into the Group’s functional currency,DKK. The Group is primarily exposed to RUB and secondarily to the currencies stated in the table below.There is also some exposure to a number of Asian currencies, which in total represent approximately 15% of
the Group’s operating profit. The exposure to fluctuations in EUR/DKK is considered insignificant due toDenmark’s fixed exchange rate policy towards EUR. Despite turmoil in the Eurozone for the past 2-3 years,the DKK has moved in a narrow band against the EUR. Carlsberg monitors and will continue to monitor therisks related to the EUR.
Furthermore, the Group has a foreign exchange risk on cash flow from operations in countries where there isno natural hedge relationship between cash flow from operations and loans.
Revenue exposure to currencies is illustrated below:
The Group has chosen not to hedge the exposure arising from translation of revenue or earnings in foreigncurrencies, but does in certain cases hedge specific cash flows such as dividends to be received in foreigncurrencies. Net investment hedges (described in the section “Investment in and financing of local entities”)do to some extent provide an economic hedge of the exposure arising from translation of revenue orearnings in foreign currencies.
The Group is exposed to transaction risks on purchases and sales in currencies other than the functionalcurrency of the local entities. It is therefore Group policy to hedge future cash flows in currencies other thanthe functional currency of the entities for a one-year period. This policy applies to Western Europe, excludingsome of the Baltic and Balkan States. Hedging is carried out when plans for the following year are beingprepared, effectively hedging the entities’ operating profit in local currency. Since a major part of thepurchases in foreign currency are in EUR, this will not constitute a risk at Group level. However, at Group
77

7/22/2019 Carlsberg Breweries Annual Report 2012
http://slidepdf.com/reader/full/carlsberg-breweries-annual-report-2012 78/152
level these hedges are effectively an economic hedge of (parts of) the net revenue in the relevant currency,and are accounted for as cash flow hedges at Group level.
Impact from Eastern Europe. The foreign exchange risk in the entities in Eastern Europe is manageddifferently from Carlsberg’s operations in the main parts of the rest of the Group. The reason is the excessive
cost of hedging these currencies over a longer period of time.
With regard to transaction risk, it is a long-standing principle in Baltika Breweries to reduce the financial riskmeasured in RUB by balancing expenses in the foreign currencies USD and EUR. This procedure reducesthe transaction risk. However, appreciation and depreciation of RUB have affected and will continue to affectoperating profit measured in both DKK and RUB.
Investment in and f inancing of local ent i t ies . The Group is exposed to foreign exchange risk onborrowings denominated in a currency other than the functional currency of the individual Group entity.
The main principle for funding of subsidiaries is that loans and borrowings should be in local currency orhedged to local currency to avoid foreign exchange risk. However, in some Group entities debt isdenominated in a currency other than the local entity’s functional currency without the foreign exchange risk
being hedged. This applies primarily to a few entities in Eastern Europe and is based on an assessment ofthe alternative cost of financing the entity in the local currency. For the countries concerned, the interest ratelevel in the local currency, and thus the additional cost of financing in local currency, is so high that it justifiesa foreign exchange risk. In some countries financing in local currency is not available at all.
The tables in the sensitivity analysis below show the impact from a 10% adverse development in exchangerates for the relevant currencies at 31 December.
At 31 December 2012, 87% of the Group’s net financial debt was in EUR (2011: 90%), cf. note 24.
The Group holds a number of investments in foreign subsidiaries where the translation of net assets to DKKis exposed to foreign exchange risks. The Group uses net investment hedges to hedge part of this foreignexchange exposure by taking up borrowings denominated in the relevant currencies or by entering into
forward exchange contracts. This applies to net investments in CHF, CNY, GBP, MYR, NOK, PLN, RUB andSEK. The basis for hedging is reviewed annually, and the two parameters, risk reduction and cost, arebalanced. The effect of net investment hedges on the income statement and other comprehensive income issummarised in note 36.
The most significant net risk relates to foreign exchange adjustment of net assets in RUB, which has onlybeen hedged to a minor extent.
Applied exchange rates. The DKK exchange rates applied for the most significant currencies whenpreparing the consolidated financial statements are presented below. The average exchange rate for theyear was calculated using the monthly exchange rates weighted according to the phasing of the Group’s netrevenue throughout the year.
DKK 2012 2011 2012 2011
Swiss Franc (CHF) 6.1758 6.1157 6.1777 6 0678
Chinese Yuan (CNY) 0.9079 0.9112 0.9204 0 8260
Euro (EUR) 7.4604 7.4342 7.4431 7.4514
Pound Sterling (GBP) 9.1320 8.9000 9.1931 8 6019
Malaysian Ringgit (MYR) 1.8486 1.8108 1.8735 1.7545
Norwegian Krone (NOK) 1.0167 0.9588 0.9973 0 9562
Polish Zloty (PLN) 1.8281 1.6676 1.7791 1 8245
Russian Rouble (RUB) 0.1855 0.1784 0.1863 0.1827
Swedish Krone (SEK) 0.8714 0.8342 0.8565 0 8248
Ukrainian Hryvnia (UAH) 0.7080 0.7219 0.7315 0 6679
Average RateClosing Rate
78

7/22/2019 Carlsberg Breweries Annual Report 2012
http://slidepdf.com/reader/full/carlsberg-breweries-annual-report-2012 79/152
Impact on financial statements and sensitivity analysis
Impact on operat ing prof i t . Developments in exchange rates between DKK and the functional currencies offoreign entities had a positive impact compared to 2011 on the Group’s operating profit measured in DKK.Operating profit was improved as a result of an increase in the average rates for NOK/DKK (4%), GBP/DKK
(7%), MYR/DKK (7%), SEK/DKK (4%), RUB/DKK (2%) and UAH/DKK (10%).
Impact on financi al items , net . In 2012, the Group had net gains on foreign exchange and fair valueadjustments of financial instruments of DKK 7m (2011: DKK -10m).
Impact on statement of f inancia l posi t ion . Fluctuations in foreign exchange rates will also affect the levelof debt as funding is obtained in a number of currencies. In 2012, net interest-bearing debt increased byDKK 327m (2011: DKK 289m) due to movements in foreign exchange rates. The primary impact derivesfrom net debt in GBP and EUR; the GBP/DKK rate appreciated from 8.9 at the end of 2011 to 9.13 at theend of 2012, and EUR/DKK appreciated from 7.4342 at the end of 2011 to 7.4604 at the end of 2012.
Impact on other comp rehensive incom e . For 2012, the total gain on net investments, loans granted tosubsidiaries as an addition to the net investment and net investment hedges amounted to DKK 1,686m
(2011: DKK -1,956m). Gains were primarily incurred in RUB, as the RUB/DKK rate appreciated by 4% fromthe end of 2011 to the end of 2012.
Sensi t iv i ty analysis . An adverse development in the exchange rates would, all other things being equal,have the following impact on the consolidated profit and loss for 2012. The hypothetical impact ignores thefact that the subsidiaries’ initial recognition of revenue, cost and debt would be similarly exposed to thechanges in the exchange rates. The calculation is made on the basis of balance sheet items at 31 December.
2012
DKK million
EUR
recievable EUR payable EUR loans
EUR
cash
Gross
exposure
Net
exposure % change
Effect on
P/L
EUR/RUB 7 -100 - 1 -92 -92 10.00% -9
EUR/LTL 11 -26 - 14 -1 - -1 10.00% -
EUR/RSD 24 -69 - 98 53 - 53 10.00% 5
EUR/KZT - -8 - - -8 - -8 10.00% -1
EUR/UAH 4 -46 - 72 30 - 30 10.00% 3
EUR/UZS - -14 -223 9 -228 - -228 10.00% -23
EUR/CNY - -2 - - -2 -2 10.00% -
Total -25
DKK million
USD
recievable USD payable USD loans
USD
cash
Gross
exposure
Net
exposure % change
Effect on
P/L
USDUAH 1 -49 - 329 281 281 10.00% 28
Total 28
Derivative
-
-
Derivative
2011
DKK million
EUR
recievable EUR payable EUR loans
EUR
cash
Gross
exposure
Net
exposure % change
Effect on
P/L
EUR/RUB 2 -143 - 100 -41 -41 10.00% -4
EUR/LTL 2 -14 - 1 -11 - -11 10.00% -1
EUR/RSD 19 -35 - 23 7 - 7 10.00% 1
EUR/KZT - -3 - - -3 - -3 10.00% -
EUR/UAH 1 -29 - 22 -5 - -5 10.00% -
EUR/UZS - -14 -246 10 -250 - -250 10.00% -25
EUR/CNY - -4 - - -4 -4 10.00% -
Total -29
DKK million
USD
recievable USD payable USD loans
USD
cash
Gross
exposure
Net
exposure % change
Effect on
P/L
USDUAH - -39 -102 26 -115 -115 10.00% -12
Total -12
Derivative
-
-
Derivative
-
79

7/22/2019 Carlsberg Breweries Annual Report 2012
http://slidepdf.com/reader/full/carlsberg-breweries-annual-report-2012 80/152
Other comprehensive income is affected by changes in the fair value of currency derivatives designated ascash flow hedges of future purchases and sales. If the currency rates of the currencies hedged had been 5%higher on 31 December, other comprehensive income would have been DKK 170m lower (2011: DKK 139m
lower).
Interest rate risk
The most significant interest rate risk in the Group relates to borrowings. As the Group’s net debt is primarilyin EUR and DKK, interest rate exposure relates to the development in the interest rates in these twocurrencies.
Interest rate risks are mainly managed using interest rate swaps and fixed-rate bonds.
The interest rate risk is measured by the duration of the net borrowings. The target is to have a durationbetween one and five years.
A breakdown of the net financial debt, including the exposure to interest rate risk, financial instruments usedto manage foreign exchange and interest rate risks, is provided in note 24.
Sensi t iv i ty analysis . At the reporting date, 86% of the net borrowings consisted of fixed-rate loans withrates fixed for more than one year (2011: 85%). It is estimated that an interest rate increase of 1 percentagepoint would lead to an increase in annual interest expenses of DKK 49m (2011: DKK 63m). The calculationassumes a parallel shift in the relevant yield curves and 100% effective hedging of changes in the yield curve.
At 31 December 2012, the duration of the borrowings was 3.9 years (2011: 2.3 years) and in value termsamounted to DKK 1,326m (2011: DKK 775m). The duration has increased compared to 2011 due to theissuance of a total of EUR 1.5bn of fixed-rate bonds during 2012. The maturity of the bonds issued in 2012 isevenly split between EUR 750m maturing in 2019 and EUR 750m maturing in 2022. If the market interestrate had been 1 percentage point higher (lower) at the reporting date, it would have led to a financial gain
(loss) of DKK 1,326m (2011: DKK 775m). However, since only interest rate swaps and not fixed-rateborrowings are recognised at fair value, marked-to-market, only the duration contained in financialinstruments will impact on comprehensive income or the income statement. It is estimated that DKK 72m(2011: DKK 164m) of the duration is contained in interest rate derivatives designated as cash flow hedges,meaning that the impact from changes in interest rates will be recognised in other comprehensive income,provided that the hedges are efficient and that there are no ineffective portion(s). If the market interest rateshad been 1 percentage point higher (lower) at 31 December 2012, shareholders ’ equity would have beenDKK 72m (2011: DKK 164m) higher (lower). The remaining duration is included in borrowings with fixedinterest – primarily the issued bonds described in note 24, which are carried at amortised cost.
The sensitivity analysis is based on the financial instruments recognised at the reporting date. The sensitivityanalysis assumes a parallel shift in interest rates and that all other variables, in particular foreign exchangerates and interest rate differentials between the different currencies, remain constant. The analysis was
performed on the same basis as for 2011.
The recognised impact from interest rate derivatives is disclosed in note 36.
Raw material risk. Raw material risks are associated in particular with purchasing of cans (aluminium), malt(barley) and energy. Management of raw material risks and foreign exchange risks is coordinated centrally.The aim of the risk management process is to ensure stable and predictable raw material prices in the longterm, and to avoid capital and liquidity being tied up unnecessarily.
As the underlying markets for the specified categories of raw materials vary, so does the way in which theyare hedged against price increases. The most common form of hedging is fixed-price agreements in localcurrencies with suppliers.
80

7/22/2019 Carlsberg Breweries Annual Report 2012
http://slidepdf.com/reader/full/carlsberg-breweries-annual-report-2012 81/152
To hedge the implicit risk of rising aluminium prices associated with the purchase of cans, the Group’spurchase price in the majority of purchase agreements is variable and based on the global market price ofaluminium (London Metal Exchange, LME). The Group is thus able to hedge the underlying aluminium pricerisk. For 2013, the majority of the aluminium price risk has been hedged for Western and Eastern Europe,and for 2014 the risk has been partially hedged. The total volume of aluminium purchased via financial
instruments was approximately 97,300 tonnes at the end of 2012 (2011: 88,600 tonnes). Based on thisvolume, and assuming 100% efficiency, a 10% increase (decrease) in aluminium prices would impact equitypositively (negatively) by DKK 106m (2011: DKK 94m). Fair values are specified in note 36.
It is Group policy to secure delivery of malt and hops for the coming budget year, and the main part of theexposure for 2013 was thus hedged through fixed-price purchase agreements for the majority of the Groupin 2012. The percentage which is hedged or price-fixed is higher for Western Europe than for EasternEurope.
Credit risk
Credit risk is the risk of a counterparty failing to meet its contractual obligations and so inflicting a loss on theGroup. The Group is exposed to credit risk on financial assets such as trade and other receivables, on-tradeloans, cash balances (including fixed deposits and cash and cash equivalents), investments and derivative
financial instruments with a positive fair value.
Trade receivables, on-trade loans and oth er receivables . Credit risk related to trade receivables ariseswhen the Group makes sales for which no cash payments are received when goods are delivered.Exposures on trade receivables are managed locally in the operating entities and credit limits set as deemedappropriate for the customer taking into account the current market conditions.
The Group does not generally renegotiate the terms of trade receivables with the individual customer andtrade receivables are not changed to on-trade loans. However, if a negotiation takes place, the outstandingbalance is included in the sensitivity analysis based on the original payment terms. No significant tradereceivables or on-trade loans were renegotiated during 2012 and 2011.
Under certain circumstances the Group grants loans to the on-trade. On-trade loans are concentrated in
France, UK, Germany, Switzerland and Sweden, and spread across a large number of customers/debtors.The operating entities monitor and control these loans in accordance with central guidelines. On-trade loansare usually repaid through discounts during the continuing sales relationship with the individual customer,which is reflected in the repayment scheme and the discounting of the loans. There are therefore nosignificant overdue on-trade loans. It is estimated that the provisions made are sufficient to cover expectedlosses.
Significant adverse developments in the on-trade market may increase the credit risk for groups ofcustomers in a country/market. Such developments include changes in local legislation, which may have anadverse effect on the earnings in the industry in general and are taken into consideration in the assessmentof impairment losses.
It is Group policy to reduce the credit risk through prepayments or cash payments on delivery, especially for
certain categories of customers in each country. The local entities assess the credit risk and whether it isappropriate and cost-effective to hedge the credit risk by way of credit or bank guarantees, credit insurance,conditional sale etc. Such security is taken into account when assessing the necessary impairment losses.Security is primarily received from on-trade customers.
The credit risk on on-trade loans is usually reduced through collateral and pledges of on-trade movables(equipment in bars, cafés etc.). The fair value of the pledged on-trade movables cannot be estimated reliablybut is assessed to be insignificant as the movables are used. Movables received through pledges usuallyneed major repair before they can be used again.
Other financial assets. Credit risk related to cash and cash equivalents, investments and financialinstruments arises due to uncertainty as to whether the counterparty will be able to meet its contractualobligations as they fall due. The Group has established a credit policy under which financial transactions
81

7/22/2019 Carlsberg Breweries Annual Report 2012
http://slidepdf.com/reader/full/carlsberg-breweries-annual-report-2012 82/152
may be entered into only with financial institutions with a high credit rating. The credit exposure on financialinstitutions is effectively managed by Group Treasury.
The credit risk on other loans is reduced through pledge of shares in one of the Group’s subsidiaries that areheld by the borrower.
The Group primarily enters into financial instruments and transactions with the Group’s relationship banks,i.e. banks extending loans to the Group. In most cases, the Group will be in a net debt position with itsrelationship banks.
Furthermore, Group Treasury monitors the Group’s gross credit exposure to banks, and operates withindividual limits on banks based on rating, level of government support and access to netting of assets andliabilities. During 2012 the Group has recognised a loss on bank balances due to the counterparty’s inabilityto pay, and therefore management expects the counterparty to fail to meet its obligations. Before 2012 theGroup had not incurred any losses on bank balances or derivative financial instruments.
Exposure to credit risk. The carrying amount of financial assets represents the maximum credit exposure.The carrying amount of financial assets, DKK 17,708m (2011: DKK 15,874m), is summarised below.
DKK million
Net
carrying
amount at
31 Dec
Past due less
than 30 days
Past due
between 30
and 90
days
Past due
more than
90 days
Receivable from sale of goods and services 7,117 6,316 298 154 349
On-trade loans 2,022 1,930 5 8 79
Loans to associates 137 137 - - -
Loans to partners 226 226 - - -
Fair value of hedging instruments 584 584 - - -
Other receivable 1,862 1,712 22 23 105
Cash and cash equivalent 5 760 5 760 - - -
DKK million
Net
carrying
amount at31 Dec
Past due lessthan 30 days
Past due
between 30
and 90days
Past due
more than90 days
Receivable from sale of goods and services 7,115 6,529 216 154 216
On-trade loans 2,066 1,923 12 10 121
Loans to associates 123 123 - - -
Loans to partners 230 230 - - -
Intercompany receivables 1,466 1,466 - - -
Fair value of hedging instruments 499 499 - - -
Other receivables 1,267 1,023 32 35 177
Cash and cash equivalent 3,108 3,108 - - -
2012
2011
Of which neither
impaired nor past due
at the reporting date
Of which neither
impaired nor past dueat the reporting date
Impairment losses are based on an individual review for impairment in connection with customer insolvency,anticipated insolvency and past due amounts and on mathematically computed impairment losses based onclassification of debtors, maturity and historical information.
No significant impairment losses were incurred in respect of individual trade receivables or on-trade loans in2012 and 2011. The impairment losses at 31 December 2012 relate to several minor customers that have – in different ways – indicated that they do not expect to be able to pay their outstanding balances, mainly dueto adverse economic developments. The Group believes that the unimpaired amounts that are past due bymore than 30 days are still collectable, based on historic payment behaviour and extensive analysis of theunderlying customers’ credit ratings.
Impairment losses on other receivables relate to a foreign bank that is not expected to meet its obligationsand to receivables from Nordic Getränke GmbH. The impairment losses on these items are recognised inspecial items.
82

7/22/2019 Carlsberg Breweries Annual Report 2012
http://slidepdf.com/reader/full/carlsberg-breweries-annual-report-2012 83/152
The development in impairment losses in respect of receivables was as follows:
2012
DKK million Tradereceivables On-trade loans Otherreceivable Total
Impairment at 1 January -715 -232 - -947
Impairment loss recognised -129 -80 -163 -372
Realised impairment losses 135 59 - 194
Reversed impairments 16 25 - 41
Disposals 5 -5 - -
Impairment at 31 December -688 -233 -163 -1,084
DKK million
Trade
receivables On-trade loans
Other
receivable Total
Impairment at 1 January -675 -265 - -940
Impairment loss recognised -151 -25 - -176
Realised impairment losses 61 33 - 94
Reversed impairments 21 25 - 46
Disposals 30 - - 30
Impairment at 31 December -714 -232 - -946
2011
Liquidity risk
Liquidity risk results from the Group’s potential inability to meet the obligations associated with its financialliabilities, e.g. settlement of its financial debt, paying its suppliers and settling finance lease obligations. The
Group’s liquidity is managed by Group Treasury. The approach is to ensure effective liquidity management,which primarily involves obtaining sufficient committed credit facilities to ensure adequate financial resources,and to some extent tapping a diversity of funding sources. At 31 December 2012, the Group had unutilisednon-current committed credit facilities of DKK 14,863m (2011: DKK 8,071m).
In addition to efficient working capital management and credit management, the Group mitigates liquidity riskby arranging borrowing facilities with highly rated financial institutions.
83

7/22/2019 Carlsberg Breweries Annual Report 2012
http://slidepdf.com/reader/full/carlsberg-breweries-annual-report-2012 84/152
Distribution of gross financial debt 2012, DKK 39,831 Distribution of gross financial debt 2011, DKK 36,728 Non-current bank
borrowing 14%
Issued bonds 73%
Non-current mortgages
3%
Current bank
borrowing 3%
Other current and non-
current borrowings 7%
Non-current bank
borrowing 36%
Issued bonds 54%
Non-current
mortgages 4%
Current bank
borrowing 4%
Other current and
non-current
borrowings 2%
The Group uses cash pools in its day-to-day liquidity management for most of the entities in Northern &Western Europe, as well as intra-Group loans between Group Treasury and subsidiaries. As a result ofwithholding tax and local legislation, the majority-owned entities in Eastern Europe have their own creditfacilities and borrowings from banks. This is also the case for the joint venture in Portugal (Unicer-Bebidas).
Carlsberg applies the formula below in the monitoring of credit resources available:
2012 2011
Total non-current commited loans and credit facilities 51.342 42.208
Total current and non-currents borrowings -39.831 -36.728
Unused committed non-current credit facilities 11.511 5.480
Cash and cash equivalents 5.748 3.108
Credit resources available 17.259 8.588
The unused non-current committed credit facilities of DKK 11,511m (2011: DKK 5,480m) stated in theformula are net of non-current and current borrowings and therefore DKK 3,352m (2011: DKK 2,591m) (thecurrent borrowing) lower than the actual unutilised part of non-current committed credit facilities of DKK14,863m (2011: DKK 8,071m).
A few insignificant non-current committed credit facilities include financial covenants with reference to theratio between net debt and EBITDA. Management monitors this ratio, and at 31 December 2012 there wassufficient headroom below the ratio.
The following table lists the contractual maturities of financial liabilities, including estimated interestpayments and excluding the impact of netting agreements, and thus summarises the liquidity risk.
The risk implied from the values shown in the maturity table below reflects the one-sided scenario of cashoutflows only. Trade payables and other financial liabilities mainly originate from the financing of assets inthe ongoing operations such as property, plant and equipment and investments in working capital, e.g.inventories and trade receivables.
84

7/22/2019 Carlsberg Breweries Annual Report 2012
http://slidepdf.com/reader/full/carlsberg-breweries-annual-report-2012 85/152
2012
DKK million
Contractual
cash flows
Maturity
< 1 year
Maturity > 1
year < 5
years
Maturity
> 5 years
Carrying
amount
Derivative financial instruments:
Derivative financial instruments, payables 646 383 263 - 606
Non-derivative financial instruments
Financial debt, gross 39,711 3,352 23,889 12,470 39,831
Interest expense 5,273 1,289 3,034 950 N/A
Trade payables and other liabilities 13,287 13,287 - - 13,287
Liabilities related to the acquisition of entities 1,129 1 129 999 1,129
Financial liabil it ies associated with assets held for sale 18 18 - - 18
Non-derivate financial instruments 59,418 17,947 27,052 14,419 -
Financial liabilities 60,064 18,330 27,315 14,419 -
2011
DKK million
Contractual
cash flows
Maturity
< 1 year
Maturity > 1
year < 5
years
Maturity
> 5 years
Carrying
amount
Derivative financial systems
Derivative financial instruments, payables 1,158 535 623 - 1,197
Non-derivative financial instruments
Financial debt, gross 36,635 2,591 25,313 8,731 36,728
Interest expense 4,350 1,321 2,811 218 N/A
Trade payables and other liabilities 12,290 12,290 - - 12,290
Liabilities related to the acquisition of entities 1,136 418 24 694 1,136
Financial liabil it ies associated with assets held for sale 56 56 - - 56
Non-derivate financial instruments 54,467 16,676 28,148 9,643 -
Financial liabilities 55,625 17,211 28,771 9,643 -
All items are stated at their nominal amounts. Derivative financial instruments are presented gross.
Derivative financial instruments are in general tr aded with the Group’s relationship banks. The nominalamount/contractual cash flow of the financial debt is DKK 121m lower (2011: DKK 94m higher) than thecarrying amount. The difference between the nominal amount and the carrying amount comprisesdifferences between these amounts at initial recognition, which are treated as cost that is capitalised andamortised over the duration of the borrowings, and differences between nominal amounts and fair values ofbonds. The interest expense is the contractual cash flows expected on the financial gross debt at 31December 2012. For the part of bank borrowing and mortgages that has been swapped, the expectedinterest expense (before swaps but including margin) has been included. The expected net cash flow fromthe swaps related to the borrowings is included in the contractual cash flow for the derivative financialinstrument. It should be noted that the cash flow regarding the interest expenses is estimated cash flowbased on the notional amount of the above-mentioned borrowings and forward interest rates at year-end2012 and 2011. Interest on the debt existing at year-end 2012 and 2011, for which no contractual obligation(current borrowing and part of the amount drawn on cash pools) exists, has been included for a two-year
period.
Accounting classification and fair values. The accounting classification and fair values can be specifiedas follows:
85

7/22/2019 Carlsberg Breweries Annual Report 2012
http://slidepdf.com/reader/full/carlsberg-breweries-annual-report-2012 86/152
DKK million Note
Carrying
amount Fair Value
Carrying
Amount Fair Value
Securities 18 133 133 130 130
Available for sale instruments 133 158 130 130
Fair value hedges 36 499 499 443 443
Cash flow hedges 36 46 46 43 43
Net investment hedges 36 39 39 13 13
Derivative financial instruments 584 584 499 499
Receivables from the sale of goods and services 19 7,117 7,117 7,115 7,115
On-trade loans 19 2,022 2,022 2,066 2,066
Other receivables 19 1,813 1,813 1,267 1,267
Loans to partners 19 226 226 230 230
Loans to associates 19 137 137 123 123
Cash and cash equivalents 21 5,748 5,748 3,108 3,108
Loans and receivables 17,063 17,063 13,909 13,909
Fair value hedges 36 -62 -62 -165 -165
Cash flow hedges 36 -495 -495 -792 -792
Net investment hedges 36 -49 -49 -240 -240
Derivative financial instruments -606 -606 -1,197 -1,197
Issued bonds 24 29,021 30,520 19,478 20,157
Mortages 24 1,248 1,248 1,248 1,248
Bank borrowings 24 6,901 6,901 14,440 14,440
Financial lease obligations 24 39 39 52 52
Other borrowings 24 796 796 812 812
Trade payables 11,906 11,906 10,999 10,999
Financial liabilities measured at amortised cost 49,911 51,410 47,029 47,708
20112012
Fair value hierarchy . Carlsberg has no financial instruments measured at fair value on the basis of level 1input (quoted prices) or level 3 input (non-observable data).
Securit ies . Shares in unlisted entities comprise a number of small holdings. These unlisted entities are notrecognised at fair value if the fair value cannot be calculated on a reliable basis. Instead such unlistedsecurities are recognised at cost.
Derivat ive f inancia l instru ments – level 2 inpu t . The fair value of all derivatives, and in most cases non-derivative financial instruments, is determined based on observable market data using generally acceptedmethods. Internally calculated values are used, and these are compared to external market quotes on aquarterly basis.
The fair value of all derivatives (whether designated as fair value or economic hedges, cash flow hedges ornet investment hedges) is calculated internally by: a) estimating the notional future cash flows using
observable market data such as yield curves and the aluminium forward curve; b) discounting the estimatedand fixed cash flow to present value; and c) converting the amounts in foreign currency into the functionalcurrency at the end-of-period foreign exchange rate.
Loans and other receivables . The carrying amount of trade receivables and other receivablesapproximates the fair value.
On-trade loans . On-trade loans are recognised at amortised cost. Based on discounted cash flows usingthe interest rates at the end of the reporting period, these loans have a fair value of DKK 2,022m (2011: DKK2,066m).
Other financial l iabil i t ies . Other financial liabilities, including issued bonds, mortgages, bank borrowings,finance lease obligations, trade payables and other liabilities, are measured at amortised cost. The only
exception is a GBP 300m bond which is measured at fair value based on movements in a benchmarkinterest rate.
86

7/22/2019 Carlsberg Breweries Annual Report 2012
http://slidepdf.com/reader/full/carlsberg-breweries-annual-report-2012 87/152
Carlsberg Breweries Group
Note
36 Financial instruments
Fair value hedges and financial derivatives not designated as hedging instruments (economic hedges)
Fair value
adjustment
recognised
in income
statement Fair value
Fair value
adjustment
recognised
in income
statement Fair value
221 438 8 284
-5 -1 -7 -6
-26 - 10 -
190 437 11 278
Cash flow hedges
Instrument Maturity
EUR 1,000m interest rate swap 2013
EUR 400m interest rate swap 2015
Aluminium 2013-2014
The two EUR interest rate swaps were entered into during 2008 following the acquisition of part of the activities in S&N and the subsequent increase in debt.
2012 2011
DKK million
Swap of borrowing with 1 -month EURIBOR to fixed
Fixing of aluminium risk related to purchase of cans
Purpose
Swap of borrowing with 1 -month EURIBOR to fixed
Other instruments
The value of fair value hedges recognised at 31 December amounted to DKK 437m (2011: DKK 278m).
Cash flow hedges are primarily used on interest rate swaps where the hedged item is the underlying (floating rate) borrowing, and on aluminium hedges where the hedged
item is aluminium cans that are used in a number of Group entities in Western Europe and Eastern Europe.
Main financial instruments - overview
Exchange rate instruments
The ineffective portion of hedge in 2012 relates to the reclassification of the ineffective portion of interest rate instruments (DKK -37m) designated as cash flow hedges
where the hedged item is no longer likely to occur, and reversals of prior years’ ineffective portions of interest rate hedges (DKK 11m). For 2011, the ineffective portion
related to the reclassification of fair value adjustments of interest rate instruments (DKK -83m) and of exchange rate instruments (DKK -2m) designated as cash flow
hedges where the hedged item was no longer likely to occur, and of reversal of prior years ineffective portion of interest rate hedges (DKK 12m). The total ineffective
portion for 2012 was a loss of DKK 26m (2011: gain of DKK 10m).
The fair value of the entire derivative classified as a cash flow hedge is presented in the cash flow hedge section. Other instruments are primarily aluminium hedges, which
were not classified as cash flow hedges.
Ineffective portion of hedge
Total
Value adjustments of fair value hedges and financial derivatives not designated as hedging instruments in the financial year are recognised in the income statement. The
adjustments are included in financial income and financial expenses (cf. note 8). In 2012, financial income amounted to DKK 190m (2011: DKK 11m).
87

7/22/2019 Carlsberg Breweries Annual Report 2012
http://slidepdf.com/reader/full/carlsberg-breweries-annual-report-2012 88/152
Carlsberg Breweries Group
Note
36 Financial instruments
DKK million
Fair value
adjustmentrecognised in
other compre-
hensive
income Fair value
Expected
recognition
Fair value
adjustmentrecognised in
other compre-
hensive
income Fair value
Expected
recognition
Interest rate instruments 244 -452 2013-2015 156 -669 2012-2015
Exchange rate instruments 24 46 2013 65 22 2012
Other instruments 59 -43 2013-2014 -253 -102 2012-2013
Total 327 -449 -32 -749.
Hedging of net investments in foreign subsidiaries
DKK million
Fair value
adjustment
recognised
in other
compre-hensive
income Fair value
Fair value
adjustment
recognised
in other
compre-hensive
income Fair value
Exchange rate instruments -216 -10 -20 -227
Total -216 -10 -20 -227
The impact on other comprehensive income from exchange rate instruments relates to hedges of Group entities’ purchases and sales in currencies other than their
functional currencies. The impact on other comprehensive income from other instruments relates to hedges of Group entities’ exposure to changes in aluminium prices.
Changes in the fair value of financial instruments (both derivatives and debt instruments) used to hedge the foreign exchange risk associated with investments in foreign
currency are recognised in other comprehensive income.
Cash flow hedges
2012 2011
The fair value of cash flow hedges recognised at 31 December amounted to DKK -449m (2011: DKK -749m). This includes the ineffective portion reclassified to the
income statement, but does not include the value of cash flow hedges closed and not yet transferred to the income statement.
Fair value adjustments on cash flow hedges in the financial year are recognised in other comprehensive income and amounted to DKK 327m (2011: DKK -32m).
Where the fair value adjustments do not exceed the value adjustments of the investment, the adjustments of the financial instruments are recognised in other
comprehensive income; otherwise the fair value adjustments are recognised in the income statement.
In addition, loans classified as additions to net investments have been granted to subsidiaries. Foreign exchange adjustments of these loans are recognised in other
comprehensive income in the same line as the gains / losses on the hedges of net investments.
Hedging of net investments
2012 2011
88

7/22/2019 Carlsberg Breweries Annual Report 2012
http://slidepdf.com/reader/full/carlsberg-breweries-annual-report-2012 89/152
Carlsberg Breweries Group
Note
36 Financial instruments
2012 2011
Million
Hedging of
investment,
amount in
local
currency
Addition to
net
investment,
amount in
local
currency
Total
adjustment to
other compre-
hensive
income (DKK)
Income
statement
(DKK)
Hedging of
investment,
amount in
local
currency
Addition to
net
investment,
amount in
local currency
Total
adjustment
to other
compre-
hensive
income
(DKK)
Income
statement
(DKK)
SEK -4,560 - -167 - -4,194 - -35 -
NOK -750 3,182 125 - -750 3,182 2 -
CHF -380 - -20 - -460 - -36 -
GBP -70 87 3 1 -70 86 -1 -
MYR -458 - -37 - -450 - -12 -
EUR - 698 18 - - 645 -13 -
RUB -13,572 - -105 - -5,910 - 5 -
PLN -300 - -70 - -300 - 31 -
CNY -1,250 - -5 - -1,250 - -68 -
HKD - 3,946 -34 - - 2,874 55 -
USD -141 - 76 - 184 - 52 -
Total -216 1 -20 -
Fair value adjustments of net investment hedges and loans classified as additions to net investments in the financial year are recognised in other comprehensive income
and amounted to DKK -216m (2011: DKK -20m). For 2012 there has been an ineffective portion of DKK 1m (2011: DKK 0m) which has been reclassified from other
comprehensive income to the income statement.
The fair value of derivatives used as net investment hedges recognised at 31 December 2012 amounted to DKK -10m (2011: DKK -227m).
89

7/22/2019 Carlsberg Breweries Annual Report 2012
http://slidepdf.com/reader/full/carlsberg-breweries-annual-report-2012 90/152
Carlsberg Breweries Group
Note
37 Related party disclosures
DKK million 2012 2011 2012 2011
Revenue 286 377 13 12 Cost of sales -381 -322 - -1 Loans 300 123 727 161 Receivables 131 233 26 14 Borrowings -96 -107 - - Trade payables and other liabilities etc. -22 -72 -4 -3
Related parties exercising control. Carlsberg A/S, Ny Carlsberg Vej 100, DK,1799 Copenhagen V, Denmark, holds all the shares inCarlsberg Breweries A/S. During the year, the Group had balances with the parent company. The balances were subject to arm's length termsand prices. No transactions were carried out with Carlsberg A/S during the year.
Related parties exercising significant influence. During the year the Carlsberg Breweries Group was not involved in any transactions withmajor shareholders, members of the Supervisory Board, members of the Executive Board, key management personnel, or companies outsidethe Carlsberg Breweries Group in which these parties have significant influence.
Associates
Proportionally consolidated
entities
The income statement and the statement of financial position include the following transactions:
90

7/22/2019 Carlsberg Breweries Annual Report 2012
http://slidepdf.com/reader/full/carlsberg-breweries-annual-report-2012 91/152
Carlsberg Breweries Group
Note
38 Contingent liabilities and other commitments
Capital commitments
DKK million 2012 2011
Intangible assets 1 -
401 763
Total 402 763
Capital commitments which at the end of the period are agreed to be made at a laterdate and therefore not recognised in the consolidated financial statements:
Property, plant and equipment and construction contracts
The Group has issued guarantees for loans etc. raised by joint ventures (non-consolidated share of loan) of DKK 83m (2011:DKK 87m) and for loans etc. raised by third parties (non-consolidated entities) of DKK 659m (2011: DKK 762m).
Carlsberg Breweries A/S is jointly registered for Danish VAT and excise duties with Carlsberg A/S, Carlsberg Danmark A/S andvarious other minor Danish subsidiaries and is jointly and severally liable for payment of VAT and excise duties.
The Group is party to certain lawsuits, disputes etc. of various scopes. It is management’s opinion that, apart from what isrecognised in the statement of financial position or disclosed in the consolidated financial statements, the outcome of theselawsuits, disputes etc. will not have a material negative effect on the Group’s financial position.
Certain guarantees etc. are issued in connection with disposal of entities and activities etc. Other than as recognised in thestatement of financial position or disclosed in the consolidated financial statements, these guarantees etc. will not have amaterial effect on the Group’s financial position.
Contractual commitments. The Group has entered into service contracts of various lengths in respect of sales, logistics andIT. Costs related to the contracts are recognised as the services are received.
91

7/22/2019 Carlsberg Breweries Annual Report 2012
http://slidepdf.com/reader/full/carlsberg-breweries-annual-report-2012 92/152
Carlsberg Breweries Group
Note
39 Operating lease liabilities
2012
Land andbuildings
Plant andmachinery
Fixtures andfittings, other
plant andequipment Total
Within one year 161 32 322 515
Between one and five years 335 117 642 1,094
After more than five years 233 18 99 350
Total 729 167 1,063 1,959
2011
Land andbuildings
Plant andmachinery
Fixtures andfittings, other
plant andequipment Total
Within one year 205 10 354 569
Between one and five years 332 54 640 1,026
After more than five years 236 - 91 327
Total 773 64 1,085 1,922
2012 2011
522 564
58 57
40 Events after the reporting period
Expected future income under non-cancellable subleases (matures within 10 years)
The Group has entered into operating leases which relate primarily to properties, IT equipment and transportequipment (cars, trucks and forklifts). These leases contain no special purchase rights etc.
Apart from the events recognised or disclosed in the consolidated financial statements, no events have occurredafter the reporting period of importance to the consolidated financial statements.
Operating lease expenses recognised in the income statement
In January 2013 Carlsberg and its partner in Nordic Getränke GmbH agreed to cease the cooperationand split the entities between them. Hence Carlsberg acquired entities from Nordic Getränke GmbH thatwill be fully consolidated and integrated in the German business in 2013. The transaction had nosignificant impact on the income statement or financial position.
Future lease payments:
DKK million
DKK million
Future lease payments:
DKK million
92

7/22/2019 Carlsberg Breweries Annual Report 2012
http://slidepdf.com/reader/full/carlsberg-breweries-annual-report-2012 93/152
The 2012 consolidated financial statements of the Carlsberg Breweries Group have been prepared inaccordance with International Financial Reporting Standards (IFRS) as adopted by the EU and Danishdisclosure requirements for listed companies, cf. the statutory order pursuant to the Danish FinancialStatements Act.
The consolidated financial statements are presented in Danish kroner (DKK million), which is the ParentCompany’s functional currency.
In addition, the consolidated financial statements have been prepared in compliance with IFRS issued by theIASB.
The consolidated financial statements have been prepared on the historical cost basis except for thefollowing assets and liabilities, which are measured at fair value: derivative financial instruments, financialinstruments in the trading portfolio and financial instruments classified as available-for-sale.
Non-current assets and disposal groups classified as held for sale are measured at the lower of the carryingamount before the changed classification and fair value less costs to sell.
The accounting policies set out below have been used consistently in respect of the financial year and thecomparative figures.
The comparative figures have been changed to reflect the effect of the purchase price allocation of the fairvalue of identified assets, liabilities and contingent liabilities in business combinations in accordance withIFRS 3.
New IFRS and Interpretations
Implementation of new and amended IFRSs and Interpretations. With effect from 1 January 2012, thefollowing amended IFRS was implemented:
Amendment to IAS 12 “Income Taxes – Deferred Tax: Recovery of Underlying Assets”. Theamendments provides further guidance on deferred tax on investment properties and is therefore notrelevant to the Group.
The implementation of the amended IFRS has not changed the principles applied to recognition andmeasurement for 2012 from those used in prior years. The accounting policies used in the preparation of theconsolidated financial statements are consistent with those of last year.
New and amended IFRSs and Interpretations not yet adopted by or applicable within the EUIn addition, the following new or amended IFRSs and Interpretations of relevance to the Carlsberg BreweriesGroup have been issued and adopted by the EU but are not applicable for 2012:
IFRS 10 “Consolidated Financial Statements”. The standard changes the definition of control over anentity following which de facto control will result in full consolidation of the entity and potential votingrights could require full consolidation. The standard is effective for financial years beginning on or after 1January 2013.
IFRS 11 “Joint Arrangements”. The standard supersedes IAS 31 “Interests in Joint Ventures” andeliminates the possibility of proportionate consolidation of joint ventures. The standard distinguishesbetween joint ventures (recognised according to the equity method) and joint arrangements(proportionate consolidation). The standard changes the Group’s recognition and measurement of jointventures. The standard is effective for financial years beginning on or after 1 January 2013 according tothe standard but not applicable within the EU until 1 January 2014.
Carlsberg Breweries Group
Note
41 Accounting policies
93

7/22/2019 Carlsberg Breweries Annual Report 2012
http://slidepdf.com/reader/full/carlsberg-breweries-annual-report-2012 94/152
IFRS 12 “Disclosure of Interests in Other Entities”. The standard defines disclosure requirements forconsolidated entities, and for joint ventures and associates recognised according to the equity method.The standard is effective for financial years beginning on or after 1 January 2013 according to thestandard but is not applicable within the EU until 1 January 2014.
IFRS 13 “Fair Value Measurement”. The standard supersedes the definitions of fair value in the
individual IFRSs and requires further disclosure of fair value estimates. The standard does not changerecognition and measurement for the Group. The standard is effective for financial years beginning on orafter 1 January 2013.
Amendments to IAS 27 “Separate Financial Statements”. The standard contains requirements for theaccounting treatment of and disclosures for investments in subsidiaries, joint ventures and associates inparent company financial statements. The standard does not change recognition and measurement forthe Parent Company. The standard is effective for financial years beginning on or after 1 January 2013according to the standard but not applicable within the EU until 1 January 2014.
Amendments to IAS 28 “Investments in Associates and Joint Ventures”. The standard prescribes theaccounting treatment of investments in joint ventures and associates according to the equity method.The standard does not change recognition and measurement for the Group. The standard is effective forfinancial years beginning on or after 1 January 2013 according to the standard but is not applicablewithin the EU until 1 January 2014.
Amendments to IAS 19 “Employee Benefits”. The standard changes the valuation of assets and is notexpected to have a material impact on the Group. The standard is effective for financial years beginningon or after 1 January 2013.
Amendment to IAS 1 "Other Comprehensive Income" (issued 16 June 2011). The standard changes thepresentation of other comprehensive income. The standard is effective for financial years beginning onor after 1 July 2012.
Amendment to IFRS 7 "Disclosures – Offsetting Financial Assets and Financial Liabilities". The standardis effective for financial years beginning on or after 1 January 2013.
Amendment to IAS 32 "Offsetting Financial Assets and Financial Liabilities. The standard is effective forfinancial years beginning on or after 1 January 2014.
IFRIC 20 “Stripping Costs in the Production Phase of a Surface Mine”. The Interpretation is not relevantto the Group.
Improvements to IFRSs issued in June 2011.
Implementation of IFRS 10, IFRS 11 and the amendment to IAS 28 will change the Group’s accountingpolicies from proportionate consolidation of joint ventures to accounting for these according to the equitymethod. The change in the consolidation method will be assessed for each individual shareholding taking thechanged guidance on assessment of control into consideration. The changes are not expected to have anymaterial effect on the Group’s profit.
Furthermore, the following new or amended IFRSs and Interpretations of relevance to the CarlsbergBreweries Group have been issued but not yet adopted by the EU but are not applicable for 2012:
IFRS 9 “Financial Instruments”, most recently revised in November 2010. As further changes to thestandard are being drafted and planned, the impact of the final standard on the consolidated financialstatements cannot yet be estimated. The standard is effective for financial years beginning on or after 1
January 2015. Improvements to IFRSs 2009-2011 (issued 17 May 2012), effective for financial years beginning on or
after 1 January 2013.
Transition Guidance (amendments to IFRS 10, IFRS 11 and IFRS 12) (issued 28 June 2012), effectivefor financial years beginning on or after 1 January 2013.
Investment Entities (amendments to IFRS 10, IFRS 12 and IAS 27) (issued 31 October 2012), effectivefor financial years beginning on or after 1 January 2014.
The new and amended Standards and Interpretations are not mandatory for the financial reporting for 2012.The Carlsberg Breweries Group expects to adopt the Standards and Interpretations when they becomemandatory.
94

7/22/2019 Carlsberg Breweries Annual Report 2012
http://slidepdf.com/reader/full/carlsberg-breweries-annual-report-2012 95/152
Consolidated financial statements
The consolidated financial statements comprise the Parent Company, Carlsberg A/S, and subsidiaries in
which Carlsberg A/S has control, i.e. the power to govern the financial and operating policies. Control isobtained when Carlsberg A/S directly or indirectly owns or controls more than 50% of the voting rights in thesubsidiary or has control in some other way.
Entities over which the Group exercises a significant influence, but which it does not control, are consideredassociates. Significant influence is generally obtained by direct or indirect ownership or control of more than20% of the voting rights but less than 50%.
When assessing whether Carlsberg A/S exercises control or significant influence, potential voting rightsexercisable at the end of the reporting period are taken into account.
Entities which by agreement are managed jointly with one or more other parties (joint ventures) areconsolidated proportionally, and the individual accounting entries are recognised in proportion to the
ownership interest.
A Group chart is included in note 42.
The consolidated financial statements have been prepared as a consolidation of the financial statements ofthe Parent Company, subsidiaries and proportionally consolidated entities prepared according to the Groupaccounting policies. On consolidation, intra-Group income and expenses, shareholdings, intra-Groupbalances and dividends, and realised and unrealised gains on intra-Group transactions are eliminated.Unrealised gains on transactions with associates and proportionally consolidated entities are eliminated inproportion to the Group’s ownership share of the entity. Unrealised losses are eliminated in the same way asunrealised gains to the extent that impairment has not taken place.
Investments in subsidiaries and proportionally consolidated entities are set off against the proportionate
share of the subsidiaries’ fair value of identifiable net assets, including recognised contingent liabilities, at theacquisition date.
The accounting items of subsidiaries are included in full in the consolidated financial statements. Non-controlling interests’ share of the profit/loss for the year and of the equity of subsidiaries is included in theGroup’s profit/loss and equity respectively, but is disclosed separately.
Business combinations. Entities acquired or formed during the year are recognised in the consolidatedfinancial statements from the date of acquisition or formation. Entities which are disposed of or wound up arerecognised in the consolidated income statement until the date of disposal or winding-up. The comparativefigures are not restated for entities acquired, disposed of or wound up. Discontinued operations arepresented separately, cf. below.
For acquisitions of new subsidiaries, joint ventures and associates, the acquisition method is used. Theacquired entities’ identifiable assets, liabilities and contingent liabilities are measured at fair value at theacquisition date. Identifiable intangible assets are recognised if they are separable or arise from acontractual right. Deferred tax on revaluations is recognised.
The acquisition date is the date when the Carlsberg Breweries Group effectively obtains control of theacquired subsidiary, enters the management of the joint venture or obtains significant influence over theassociate.
For business combinations made on 1 January 2004 or later, any excess of the cost over the fair value of theidentifiable assets, liabilities and contingent liabilities acquired (goodwill) is recognised as goodwill underintangible assets. Goodwill is not amortised but is tested annually for impairment. The first impairment test isperformed before the end of the acquisition year. Upon acquisition, goodwill is allocated to the cash-
generating units, which subsequently form the basis for the impairment test.
95

7/22/2019 Carlsberg Breweries Annual Report 2012
http://slidepdf.com/reader/full/carlsberg-breweries-annual-report-2012 96/152
The cost of a business combination comprises the fair value of the consideration agreed upon. When abusiness combination agreement provides for an adjustment to the cost of the combination contingent onfuture events, the fair value of that adjustment is included in the cost of the combination.
Goodwill and fair value adjustments in connection with the acquisition of a foreign entity with a functionalcurrency other than the presentation currency used in the Carlsberg Breweries Group are treated as assetsand liabilities belonging to the foreign entity and translated into the foreign entity’s functional currency at theexchange rate at the transaction date.
Negative differences (negative goodwill) are recognised in the income statement at the acquisition date.
If uncertainties regarding measurement of acquired identifiable assets, liabilities and contingent liabilitiesexist at the acquisition date, initial recognition will take place on the basis of preliminary fair values. Ifidentifiable assets, liabilities and contingent liabilities are subsequently determined to have a different fairvalue at the acquisition date from that first assumed, goodwill is adjusted up until 12 months after theacquisition. The effect of the adjustments is recognised in the opening balance of equity and the comparativefigures are restated accordingly.
Changes in estimates of contingent purchase considerations, except in cases of material error, arerecognised in the income statement under special items. Changes in estimates of contingent purchaseconsiderations in business combinations completed before 31 December 2009 are recognised as anadjustment to goodwill.
Step acquis i t ions . In a business combination achieved in stages (step acquisition), the shareholding heldimmediately before the step acquisition is remeasured at fair value at the acquisition date. The resulting gainor loss is recognised in the income statement under special items. The total fair value of the shareholdingheld immediately after the step acquisition is estimated and recognised as the cost of the total shareholdingin the entity.
Non-contro l l ing interests in a business com binat ion. In each business combination, management
decides whether or not to recognise goodwill related to non-controlling interests. If such goodwill isrecognised, it is estimated based on the fair value of the non-controlling interests less the non-controllinginterests’ share of the fair value of acquired assets, liabilities and contingent liabilities.
Business c ombinat ions pr ior to 1 January 2004. For business combinations made prior to 1 January2004, the accounting classification is maintained according to the former accounting policies, except thattrademarks are now presented in a separate line in the statement of financial position. Accordingly, goodwillis recognised on the basis of the cost recognised in accordance with the former policies (the DanishFinancial Statements Act and Danish Accounting Standards) less amortisation and impairment losses upuntil 31 December 2003. Goodwill is not amortised after 1 January 2004. The accounting treatment ofbusiness combinations prior to 1 January 2004 was not changed in connection with the opening balance at 1January 2004.
Disposal . Gains or losses on the disposal or winding-up of subsidiaries, joint ventures and associates arestated as the difference between the sales amount and the carrying amount of net assets, including goodwillat the date of disposal or winding-up, foreign exchange adjustments recognised in other comprehensiveincome and costs to sell or winding-up expenses. Gains or losses on disposal or winding-up of subsidiariesare recognised in the income statement under special items, whereas gains or losses on disposal orwinding-up of associates are recognised as financial income or financial expenses.
On disposal of entities acquired prior to 1 January 2002 where goodwill was written off in equity inaccordance with the former accounting policies and where, in accordance with the exemption in IFRS 1,goodwill is not recognised in the statement of financial position, the goodwill written off is recognised at acarrying amount of DKK 0 in determining any gains and losses on the disposal of the entity.
96
7/22/2019 Carlsberg Breweries Annual Report 2012
http://slidepdf.com/reader/full/carlsberg-breweries-annual-report-2012 97/152
Part ia l disposal of investments with los s of con tro l . When the Group loses control of a subsidiarythrough a partial disposal of its shareholding or voting rights, the retained shareholding in the entity isclassified as an associate or a security depending on the level of control after the disposal. The shareholdingin the associate or security held immediately after the partial disposal is remeasured at fair value at the dateof disposal. The fair value is measured as the cost of the shareholding in the associate or security. The
resulting gain or loss is recognised in the income statement under special items.
Acquisition and disposal of non-controlling interests. On acquisition of non-controlling interests (i.e.subsequent to the Carlsberg Breweries Group obtaining control), acquired net assets are not remeasured atfair value.
On acquisition of non-controlling interests, the difference between the cost and the non-controlling interests’share of total carrying amount including goodwill is transferred from the non-controlling interests’ share ofequity to equity attributable to shareholders in Carlsberg A/S. The amount deducted cannot exceed the non-contr olling interests’ share of equity immediately before the transaction.
On disposal of shareholdings to non-controlling interests, the difference between the sales price and theshare of total carrying amount including goodwill acquired by the non-controlling interests is transferred from
equity attributable to shareholders in Carlsberg A/S to the non-controlling interests’ share of equity.
Fair value adjustment of put options written on non-controlling interests on or after 1 January 2010 isrecognised directly in the statement of changes in equity. Fair value adjustment of put options written before31 December 2009 is recognised in goodwill.
Foreign currency translation. For each of the reporting entities in the Group, a functional currency isdetermined. The functional currency is the primary currency used for the reporting entity’s operations.Transactions denominated in currencies other than the functional currency are considered transactionsdenominated in foreign currencies.
On initial recognition, transactions denominated in foreign currencies are translated to the functionalcurrency at the exchange rates at the transaction date. Foreign exchange differences arising between the
exchange rates at the transaction date and at the date of payment are recognised in the income statementas financial income or financial expenses.
Receivables, payables and other monetary items denominated in foreign currencies are translated at theexchange rates at the end of the reporting period. The difference between the exchange rates at the end ofthe reporting period and at the date at which the receivable or payable arose or the exchange rate in thelatest consolidated financial statements is recognised in the income statement as financial income orfinancial expenses.
On recognition in the consolidated financial statements of entities with a functional currency other than thepresentation currency of Carlsberg A/S (DKK), the income statement and statement of cash flows aretranslated at the exchange rates at the transaction date and the statement of financial position items aretranslated at the exchange rates at the end of the reporting period. An average exchange rate for the month
is used as the exchange rate at the transaction date to the extent that this does not significantly deviate fromthe exchange rate at the transaction date. Foreign exchange differences arising on translation of the openingbalance of equity of foreign entities at the exchange rates at the end of the reporting period and ontranslation of the income statement from the exchange rates at the transaction date to the exchange rates atthe end of the reporting period are recognised in other comprehensive income and attributed to a separatetranslation reserve in equity.
Foreign exchange adjustment of balances with foreign entities which are considered part of the investment inthe entity is recognised in the consolidated financial statements in other comprehensive income if thebalance is denominated in the functional currency of the Parent Company or the foreign entity.
Correspondingly, foreign exchange gains and losses on the part of loans and derivative financial instrumentswhich is designated as hedges of investments in foreign entities with a functional currency other than that of
Carlsberg A/S and which effectively hedge against corresponding foreign exchange gains and losses on the
97
7/22/2019 Carlsberg Breweries Annual Report 2012
http://slidepdf.com/reader/full/carlsberg-breweries-annual-report-2012 98/152
investment in the entity are also recognised in other comprehensive income and attributed to a separatetranslation reserve in equity.
On recognition in the consolidated financial statements of associates with a functional currency other thanthe presentation currency of Carlsberg A/S, the share of profit/loss and other comprehensive income for the
year is translated at average exchange rates and the share of equity, including goodwill, is translated at theexchange rates at the end of the reporting period. Foreign exchange differences arising on the translation ofthe share of the opening balance of equity of foreign associates at the exchange rates at the end of thereporting period, and on translation of the share of profit/loss and other comprehensive income for the yearfrom average exchange rates to the exchange rates at the end of the reporting period, are recognised inother comprehensive income and attributed to a separate translation reserve in equity.
On complete or partial disposal of a foreign entity or on repayment of balances which constitute part of thenet investment in the foreign entity, the share of the cumulative amount of the exchange differencesrecognised in other comprehensive income relating to that foreign entity is recognised inthe income statement when the gain or loss on disposal is recognised.Prior to translation of the financial statements of foreign entities in countries with hyperinflation, the financialstatements are inflation-adjusted for changes in purchasing power in the local currency. Inflation adjustment
is based on relevant price indexes at the end of the reporting period.
Hyperinflation. The financial statements of foreign entities whose functional currency is the currency of a
hyperinflationary market are stated in terms of the measuring unit current at the end of the reporting periodusing a general price index. Non-monetary assets are restated to the current purchasing power at thereporting date from the value on the date when they were first recognised in the financial statements (or thevalue on 1 January 2004 when the Group adopted IFRS). The gain/loss is recognised in othercomprehensive income. Gain/loss on the net monetary position is recognised as financial income orexpenses in the income statement. Income statement items are restated from the value on the transactiondate to the value on the reporting date except for items related to non-monetary assets, such as depreciationand amortisation and consumption of inventories etc. Deferred tax is adjusted accordingly. The comparativefigures for the Group are not restated in terms of the measuring unit current at the end of the reporting period.
Derivative financial instruments. Derivative financial instruments are initially recognised in the statementof financial position at fair value on the trade date and subsequently measured at fair value. Attributabletransaction costs are recognised in the income statement.
The fair values of derivative financial instruments are included in other receivables and other payables, andpositive and negative values are offset only when the Group has the right and the intention to settle severalfinancial instruments net. Fair values of derivative financial instruments are computed on the basis of currentmarket data and generally accepted valuation methods.
Changes in the fair value of derivative financial instruments designated as and qualifying for recognition as afair value hedge of recognised assets and liabilities are recognised in the income statement, together withchanges in the value of the hedged asset or liability with respect to the hedged portion. Except for foreigncurrency hedges, hedging of future cash flows according to a firm agreement is treated as a fair value hedge
of a recognised asset or liability.
Changes in the portion of the fair value of derivative financial instruments which are designated and qualifyas a cash flow hedge and which effectively hedge changes in the value of the hedged item are recognised inother comprehensive income and attributed to a separate reserve in equity. When the hedged transactionresults in gains or losses, amounts previously recognised in other comprehensive income are transferred tothe same item as the hedged item when the hedged risk impacts the income statement. When the hedgeditem is a non-financial asset, the amount recognised in other comprehensive income is transferred to thecarrying amount of the asset when the non-financial asset is recognised.
Derivatives designated as and qualifying for recognition as a cash flow hedge of financial investments arerecognised in other comprehensive income. On complete or partial disposal of the financial investment, theportion of the hedging instrument that is recognised in other comprehensive income and relates to that
financial investment is recognised in the income statement when the gain or loss on disposal is recognised.
98

7/22/2019 Carlsberg Breweries Annual Report 2012
http://slidepdf.com/reader/full/carlsberg-breweries-annual-report-2012 99/152
For derivative financial instruments that do not qualify for hedge accounting, changes in fair value arerecognised in the income statement as financial income or financial expenses.
Changes in the fair value of derivative financial instruments used to hedge net investments in foreign
subsidiaries, joint ventures or associates and which effectively hedge currency fluctuations in these entitiesare recognised in the consolidated financial statements in other comprehensive income and attributed to aseparate translation reserve in equity.
Embedded derivatives are recognised separately from the host contract and measured at fair value if theireconomic characteristics and risks are not closely related to those of the host contract, as a separateinstrument with the same terms would meet the definition of a derivative, and the entire combined instrumentis not measured at fair value through profit and loss. Separated embedded derivatives are subsequentlymeasured at fair value.
Income statement
Revenue. Revenue from the sale of finished goods and goods for resale is recognised in the incomestatement provided that transfer of all significant risks and rewards to the buyer has taken place and that theincome can be reliably measured and is expected to be received.
Royalty and licence fees are recognised when earned according to the terms of the licence agreements.
Revenue is measured excl. VAT and duties, including excise duties on beer and soft drinks, and discounts.
Cost of sales. Cost of sales comprises costs incurred in generating the revenue for the year anddevelopment costs. Such costs include direct and indirect costs for raw materials and consumables, wagesand salaries, rent and leases, and depreciation of production plant and returnable packaging.
Sales and distribution expenses. Costs incurred in distributing goods sold during the year and in
conducting sales campaigns etc. during the year are recognised as sales and distribution expenses. Alsoincluded are costs relating to sales staff, sponsorships, advertising and in-store display expenses, as well asdepreciation and impairment of sales equipment.
Administrative expenses. Administrative expenses comprise expenses incurred during the year formanagement and administration, including expenses for administrative staff, office premises and officeexpenses, and depreciation and write-downs for bad debt losses.
Other operating income and expenses. Other operating income and expenses comprise items secondaryto the principal activities of the entities, including income and expenses relating to rental properties, hotels,and gains and losses on the disposal of intangible assets and property, plant and equipment. Gains andlosses on the disposal of intangible assets and property, plant and equipment are determined as the salesprice less selling costs and the carrying amount at the disposal date. Also included in this item are the
effective interest rate on on-trade loans calculated on the basis of amortised cost, expenses relating to theresearch activities in France.
Government grants. Government grants relate to grants and funding for R&D activities, investment grantsetc.
Grants for R&D activities which are recognised directly in the income statement are recognised as otheroperating income.
Grants for the acquisition of assets and development projects are recognised in the statement of financialposition as deferred income and transferred to other operating income in the income statement as the assetsfor which the grants were awarded are amortised.
99

7/22/2019 Carlsberg Breweries Annual Report 2012
http://slidepdf.com/reader/full/carlsberg-breweries-annual-report-2012 100/152
Operating profit before special items. Operating profit before special items is an important financial ratiofor year-over-year comparison and for comparison of companies in the brewing industry.
Special items. Special items include significant income and costs of a special nature in terms of theGroup’s revenue-generating operating activities, such as the cost of extensive structuring of processes and
fundamental structural adjustments, as well as any gains or losses arising from disposals in this connectionwhich have a material effect over a given period. This item also includes significant non-recurring items,including impairment of goodwill (including goodwill in joint ventures and associates) and trademarks, andgains and losses on the disposal of activities, revaluation of the shareholding in an entity held immediatelybefore a step acquisition of that entity and transaction costs in a business combination.
These items are shown separately in order to give a more true and fair view of the Group’s operating profit.
Profits/losses from investments in associates. The proportionate share of the results of associates aftertax is recognised in the consolidated income statement after elimination of the proportionate share ofunrealised intra-Group profits/losses.
Financial income and expenses. Financial income and expenses comprise interest income and expenses,
gains and losses on securities and impairment of securities, payables and transactions denominated inforeign currencies, amortisation of financial assets (other than loans to customers in the on-trade, which areincluded in other operating income) and liabilities, including defined benefit retirement benefit plans,surcharges and refunds under the on-account tax scheme etc. Realised and unrealised gains and losseson derivative financial instruments which are not designated as hedging arrangements and the ineffectiveportion of those designated as hedging arrangements are also included.
Borrowing costs on specific or general borrowings which are directly attributable to the development orconstruction of a qualifying asset are included in the cost of that asset.
Tax on profit/loss for the year. Tax for the year comprises current tax and changes in deferred tax for theyear, including changes as a result of a change in the tax rate. The tax expense relating to the profit/loss forthe year is recognised in the income statement, and the tax expense relating to other comprehensive income
is recognised in other comprehensive income. Carlsberg A/S is subject to the Danish rules on mandatory joint taxation of the Carlsberg Breweries Group’s Danish companies. Danish subsidiaries are included in the jointtaxation from the date when they are included in the consolidated financial statements and up to the datewhen they are excluded from the consolidation.
Carlsberg A/S is the administrative company under the joint taxation scheme and accordingly pays allincome taxes to the tax authorities.
The jointly taxed Danish companies are taxed under the on-account tax scheme.
On payment of joint taxation contributions, the current Danish corporation tax is allocated between theDanish jointly taxed companies in proportion to their taxable income. Companies with tax losses receive joint
taxation contributions from other companies that have used the tax losses to reduce their own taxable profit(full absorption).
If the Carlsberg Breweries Group obtains a tax deduction on computation of the taxable income in Denmarkor in foreign jurisdictions as a result of share-based payment programmes, the tax effect of the programmesisrecognised in tax on the profit/loss for the year. However, if the total tax deduction exceeds the total taxexpense, the tax benefit for the excess deduction is recognised in other comprehensive income.
100

7/22/2019 Carlsberg Breweries Annual Report 2012
http://slidepdf.com/reader/full/carlsberg-breweries-annual-report-2012 101/152
Statement of financial position
Intangible assets
Goodwi l l . Goodwill is initially recognised in the statement of financial position at cost as described under
Business combinations. Subsequently, goodwill is measured at cost less accumulated impairment losses.Goodwill is not amortised.
The carrying amount of goodwill is allocated to the Group’s cash-generating units at the acquisition date.Identification of cash-generating units is based on the management structure and internal financial control.
Other intangible assets. Trademarks and customer agreements/portfolios acquired in connection withbusiness combinations are recognised at cost and amortised over their expected useful life. Trademarks withan indefinite useful life are not amortised but impairment-tested at least annually.
Research costs are recognised in the income statement as they are incurred. Development costs arerecognised as intangible assets if the costs are expected to generate future economic benefits.
Costs for development and implementation of substantial IT systems are capitalised and amortised over theirestimated useful life. Cost comprises the purchase price and any costs directly attributable to the acquisitionand installation until the date when the asset is available for use. The cost of self-constructed assetscomprises direct and indirect costs of software, licences, components, subcontractors, wages and salaries,and capitalised borrowing costs on specific or general borrowing attributable to the construction of the asset.
CO2 emission rights are measured at cost at the date of allocation (i.e. normally DKK 0), while acquired
rights are measured at cost. Acquired rights are amortised over the production period during which they areexpected to be utilised. A liability is recognised (at fair value) only if actual emissions of CO
2 exceed
allocated levels based on the holding of rights.
Other intangible assets are measured at cost less accumulated amortisation and impairment losses.
Amortisation is carried out systematically over the expected useful lives of the assets. The expected usefullives are as follows:
Trademarks with finite useful lifeUseful life, normally maximum 20 yearsSoftware etc.Normally 3-5 years. Group-wide systems developed as an integrated part of a major business developmentprogramme: 5-7 yearsDelivery rightsDepending on contract; if no contract term has been agreed, normally not exceeding 5 yearsCustomer agreements/relationshipsDepending on contract with the customer. When no contract exists, normally not exceeding 20 years
The useful life is reassessed annually. When changing the amortisation period due to a change in the usefullife, the effect on the amortisation is recognised prospectively as a change in accounting estimates.
Amortisation is recognised in the income statement under cost of sales, sales and distribution costs, andadministrative expenses to the extent that amortisation is not included in the cost of self-constructed assets.
Impairment losses of a non-recurring nature are recognised in the income statement under special items.
Tangible assets
Property, plant and equipment. Land and buildings, plant and machinery, fixtures and fittings, and otherproperty, plant and equipment are measured at cost less accumulated depreciation and impairment losses.
101

7/22/2019 Carlsberg Breweries Annual Report 2012
http://slidepdf.com/reader/full/carlsberg-breweries-annual-report-2012 102/152
Cost comprises the purchase price and any costs directly attributable to the acquisition until the date whenthe asset is available for use. The cost of self-constructed assets comprises direct and indirect costs ofmaterials, components, subsuppliers, wages and salaries, and capitalised borrowing costs on specific orgeneral borrowing attributable to the construction of the asset. The present value of estimated liabilitiesrelated to dismantling and removing the asset and restoring the site on which the asset is located is
added to the cost of self-constructed assets if the liabilities are provided for. Where individual components ofan item of property, plant and equipment have different useful lives, they are accounted for as separateitems and are depreciated separately.
The cost of assets held under finance leases is stated at the lower of fair value of the assets and the presentvalue of the future minimum lease payments. For the calculation of the net present value, the interest rateimplicit in the lease or an approximation thereof is used as the discount rate.
Subsequent costs, e.g. in connection with replacement of components of property, plant and equipment, arerecognised in the carrying amount of the asset if it is probable that the costs will result in future economicbenefits for the Group. The replaced components are derecognised in the statement of financial position andrecognised as an expense in the income statement. Costs incurred for ordinary repairs and maintenance arerecognised in the income statement as incurred.
Property, plant and equipment, including assets held under finance leases, are depreciated on a straight-linebasis over the expected useful lives of the assets. The expected useful lives are as follows:
Buildings 20-40 yearsTechnical installations 15 yearsBrewery equipment 15 yearsFilling and bottling equipment 8-15 yearsTechnical installations in warehouses 8 yearsOn-trade and distribution equipment 5 yearsFixtures and fittings, other plant and equipment 5-8 yearsReturnable packaging 3-10 yearsHardware 3-5 years
Land is not depreciated.
The basis of depreciation is calculated on the basis of the cost less the residual value and impairment losses.The residual value is determined at the acquisition date and reassessed annually. If the residual valueexceeds the carrying amount, depreciation is discontinued.
When changing the depreciation period or the residual value, the effect on the depreciation is recognisedprospectively as a change in accounting estimates.
Depreciation and minor impairment losses are recognised in the income statement under cost of sales, salesand distribution costs, and administrative expenses to the extent that depreciation is not included in the costof self-constructed assets.
Significant impairment losses of a non-recurring nature are recognised in the income statement underspecial items.
Investments in associates. Investments in associates are recognised according to the equity method andmeasured at the proportionate share of the entities’ net asset values calculated in accordance with theGroup’s accounting policies, minus or plus the proportionate share of unrealised intra-Group profits andLosses, and plus the carrying amount of goodwill.
Investments in associates with negative net asset values are measured at DKK 0. If the Group has a legal orconstructive obligation to cover a deficit in the associate, the deficit is recognised under provisions.
Any amounts owed by associates are written down to the extent that the amount owed is deemed
irrecoverable.
102

7/22/2019 Carlsberg Breweries Annual Report 2012
http://slidepdf.com/reader/full/carlsberg-breweries-annual-report-2012 103/152
On acquisition of investments in associates, the acquisition method is used, cf. the description underBusiness combinations.
Inventories. Inventories are measured at the lower of weighted average cost and net realisable value.
Goods for resale and raw materials and consumables are measured at cost, comprising purchase price anddelivery costs.
Finished goods and work in progress are measured at cost, comprising the cost of raw materials,consumables, direct wages and salaries, and indirect production overheads. Indirect production overheadscomprise indirect materials and wages and salaries, and maintenance and depreciation of productionmachinery, buildings and equipment, and production administration and management.
The net realisable value of inventories is calculated as the sales amount less costs of completion and costsnecessary to make the sale, and is determined taking into account marketability, obsolescence anddevelopment in expected sales price.
Receivables. Receivables are measured at amortised cost less impairment losses. Receivables are writtendown for bad debt losses on the basis of customers’ anticipated ability to pay and expectations of anychanges to this ability, taking into account historical payment patterns, terms of payment, customer segment,creditworthiness and prevailing market conditions in the individual markets.
Objective indication of impairment is assessed for a portfolio of receivables when no objective indication ofindividual impairment losses exists. The portfolios are based on on-trade and off-trade customers, and on-trade receivables and on-trade loans. The objective indications used for portfolios are based on historicalexperiences and actual market developments.
Impairment losses are calculated as the difference between carrying amount and net realisable value,including the expected net realisable value of any collateral provided.
Regarding loans to the on-trade, any difference between present value and the nominal amount at the loandate is treated as a prepaid discount to the customer, which is recognised in the income statement inaccordance with the terms of the agreement. The market interest rate is used as the discount rate,corresponding to the money market rate based on the maturity of the loan with the addition of a risk premium.The effective interest rate on these loans is recognised in other operating income. The amortisation of thedifference between the discount rate and the effective interest rate is included as a discount in revenue.
Prepayments. Prepayments comprise costs incurred concerning subsequent financial years, including inparticular sponsorship and marketing costs. Prepayments are measured at cost.
Securities. Shares not classified as investments in subsidiaries or associates and bonds are classified assecurities available-for-sale. Such securities are recognised at the trade date. Upon initial recognition,securities are measured at fair value plus any directly attributable transaction costs and are subsequently
measured at fair value corresponding to the market price of quoted securities and, for unquoted securities,an estimated fair value computed on the basis of market data and generally accepted valuation methods.Unrealised value adjustments are recognised in other comprehensive income except for impairment lossesand foreign exchange adjustments of bonds denominated in foreign currencies, which are recognised in theincome statement as financial income or financial expenses. On realisation, the accumulated valueadjustment recognised in other comprehensive income is transferred to the income statement.
Securities available-for-sale are classified as current and non-current on the basis of management’s sellingplans. The Group has no securities classified as a trading portfolio.
Impairment of assets. Goodwill and trademarks with indefinite useful life are subject to an annualimpairment test, initially before the end of the acquisition year.
103

7/22/2019 Carlsberg Breweries Annual Report 2012
http://slidepdf.com/reader/full/carlsberg-breweries-annual-report-2012 104/152

7/22/2019 Carlsberg Breweries Annual Report 2012
http://slidepdf.com/reader/full/carlsberg-breweries-annual-report-2012 105/152
Treasury sh ares. Cost of acquisition, consideration received and dividends received from treasury sharesare recognised directly as retained earnings in equity. Capital reductions from the cancellation of treasuryshares are deducted from the share capital at an amount corresponding to the nominal value of the shares.
Proceeds from the sale of treasury shares in connection with the exercise of share options are recognised
directly in equity.
Share-based payment. The value of services received in exchange for granted options is measured at thefair value of the options granted.
The share option programme for the Executive Board and other management personnel in the Group is anequity-settled scheme. The share options are measured at fair value at the grant date and recognised in theincome statement under staff costs over the vesting period.
Other key employees in the Group who participate in the long-term incentive programme choose betweensettlement in share options and a cash bonus. The share options are measured at fair value at the grant dateand recognised in the income statement under staff costs over the vesting period. The value of the long-termincentive programme is calculated as a percentage of the employee’s yearly salary. If the employee chooses
to receive share options under the long-term incentive programme, the number of share options isdetermined based on the employee’s salary and the fair value of a share option.
On initial recognition of the share options, an estimate is made of the number of options expected to vest, cf.the service condition for each programme. That estimate is subsequently revised for changes in the numberof options expected to vest. Accordingly, recognition is based on the number of options that ultimately vested.
The fair value of granted share options is estimated using the Black-Scholes call option pricing model, takinginto account the terms and conditions upon which the options were granted.
Employee benefits. Wages and salaries, social security contributions, paid leave and sick leave, bonusesand other employee benefits are recognised in the financial year in which the employee renders the relatedservice. This includes the payment to other management personnel in the Group who participate in the long-
term incentive programme and choose cash settlement. The cost is provided for over the vesting period ofthe programme and according to the service conditions and included in staff costs and provisions.
Retirement benefit obligations and similar obligations. The Group has entered into retirement benefitschemes and similar arrangements with the majority of the Group’s employees.
Contributions to defined contribution plans are recognised in the income statement in the period to whichthey relate and any contributions outstanding are recognised in the statement of financial position as otherpayables.
For all defined benefit plans an annual actuarial calculation is made of the present value of future benefitsunder the defined benefit plan. The present value is determined on the basis of assumptions about the futuredevelopment in variables such as salary levels, interest rates, inflation and mortality. The present value is
determined only for benefits earned by employees from their employment with the Group. The actuarialpresent value less the fair value of any plan assets is recognised in the statement of financial positionunder retirement benefit obligations.
Pension costs for the year are recognised in the income statement based on actuarial estimates andfinancial expectations at the beginning of the year. Any difference between the expected development inpension plan assets and liabilities and realised amounts determined at year-end constitutes actuarial gainsor losses and is recognised in other comprehensive income.
If changes in benefits relating to services rendered by employees in previous years result in changes in theactuarial present value, the changes are recognised as historical costs. Historical costs are recognisedimmediately, provided employees have already earned the changed benefits. If employees have not earnedthe benefits, the historical costs are recognised in the income statement over the period in which the
105

7/22/2019 Carlsberg Breweries Annual Report 2012
http://slidepdf.com/reader/full/carlsberg-breweries-annual-report-2012 106/152
changed benefits are earned by the employees. If a retirement benefit plan constitutes a net asset, the assetis only recognised if it offsets future refunds from the plan or will lead to reduced future payments to the plan.
Interest on retirement benefit obligations and the expected return on plan assets are recognised underfinancial income or financial expenses.
Realised gains and losses on the adjustment of retirement benefit obligations as a result of large-scaletermination of jobs in connection with restructuring are recognised in the income statement under specialitems.
Realised gains and losses on the curtailment or settlement of retirement benefit plans are recognised in theincome statement.
Corporation tax and deferred tax. Current tax payable and receivable is recognised in the statement offinancial position as tax computed on the taxable income for the year, adjusted for tax on the taxable incomeof prior years and for tax paid on account.
Deferred tax on all temporary differences between the carrying amount and the tax base of assets and
liabilities is measured using the balance sheet liability method. However, deferred tax is not recognised ontemporary differences relating to goodwill which is not deductible for tax purposes or on office premises andother items where temporary differences, apart from business combinations, arise at the acquisition datewithout affecting either profit/loss for the year or taxable income. Where alternative tax rules can be appliedto determine the tax base, deferred tax is measured based on management’s planned use of the asset orsettlement of the liability.
If specific dividend plans exist for subsidiaries, joint ventures and associates in countries levying withholdingtax on distributions, deferred tax is recognised on expected dividend payments.
Deferred tax assets, including the tax base of tax loss carryforwards, are recognised under other non-currentassets at the expected value of their utilisation, either as a set-off against tax on future income or as a set-offagainst deferred tax liabilities in the same legal tax entity and jurisdiction.
Deferred tax assets and tax liabilities are offset if the entity has a legally enforceable right to offset currenttax liabilities and tax assets or intends either to settle current tax liabilities and tax assets on a net basis or torealise the assets and settle the liabilities simultaneously.
Adjustment is made to deferred tax resulting from elimination of unrealised intra-Group profits and losses.
Deferred tax is measured according to the tax rules and at the tax rates applicable in the respectivecountries at the end of the reporting period when the deferred tax is expected to crystallise as current tax.The change in deferred tax as a result of changes in tax rates is recognised in the income statement.Changes to deferred tax recognised in other comprehensive income are, however, recognised in othercomprehensive income.
Provisions. Provisions, including warranty provisions, are recognised when, as a result of events arisingbefore or at the end of the reporting period, the Group has a legal or a constructive obligation and it isprobable that there may be an outflow of resources embodying economic benefits to settle the obligation.Other provisions are discounted if the effect is material to the measurement of the liability. The CarlsbergBreweries Group’s average borrowing rate is used as the discount rate.
Restructuring costs are recognised under liabilities when a detailed, formal restructuring plan has beenannounced to the persons affected no later than at the end of the reporting period. On acquisition of entities,restructuring provisions in the acquiree are only included in the opening balance when the acquiree has arestructuring liability at the acquisition date.
A provision for onerous contracts is recognised when the benefits expected to be derived by the Group froma contract are lower than the unavoidable costs of meeting its obligations under the contract.
106

7/22/2019 Carlsberg Breweries Annual Report 2012
http://slidepdf.com/reader/full/carlsberg-breweries-annual-report-2012 107/152
When the Group has a legal obligation to dismantle or remove an asset or restore the site on which the assetis located, a provision is recognised corresponding to the present value of expected future costs.
Financial liabilities. Amounts owed to credit institutions, bonds etc. are recognised at the date of borrowingat fair value less transaction costs. In subsequent periods, the financial liabilities are measured at amortised
cost using the effective interest method. Accordingly, the difference between the fair value less transactioncosts and the nominal value is recognised in the income statement under financial expenses over the term ofthe loan.
Financial liabilities also include the capitalised residual obligation on finance leases, which is measured atamortised cost.
Other liabilities are measured at amortised cost.
Deposits on returnable packaging. The refund obligation in respect of deposits on returnable packaging is
stated on the basis of deposit price as well as an estimate of the number of bottles, kegs, cans and crates incirculation, and expected return rate.
Leases. For accounting purposes, lease obligations are divided into finance and operating leases.
Leases are classified as finance leases if they transfer substantially all the risks and rewards incident toownership to the lessee. All other leases are classified as operating leases.
The accounting treatment of assets held under finance leases and lease obligations is described underProperty, plant and equipment and Financial liabilities respectively.
Operating lease payments are recognised in the income statement on a straight-line basis over the leaseterm.
Deferred income. Deferred income comprises payments received concerning income in subsequent yearsand is measured at cost.
Assets held for sale. Assets held for sale comprise non-current assets and disposal groups held for sale.Disposal groups are defined as a group of assets to be disposed of, by sale or otherwise, together as agroup in a single transaction and those liabilities directly associated with the assets that will be transferred inthe transaction.
Assets are classified as held for sale if management has decided to sell the asset or disposal group andtaken the necessary steps to carry out the sale such that the carrying amount will be recovered principallythrough a sale within 12 months in accordance with a formal plan rather than through continuing use.
Assets or disposal groups held for sale are measured at the lower of carrying amount or fair value less coststo sell. Assets are not depreciated or amortised from the date when they are reclassified as held for sale.
Impairment losses on initial recognition as held for sale and gains and losses on subsequent remeasurementat the lower of carrying amount and fair value less costs to sell are recognised in the income statement in theitems to which they relate. Gains and losses are disclosed in the notes.
Assets and liabilities are recognised separately in the statement of financial position and main items arespecified in the notes. Comparative figures are not restated.
If a sale is not completed as expected, the asset or disposal group is reclassified to the items in thestatement of financial position from which the asset or disposal group was originally separated. Thisreclassification is made at the carrying amount less any depreciation charges that would have beenrecognised if the asset had not been classified as held for sale.
107

7/22/2019 Carlsberg Breweries Annual Report 2012
http://slidepdf.com/reader/full/carlsberg-breweries-annual-report-2012 108/152
Presentation of discontinued operations. Discontinued operations comprise activities and cash flows thatcan be clearly distinguished from the other business areas and have either been disposed of or are held forsale. The sale is expected to be carried out within 12 months in accordance with a formal plan.
Discontinued operations also include entities which are classified as held for sale in connection with an
acquisition.
Discontinued operations are presented in a separate line in the income statement and as assets andliabilities held for sale in the statement of financial position, and main items are specified in the notes.Comparative figures are restated.
Statement of cash flows
The statement of cash flows shows the cash flows from operating, investing and financing activities for theyear, the year’s changes in cash and cash equivalents as well as cash and cash equivalents at the beginningand end of the year.
Cash flow from operating activities. Cash flows from operating activities are calculated using the indirectmethod as the operating profit before special items adjusted for non-cash operating items, changes inworking capital, restructuring costs paid, interest received and paid, and income tax paid.
Cash flow from investing activities. Cash flows from investing activities comprise payments in connectionwith acquisitions and disposals of entities and activities, and of intangible assets, property, plant andequipment and other non-current assets, as well as acquisition and disposal of securities not recognised ascash and cash equivalents.
The cash flow effect of acquisitions and disposals of entities is shown separately in cash flows from investingactivities. Cash flows from acquisitions of entities are recognised in the statement of cash flows from theacquisition date. Cash flows from disposals of entities are recognised up until the disposal date.
Acquisitions of assets by means of finance leases are treated as non-cash transactions.
Cash flow from financing activities. Cash flows from financing activities comprise changes in the size orcomposition of the share capital and related costs as well as the acquisition and disposal of non-controllinginterests, raising of loans, repayment of interest-bearing debt, acquisition and disposal of treasury shares,and payment of dividends to shareholders.
Cash flows from assets held under finance leases are recognised as payment of interest and repayment ofdebt.
Cash and cash equivalents. Cash and cash equivalents comprise cash, less bank overdrafts, and short-term marketable securities with a term of three months or less at the acquisition date which are subject to aninsignificant risk of changes in value.
Cash flows in currencies other than the functional currency are translated using average exchange rates,unless these deviate significantly from the exchange rates at the transaction date.
Segment information
For segment reporting purposes, the Chief Operating Decision Maker is the Executive Committee. TheExecutive Committee manages and makes business decisions based on geographical regional information.Segments are managed and decisions are made based on business performance measured as operatingprofit before special items. Decisions on financing and tax planning are made based on information for theGroup as a whole and therefore not segmented. The non-beverage activities are managed separately andtherefore also shown separately. The segmentation reflects the structure used for internal reporting andmonitoring of the strategic and financial targets of the Carlsberg Breweries Group.
108

7/22/2019 Carlsberg Breweries Annual Report 2012
http://slidepdf.com/reader/full/carlsberg-breweries-annual-report-2012 109/152
In accordance with the Group’s management structure, beverage activities are segmented according to thegeographical regions where production takes place. The segment information is based on the Group’saccounting policies.
A segment’s operating profit/loss includes revenue, operating costs and share of profit/loss in associates to
the extent that they can be allocated directly to the individual segment. Income and expenses related toGroup functions have not been allocated and, as is the case with eliminations and non-beverage activities,are not included in the operating profit/loss of the segments.
Total segment assets comprise non-current assets used directly in the operating activities of the segment,including intangible assets, property, plant and equipment, investments in associates and current segmentassets to the extent that they can be allocated directly to the individual segment, including inventories, tradereceivables, other receivables and prepayments.
Financial ratios
Earnings per share (EPS) and diluted earnings per share (EPS-D) are calculated in accordance with IAS 33.
Other financial ratios are calculated in accordance with the Danish Society of Financial Analysts’ guidelineson the calculation of financial ratios, “Recommendations and Financial Ratios 2010”, unless specificallystated.
The key figures and financial ratios stated in Annual Report have been calculated as follows:
Cash flow per share (CFPS) Cash flow from operating activities divided by the number of sharesoutstanding, fully diluted for share options in the money in accordance with IAS 33
1.
Debt/operating profit before depreciation, amortisation and impairment. Net interest-bearing debt2
divided by operating profit before special items adjusted for depreciation, amortisation and impairment.
Earnings per share (EPS) Consolidated profit for the year, excluding non-controlling interests, divided by
the average number of shares outstanding.
Earnings per share, adjusted (EPS-A) Consolidated profit for the year adjusted for special items net of tax,excluding non-controlling interests, divided by the average number of shares outstanding.
Earnings per share, diluted (EPS-D) Consolidated profit for the year, excluding non-controlling interests,divided by the average number of shares outstanding, fully diluted for share options in the money and thebonus element in a rights issue in accordance with IAS 33
1.
Equity ratio Equity attributable to shareholders in Carlsberg A/S at year-end as a percentage of total assetsat year-end.
Financial gearing Net interest-bearing debt2 at year-end divided by total equity at year-end.
Free cash flow per share (FCFPS) Free cash flow3 divided by average number of shares outstanding, fully
diluted for share options in the money in accordance with IAS 331.
Interest cover Operating profit before special items divided by interest expenses, net.
Number of shares, average The number of issued shares, excluding treasury shares, as an average for
the year (= average number of shares outstanding).
Number of shares, year-end Total number of issued shares, excluding treasury shares, at year-end (=number of shares outstanding at year-end).
Operating margin Operating profit before special items as a percentage of revenue.
109
7/22/2019 Carlsberg Breweries Annual Report 2012
http://slidepdf.com/reader/full/carlsberg-breweries-annual-report-2012 110/152
Operating profit Expression used for operating profit before special items in the Management review.
Organic development Measure of growth excluding the impact of acquisitions, divestitures and foreignexchange from year-over-year comparisons. We believe this provides investors with a better understandingof underlying trends.
Pay-out ratio Dividend for the year as a percentage of consolidated profit, excluding non-controllinginterests.
Pro rata volumes The Group’s total sale of beverages, including the pro rata share of sales throughproportionally consolidated entities and associates.
Return on average invested capital, including goodwill (ROIC) Operating profit before special items as apercentage of average invested capital
4.
Volumes The Group’s total sale of beverages, including the total sales through proportionally consolidatedentities and associates.
1 The dilutive effect is calculated as the difference between the number of shares that could be acquired atfair value for the proceeds from the exercise of the share options and the number of shares that could beissued assuming that the options are exercised.2 The calculation of net interest-bearing debt is specified in note 33.3 The calculation of free cash flow is specified in the statement of cash flows.4 The calculation of invested capital is specified in note 32.
110

7/22/2019 Carlsberg Breweries Annual Report 2012
http://slidepdf.com/reader/full/carlsberg-breweries-annual-report-2012 111/152
Carlsberg Breweries Group
42 Group companies
Carlsberg Breweries A/S
Ownershipshare 1
Nominalshare capital
(’000) Currency Exchange
rate
Western Europe
Carlsberg Danmark A/S, Copenhagen, Denmark 1 subsidiary 100% 100,000 DKK 100.00
Carlsberg Sverige AB, Stockholm, Sweden 1 subsidiary 100% 70,000 SEK 87.14
Ringnes AS, Oslo, Norway 2 subsidiaries 100% 231,274 NOK 101.67
Oy Sinebrychoff Ab, Helsinki, Finland 100% 96,707 EUR 746.04
Carlsberg Deutschland GmbH, Hamburg, Germany 3 subsidiaries 100% 26,900 EUR 746.04
Nordic Getränke GmbH, Hamburg, Germany 15 subsidiaries n 50% 5,000 EUR 746.04
Holsten-Brauerei Aktiengesellschaft, Hamburg, Germany 4 subsidiaries 100% 41,250 EUR 746.04
Carlsberg Polska S. A., Warszaw, Poland 1 subsidiary 100% 28,721 PLN 182.81
Saku Ölletehase AS, Tallinn, Estonia 100% 5,113 EUR 746.04
JSC Aldaris, Riga, Latvia 98% 7,500 LVL 1,069.13
UAB Svyturys-Utenos Alus, Utena, Lithuania 99% 118,000 LTL 216.07
Carlsberg UK Holdings Limited, Northampton, United Kingdom 1 subsidiary 100% 90,004 GBP 913.20
Carlsberg UK Limited, Northampton, United Kingdom 6 subsidiaries
100% 2,100 GBP 913.20 Emeraude S.A.S., Strasbourg, France 6 subsidiaries 3 100% 206,022 EUR 746.04
Brasseries Kronenbourg S.A.S., Strasbourg, France 6 subsidiaries 100% 507,891 EUR 746.04
Feldschlösschen Getränke Holding AG, Rheinfelden, Switzerland 4 subsidiaries 100% 95,000 CHF 617.58
Carlsberg Italia S.p.A., Lainate, Italy 3 subsidiaries 100% 8,600 EUR 746.04
Unicer - Bebidas de Portugal, S.G.P.S., S.A., Leca do Balio, Portugal 5 subsidiaries 3 t 44% 50,000 EUR 746.04
Mythos Brewery SA, Thessaloniki, Greece 100% 39,405 EUR 746.04
Carlsberg Serbia d.o.o, Celarevo, Serbia 2 subsidiaries 100% 2,998,273 RSD 6.56
Carlsberg Croatia d.o.o., Koprivnica, Croatia 100% 239,932 HRK 98.87
Carlsberg Bulgaria AD, Mladost, Bulgaria 100% 37,325 BGN 381.45
B to B Distribution EOOD, Mladost, Bulgaria 100% 10 BGN 381.45
Carlsberg Hungary Kft., Budaörs, Hungary 100% 25,600 HUF 2.57
CTDD Beer Imports Ltd., Montreal, Canada 100% 532 CAD 568.54
Carlsberg Canada Inc., Mississauga, Canada 100% 11,000 CAD 568.54
Investeringsaksjeselskapet RH AS, Oslo, Norway 7 subsidiaries 100% 50,000 NOK 101.67
Pripps Ringnes AB, Stockholm, Sweden 1 subsidiary 100% 287,457 SEK 87.14 Baltic Beverages Holding OÜ, Tallinn, Estonia 100% 3 EUR 746.04
Nuuk Imeq A/S, Nuuk, Greenland n 32% 38,000 DKK 100.00
Internat ional Breweries (Netherlands) B.V., Amsterdam, Netherlands 2 subsidiar ies n 23% 56 EUR 565.91
Eastern Europe
Baltika Breweries, Saint Petersburg, Russia 4 subsidiaries 100% 156,087 RUB 18.55
Baltika Baku LLC, Baku, Azerbaijan 100% 26,849 AZN 721.07
PJSC Carlsberg Ukraine, Zaporizhzhya, Ukraine 2 subsidiaries 95% 1,022,433 UAH 70.80
OJSC Olivaria Brewery, Minsk, Belarus 1 subsidiary 68% 61,444,801 BYR 0.07
Carlsberg Kazakhstan, Almaty, Kazakhstan 1 subsidiary 100% 5,362,774 KZT 3.74
UzCarlsberg LLC., Tashkent, Uzbekistan 3 100% 82,282,014 UZS 0.28
Baltic Beverages Invest AB, Stockholm, Sweden 100% 11 EUR 746.04
Baltic Beverages Holding AB, Stockholm, Sweden 100% 12,000 EUR 746.04
111

7/22/2019 Carlsberg Breweries Annual Report 2012
http://slidepdf.com/reader/full/carlsberg-breweries-annual-report-2012 112/152
Carlsberg Breweries Group
42 Group companies
Carlsberg Breweries A/S
Ownershipshare 1
Nominalshare capital
(’000) Currency Exchange
rateAsia
Carlsberg Brewery Hong Kong Limited, Hong Kong, China 2 subsidiaries
100% 260,000 HKD 73.00 Carlsberg Brewery (Guangdong) Limited, Huizhou, China 99% 442,330 CNY 90.79
Kunming Huashi Brewery Company Limited, Kunming, China 100% 79,528 CNY 90.79
Xinjiang Wusu Beer Co., Ltd., Urumqi, China 10 subsidiaries 65% 105,480 CNY 90.79
Ningxia Xixia Jianiang Brewery Company Limited, Xixia, China 70% 194,351 CNY 90.79
Dali Beer Company Limited, Dali, China 100% 97,799 CNY 90.79
Chongqing Brewery Co., Ltd, Chongqing, China 8 subsidiaries 2,3 n 30% 483,971 CNY 90.79
Chongqing Jianiang Brewery Ltd., Chongqing, China 49% 435,000 CNY 90.79
Tibet Lhasa Brewery Company Limited, Lhasa, China n 33% 380,000 CNY 90.79
Lanzhou Huanghe Jianiang Brewery Company Limited, Lanzhou, China n 30% 210,000 CNY 90.79
Qinghai Huanghe Jianiang Brewery Company Ltd., Xining, China n 33% 85,000 CNY 90.79
Jiuquan West Brewery Company Limited, Jiuquan, China n 30% 36,000 CNY 90.79
Tianshiui Huanghe Jianiang Brewery Company Limited, Tianshui, China n 30% 58,220 CNY 90.79
Carlsberg Brewery Malaysia Berhad, Selangor Darul Ehsan, Malaysia 2 51% 300,000 MYR 184.86
Carlsberg Marketing Sdn BHD, Selangor Darul Ehsan, Malaysia 100% 10,000 MYR 184.86
Euro Distributors Sdn BHD, Selangor Darul Ehsan, Malaysia 100% 100 MYR 184.86 Luen Heng F&B Sdn BHD, Selangor Darul Ehsan, Malaysia 70% 5,000 MYR 184.86
Carlsberg Singapore Pte Ltd, Singapore 100% 1,000 SGD 462.69
Lion Brewery (Ceylon) PLC, Biyagama, Sri Lanka 2 n 25% 850,000 LKR 4.43
Carlsberg Distributors Taiwan Limited, Taipei, Taiwan 1 subsidiary n 50% 100,000 TWD 19.46
Cambrew Pte Ltd., Singapore 3 t 50% 21,720 SGD 462.69
Cambrew Ltd, Phnom Penh, Cambodia 1 subsidiary 3 t 50% 125,000 USD 565.91
Carlsberg Indochina Limited, Hanoi, Vietnam 100% 80,000,000 VND 0.03
South-East Asia Brewery Ltd., Hanoi, Vietnam 60% 212,705,000 VND 0.03
International Beverage Distributors Ltd., Hanoi, Vietnam 60% 15,622,000 VND 0.03
Hue Brewery Ltd., Hue, Vietnam 100% 216,788,000 VND 0.03
Hanoi-Vungtau Beer Joint Stock Company, Vung Tàu, Vietnam n 62% 540,000,000 VND 0.03
Ha Long Beer and Beverage Joint stock Company, Ha Long, Vietnam n 31% 30,200,000 VND 0.03
Hanoi Beer Alcohol and Beverage Joint-Stock Corporation, Hanoi, Vietnam 3 n 17% 2,318,000,000 VND 0.03
Lao Brewery Co. Ltd., Vientiane, Laos
51% 22,808,641 LAK 0.07 CB Distribution Co., Ltd., Bangkok, Thailand 100% 200,000 THB 18.49
Carlsberg India Private Limited, New Delhi, India t 100% 764,334 INR 10.28
Parag Breweries Limited, Kolkata, India t 100% 122,962 INR 10.28
The Bottling and Brewing Group Limited, Blantyre, Malawi 3 subsidiaries 3 59% 1,267,128 MWK 1.75
Brewery Invest Pte Ltd, Singapore 100% 3,200 SGD 462.69
Caretech Ltd, Hong Kong, China 3 t 50% 10,000 HKD 73.00
South Asian Breweries Pte. Ltd., Singapore t 60% 200,000 SGD 462.69
Carlsberg Asia Pte Ltd, Singapore 100% 54,914 SGD 462.69
Not allocated
Danish Malting Group A/S, Vordingborg, Denmark 100% 100,000 DKK 100.00
Danish Malting Group Polska Sp. z o.o., Sierpc, Poland 100% 20,000 PLN 182.81
Carlsberg Finans A/S, Copenhagen, Denmark 100% 25,000 DKK 100.00
Carlsberg International A/S, Copenhagen, Denmark 100% 1,100 DKK 100.00
Carlsberg Invest A/S, Copenhagen, Denmark 1 subsidiary 100% 33,000 DKK 100.00 Carlsberg IT A/S, Copenhagen, Denmark 100% 50,000 DKK 100.00
Carlsberg Insurance A/S, Copenhagen, Denmark 100% 25,000 DKK 100.00
Carlsberg Accounting Centre Sp. z.o.o., Poznan, Poland 100% 50 PLN 182.81
Subsidiariest Proportionally consolidated entitiesn Associate
1 For some entities the consolidation percentage is higher than the ownership share due to written put options
2 Listed company
3 Company not audited by KPMG
112

7/22/2019 Carlsberg Breweries Annual Report 2012
http://slidepdf.com/reader/full/carlsberg-breweries-annual-report-2012 113/152
Carlsberg Breweries A/S - Parent Company
Financial statements 2012
Income statement
Statement of comprehensive Income
Statement of financial position
Statement of changes in equity
Statement of cash flows
Notes
1 Significant accounting estimates and judgements
2 Cost of sales
3 Sales and distribution expenses
4 Fees to auditors appointed by the Annual General Meeting
5 Other operating income and expenses
6 Special items
7 Financial income and financial expenses
8 Corporation tax
9 Staff costs and remuneration of the Supervisory Board, the Executive Board and other executive employees
10 Share-based payment11 Intangible assets
12 Impairment test
13 Property, plant and equipment
14 Investments in subsidiaries
15 Associates and joint ventures
16 Securities
17 Receivables
18 Deferred tax assets and deferred tax liabilities
19 Cash and cash equivalents
20 Share capital
21 Borrowings
22 Provisions
23 Other liabilities etc.
24 Cash flows
25 Specification of net interest-bearing debt
26 Financial risks
27 Financial instruments
28 Related party disclosures
29 Contingent liabilities and other commitments
30 Events after the reporting period
31 Accounting policies
113

7/22/2019 Carlsberg Breweries Annual Report 2012
http://slidepdf.com/reader/full/carlsberg-breweries-annual-report-2012 114/152
Carlsberg Breweries A/S - Parent Company
Income statement
2012 2011Note DKK million DKK million
Net revenue 2,266 2,045
Cost of sales 2 -1,081 -846
Gross profit 1,185 1,199
Sales and distribution expenses 3 -724 -693
Administrative expenses 4 -645 -549
Other operating income 5 301 262
Other operating expenses 5 -67 -50
Operating profit before special items 50 169
Special items, net 6 463 216
Financial income 7 2,756 2,445
Financial expenses 7 -2,369 -2,212
Profit before tax 900 618
Corporation tax 8 210 -229
Profit for the year 1,110 389
Attributable to:
Dividends to shareholders in Carlsberg Breweries A/S 915 -
Reserves 195 389 Profit for the year 1,110 389
Statement of comprehensive Income 2012 2011
Note DKK million DKK million
Profit for the year 1,110 389
Other comprehensive income:
Value adjustments of hedging instruments 27 307 127
Corporation tax 8 113 78
Other comprehensive income 420 205
Total comprehensive income 1,530 594
Fair value adjustments comprise changes in the fair value of hedging transactions that qualify for recognition as cash flow hedges andwhere the hedged transaction has not yet been realised.
114

7/22/2019 Carlsberg Breweries Annual Report 2012
http://slidepdf.com/reader/full/carlsberg-breweries-annual-report-2012 115/152
Carlsberg Breweries A/S - Parent Company
Statement of financial position
31 Dec. 2012 31 Dec. 2011
Assets Note DKK million DKK million
Non-current assets:
Intangible assets 11, 12 1,113 1,119
Property, plant and equipment 12, 13 16 14
Investments in subsidiaries 14 66,682 67,538
Investments in associates and joint ventures 15 2,812 2,748
Securities 16 11 11
Receivables 17 226 4,284
Deferred tax assets 18 317 278
Total non-current assets 71,177 75,992
Current assets:
Inventory 2 -
Trade receivables 17 1,366 1,058
Other receivables 17 29,528 21,997
Prepayments 34 31
Cash and cash equivalents 19 16 15
Total current assets 30,946 23,101
Total assets 102,123 99,093
115

7/22/2019 Carlsberg Breweries Annual Report 2012
http://slidepdf.com/reader/full/carlsberg-breweries-annual-report-2012 116/152
Carlsberg Breweries A/S - Parent Company
Statement of financial position
31 Dec. 2012 31 Dec. 2011
Equity and liabilities Note DKK million DKK million
Equity:
Share capital 20 501 501
Hedging reserves -614 -1,034
Retained earnings 46,522 45,424
Total equity 46,409 44,891
Non-current liabilities:
Borrowings 21 34,877 32,064
Provisions 22 67 97
Other liabilities 23 3 -
Total non-current liabilities 34,947 32,161
Current liabilities:
Borrowings 21 18,123 19,049
Trade payables 535 553
Deposits on returnable packaging 22 28
Other liabilities, etc. 23 2,087 2,411
Total current liabilities 20,767 22,041
Total liabilities 55,714 54,202
Total equity and liabilities 102,123 99,093
116

7/22/2019 Carlsberg Breweries Annual Report 2012
http://slidepdf.com/reader/full/carlsberg-breweries-annual-report-2012 117/152
Carlsberg Breweries A/S - Parent Company
Statement of changes in equity
DKK million
Share capital
Hedging
reserves
Retained
earnings Total equity
Equity at 1 January 2012 501 -1,034 45,424 44,891
Profit for the year - - 1,110 1,110
Other comprehensive income:
Value adjustments of hedging instruments - 307 - 307
Corporation tax - 27 86 113
Other comprehensive income - 334 86 420
- 420 1,110 1,530
Share-based payment - - 17 17
Share-based payment - exercise - - -29 -29
Total changes in equity - 420 1,098 1,518
Equity at 31 December 2012 501 -614 46,522 46,409
DKK million
Share capital
Hedging
reserves
Retained
earnings Total equity
Equity at 1 January 2011 501 -1,239 44,999 44,261
Profit for the year - - 389 389
Other comprehensive income:
Value adjustments of hedging instruments - 127 - 127
Corporation tax - -32 110 78
Other comprehensive income - 95 110 205
- 205 389 594
Share-based payment - - 3 3
Share-based payment - exercise - - 33 33
Total changes in equity - 205 425 630
Equity at 31 December 2011 501 -1,034 45,424 44,891
Total comprehensive income for the year, cf. separate
statement
Shareholders in Carlsberg Breweries A/S
Total comprehensive income for the year, cf. separate
statement
The proposed dividend of DKK 1,827 per share, in total DKK 915m (2011: DKK 0.00 per share, in total DKK 0m), is included in
retained earnings at 31 December 2012. No dividends are paid out in 2012 for 2011 (no dividends are paid out in 2011 for
2010). Dividends paid out to shareholders of Carlsberg Breweries A/S do not impact taxable income in Carlsberg Breweries
A/S.
2011
2012
Shareholders in Carlsberg Breweries A/S
117

7/22/2019 Carlsberg Breweries Annual Report 2012
http://slidepdf.com/reader/full/carlsberg-breweries-annual-report-2012 118/152
Carlsberg Breweries A/S - Parent Company
Statement of cash flows
2012 2011Note DKK million DKK million
Operating profit before special items 50 169
Adjustment for depreciation and amortisation and impairment losses 15 15
Operating profit before depreciation, amortisation and impairment losses 65 184
Adjustment for other non-cash items 24 15 -4
Change in working capital 24 -245 112
Restructuring costs paid -63 -37
Interest etc. received 1,067 1,026
Interest etc. paid -2,130 -2,255
Corporation tax paid 284 46
Cash flow from operating activities -1,007 -928
Acquisition of property, plant and equipment and intangible assets -12 -13Total operational investments -12 -13
Acquired / disposed subsidiaries, net 1,566 -
Capital injection in subsidiaries -164 -553
Acquisitions of associated companies -65 -26
Dividend paid in excess of accumulated earnings from the acquisition 3 1
Change in financial receivables 21 -59
Dividends received 1,673 1,202
Total financial investments 3,034 565
Disposal of other property, plant and equipment -15 -
Total other activities -15 -
Cash flow from investing activities 3,007 552
Free cash flow 2,000 -376
External financing 24 -2,438 295
Cash flow from financing activities -2,438 295
Net cash flow -438 -81
Cash and cash equivalents at 1 January -35 46
Foreign exchange adjustment of cash and cash equivalents at 1 January - - Cash and cash equivalents at 31 December
119 -473 -35
1 Cash and cash equivalents less bank overdrafts.
118

7/22/2019 Carlsberg Breweries Annual Report 2012
http://slidepdf.com/reader/full/carlsberg-breweries-annual-report-2012 119/152
Carlsberg Breweries A/S - Parent Company
Note
1 Significant accounting estimates and judgements
In preparing Carlsberg Breweries A/S’s financial statements, management makes various accountingestimates and assumptions which form the basis of presentation, recognition and measurement of theCompany’s assets and liabilities. The most significant accounting estimates and judgements for theCompany are presented below. The most significant accounting estimates and judgements for the CarlsbergBreweries Group are presented in note 1 to the consolidated financial statements. The Company’saccounting policies are described in detail in note 31.
Estimation uncertainty
Determining the carrying amount of some assets and liabilities requires judgements, estimates andassumptions concerning future events.
The judgements, estimates and assumptions made are based on historical experience and other factorswhich management assesses to be reliable, but which by their very nature are associated with uncertaintyand unpredictability. These assumptions may prove incomplete or incorrect, and unexpected events orcircumstances may arise.
Assumptions about the future and estimation uncertainty at the end of the reporting period are described inthe notes when there is a significant risk of changes that could result in material adjustments to the carryingamount of assets or liabilities within the next financial year.
Investments in subsidiaries, joint ventures and associates. Management performs an annual test forindications of impairment of investments in subsidiaries, joint ventures and associates. Impairment tests areconducted in the same way as for goodwill in the Carlsberg Breweries Group, cf. note 41 to the consolidatedfinancial statements. It is management’s assessment that no indications of impairment existed at year-end2012. Impairment tests have therefore not been made of subsidiaries, joint ventures and associates.
Deferred tax assets. Carlsberg Breweries A/S recognises deferred tax assets, including the tax base of tax
loss carryforwards, if management assesses that these tax assets can be offset against positive taxableincome in the foreseeable future. This judgement is made annually and based on budgets and businessplans for the coming years, including planned commercial initiatives.
A more detailed description of the Company’s tax assets is presented in note 18.
119

7/22/2019 Carlsberg Breweries Annual Report 2012
http://slidepdf.com/reader/full/carlsberg-breweries-annual-report-2012 120/152
Carlsberg Breweries A/S - Parent Company
Note
2 Cost of sales
2012 2011
DKK million DKK million
Purchased finished goods and other costs 1,081 846
Total 1,081 846
3 Sales and distribution expenses
2012 2011
DKK million DKK million
Marketing expenses 510 490
Sales expenses 82 76
Distribution expenses 132 127
Total 724 693
Of which staff cost note 9 110 115
4 Fees to auditors appointed by the Annual General Meeting
2012 2011
DKK million DKK million
KPMG:
Statutory audit 3 2
Assurance engagements - -
Tax advisory 1 2
Other services 9 2
120

7/22/2019 Carlsberg Breweries Annual Report 2012
http://slidepdf.com/reader/full/carlsberg-breweries-annual-report-2012 121/152
Carlsberg Breweries A/S - Parent Company
Note
5 Other operating income and expenses
2012 2011DKK million DKK million
Other operating income:
Management fee from group companies 295 251
- 3
Other 6 8
Total 301 262
Other operating expenses:
-76 -50
Total -76 -50
6 Special items
2012 2011
DKK million DKK million
Gain on disposal of investments in subsidiaries to group companies 520 244
Gain on disposal of entities and adjustments to gain in prior year 50
Loss on external sale of activities -41 -
Impairment of intercompany receivables etc. -61 -
Restructuring cost -2 -28
Other -3 -
Special items, net 463 216
Cost of sales -3 -
Administrative expenses -28 -17
Other operating expenses - -11
Other operating income 551 -
Financial income - 244 Impairment losses -57 -
Special items, net 463 216
Gains on disposal of other property, plant and equipment and intangible assets
Loss on disposal of other property, plant and equipment and intangible assets etc.
If special items had been recognised in operating profit before special items, they
would have been included in the following items:
122

7/22/2019 Carlsberg Breweries Annual Report 2012
http://slidepdf.com/reader/full/carlsberg-breweries-annual-report-2012 122/152
Carlsberg Breweries A/S - Parent Company
Note
7 Financial income and financial expenses
2012 2011
DKK million DKK million
Financial items recognised in the income statement
Interest income 1,024 1,039
Dividends from subsidiaries and associates 1,670 1,200
Fair value adjustments of financial instruments, net, cf. note 27 55 122
Foreign exchange gains, net - 71
Realised gains on disposal of associates and securities 3 -
Other financial income 4 13
Total 2,756 2,445
Interest income relates to interest from cash and cash equivalents measured at amortised cost.
Interest expenses 2,059 1,991
Fair value adjustments of financial instruments, net, cf. note 27 182 166
Realised foreign exchange losses, net 70 -
44 -
Other financial expenses 14 55
Total 2,369 2,212
Net financial items recognised in the income statment 387 233
2012 2011
DKK million DKK million
Financial items recognised in other comprehensive income
Value adjustments of hedging instruments
Change in fair value of effective portion of cash flow hedges -78 -185
Change in fair value of cash flow hedges transferred to the income statement 385 312
Net financial items recognised in other comprehensive income 307 127
Total net financial items recognised in the statement of comprehensive income 694 360
Interest expenses primarily relate to interest on borrowings measured at amortised cost.
Bank and commitment fees
123

7/22/2019 Carlsberg Breweries Annual Report 2012
http://slidepdf.com/reader/full/carlsberg-breweries-annual-report-2012 123/152
Carlsberg Breweries A/S - Parent Company
Note
8 Corporation tax
DKK million
Total
Comprehen-
sive income
Other
compre-
hensive
income
Income
statement
Total
Comprehen-
sive income
Other
compre-
hensive
income
Income
statement
Tax for the year can be specified as follows:
Current tax 11 - 11 11 - 11
Change in deferred tax during the year -265 27 -238 250 -32 218
Adjustments to tax for previous years -69 86 17 -110 110 -
Total -323 113 -210 151 78 229
2012 2011
% %
Reconciliation of the effective tax rate for the year:
Tax rate in Denmark -25.0% -25.0%
Adjustments to tax for previous years -1.8% 0.0%
Non-capitalised tax assets -3.3% -56.5%
Non-taxable income 55.7% 48.5%
Non-deductible expenses -1.4% -1.4%
Special items -0.2% 0.3%Withholding taxes -1.2% -1.8%
Other -0.2% -1.1%
Effective tax rate for the year 22.6% -37.0%
Tax recognised in other comprehensive income:
DKK million
Recognised
item before
tax
Tax expense/
benef it Net of tax
Recognised
item before
tax
Tax expense/
benefit Net of tax
Hedging instruments 269 113 382 127 78 205
Total 269 113 382 127 78 205
DKK million 2012 2011
The change in deferred tax recognised in the income statement can be broken down as follows:
Tax losses -119 182
Intangible assets and property, plant and equipment etc. -119 36
Deferred tax recognised in income statement -238 218
Adjustment for tax for previous years, DKK 86m (2011: DKK 110m), is included in the tax expense for hedging instruments
2012 2011
2012 2011
124

7/22/2019 Carlsberg Breweries Annual Report 2012
http://slidepdf.com/reader/full/carlsberg-breweries-annual-report-2012 124/152
Carlsberg Breweries A/S - Parent Company
Note
9
2012 2011
DKK million DKK million
Salaries and other remuneration 452 392
Severance pay 21 13
Social security costs 2 2
Retirement benefit costs - defined contribution plans 26 27
Share-based payment 17 3
Other employee benefits 5 5
Total 523 442
Sales and distribution expenses 110 115
Administrative expenses 413 327
Total 523 442
Employment contracts for members of the Group Executive Board contain terms and conditions that are considered common to executive
board members in Danish listed companies, including terms of notice and non-competition clauses.
Remuneration of the Group Executive Board and Supervisory Board as well as their holdings of shares in the Company are specified in
note 12 to the consolidated financial statements.
Staff costs and remuneration of the Supervisory Board, the Executive Board and other executive employees
Remuneration of Group Executive Board is based on a fixed salary, cash bonus payments and non-monetary benefits such as company
car, telephone etc. Furthermore, share option programmes and incentive schemes have been established for the Group Executive Board.
These programmes and schemes cover a number of years. The remuneration is specified in note 10.
The Company had an average of 411 (2011: 354) full-time employees during the year.
Staff costs are included in the following items in the income statement:
Remuneration of Group Executive Board
125

7/22/2019 Carlsberg Breweries Annual Report 2012
http://slidepdf.com/reader/full/carlsberg-breweries-annual-report-2012 125/152
Carlsberg Breweries A/S
Notes
10 Share-based payment
Exercise price
Executive
board
Keymanagement
personnel
Othermanagement
personnel
Resigned
employees Total
Fixed,weighted
average
Share options outstanding at 31 December 2010 255,120 88,455 116,470 229,004 689,049 375.10
Granted 60,000 1,200 - - 61,200 566.78
Forfeited/expired - - -713 - -713 334.25
Exercised -13,008 -1,951 -19,265 -40,835 -75,059 305.17
Transferred - -34,752 5,934 34,752 5,934 350.94
Share options outstanding at 31 December 2011 302,112 52,952 102,426 222,921 680,411 396.85
Granted 131,500 - - - 131,500 444.60
Forfeited/expired - - -1,559 - -1,559 292.84
Exercised -13,008 -2,858 -21,326 -30,579 -67,771 229.53
Transferred - -14,268 -14,824 29,092 - 426.74
Share options outstanding at 31 December 2012 420,604 35,826 64,717 221,434 742,581 421.10
Exercisable at 31 December 2011 152,112 25,394 38,390 219,526 435,422 421.60
Exercised options as % of share capital of Carlsberg A/S 0.01% 0.00% 0.01% 0.03% 0.05%
Exercisable at 31 December 2012 199,104 21,126 43,466 220,085 483,781 396.79 Exercised options as % of share capital of Carlsberg A/S 0.01% 0.00% 0.01% 0.02% 0.04%
Assumptions 2012 2011
Grant date
Expiring
date Programme
Exercise
price
Expected
volatility
Risk-free
interest rate
Expected
dividend yield
Expected life
of options,
years
Fair value at
measurement
date
Options
outstanding
Options
outstanding
01.03.2004 01.03.2012 Grant 2004 216.65 29% 3.5% 1.8% 5.5 81.51 - 18,860
01.03.2005 01.03.2013 Grant 2005 232.71 27% 3.1% 1.7% 5.5 74.27 34,686 46,661
01.03.2006 01.03.2014 Grant 2006 306.89 19% 3.3% 1.3% 5.5 89.37 56,054 62,248
01.03.2007 01.03.2015 Grant 2007 472.11 19% 3.9% 1.0% 5.5 136.67 77,920 78,333
01.03.2008 01.03.2016 Grant 2008 457.82 22% 3.6% 1.1% 5.5 141.72 81,545 81,958
01.06.2008 01.06.2016 Special grant 531.80 23% 4.3% 0.9% 5.5 181.08 107,363 107,363
01.09.2008 01.09.2016 Special grant 448.18 27% 4.3% 1.3% 5.5 128.83 40,000 40,000
01.03.2009 01.03.2017 Grant 2009 203.50 52% 3.0% 1.7% 5.5 88.41 86,213 116,626
01.03.2010 01.03.2018 Grant 2010 417.34 30% 3.1% 0.8% 8.0 154.23 66,100 67,163
01.03.2011 01.03.2019 Grant 2011 566.78 25% 2.9% 0.9% 8.0 180.50 61,200 61,200
01.03.2012 01.03.2020 Grant 2012 444.60 34% 0.9% 1.2% 8.0 146.67 131,500
Outstanding share options under the share options programme 742,581 680,411
Long-term incentive programme
Exercise price
Executiveboard
Key
managementpersonnel Otheremployees Resignedemployees Total
Fixed,
weightedaverage
Performance share units outstanding at 31 December 2011 - - - - - -
Granted - 15,041 35,453 - 50,494 0.00
Transferred - -3,078 -4,130 7,208 - 0.00
Performance share units outstanding at 31 December 2012 - 11,963 31,323 - 7,208 50,494 0.00
Assumptions 2012 2011
Grant date
Expiring
date Programme
Exercise
price
Expected
volatility
Risk-free
interest rate
Expected
dividend yield
Expected life
of options,
years
Fair value at
measurement
date
Options
outstanding
Options
outstanding
01.01.2012 01.01.2015 LTI 2012-2014 (preliminary) None 284% 0.3% 1.2% 3.2 542.22 50,494 -
Outstanding performance share units under the long-term incentive programme 50,494 -
There are no exercisable PSUs in the long-term incentive programme as at 31 December 20112
Share option programme Number
In 2012, a total of 131,500 (2011: 61,200) share options were granted to 2 (2011: 3) employees. The grant date fair value of these options was a total of DKK 19m (2011: DKK 11m). The total
cost of share-based payment was DKK 13m (2011: DKK 13m), which is recognised in the income statement under staff costs. Refunds etc. between Carlsberg A/S and Carlsberg Breweries A/S
are recognised directly in equity and total DKK 14m (2011: DKK 16m). Expected future refunds based on the fair value of share options at year end are recognised directly in equity by DKK -
29m (2011: DKK 33m).
Long-term incentive programme:
The assumptions underlying the calculation of the fair value of share options and PSUs are described in note 13 to the consolidated financial statements.
Share option programme:
The average share price at the exercise date for share options was DKK 499 (2011: DKK 575).
At 31 December 2012, the exercise price for outstanding share options was in the range of DKK 203.50 to DKK 566.78 (2011: DKK 203.50 to DKK 566.78). The average remaining contractual
life was 4.0 years (2011: 4.2 years).
In 2012, a total of 50,494 PSUs under the long-term incentive programme were granted to 55 employees. The grant date fair value of these PSUs was a total of DKK 28m. In 2012, DKK 9m was
recognised in respect of share options granted in the year.
Number
126

7/22/2019 Carlsberg Breweries Annual Report 2012
http://slidepdf.com/reader/full/carlsberg-breweries-annual-report-2012 126/152
Carlsberg Breweries A/S - Parent Company
Note
11 Intangible assets
2012
DKK million
Trademarks
Other
intangible
assets Prepayments Total
Cost:
Cost at 1 January 2012 1,108 34 22 1,164
Additions - 1 3 4
Transfers - - -2 -2
Cost at 31 December 2012 1,108 35 23 1,166
Amortisation and impairment losses:
Amortisation and impairment losses at 1 January 2012 18 27 - 45
Amortisation 6 2 - 8
24 29 - 53
Carrying amount at 31 December 2012 1,084 6 23 1,113
2012 2011
DKK million DKK million
Amortisation and impairment losses for the year are included in:
Cost of sales 6 7
Administrative expenses 2 1
Total 8 8
2011
DKK million
Trademarks
Otherintangible
assets Prepayments Total
Cost:
Cost at 1 January 2011 1,108 26 26 1,160
Additions - 4 - 4
Transfers - 4 -4 -
Cost at 31 December 2011 1,108 34 22 1,164
Amortisation and impairment losses:
Amortisation and impairment losses at 1 January 2011 10 25 - 35
Amortisation 8 2 - 8
Amortisation and impairment losses at 31 December 2011 18 27 - 45
Carrying amount at 31 December 2011 1,090 7 22 1,119
The carrying amount of other intangible assets at 31 December 2012 included capitalised software costs of DKK 1m (2011: DKK 5m).
Management assesses that the value of these trademarks can be maintained for an indefinite period, as these are well established trademarks in
the markets concerned and these markets are expected to be profitable in the longer term. In the opinion of Management, there is only a minimal
risk of the current situation in the markets reducing the useful life of these trademarks, primarily due to the respective market share in each market
and the current and planned marketing efforts which are helping to maintain and increase the value of these trademarks.
Amortisation and impairment losses at 31 December 2012
Measurement of trademarks is based on a number of estimates. See note 1 for further description.
127

7/22/2019 Carlsberg Breweries Annual Report 2012
http://slidepdf.com/reader/full/carlsberg-breweries-annual-report-2012 127/152
Carlsberg Breweries A/S - Parent Company
Note
12 Impairment test
At 31 December 2012 impairment tests were performed of the carrying amount of trademarks with an indefinite useful life. Impairment
tests are performed annually in the fourth quarter.
The impairment test is based on expected future free cash flows primarily from the royalty income generated by the individual trademark.
Key assumptions include royalty rate, useful life and a theoretically calculated tax effect. A post-tax discount rate is used which reflects the
risk-free interest rate with the addition of specific and estimated future risks associated with the particular trademark.
Based on the impairment tests performed, no indications of further impairment of trademarks with an indefinite useful life existed at 31
December 2012. In addition, it is Management's assessment that probable changes in the described significant parameters would not lead
to the carrying amount of trademarks with an indefinite useful life exceeding the recoverable amount.
The impairment test of trademarks is based on a comparison of the recoverable amount, corresponding to the discounted value of the
expected future free cash flow, with the carrying amount of the individual trademark.
128

7/22/2019 Carlsberg Breweries Annual Report 2012
http://slidepdf.com/reader/full/carlsberg-breweries-annual-report-2012 128/152
Carlsberg Breweries A/S - Parent Company
Note
13 Property, plant and equipment2012
DKK million
Land and
buildings
Fixtures and
fittings, other
plant and
equipment
Assets under
construction Total
Cost:
Cost at 1 January 2012 5 34 1 40
Additions - 7 1 8
Disposals -3 -2 - -5
Transfers - 1 -1 -
Cost at 31 December 2012 2 40 1 43
Depreciation and impairment losses:
Depreciation and impairment losses at 1 January 2012 2 24 - 26
Disposals -2 -2 - -4
Depreciation 2 3 - 5
2 25 - 27
Carrying amount at 31 December 2012 - 15 1 16
Carrying amount of assets pledged as security for loans - - - -
2012 2011
DKK million DKK mill ion
Depreciation and impairment losses are included in:
Cost of sales 3 2
Administrative expenses 2 3
Total 5 5
2011
DKK million
Land and
buildings
Fixtures and
fittings, other
plant and
equipment
Assets under
construction Total
Cost:
Cost at 1 January 2011 - 33 - 33
Additions 5 3 1 9
Transfers - -2 - -2
Cost at 31 December 2011 5 34 1 40
Depreciation and impairment losses:
Depreciation and impairment losses at 1 January 2011 - 23 - 23
Depreciations - -2 - -2
Transfers 2 3 - 5
Depreciation and impairment losses at 31 December 2011 2 24 - 26
Carrying amount at 31 December 2011 3 10 1 14
Carrying amount of assets pledged as security for loans - - - -
Depreciation and impairment losses at 31 December 2012
129

7/22/2019 Carlsberg Breweries Annual Report 2012
http://slidepdf.com/reader/full/carlsberg-breweries-annual-report-2012 129/152
Carlsberg Breweries A/S - Parent Company
Note
14 Investments in subsidiaries
2012 2011
DKK million DKK million
Cost:
Cost at 1 January 72,071 71,702
Additions 199 561
Transfers - -144 Disposals to group companies -1,052 -
Disposal of entities to group companies - -48
Cost at 31 December 71,218 72,071
Value adjustments:
Value adjustments at 1 January -4,533 -4,533
Disposal of entities -3 -
Value adjustments at 31 December -4,536 -4,533
Carrying amount at 31 December 66,682 67,538
The assumptions used for the impairment test of the parent company's investments in subsidiaries are identical with those used for the Carlsberg
Breweries Group's cash-generating units. The assumptions are stated in note 15 to the consolidated financial statements.
130

7/22/2019 Carlsberg Breweries Annual Report 2012
http://slidepdf.com/reader/full/carlsberg-breweries-annual-report-2012 130/152
Carlsberg Breweries A/S - Parent Company
Note
15 Associates and joint ventures
2012 2011
DKK million DKK million
Cost:
Cost at 1 January 2,751 3,051
Acquisition of entities - 26
Additions 65 -
Disposals -3 -
Transfers - -326
Other -1 -
Cost at 31 December 2,812 2,751
Value adjustments:
Value adjustments at 1 January -3 -3
Reversal of impairment 3 -
Value adjustments at 31 December - -3
Carrying amount at 31 December 2,812 2,748
16 Securities
2012 2011DKK million DKK million
Securities are classified in the statement of financial position as follows:
Non-current assets 11 11
Total 11 11
Types of security:
Unlisted shares 11 11
Total 11 11
Securities classified as current assets are those expected to be sold within one year after the end of the reporting period.
Shares in unlisted entities comprise a number of small holdings. These assets are not recognised at fair value as the fair value cannot
be calculated on an objective basis. Instead the assets are recognised at cost.
No shares in unlisted entities were disposed of during 2012 and 2011.
No indications of impairment of investments in associates and joint ventures have been identified, and accordingly no impairment tests
have been performed.
131

7/22/2019 Carlsberg Breweries Annual Report 2012
http://slidepdf.com/reader/full/carlsberg-breweries-annual-report-2012 131/152
Carlsberg Breweries A/S - Parent Company
Note
17 Receivables2012 2011
DKK million DKK million
Receivables are included in the statement of financial position as follows:
Trade receivables 1,366 1,058
Other receivables 29,528 21,997
Total current receivables 30,894 23,055
Non-current receivables 226 4,284
Total 31,120 27,339
2012 2011DKK million DKK million
Receivables by origin:
Receivables from the sale of goods and services 241 194
Receivables from group companies 1,125 864
Loans to group companies 28,377 24,884
Loan to associates 51 73 Loans to partners 226 230
Fair value of hedging instruments 629 633
Other receivables 471 501
Total 31,120 27,339
2012 2011
DKK million DKK million
Not fallen due or written down 233 189
Falling due in less than 30 days 16 1
Falling due between 30 and 90 days 1 1
Falling due in more than 90 days -3 5
Provision for bad debt -6 -6
Carrying amount at 31 December 241 193
2012 2011
% %
Average effective interest rates:
Loan to group companies 2.9 1.9
Trade receivables comprise invoiced goods and services as well as short-term loans to customers in the on-trade.
Other receivables comprise VAT receivables, loans to group companies, associates, interest receivables and other financial receivables.
Receivables from the sale of goods and services and loans are recognised net of write-downs for bad debt losses. No write downs have
been recognised in 2012 and 2011.
132

7/22/2019 Carlsberg Breweries Annual Report 2012
http://slidepdf.com/reader/full/carlsberg-breweries-annual-report-2012 132/152
Carlsberg Breweries A/S - Parent Company
Note
18 Deferred tax assets and deferred tax liabilities
2012 2011
DKK million DKK million
Deferred tax at 1 January, net 278 474
Joint taxation contribution -295 -56
Adjustments to previous years 69 110
Recognised in other comprehensive income 27 -32
Recognised in income statement 238 -218
Deferred tax at 31 December, net 317 278
Specification of deferred tax assets and liabilities at 31 December:
2012 2011 2012 2011
DKK million DKK million DKK million DKK million
Intangible assets 5 5 41 43
Property, plant and equipment 8 4 2 -
Current assets 2 1 - -Provisions and retirement benefit obligations 28 28 - -
Fair value adjustments - 101 - -
Tax losses etc. 352 432 35 250
Total before set-off 395 571 78 293
Set-off -78 -293 -78 -293
Deferred tax assets and liabilities at 31 December 317 278 - -
Expected to be used as follows:
Within 12 months from the end of the reporting period 60 72 - -
More than 12 months after the end of the reporting period 257 206 - -
Total 317 278 - -
Deferred tax on temporary differences relating to investments in subsidiaries, joint ventures and associates amounts to DKK 0m (2011:
DKK 0m).
Deferred tax assets Deferred tax liabilities
Of the total deferred tax assets recognised, DKK 352m (2011: DKK 432m) relates to tax loss carryforwards, the util isation of whichdepends on future positive taxable income exceeding the realised deferred tax liabilities.
Tax assets of DKK 524m (2011: DKK 505m) were not recognised. These relate to tax losses on exchange rates affect of the Danish tax
rules for interest ceiling. Tax loss must be utilised within 3 years other wise it will expire.
133

7/22/2019 Carlsberg Breweries Annual Report 2012
http://slidepdf.com/reader/full/carlsberg-breweries-annual-report-2012 133/152
Carlsberg Breweries A/S - Parent Company
Note
19 Cash and cash equivalents
2012 2011
DKK million DKK million
Cash at bank and in hand 16 15
Total 16 15
Cash and cash equivalents 16 15
Bank overdrafts -489 -50
Cash and cash equivalents, net -473 -35
20 Share capital
Total share capital
Shares of
DKK 1,000
Nominal value,
DKK '000
1 January 2011 501 501,000
No change in 2011 - -
31 December 2011 501 501,000
No change in 2012 - -
31 December 2012 501 501,000
The share capital amounts to DKK 501m divided into shares in denominations of DKK 1,000 and multiples thereof. None of the shares
confer any special rights. The share capital is owned by Carlsberg A/S, Copenhagen, Denmark.
In the statement of cash flows, bank overdrafts are offset against cash and cash equivalents
as follows:
134

7/22/2019 Carlsberg Breweries Annual Report 2012
http://slidepdf.com/reader/full/carlsberg-breweries-annual-report-2012 134/152
Carlsberg Breweries A/S - Parent Company
Note
21 Borrowings
DKK million 2012 2011
Non-current borrowings:
Issued bonds 29,021 17,697
Bank borrowings 5,110 11,859
Borrowings from Group companies 746 2,508
Total 34,877 32,064
Current borrowings:
Bank borrowings 489 50
Borrowings from parent - 89
Borrowings from Group companies 17,634 18,910
Total 18,123 19,049
Total non-current and current borrowings 53,000 51,113
Fair value 54,485 51,792
Time to maturity for non-current borrowings
DKK million 2012 1-2 years 2-3 years 3-4 years 4-5 years > 5 years Total
Issued bonds 7,443 - 2,999 7,402 11,177 29,021
Bank borrowings - 5,110 - - - 5,110
Borrowings from Group Companies - - - - 746 746
Total 7,443 5,110 2,999 7,402 11,923 34,877
DKK million 2011
1-2 years 2-3 years 3-4 years 4-5 years > 5 years Total
Issued bonds - 7,405 - 2,927 7,365 17,697
Bank borrowings 206 - 11,653 - - 11,859
Borrowings from Group Companies 1,765 - - - 743 2,508
Total 1,971 7,405 11,653 2,927 8,108 32,064
Interest rate risk at 31 December
2012
DKK million Interest rate
Average
effective
interest rate Fixed for
Carrying
amount
Interest
rate risk
Issued bonds:
EUR 1,000m maturing 28 May 2014 Fixed 6.22% 1-2 years 7,443 Fair value
GBP 300m maturing 28 November 2016 Fixed 7.41% 3-4 years 2,999 Fair value
EUR 1,000m maturing 13 October 2017 Fixed 3.55% 4-5 years 7,402 Fair value
EUR 750m maturing 3 July 2019 Fixed 2.49% >5 years 5,629 Fair value
EUR 750m maturing 15 November 2022 Fixed 2.71% >5 years 5,548 Fair value
Total issued bonds 29,021
Bank borrowings:Fixed rate Fixed 0-3 years 5,599 Fair value
Total bank borrowings 5,599
All borrowings are measured at amortised cost with the exception of the fixed interest rate GBP 300m bond which is measured at fair value. The carrying
amount of this borrowing is DKK 2,999m (2011: DKK 2,927m).
The long term bank borrowing is originally floating but have been swapped to an average fixed interest of 5.24% including margin.
135

7/22/2019 Carlsberg Breweries Annual Report 2012
http://slidepdf.com/reader/full/carlsberg-breweries-annual-report-2012 135/152
Carlsberg Breweries A/S - Parent Company
Note
21 Borrowings
Interest rate**
DKK million Net debt * Floating Fixed Floating % Fixed %
EUR 34,366 4,614 29,752 13% 87%
DKK 888 888 - 100% -
PLN 1,485 1,485 - 100% -
SEK 4,716 4,716 - 100% -
CHF 2,848 2,848 - 100% -
NOK 1,036 1,036 - 100% -
USD 1,922 1,922 - 100% -
Other 5,723 5,723 - 100% -
Total 52,984 23,232 29,752 44% 56%
* After swaps and currency derivatives ** Before currency derivatives
Interest rate risk at 31 December:
2011
DKK million Interest rate
Average
effective
interest rate Fixed for
Carrying
amount
Interest
rate risk
Issued bonds:
EUR 1,000m maturing 28 May 2014 Fixed 6.22% 2-3 years 7,405 Fair value
EUR 1,000m maturing 13 October 2017 Fixed 3.55% >5 years 7,365 Fair value
GBP 300m maturing 28 November 2016 Fixed 7.41% 4-5 years 2,927 Fair value
Total bank borrowings 17,697
Bank borrowings:
Floating rate Floating (0-1 years) 1,451 Cash flow
Fixed rate Fixed (2-5 years) 10,408 Fair value
Total bank borrowings 11,859
Interest rate**
DKK million Net debt * Floating Fixed Floating % Fixed %
EUR 39,631 13,710 25,921 35% 65%
DKK -2,771 -2,771 - 100% -
PLN 685 685 - 100% -
SEK 4,130 4,130 - 100% -
CHF 3,099 3,099 - 100% - RUB 961 961 - 100% -
Other 5,363 3,610 1,752 67% 33%
Total 51,098 23,424 27,674 46% 54%
* After swaps and currency derivatives ** Before currency derivatives
2012
Next repricing (of principal before currency swaps)
DKK million Original pr incipal
Effect of
swap After swap 2013 2014 2015 2016 2017 2018-
CHF 995 1,853 2,848 995 - - - - -
DKK 2,790 -1,895 895 2,790 - - - - -
EUR 34,076 290 34,366 4,324 7,443 2,984 - 8,148 11,177
GBP 5,106 -4,520 586 5,106 - - - - -
NOK 807 229 1,036 807 - - - - -
PLN 59 1,426 1,485 59 - - - - -
RUB 2,254 -634 1,620 2,254 - - - - -
SEK 4,646 70 4,716 4,646 - - - - -
SGD 339 -342 -3 339 - - - - -
USD 1,897 34 1,931 1,897 - - - - -
Other 31 3,489 3,520 31 - - - - -
Total 53,000 - 53,000 23,248 7,443 2,984 - 8,148 11,177
See also note 26 Financial risks.
Currency profile of borrowings before and after
derivative financial instruments
The main part of the long term bank borrowing is originally floating but have been swapped to an average fixed interest of 5.36% including margin.
136

7/22/2019 Carlsberg Breweries Annual Report 2012
http://slidepdf.com/reader/full/carlsberg-breweries-annual-report-2012 136/152
Carlsberg Breweries A/S - Parent Company
Note
21 Borrowings
2011
Next repricing (of principal before currency swaps)
DKK million Original pr incipal
Effect of
swap After swap 2012 2013 2014 2015 2016 2017-
CHF 659 2,440 3,099 659 - - - - -
DKK 1,656 -4,424 -2,768 1,657 - - - - -
EUR 36,206 3,425 39,631 10,285 7,434 7,405 2,974 - 8,108
GBP 5,494 -4,489 1,005 3,730 1,765 - - - -
NOK 328 633 961 328 - - - - -
PLN 26 659 685 26 - - - - -
RUB 1,168 -1,097 71 1,168 - - - - -
SEK 4,443 -313 4,130 4,443 - - - - -
SGD 421 -424 -3 421 - - - - - -
USD 695 592 1,287 695 - - - - -
Other 17 2,998 3,015 16 - - - - -
Total 51,113 - 51,113 23,428 9,199 7,405 2,974 - 8,108
Currency profile of borrowings before and after
derivative financial instruments
137

7/22/2019 Carlsberg Breweries Annual Report 2012
http://slidepdf.com/reader/full/carlsberg-breweries-annual-report-2012 137/152
Carlsberg Breweries A/S - Parent Company
Note
22 Provisions
2012
DKK million
Restructurings Other Total
Provisions at 1 January 2012 - 97 97
Additional provisions recognised - 21 21
Used during the year - -1 -1
Reversal of unused provisions - -50 -50
Provisions at 31 December 2012 - 67 67
Provisions are recognised in the statement of financial position as follows:
Non-current provisions - 67 67
Current provisions - - -
Total - 67 67
2011
DKK million
Restructurings Other Total
Provisions at 1 January 2011 9 101 110
Transfers -9 -4 -13
Provisions at 31 December 2011 - 97 97
Provisions are recognised in the statement of financial position as follows:
Non-current provisions - 97 97
Current provisions - - -
Total - 97 97
Provisions totalling DKK 67m relate primarily to ongoing disputes, lawsuits, restructuring etc.
138
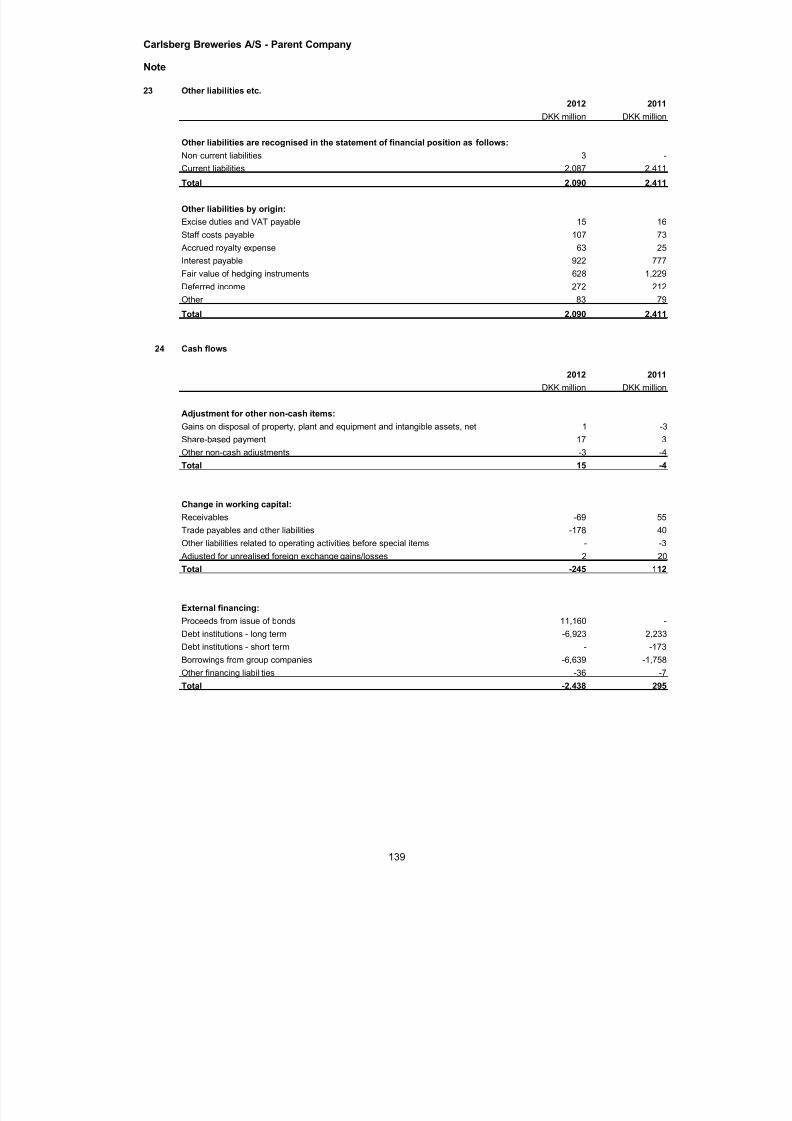
7/22/2019 Carlsberg Breweries Annual Report 2012
http://slidepdf.com/reader/full/carlsberg-breweries-annual-report-2012 138/152
Carlsberg Breweries A/S - Parent Company
Note
23 Other liabilities etc.
2012 2011
DKK million DKK million
Other liabilities are recognised in the statement of financial position as follows:
Non-current liabilities 3 - Current liabilities 2,087 2,411
Total 2,090 2,411
Other liabilities by origin:
Excise duties and VAT payable 15 16
Staff costs payable 107 73
Accrued royalty expense 63 25
Interest payable 922 777
Fair value of hedging instruments 628 1,229
Deferred income 272 212
Other 83 79
Total 2,090 2,411
24 Cash flows
2012 2011
DKK million DKK million
Adjustment for other non-cash items:
Gains on disposal of property, plant and equipment and intangible assets, net 1 -3
Share-based payment 17 3
Other non-cash adjustments -3 -4
Total 15 -4
Change in working capital:
Receivables -69 55
Trade payables and other liabilities -178 40
Other liabilities related to operating activities before special items - -3
Adjusted for unrealised foreign exchange gains/losses 2 20
Total -245 112
External financing:
Proceeds from issue of bonds 11,160 - Debt institutions - long term -6,923 2,233
Debt institutions - short term - -173
Borrowings from group companies -6,639 -1,758
Other financing liabilities -36 -7
Total -2,438 295
139

7/22/2019 Carlsberg Breweries Annual Report 2012
http://slidepdf.com/reader/full/carlsberg-breweries-annual-report-2012 139/152
Carlsberg Breweries A/S - Parent Company
Note
25 Specification of net interest-bearing debt
2012 2011
DKK million DKK million
Net interest-bearing debt is calculated as follows:
Non-current borrowings 34,877 32,064
Current borrowings 18,123 19,049
Gross interest-bearing debt 53,000 51,113
Cash and cash equivalents -16 -15
Loans to group companies -28,377 -24,844
Net interest-bearing debt 24,607 26,254
Changes in net interest-bearing debt:
Net interest-bearing debt at 1 January 26,254 25,615
Cash flow from operating activities 1,007 928
Cash flow from investing activities, excl. acquisition of entities, net -1,441 -552
Cash flow from acquisition of entities, net -1,566 -
Change in interest-bearing lending 25 -77
Effect of currency translation 318 254
Other 10 86
Total change -1,647 639
Net interest-bearing debt at 31 December 24,607 26,254
140

7/22/2019 Carlsberg Breweries Annual Report 2012
http://slidepdf.com/reader/full/carlsberg-breweries-annual-report-2012 140/152
Carlsberg Breweries A/S - Parent Company
Note
26 Financial risks
Carlsberg Breweries A/S is the main funding vehicle in the Carlsberg Breweries Group. Accordingly, reference to the note on financial risk in Carlsberg
Breweries Group with regards to liquidity risk is made.
Credit risk. Credit risk is the risk of a counterparty fai ling to meet its contractual obligations and so inflicting a loss on the Carlsberg Group. Group
policy is that financial transactions may be entered into only with financial institutions with a high credit rating.
Interest rate risks are mainly managed using interest rate swaps and bonds with fixed interest and to a smaller degree loans with fixed interest rate from
subsidiaries.
Carlsberg Breweries A/S' main activ ity is to own a number of subsidiaries and funding the capital required for both net investment and loans to
subsidiaries. As a consequence, Carlsberg Breweries A/S is exposed to foreign exchange risk from its borrowing in foreign currency and financial
instruments to hedge net investments in foreign currency, and interest rate risk from its debt and interest rate derivatives.
Cash and cash equivalents are not associated with any significant credit risks.
Interest rate risk. Carlsberg Breweries A/S performs the role of internal bank in the Carlsberg Breweries Group. Part of this role is to implement
Carlsberg interest rate risk target, which is to have a duration of 1 to 5 years. This duration is measured on the net debt in the Carlsberg Group.
Capital structure and management. Management's strategy and overall goal is to ensure a continued development and strengthening of the Group's
capital structure which supports long-term profitable growth and a solid increase in key earnings and ratios. In 2006 the Carlsberg Breweries Group was
awarded investment-grade ratings by Moody's Investor Service and Fitch Ratings. This rating was improved by one notch in February 2011 to Baa2
The Company’s loan portfolio consists of bilateral loan agreements, syndicated credit facilities and loans from the shareholder and subsidiaries. At 31
December 2012 gross debt (non-current and current borrowings) amounted to DKK 53,000m (2011: DKK 51,113m). After deducting cash and cash
equivalents, net debt is DKK 52,984m (2011: 51,098m), an increase of DKK 1,886m.
At year-end 56% of the net loan portfolio consisted of fixed-rate loans with rates fixed for more than one year (2011: 54%). Carlsberg Breweries A/S
engages in on-lending to subsidiaries. At 31. december 2012 Carlsberg Breweries A/S had lend DKK 28,377m to subsidiaries and Carlsberg A/S (2011:
DKK 24,844m).
A breakdown of the Carlsberg Breweries A/S gross debt, including the financial instruments used to manage foreign exchange and interest rate risks, is
provided in note 21.
Liquidity risk. Liquidi ty r isk is the risk of the Carlsberg Breweries Group fai ling to meet i ts contractual obl igations due to insufficient l iquidity.
Carlsberg’s policy is for the management of funding and liquidity to be managed centrally. It is therefore Group Treasury’s task to ensure effective
liquidity management, which primarily involves obtaining sufficient committed credit facilities to ensure adequate financial resources.
141

7/22/2019 Carlsberg Breweries Annual Report 2012
http://slidepdf.com/reader/full/carlsberg-breweries-annual-report-2012 141/152
Carlsberg Breweries A/S - Parent Company
Note
27 Financial instruments
Financial derivatives not designated as hedging instruments (economic hedges)
Fair value
adjustment
recognised
in income
statement Fair value
Fair value
adjustment
recognised in
income
statement Fair value
-85 419 21 157
-16 -8 -77 -63
-26 - 12 -
-127 411 -44 94
Cash flow hedges
Instrument Maturity
EUR 1,000m interest rate swap 2013 Swap of borrowing with 1 month EURIBOR to fixed
EUR 400m interest rate swap 2015 Swap of borrowing with 1 month EURIBOR to fixed
Fair value
adjustment
recognised in
other compre-
hensive income Fair value
Expected
recognition
Fair value
adjustment
recognised in
other compre-
hensive income Fair value
Expected
recognition
244 -452 2012-2015 148 -669 2012-2015
63 42 - -21 -21- -
307 -410 127 -690
Main financial instruments - overview
Exchange rate instruments
Other instruments
Value adjustments of fair value hedges in the financial year are recognised in the income statement. The adjustments are included in financial income and financial
expenses (cf. note 7). In 2012 financial income of DKK 55m is recognised, and in 2011 financial expense of DKK -44m was recognised. Included is also the ineffective
portion of interest rate hedges DKK -26m (2011: DKK 12m). The impact comes from ineffective portion of hedges and reversal of prior period inefficiencies and ineffective
portions. The fair value of the entire interest rate swaps (effective and ineffective portion) is shown in the table in the cash flow hedge section.
Interest rate instruments
Fair value adjustments on cash flow hedges in the financial year are recognised in other comprehensive income and amount to DKK 307m in 2012 and DKK 127m in 2011.
The adjustments are included in financial income and financial expenses (cf. note 7).
The value of fair value hedges recognised 31 December amounts to DKK 411m in 2012 (DKK 94m in 2011). The recognition of the fair value in the financial statements is
specified in a separate table below.
2012
Purpose
2011
DKK million
Cash flow hedge
Total
The fair value of cash flow hedges recognised at 31 December amounted to DKK -410m (2011: DKK -690m). The recognition of cash flow hedges in the consolidatedfinancial statements is summarised in a separate table.
Exchange rate instruments
The fair value of financial instruments is calculated on the basis of observable market data using generally accepted methods. Internally calculated fair values based on
discountuing of cash flows are used for the mark-to-market of financial instruments. The internally calculated fair values are tested against external market valuations on a
quarterly basis.
Changes in the fair value of financial instruments not designated as hedging instruments are recognised in the income statement. These are mainly non-designated foreign
exchange instruments, which are classif ied as net investment hedges in the Consolidated account, but which for the purpose of the un-consolidated account are not
designated as such. The fair value at the the end of the reporting period of these instruments is DKK 411m (2011: DKK 94m).
Cash flow hedges are primarily used on interest rate swap where the hedged item is the underlying (floating rate) borrowing, and on currency derivatives where the
underlying is acquisitions. Cash flow hedges are also used on aluminium hedges (where the hedged item is aluminium cans used in a number of Group entities in across
Carlsberg). However, for the purpose of the Carlsberg Breweries AS un-consolidated account, the aluminium hedges are not treated as cash flow hedges.
2011
Ineffective portion of hedge
Total
Carlsberg Breweries A/S uses two forms of financial hedging:
DKK million
2012
142

7/22/2019 Carlsberg Breweries Annual Report 2012
http://slidepdf.com/reader/full/carlsberg-breweries-annual-report-2012 142/152
Carlsberg Breweries A/S - Parent Company
Note
27 Financial instruments
2012 2011 2012 2011
411 94 629 633
-410 -690 -628 -1,229
1 -596 1 -596
Liquidity risk
Financial liabilities 2012
DKK million
Contractual
cash flows
Maturity
< 1 year
Maturity
> 1 year
< 5 years
Maturity
> 5 years
Carrying
amount
Derivative financial instruments
Derivative financial instruments, payables 667 404 263 - 628
Non-derivative financial instruments
Financial debt gross 52,879 18,123 22,820 11,936 53,000
Interest expense 5,670 1,518 3,202 950 N/A
Trade payables and other liabilities 557 557 - - 557
Non-derivate financial instruments total 59,106 20,198 26,022 12,886 -
Financial liabilities total 59,773 20,602 26,285 12,886 -
Financial liabilities 2011
DKK million
Contractual
cash flows
Maturity
< 1 year
Maturity
> 1 year
< 5 years
Maturity
> 5 years
Carrying
amount
Derivative financial instruments
Derivative financial instruments, payables 1,197 574 623 - 1,229
Non-derivative financial instruments
Financial debt gross 51,019 18,886 24,025 8,108 51,113
Interest expense 4,861 1,620 3,048 193 N/A
Trade payables and other liabilities 581 581 - - 581
Non-derivate financial instruments total 56,461 21,087 27,073 8,301 -
Financial liabilities total 57,658 21,661 27,696 8,301 -
Fair values of financial instruments are recognised depending on the nature of the hedge.
Cash flow hedges
Fair value presented
in tables above
Presentation in the notes
to the financial statements
Fair value/economic hedges Receivables, cf. note 17
Other liabilities, cf. note 23
Recognition of financial instruments - summary
Total Total
143
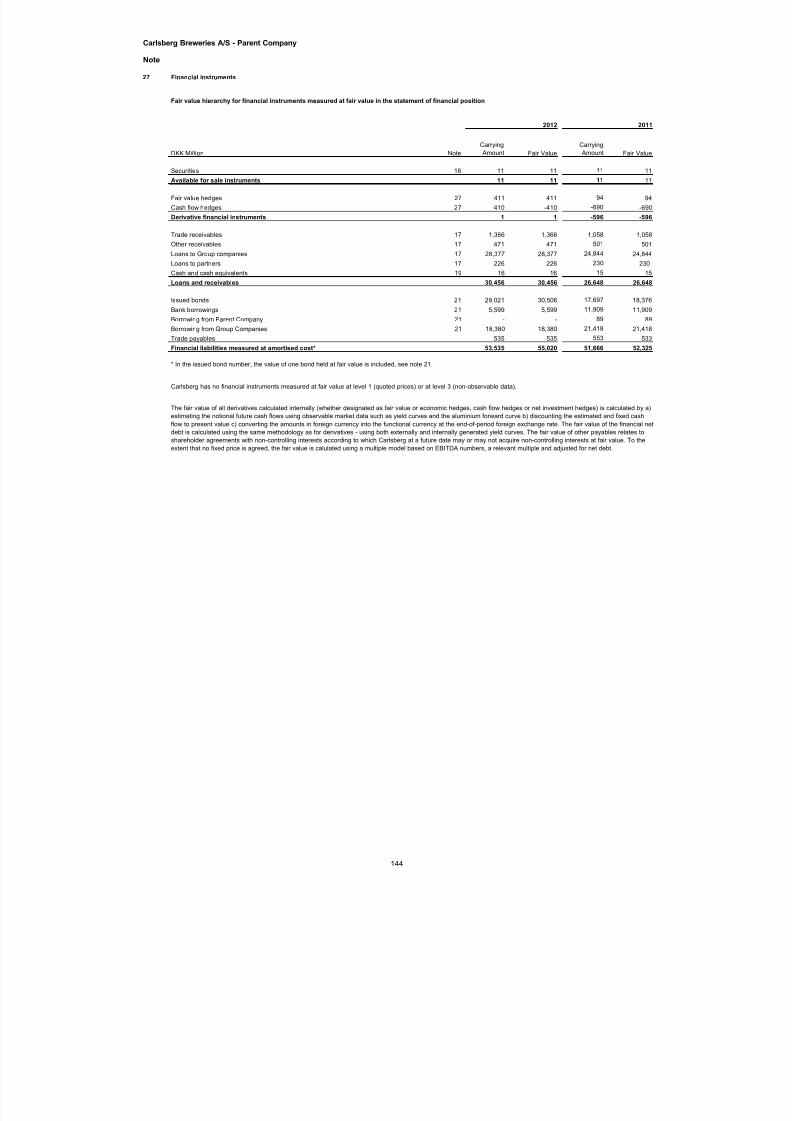
7/22/2019 Carlsberg Breweries Annual Report 2012
http://slidepdf.com/reader/full/carlsberg-breweries-annual-report-2012 143/152
Carlsberg Breweries A/S - Parent Company
Note
27 Financial instruments
Fair value hierarchy for financial instruments measured at fair value in the statement of financial position
2012 2011
DKK Million Note
Carrying
Amount Fair Value
Carrying
Amount Fair Value
Securities 16 11 11 11 11
Available for sale instruments 11 11 11 11
Fair value hedges 27 411 411 94 94
Cash flow hedges 27 -410 -410 -690 -690
Derivative financial instruments 1 1 -596 -596
Trade receivables 17 1,366 1,366 1,058 1,058
Other receivables 17 471 471 501 501
Loans to Group companies 17 28,377 28,377 24,844 24,844
Loans to partners 17 226 226 230 230
Cash and cash equivalents 19 16 16 15 15
Loans and receivables 30,456 30,456 26,648 26,648
Issued bonds 21 29,021 30,506 17,697 18,376
Bank borrowings 21 5,599 5,599 11,909 11,909Borrowing from Parent Company 21 - - 89 89
Borrowing from Group Companies 21 18,380 18,380 21,418 21,418
Trade payables 535 535 553 533
Financial liabilities measured at amortised cost* 53,535 55,020 51,666 52,325
* In the issued bond number, the value of one bond held at fair value is included, see note 21.
Carlsberg has no financial instruments measured at fair value at level 1 (quoted prices) or at level 3 (non-observable data).
The fair value of all derivatives calculated internally (whether designated as fair value or economic hedges, cash flow hedges or net investment hedges) is calculated by a)
estimating the notional future cash flows using observable market data such as yield curves and the aluminium forward curve b) discounting the estimated and fixed cash
flow to present value c) converting the amounts in foreign currency into the functional currency at the end-of-period foreign exchange rate. The fair value of the financial net
debt is calculated using the same methodology as for derivatives - using both externally and internally generated yield curves. The fair value of other payables relates to
shareholder agreements with non-controlling interests according to which Carlsberg at a future date may or may not acquire non-controlling interests at fair value. To the
extent that no fixed price is agreed, the fair value is calulated using a multiple model based on EBITDA numbers, a relevant multiple and adjusted for net debt.
144

7/22/2019 Carlsberg Breweries Annual Report 2012
http://slidepdf.com/reader/full/carlsberg-breweries-annual-report-2012 144/152
Carlsberg Breweries A/S - Parent Company
Note
28 Related party disclosures
2012 2011
DKK million DKK million
Other operating income 12 14
Administration cost - -1
Financial income 6 2
Financial expense - -13
Loans - -
Receivables from the sale of goods and services 40 14
Borrowings - -91
Trade payables 13 -23
2012 2011
DKK million DKK million
Revenue 26 30
Loans 278 73
Receivables from the sale of goods and services 3 123
Dividends of DKK 1,670m (2011: DKK 1,187m) were received from subsidiaries.
2012 2011DKK million DKK million
Revenue 520 597
Cost of sales -138 -142
Sales and distribution income 63 36
Administration cost -42 -49
Other operating income 230 222
Gain on disposal of subsidiary - 244
Interest income 929 968
Interest expenses -502 -579
Loans 28,377 25,074
Receivables 1,515 1,335
Borrowings -18,380 -21,507
Trade payables and other liabilities etc. -539 -451
The income statement and statement of financial position include include the following transactions with subsidiaries:
Associates
The income statement and statement of financial position include include the following transactions with associates:
Subsidiaries
Emoluments to the Board of Directors and remuneration of the Executive Board are disclosed in note 10.
Dividends of DKK 31m (2011: DKK 31m) were received from associates.
Related parties exercising control. Carlsberg A/S, Ny Carlsberg Vej 100, 1799 Copenhagen V, Denmark, holds all of the
shares in Carlsberg Breweries A/S. Carlsberg Breweries A/S has paid a dividend of DKK 0m to Carlsberg A/S (2011: DKK 0m).
In 2008, Carlsberg A/S made a cash capital increase of DKK 24,000m.
The income statement and statement of financial position include the following transactions with Carlsberg A/S:
Related exercising significant influence. The Group was not involved in any transactions during the year with major
shareholders, members of the Board of Directors, members of the Executive Board, other executive employees, or companies
outside the Carlsberg Breweries Group in which these parties have interests.
145

7/22/2019 Carlsberg Breweries Annual Report 2012
http://slidepdf.com/reader/full/carlsberg-breweries-annual-report-2012 145/152
Carlsberg Breweries A/S - Parent Company
Note
29 Contingent liabilities and other commitments
Capital commitments
30 Events after the reporting period
Apart from the events recognised or disclosed in the Annual Report, no events have occurred after the balance sheet date of
importance to the Annual Report.
Carlsberg Breweries A/S has issued guarantees for loans etc. raised by subsidiaries and associates (non-consolidated share of
loan) of DKK 3,726m (2011: DKK 4,025m).
Contractual commitments. The Carlsberg Breweries A/S has entered into service contracts in respect of sales, logistics and
IT. Costs related to the contracts are recognised as the services are received.
Certain guarantees etc. are issued in connection with disposal of entities and activities etc. Apart from as recognised in the
statement of financial position include or disclosed in the Annual Report, these guarantees etc. will not have a material effect
on the company's financial position.
Carlsberg Breweries A/S is jointly registered for Danish VAT and excise duties with Carlsberg A/S, Carlsberg Danmark A/S andvarious other minor Danish subsidiaries, and is jointly and severally liable for payment of VAT and excise duties.
The Carlsberg Breweries A/S is party to certain lawsuits, disputes etc. of various sizes. In management's opinion, apart from as
recognised in the statement of financial position include or disclosed in the Annual Report, the outcome of these lawsuits,
disputes etc. will not have a material negative effect on the Company's financial position.
Carlsberg Breweries A/S and the other companies covered by the Danish joint taxation scheme are jointly and severally liable
for payment of corporation tax for 2004 and previous tax years.
Neither at the end of the reporting period in 2012 nor 2011 had Carlsberg Breweries A/S any capital commitments to be made
at a later date.
146

7/22/2019 Carlsberg Breweries Annual Report 2012
http://slidepdf.com/reader/full/carlsberg-breweries-annual-report-2012 146/152
Carlsberg Breweries A/S - Parent Company
Note
31 Accounting policies
The 2012 financial statements of Carlsberg Breweries A/S have been prepared in accordance withInternational Financial Reporting Standards (IFRS) as adopted by the EU and Danish disclosurerequirements for listed companies, cf. the statutory order pursuant to the Danish Financial Statements Act.
In addition, the financial statements have been prepared in compliance with the International FinancialReporting Standards (IFRS) issued by the IASB.
The financial statements are presented in Danish Kroner (DKK), which is the functional currency.
The accounting policies for the Parent Company are the same as for the Carlsberg Breweries Group, cf. note41 to the consolidated financial statements, with the exception of the items below.
Income statement
Dividends on investments in subsidiaries, joint ventures and associates. Dividends on investments insubsidiaries, joint ventures and associates are recognised as income in the income statement of the ParentCompany in the financial year in which the dividend is declared.
Financial income and financial expenses. Foreign exchange adjustments of balances with foreign entitieswhich are considered part of the total net investment in the entity are recognised in the income statement ofthe Parent Company.
Tax on profit/loss for the year. Tax on profit/loss for the year comprises profit/loss from real estatepartnerships (associates), as these are not individually taxed but included in taxable income of the partners.In addition, tax on profit/loss and deferred tax are calculated and recognised as described in note 41 to theconsolidated financial statements.
Statement of financial position
Investments in subsidiaries, joint ventures and associates. Investments in subsidiaries, joint venturesand associates are measured at the lower of cost or recoverable amount.
Share-based payment to employees in subsidiaries. The value of granted equity-settled share options toemployees in the Parent Company’s subsidiaries is recognised in investments in subsidiaries as the servicesrendered in exchange for the options are received in the subsidiaries, with a set-off directly against equity.
The difference between the purchase price and the sales price for the exercise of equity-settled shareoptions by employees in subsidiaries is settled between Carlsberg Breweries A/S and the individualsubsidiary, with a set-off directly against investments in subsidiaries.
The difference at the end of the reporting period between the fair value of the Parent Company’s equityinstruments and the exercise price of outstanding equity-settled share options is recognised as a receivablein Carlsberg Breweries A/S, with a set-off directly against investments in subsidiaries.
Equity-settled share options granted to the Parent Company’s own employees are recognised and measuredin accordance with the accounting policies used by the Carlsberg Breweries Group, cf. note 41 to theconsolidated financial statements for a description of accounting policies.
147
7/22/2019 Carlsberg Breweries Annual Report 2012
http://slidepdf.com/reader/full/carlsberg-breweries-annual-report-2012 147/152
COMPANY INFORMATION
Company: Carlsberg Breweries A/SNy Carlsberg Vej 1001799 Copenhagen V
Denmark
Municipality of reg. office: Copenhagen
Board of Directors: Jess Søderberg (Chairman), Former CEO of the A.P. Møller-Mærsk GroupFlemming Besenbacher (Deputy Chairman), Professor, D.Sc., h.c. mult., FRSCJørgen Buhl Rasmussen, President, CEOJørn P. Jensen, Deputy CEO & CFOPeter Petersen (Employee representative), Chairman of the Staff AssociationCarlsberg and Demand Planner, Carlsberg Danmark A/SEva Vilstrup Decker (Employee representative), Senior Customer Service & SupplyManager, Carlsberg Breweries A/S
Executive Board: Jørgen Buhl Rasmussen, President & CEOJørn P. Jensen, Deputy CEO & CFO
Auditor: KPMGStatsautoriseret RevisionspartnerselskabOsvald Helmuths Vej 42000 FrederiksbergDenmark
148

7/22/2019 Carlsberg Breweries Annual Report 2012
http://slidepdf.com/reader/full/carlsberg-breweries-annual-report-2012 148/152
EXECUTIVE COMMITTEE AND SUPERVISORY BOARD
Executive Committee
Jørgen Buhl RasmussenPresident & CEO since 2007.
Appointed to the Executive Board of Carlsberg Breweries A/S in 2007. President & CEO of Carlsberg A/S..Chairman, Deputy Chairman or member of the Supervisory Boards of Carlsberg Group companies. Memberof the Supervisory Board of Novozymes A/S. Prior to joining Carlsberg, Mr Rasmussen held seniormanagerial positions covering Western, Central and Eastern Europe, the Middle East, Africa and Asia inseveral global FMCG companies, among others Gillette Group, Duracell, Mars and Unilever.
Jørn P. JensenDeputy CEO since 2007; CFO since 2004.
Appointed to the Executive Board of Carlsberg Breweries A/S in 2004. Deputy CEO & CFO of Carlsberg A/S.
Chairman, Deputy Chairman or member of the Supervisory Boards of Carlsberg Group companies. Memberof the Supervisory Board of DONG Energy A/S and of the Committee on Corporate Governance in Denmark.Prior to joining Carlsberg, Mr Jensen held senior managerial positions in, among others, Nilfisk Advance A/Sand Foss Electric A/S.
Supervisory Board
Jess SøderbergChairman
Born 1944. Elected 2009. Deputy Chairman of the Supervisory Board of Carlsberg A/S. Chairman of the Audit Committee and member of the Nomination and Remuneration Committees of Carlsberg A/S. FormerCEO of the A.P. Møller – Mærsk Group (1993-2007) and before that CFO of the same company from 1981.
Member of the Supervisory Board and the Finance and Audit Committees of The Chubb Corporation, advisorto Permira and member of Danske Bank’s Advisory Board. Managing Director of J.S. Invest ApS and onesubsidiary. Mr Søderberg has broad international experience and extensive experience of financialmanagement and financial reporting processes, performance management and stakeholder and investorrelations management as a result of many years in the senior management of A.P. Møller - Mærsk. He haswide experience of growth markets and the identification and management of business risks.
Flemming Besenbacher
Deputy Chairman
Professor, D.Sc., h.c. mult., FRSC. Born 1952. Elected 2012.Chairman of the Supervisory Board ofCarlsberg A/S. Chairman of the Nomination Committee and Member of the Audit and RemunerationCommittees of Carlsberg A/S . Member of the Board of Directors of the Carlsberg Foundation (Chairman as
of 1 January 2012) and of the Supervisory Boards of property companies affiliated to the CarlsbergFoundation. Mr Besenbacher is Chairman of the Board of Trustees of the Carlsberg Laboratory and memberof the Boards of the Tuborg Foundation and MedTech Innovation Center. Mr Besenbacher was director ofthe Interdisciplinary Nanoscience Center (iNANO), Aarhus University, from 2002 to 2012. He has extensiveexperience of managing large knowledge-based organisations and has strong competences relating toinnovation, research, CSR and sustainable development. Mr Besenbacher is Professor Honoris Causa at 10international universities and has received many international awards, including the Friendship Award andthe Chinese Government Highest International Scientific and Technological Cooperation Award of thePeople’s Republic of China.
Jørgen Buhl RasmussenPresident & CEO of Carlsberg A/S and Carlsberg Breweries A/S (see also above).
149

7/22/2019 Carlsberg Breweries Annual Report 2012
http://slidepdf.com/reader/full/carlsberg-breweries-annual-report-2012 149/152
Jørn P. JensenDeputy CEO & CFO of Carlsberg A/S and Carlsberg Breweries A/S (see also above).
Peter PetersenEmployee representative, Chairman of the Staff Association Carlsberg and Demand Planner, Carlsberg
Danmark A/S
Eva Vilstrup DeckerEmployee representative, Senior Customer Service & Supply Manager, Carlsberg Breweries A/S
150

7/22/2019 Carlsberg Breweries Annual Report 2012
http://slidepdf.com/reader/full/carlsberg-breweries-annual-report-2012 150/152
MANAGEMENT STATEMENT
The Supervisory Board and the Executive Board have today discussed and approved the Annual Report ofthe Carlsberg Breweries Group and the parent company for 2012.
The Annual Report has been prepared in accordance with International Financial Reporting Standards asadopted by the EU and Danish disclosure requirements for annual reports of listed companies.
In our opinion the consolidated financial statements and the parent company’s financial statements give atrue and fair view of the Carlsberg Breweries Group’s and the parent company’s assets, liabilities andfinancial position at 31 December 2012 and of the results of the Carlsberg Breweries Group’s and the parentcompany’s operations and cash flows for the financial year 2012.
Further, in our opinion the Management’s review includes a fair review of the development in the CarlsbergBreweries Group’s and the parent company’s operations and financial matters, the result for the year and ofthe Carlsberg Breweries Group and the parent company’s financial position as well as describes thesignificant risks and uncertainties affecting the Carlsberg Breweries Group and the parent company.
We recommend that the Annual General Meeting approve the Annual Report.
Copenhagen, 22 March 2013
Executive Board of Carlsberg Breweries A/S
Jørgen Buhl Rasmussen Jørn P. Jensen
Supervisory Board of Carlsberg Breweries A/S
Jess Søderberg Flemming Besenbacher Peter PetersenChairman Deputy Chairman
Jørgen Buhl Rasmussen Eva Vilstrup Decker Jørn P. Jensen

7/22/2019 Carlsberg Breweries Annual Report 2012
http://slidepdf.com/reader/full/carlsberg-breweries-annual-report-2012 151/152
THE INDEPENDENT AUDITORS’ REPORT
To the shareholder of Carlsberg Breweries A/S
Independent auditors’ report on the consolidated financial statements and the parent company financial stateme nts
We have audited the consolidated financial statements and the parent company financial statements of Carlsberg Breweries A/S for thefinancial year 2012. The consolidated financial statements and the parent company financial statements comprise income statement,statement of comprehensive income, statement of financial position, statement of changes in equity, statement of cash flows and notes,including a summary of significant accounting policies for the Carlsberg Breweries Group as well as for the parent company. Theconsolidated financial statements and the parent company financial statements are prepared in accordance with International FinancialReporting Standards as adopted by the EU and Danish disclosure requirements for listed companies.
Management’s responsibility for the consolidated financial statements and the parent company financial statements Management is responsible for the preparation of consolidated financial statements and parent company financial statements that give atrue and fair view in accordance with International Financial Reporting Standards as adopted by the EU and Danish disclosurerequirements for listed companies and for such internal control that Management determines is necessary to enable the preparation ofconsolidated financial statements and parent company financial statements that are free from material misstatement, whether due tofraud or error.
Auditors’ responsibility Our responsibility is to express an opinion on the consolidated financial statements and the parent company financial statements based
on our audit. We conducted our audit in accordance with International Standards on Auditing and additional requirements under Danishaudit regulation. This requires that we comply with ethical requirements and plan and perform the audit to obtain reasonable assuranceas to whether the consolidated financial statements and the parent company financial statements are free from material misstatement.
An audit involves performing procedures to obtain audit evidence about the amounts and disclosures in the consolidated financialstatements and the parent company financial statements. The procedures selected depend on the auditors’ judgement, including theassessment of the risks of material misstatement of the consolidated financial statements and the parent company financial statements,whether due to fraud or error. In making those risk assessments, the auditors consider internal control relevant to the Company’spreparation of consolidated financial statements and parent company financial statements that give a true and fair view in order todesign audit procedures that are appropriate in the circumstances, but not for the purpose of expressing an opinion on the effectivenessof the Company’s internal control. An audit also includes evaluating the appropriateness of accounting policies used and thereasonableness of accounting estimates made by Management, as well as evaluating the overall presentation of the consolidatedfinancial statements and the parent company financial statements.
We believe that the audit evidence we have obtained is sufficient and appropriate to provide a basis for our opinion.
Our audit has not resulted in any qualification.
OpinionIn our opinion, the consolidated financial statements and the parent company financial statements give a true and fair view of theCarlsberg Breweries Group’s and the parent company’s financial position at 31 December 2012 and of the results of the CarlsbergBreweries Group’s and the parent company’s operations and cash flows for the financial year 2012 in accordance with InternationalFinancial Reporting Standards as adopted by the EU and Danish disclosure requirements for listed companies.
Statement on the Management’s review Pursuant to the Danish Financial Statements Act, we have read the Management’s review. We have not performed any furtherprocedures in addition to the audit of the consolidated financial statements and the parent company financial statements. On this basis,it is our opinion that the information provided in the Management’s review is consistent with the consolidated financial statements andthe parent company financial statements.
Copenhagen, 22 March 2012KPMG
Statsautoriseret Revisionspartnerselskab
Henrik Kronborg Iversen Jesper KoefoedState Authorised Public Accountant State Authorised Public Accountant

7/22/2019 Carlsberg Breweries Annual Report 2012
http://slidepdf.com/reader/full/carlsberg-breweries-annual-report-2012 152/152