Embed Size (px)
Citation preview

GREENHOUSE GAS REPORT for
CARBON CREDIT SOLUTIONS INC. TILLAGE PROJECT #7
FEBRUARY 2011

Carbon Credit Solutions Inc. 2011
GREEHOUSE GAS REPORT for
CARBON CREDIT SOLUTIONS INC. TILLAGE PROJECT #7
Section Contents
Introduction
1. Project Description and Location
2.
Project Details
3.
Reporting Period
4.
GHG Calculation
5. GHG Assertion
6. Project Developer Identification
Appendix A Offset Project Plan for Carbon Credit Solutions Inc. Tillage Project #7
Greenhouse Gas Report for Carbon Credit Solutions Inc. Tillage Project #7 Page 2

Carbon Credit Solutions Inc. 2011
1. Project Description and Location Carbon Credit Solutions Inc. (“CCS”) uses the Specified Gas Emitters Regulations Quantification Protocol for Tillage System Management Version 1.3 February 2009 which can be found in the Offset Project Plan for CCS Tillage Project #7 (February 2011) attached Appendix A along with the Specified Gas Emitters Regulations Additional Guidance for Interpretation of the Quantification Protocol for Tillage System Management for Carbon Offsets in Alberta Version 1 February 2008 (“Tillage Protocol”) also found in the Offset Project Plan for CCS Tillage Project #7 (February 2011) attached as Appendix A which sets out the requirements for quantification of greenhouse gas (GHG) emission reductions. The reductions are associated with a change from conventional or full tillage (FT) to reduced till (RT) or no-till (NT) in the Province of Alberta. Carbon Credit Solutions Inc. Tillage Project #7 referred to as “the Project”. The Project consistently followed the process described in the Offset Project Plan for Tillage Project #7 (February 2011) attached as Appendix A. A report generated from The CCS software program lists all legal land descriptions, carbon package and project year for the locations included within our Project, as requested by Alberta Environment. 2. Project Details Carbon Credit Solutions Inc. Tillage Project #7 referred to as “the Project” includes the aggregation of greenhouse gas emission reductions generated from individual participants and their lands within each individual farm operation. In this regard, the scope of the Project may vary from year to year as more participants join the Project. The lands included within this Project will be an accumulation of farm operations located entirely within the Province of Alberta. Ecoregions include Dry Prairie and Parkland. The precise locations of the boundaries between the Parkland and Dry Prairie used within the Tillage Protocol have been identified using the Alberta Digital Soils Database AGRASID. The AGRASID has been downloaded into our software program. These ecoregions are determined by our software program based on the legal land description entered into the software. The Project did not deviated from the Offset Project Plan for Tillage Project #7 (February 2011) attached as Appendix A. To demonstrate that the CCS Project met the requirements under the Tillage Protocol, CCS has collected and can supply sufficient evidence to demonstrate that:
Farms included within the CCS Project were producing annual crops on the applicable land as outlined in the CCS Project Report;
Farms in the CCS Project did operate on the applicable land in a no-till or reduced till
system as defined in the Tillage Protocol; The quantification of reductions achieved by the CCS Project is based on actual
measurement and monitoring as indicated by the Tillage Protocol; and The Project has met the requirements for offset eligibility as specified in the applicable
regulation and guidance documents for the Alberta Offset System. This Project consists of the aggregation of greenhouse gas emission reductions generated from the reductions of greenhouse gas emissions through the change in best management practices used by
Greenhouse Gas Report for Carbon Credit Solutions Inc. Tillage Project #7 Page 3

Carbon Credit Solutions Inc. 2011
participants in the implementation of no-till and/or reduced till systems on agricultural lands situated in the Province of Alberta. CCS, as an aggregator, has collected greenhouse gas emission reductions created by individual farm participants in order to provide sufficient quantities of greenhouse gas emission reductions as required by interested buyers. These greenhouse gas emission reductions have been generated in accordance with the Tillage Protocol. Each participant provided land use information for each quarter section. The CCS software program tracks the information as the CCS data input team member makes each entry. The information is confirmed by the data input team member and farm records are available in each file. The lands must comply with the definitions provided by the Tillage Protocol. Evidence is provided by each participant in order to qualify for entry into the Project. The quantification of reductions achieved by the Project are based on actual measurements and monitoring. Using the Tillage Protocol as a guidance document, each participant provided evidence to ensure all eligibility was met and all criteria was followed. This process is described in detail in the Offset Project Plan for Tillage Project #7 was consistently following for the duration of this project. 3. Reporting Period The time period covered in this Project is from January 1, 2002 to December 31, 2010. The expected lifetime of the project has been adopted every 10 years and used for credit quantification over that period of time. The credit duration period has been set as 20 years due to the adjusted baseline approach, as outlined on Page 25 of the Specified Gas Emitters Regulation Offset Credit Project Guidance Document (version 1.2 February 2008). 4. GHG Calculation The GHG reductions or removals (in tonnes CO2e) were calculated, including clearly identifying all inputs, emission factors, equations and methods using the Specified Gas Emitters Regulations Quantification Protocol for Tillage System Management Version 1.3 February 2009 along with the Specified Gas Emitters Regulations Additional Guidance for Interpretation of the Quantification Protocol for Tillage System Management for Carbon Offsets in Alberta Version 1 February 2008 using their inputs, tables, emission factors, equations and methods as outlined within section 2.5 Quantifications of Reductions, Removals and Reversals of Relevant SS’s. The Offset Project Plan for Tillage Project #7 describes the calculation methodologies. Our process described in the Offset Project Plan for Tillage Project #7 has been consistency followed. Reduced/No Tillage The coefficients and calculations used by the CCS software program in the calculation of reduced/no tillage greenhouse gas emission reductions uses the coefficients and calculations specified in the Tillage Protocol. Specified Gas Emitters Regulations Quantification Protocol for Tillage System Management Version 1.3 February 2009 provides an explanation of the calculations and coefficients used in the Tillage Protocol. In Table 1 below, the column titles provides the equation used to calculate default coefficients use in calculating greenhouse gas emission reductions. The baseline adjusted default coefficients to multiply by the number of hectares.
Greenhouse Gas Report for Carbon Credit Solutions Inc. Tillage Project #7 Page 4

Carbon Credit Solutions Inc. 2011
Table 1 Tillage Change
Emission Factor
* Assurance Factor ╪
+ Nitrous Oxide Reduction ¥
+ Energy Reduction €
= Total
Parkland FT to NT 0.36 0.875 0.019 0.075 0.41 FT to RT 0.02 0.875 0.019 - 0.010 0.027 Dry Prairie FT to NT 0.20 0.925 0.005 0.030 0.22 Specified Gas Emitters Regulation Quantification Protocol for Tillage System Management Version 1.3 February 2009 also provides an explanation of the calculations and coefficients used in the Tillage Protocol when irrigation occurs in Dry Prairie. In Table 1a below, the column titles provides the equation used to calculate default coefficients use in calculating greenhouse gas emission reductions when irrigation has occurred on lands in the Dry Prairie zone. The baseline adjusted default coefficients to multiply by the number of hectares. Table 1A Irrigation in Dry Prairie Tillage Change
Emission Factor
* Assurance Factor ╪
+ Nitrous Oxide Reduction ¥
+ Energy Reduction €
= Total
Dry Prairie FT to NT 0.36 0.925 0.019 0.030 0.38 FT to RT 0.02 0.900 0.019 - 0.004 0.033 Quantification of the reductions, removals and reversals of relevant SS’s for each of the greenhouse gases has been used the methodologies outlined Table 2, below as per emissions factors listed above in Table 1 and Table 1A (A listing of relevant emission factors is provided within Appendix A found on pages 27 -31 of the Tillage Protocol. These calculation methodologies serve to complete the following three equations for calculating the emission reductions from the comparison of the baseline and Project conditions). The calculations and emissions factors above and below in Tables 1 and 2 have been used in this project. Table 2 Emission Reduction = Emissions Baseline – Emissions Project Emissions Baseline = Emissions Energy Use + Emissions Carbon Sequestration* Assurance Factor + Emissions Nitrogen Emissions Project = 0 Where: Emissions Baseline = sum of the emissions under the baseline condition.
Greenhouse Gas Report for Carbon Credit Solutions Inc. Tillage Project #7 Page 5

Carbon Credit Solutions Inc. 2011
Emissions Energy Use = component of emissions under SS’s B9 Pesticide Production, B3 Seed Distribution (On-Site), B7 Fertilizer and Lime Distribution (On-Site), B11 Pesticide Distribution (On-Site) Emissions Carbon Sequestration = component of emissions under SS B13 Soil and Crop Dynamics Assurance Factor = Factor to account for reversals due to tillage events. Relevant assurance factors are provided in Appendix B found on pages 27 -31 of the Tillage Protocol. Emissions Nitrogen = component of emissions under SS B13 Soil and Crop Dynamics Emissions Project = sum of the emissions under the project condition
5. GHG Assertion The number of offset tonnes achieved during the reporting period of each vintage year for reduced/no tillage are as follows: (Reductions are rounded down to the nearest whole number as requested by Alberta Environment)
Vintage Year Reductions Tonnes of CO2e 2002 4,411 2003 5,300 2004 6,220 2005 6,626 2006 6,797 2007 6,811 2008 7,310 2009 7,803 2010 12,385 Total 63,663
6. Project Developer Identification
Project Developer Contact Information
Carbon Credit Solutions Inc.
Vanessa Weitz
Project Manager
#8-620 1st Ave N.W.
Airdrie, Alberta
Canada
Phone: (403) 912-9132
Fax: (403) 948-3353
www.carboncreditsolutions.ca
Carbon Credit Solutions Inc.
Alastair Handley
Vice President
#8-620 1st Ave N.W.
Airdrie, Alberta
Canada
Phone: (403) 912-9132
Fax: (403) 948-3353
www.carboncreditsolutions.ca
Greenhouse Gas Report for Carbon Credit Solutions Inc. Tillage Project #7 Page 6


Carbon Credit Solutions Inc. 2011
Appendix A Offset Project Plan for Carbon Credit Solutions Inc. Tillage Project #7
Greenhouse Gas Report for Carbon Credit Solutions Inc. Tillage Project #7 Page 8

OFFSET PROJECT PLAN for
CARBON CREDIT SOLUTIONS INC. TILLAGE PROJECT #7
FEBRUARY 2011

Carbon Credit Solutions Inc. 2011
OFFSET PROJECT PLAN for
CARBON CREDIT SOLUTIONS INC. TILLAGE PROJECT #7
Section Contents
Introduction
1. Project Scope and Project Site Description 1.1 Conditions Prior to Project Initiation 1.2 Description of How the Project Will Achieve GHG Emission Reductions 1.3 Project Technologies, Products, Services and the expected level of activity 1.4 Identification of Risks 1.5 Roles and Responsibilities
2.
Inventory of Sources and Sinks
3.
Identification of Baseline
4.
Quantification of Greenhouse Gas Emission Reductions
5. Monitoring Plan
6. Data Information Management System and Data Controls
7. Verification of CCS Tillage Project #7
Appendix A Quantification Protocol for Tillage System Management Version 1.3 February 2009
Appendix B Additional Guidance for Interpretation of the Quantification Protocol for Tillage System Management for Carbon Offsets in Alberta Version 1 February 2008
Offset Project Plan for Carbon Credit Solutions Inc. Tillage Project #7 Page 2

Carbon Credit Solutions Inc. 2011
Introduction
Carbon Credit Solutions Inc. (“CCS”) uses the Specified Gas Emitters Regulation Quantification Protocol for Tillage System Management Version 1.3 February 2009 along with the Specified Gas Emitters Regulation Additional Guidance for Interpretation of the Quantification Protocol for Tillage System Management for Carbon Offsets in Alberta Version 1 February 2008 (“Tillage Protocol”) which sets out the requirements for quantification of greenhouse gas (“GHG”) emission reductions associated with a change from conventional or full tillage (“FT”) to reduced till (“RT”) or no-till (“NT”) on the Province of Alberta’s agricultural soils. Carbon Credit Solutions Inc. Tillage Project #7 referred to as “the Project”. This Project has been completed in accordance with the Alberta Offset Credit Project Guidance Document (AENV, 2008 version 1.2). The Verification Report was completed by ICF International and covered the period of time from January 1, 2002 to December 31, 2009. The emission reductions of each vintage year for reduced/no tillage are can be found in the GHG Report for CCS Tillage Project #7. CCS has conformed to all relevant requirements of the GHG programme including the guidelines of the legislation that has been approved. For Alberta sales involving Large Final Emitters registered in the Province of Alberta, CCS has ensured compliance with the regulations of Bill C Climate Change and Emissions Management Act (Alberta) proclaimed in March of 2007. CCS has ensured the CAN/CSA-ISO 14064 requirements have been adhered to. CCS has fulfilled the requirements and have identified, considered and used relevant current good practice guidance as set out in the guidance document. CCS has hired ICF International as the independent third party verification team to review the CCS Project. CCS did not deviate from these guidance procedures. 1. Project Scope and Project Site Description
Project Title: Carbon Credit Solutions Inc. Tillage Project #7 referred to as “the Project”.
Offset Project Plan for Carbon Credit Solutions Inc. Tillage Project #7 Page 3
Carbon Credit Solutions Inc. 2011
The project’s purpose(s) and objective(s) are:
This Project consists of the aggregation of greenhouse gas (“GHG”) emission reductions generated through the change in best management practices used by participants in the implementation of no-till and/or reduced till systems on agricultural lands situated in the Province of Alberta. Carbon Credit Solutions Inc. referred to as CCS, as an aggregator, has collected greenhouse gas emission reductions created by individual farm participants in order to provide sufficient quantities of greenhouse gas emission reductions as required by interested buyers. These greenhouse gas emission reductions have been generated in accordance with the Specified Gas Emitters Regulation Quantification Protocol for Tillage System Management Version 1.3 February 2009 along with the Specified Gas Emitters Regulation Additional Guidance for Interpretation of the Quantification Protocol for Tillage System Management for Carbon Offsets in Alberta Version 1 February 2008 (“Tillage Protocol”). Each participant provided land use information for each quarter section. The CCS software program tracks the information as the CCS data input team member makes each entry. The information is confirmed by the data input team member or Project Manager and farm records are available in each file. The lands must comply with the definitions provided by the Tillage Protocol. Evidence is provided by each participant in order to qualify for entry into the Project. The quantification of reductions achieved by the Project are based on actual measurements and monitoring. Using the Tillage Protocol as a guidance document, each participant provided evidence to ensure all eligibility was met and all criteria was followed. The Project includes the aggregation of greenhouse gas emission reductions generated from individual participants and their lands within each individual farm operation. In this regard, the scope of the Project may vary from year to year as more participants join the Project. The lands included within this Project will be an accumulation of farm operations located entirely within the Province of Alberta.
Date when the project began: The Project start date is January 1, 2002.
Expected lifetime of the project
The expected lifetime of this project is from January 1, 2002 to December 31, 2010.
Credit duration period
The credit duration period for tillage projects is 20 years as defined in the guidance documents. The greenhouse gas reductions are a result of actions taken after January 1, 2002. The greenhouse gas reductions end date is December 31, 2010.
Type of greenhouse gas emission reduction or
Carbon Credit Solutions Inc. (“CCS”) uses the Specified Gas Emitters Regulation Quantification Protocol for Tillage System Management Version 1.3 February
Offset Project Plan for Carbon Credit Solutions Inc. Tillage Project #7 Page 4

Carbon Credit Solutions Inc. 2011
removal project 2009 along with the Specified Gas Emitters Regulation Additional Guidance for Interpretation of the Quantification Protocol for Tillage System Management for Carbon Offsets in Alberta Version 1 February 2008 (“Tillage Protocol”) which sets out the requirements for quantification of greenhouse gas (“GHG”) emission reductions associated with a change from conventional or full tillage (“FT”) to reduced till (“RT”) or no-till (“NT”) on the Province of Alberta’s agricultural soils. The Project has been completed in accordance with the Alberta Offset Credit Project Guidance Document (AENV, 2008 version 1.2). To demonstrate that the CCS Project met the requirements under the Tillage Protocol, CCS has collected and can supply sufficient evidence to demonstrate that:
Farms included within the CCS Project were producing annual crops on the applicable land;
Farms in the CCS Project did operate on the applicable land in a no-till
or reduced till system as defined in the Tillage Protocol;
The quantification of reductions achieved by the CCS Project is based on actual measurement and monitoring (except where indicated in this protocol) as indicated by the Tillage Protocol; and
The Project has met the requirements for offset eligibility as specified in the applicable regulation and guidance documents for the Alberta Offset System.
Legal land description of the project or the unique latitude and longitude
CCS has aggregated using the Tillage Protocol throughout the Province of Alberta. Within our database, any additional information will be made available for specific review upon request.
Software from Alberta Environment Data Services regarding the exact legal descriptions and land locations within the ecoregion has been downloaded into the system.
Ownership of the greenhouse gas emission reductions has been established as per ownership and lease agreements. Contractual agreements for aggregation of the ghg emission reductions exist between the tenant/farmer and CCS as well as between the landowner and CCS. The ownership information includes a current land tax assessment or land title certificate.
Offset Project Plan for Carbon Credit Solutions Inc. Tillage Project #7 Page 5

Carbon Credit Solutions Inc. 2011
Reporting and verification details
The greenhouse gas emission reductions will be verified by a third party verifier according to the Offset Credit Verification Guidance Document (2007 Version 1.0) provided by AENV. CCS has hired ICF International as the independent third party verification team to review the Project. ICF International meets the requirements as outlined in SGER. ICF International auditors have inspected the monthly production statements to ensure the information was accurately entered into the CCS data management system. The scope of verification will be limited to emission reductions and removals for the practices of crop residue, no-till and reduced till for annual crops grown throughout Canadian Prairie Provinces by landowners who have contracted with Carbon Credit Solutions Inc. to claim greenhouse gas reductions. The intent is to verify the compatibility of data and verification tasks. The verification process will adhere to the international standard CAN/CSA-ISO 14064 Part 3 – Greenhouse Gases: Specification with guidance for the validation and verification of greenhouse gas assertions. The time period to be covered in the initial verification audit will be from January 1, 2002 to December 31, 2010. Subsequent verification audits will occur on a yearly basis examining the previous year’s data. The verification process has been used to ensure we have:
enhanced our integrity through the GHG quantification; provided credibility, consistency and transparency; facilitated in the development and implementation of the GHG
management strategies and plans; provided assurance in the development and implementation of
our Project; developed strong materiality in the development and
implementation of our Project; ensured competence and transparency in tracking performance
and progress of our Project; provided solutions and identified the GHG risks or liabilities; presented sufficient strength to ensure investor confidence;
and provided clarity and conservativeness in the crediting and
trading of the CCS developed GHG emission reductions.
Project activity The mitigations are distinguished from the adaptation of the management practice of converting from full tillage to no till operation. Mitigation of this farming practice involves the reductions in the concentrations of greenhouse gases by reducing their sources and increasing their sinks. The project is voluntary in a non-regulated sector operation. Tillage practices are not regulated within the Province of Alberta. The project involves the GHG reductions calculated with tillage management changes from full tillage to no
Offset Project Plan for Carbon Credit Solutions Inc. Tillage Project #7 Page 6

Carbon Credit Solutions Inc. 2011
tillage, based on the soil disturbance and passes made on each parcel of land. It also includes the sequestration of carbon in the soil as a result of such management practices. The result of the changes in the tillage system impact upon the soil organic carbon and is calculated by the degree of soil disturbance that may occur. Each emission offset has been generated from the voluntary action of the landowner or farmer and is not otherwise required by law.
Other
This Project has been completed in accordance with the Alberta Offset Credit Project Guidance Document (AENV, 2008 version 1.2). The Project complies with the Specified Gas Emitters Regulation Quantification Protocol for Tillage System Management Version 1.3 February 2009 along with the Specified Gas Emitters Regulation Additional Guidance for Interpretation of the Quantification Protocol for Tillage System Management for Carbon Offsets in Alberta Version 1 February 2008 (“Tillage Protocol”) The verification process, using the CAN/CSA-ISO 14064 Part 3 standards, has been used to ensure we have:
enhanced our integrity through the GHG quantification; provided credibility, consistency, and transparency; facilitated in the development and implementation of the GHG
management strategies and plans; provided assurance in the development and implementation of
our Project; developed strong materiality in the development and
implementation of our Project; ensured competence and transparency in tracking performance
and progress of our Project; provided solutions and identified the GHG risks or liabilities; presented sufficient strength to ensure investor confidence;
and provided clarity and conservativeness in the crediting and
trading of the CCS developed GHG emission reductions or removal enhancements.
1.1 Conditions prior to Project Initiation The Tillage Protocol used an adjusted baseline approach. The adjusted baseline approach accounts for carbon gains from current adoption levels of no-till and reduced till farming practices within the given regions, adjusted with farm census data from Statistics Canada. Therefore, CCS does not have to provide or prove a particular baseline at the Project start date. The Tillage Protocol applies regardless of the historical practices associated with either the land or the Project. As such, this report does not contain historical information but focuses on the current practices at each farm land included in the Project and identification of the appreciate emission factors based on the region in which the lands are located and the tillage practice used. The credit duration period from January 1, 2002 to December 31, 2010.
Offset Project Plan for Carbon Credit Solutions Inc. Tillage Project #7 Page 7

Carbon Credit Solutions Inc. 2011
1.2 Description of How the Project Will Achieve GHG Emission Reductions To demonstrate that the CCS Project met the requirements under the Tillage Protocol, CCS has collected and can supply sufficient evidence to demonstrate that:
Farms included within the CCS Project were producing annual crops on the applicable land as outlined in the CCS Project Report;
Farms in the CCS Project did operate on the applicable land in a no-till or reduced till
system as defined in the Tillage Protocol; The quantification of reductions achieved by the CCS Project is based on actual
measurement and monitoring as indicated by the Tillage Protocol; and The Project has met the requirements for offset eligibility as specified in the applicable
regulation and guidance documents for the Alberta Offset System. The scope of verification will be limited to emission reductions and removals for the practices of crop residue, no-till and reduced till for annual crops grown throughout the Province of Alberta by landowners who have contracted with CCS to claim greenhouse gas emission reductions. The intent is to verify the compatibility of data and verification tasks. The time period to be covered in the verification audit will be from January 1, 2002 to December 31, 2010. Subsequent verification audits will occur on a yearly basis examining the previous year’s data. Verification criteria are the benchmarks or comparison standards to which the verifier compares the GHG assertion and supporting evidence. 1.3 Project Technologies, Products, Services and the expected level of activity The Quantification Protocol for Tillage System Management has been used to provide the details and elements that are unique to the Protocol. However, unique elements of the project have been defined within the Additional Guidance for Interpretation of the Quantification Protocol for Tillage System Management. These elements include the applicability of the farming practice by clearing describing the number of passes with low-disturbance openers and the discretionary tillage practices up to 10%. The additional guidance information has been followed during the capture of the information. This additional information also sets out the elements of the protocol that are not applicable to the project. Within the project, the opener width and shank spacing of all field equipment was measured to determine a participants tillage. Those allowed to participate in the project qualified for no tillage or reduced tillage as defined by the Protocol. Discretionary tillage of up to 10% of the surface area was tracked and reviewed based on the information on each field for each year. Variances that included additional operations with harrows, packers or similar non soil disturbing implements were accepted. If the injection of fertilizer or manure was applied to the lands, a second low soil disturbance operation was performed and allowed within the Project. Fall seeding was acceptable for no till if it met the disturbance criteria as set out with the Additional Guidance document. Most sweeps did not qualify as no till since there was usually more than 46% soil disturbance. Tillage definitions were followed throughout the Project with each participant.
Offset Project Plan for Carbon Credit Solutions Inc. Tillage Project #7 Page 8

Carbon Credit Solutions Inc. 2011
Tillage practices involving seeding of perennials were tracked. If the perennial was terminated and seeded into an annual crop in the spring, the coefficient was applied for the current year. However, if the perennial crop was terminated in the spring, fallowed and then seeded either that fall or in the next spring, we applied the coefficients for two years (note the coefficient for fallow is currently zero). Irrigation was also another variance that was considered. Parkland coefficients were used on lands under irrigation in the Dry Prairie region (using the SOC and N2 coefficients) but not the energy coefficient. 1.4 Identification of Risks While risk is inherent in every protocol and every process, CCS has developed a data collection and process review to try to mitigate as much risk as possible. Our staff and agents are trained to ensure the highest level of attention is put into each and every file and all data collected. CCS has developed a process to mitigate risk factors that includes its own software program with the coefficients built into the process. Participants supply the data at a farm level with our team of data input staff. All information is gathered by CCS to ensure the highest level of assurance can be reached. It includes the collection of land tax assessments, crop insurance forms, equipment purchase receipts, field inspections and measurement of the equipment. Photographs are taken as well. The Participants are required to review the data twice, once during the collection of the initial data and once the reports have been generated. The risk of data entry error has been mitigated with this method of risk management. 1.5 Roles and Responsibilities
Project Developer Contact Information
Carbon Credit Solutions Inc.
Vanessa Weitz
Project Manager
#8-620 1st Ave N.W.
Airdrie, Alberta
Canada
Phone: (403) 912-9132
Fax: (403) 948-3353
www.carboncreditsolutions.ca
Carbon Credit Solutions Inc.
Alastair Handley
Vice President
#8-620 1st Ave N.W.
Airdrie, Alberta
Canada
Phone: (403) 912-9132
Fax: (403) 948-3353
www.carboncreditsolutions.ca
Authorized Project Contact
(This is a contact that has been given the authority to act on behalf of the project developer.)
Not Applicable
Offset Project Plan for Carbon Credit Solutions Inc. Tillage Project #7 Page 9

Carbon Credit Solutions Inc. 2011
Valdiation (enter information if Validation of this project occurred)
Not Applicable
Verification
(May be added later once a verifier has been engaged)
ICF International
Aaron Schroeder
Project Manager
Suite 2600 144 - 4 Ave SW
Calgary, Alberta
T2P 3N4
Canada
Phone: (403) 303-3330
Fax: (403) 716-3637
www.icfi.com
2. Inventory of Sources and Sinks The criteria used in the identification of sources and sinks and the quantification methodologies for the Project has been determined within the guidelines of the Tillage Protocol. As outlined within the Tillage Protocol document, each field within the Project:
a. must be producing an annual crop on the applicable land as confirmed by an affirmation from the Project developer and farm records;
b. must operate on the applicable land in a no-till or reduced till system as defined within the Tillage Protocol guidance document as confirmed by an affirmation from the Project developer and farm records;
c. must base the quantifications of reductions achieved for each field on actual
measurement and monitoring (except where indicated in the Tillage Protocol) as indicated by the proper application of the Tillage Protocol; and
d. must meet the requirements for offset eligibility as specified in the applicable regulation
and guidance documents for the Alberta Offset System. Of particular note:
i. the project may generate greenhouse gas emission reductions for the period of 20 years as indicated by farm and greenhouse gas emission reductions system records. Additional credit duration periods require a reassessment of the baseline condition; and
ii. ownership of the greenhouse gas emission reductions must be established as indicated by farm records.
Offset Project Plan for Carbon Credit Solutions Inc. Tillage Project #7 Page 10

Carbon Credit Solutions Inc. 2011
This Project meets the requirements outlined above, and the quantification methodology used has not deviated from the methodology outlined within the Tillage Protocol. Backup documentation indicating that the Project meets the above requirements is contained within the farm files. CCS has confirmed the following within each field in the Project:
a. has produced an annual crop on the land as confirmed by farm records; b. operated in a no-till or reduced till system confirmed by CCS data input team, farm
records, and CCS software; c. have based the quantification of reductions achieved for each field on current (2002-
2010) tillage practices at each farm; and d. have met the requirements for offset eligibility as specified in the applicable regulation
and guidance documents for the Alberta Offset System. Of particular note:
iii. the Project is using the government approved assurance factor consideration; and
iv. ownership of the greenhouse gas emission reductions is established as indicated by either a land tax assessment or Land Title Certificate.
The sources and sinks (SS’s) were identified for the Project by carefully reviewing the Tillage Protocol and relevant process flow diagrams found within the Tillage Protocol. This process was confirmed through the review of the Project activities followed within each participant’s farming practices. Because the Tillage Protocol is considered a performance based approach, the standard for the no-till and reduced till farming were considered within the coefficient implicit within the default methodology approach to assessing the relevant performance standard. As per the Tillage Protocol please see a listing of the sources and sinks is below Table 1. Our project did not deviate from the protocol and it included and quantified the source the sinks as listed below. Table 1
Comparison of SS’s 1. Identified SS
2. Baseline (C, R, A)
3. Project (C, R, A)
4. Include or Exclude from Quantification
5. Justification for Exclusion
Upstream SS’s P1 Seed Production N/A Related Exclude B1 Seed Production
Related N/A Exclude Excluded as these SS’s are not relevant to the project as the emissions from these practises are covered under proposed greenhouse gas regulations. Further, the baseline and project conditions will be functionally equivalent.
P2 Seed Transportation (Off-Site)
N/A Related Exclude
B2 Seed Transportation (Off-Site)
Related N/A Exclude
Excluded as the emissions from transportation are negligible and likely functionally equivalent to the baseline scenario.
P5 Fertilizer and N/A Related Exclude Excluded as these SS’s are not relevant to the
Offset Project Plan for Carbon Credit Solutions Inc. Tillage Project #7 Page 11

Carbon Credit Solutions Inc. 2011
Lime Production B5 Fertilizer and Lime Production
Related N/A Exclude project as the emissions from these practises are covered under proposed greenhouse gas regulations. Further, the baseline and project conditions will be functionally equivalent.
P6 Fertilizer and Lime Distribution (Off-Site)
N/A Related Exclude
B6 Fertilizer and Lime Distribution (Off-Site)
Related N/A Exclude
Excluded as the emissions from transportation are negligible and likely functionally equivalent to the baseline scenario.
P9 Pesticide Production
N/A Related Include
B9 Pesticide Production
Related N/A Include
N/A
P10 Pesticide Distribution (Off-Site
N/A Related Exclude
B10 Pesticide Distribution (Off-Site
Related N/A Exclude
Excluded as the emissions from transportation are negligible and likely functionally equivalent to the baseline scenario.
P17 Fuel Extraction and Processing
N/A Related Exclude
B17 Fuel Extraction and Processing
Related N/A Exclude
Excluded as the emissions from the baseline are greater than the project condition so this is a conservative approach, allowing application of the default methodology with available factors.
P18 Fuel Delivery N/A Related Exclude B18 Fuel Delivery Related N/A Exclude
Excluded as these SS’s are not relevant to the project as the emissions from these practises are covered under proposed greenhouse gas regulations.
Onsite SS’s P3 Seed Distribution (On-Site)
N/A Controlled Include
B3 Seed Distribution (On-Site)
Controlled N/A Include
N/A
P4 Seed Use N/A Controlled Exclude B4 Seed Use Controlled N/A Exclude
Excluded as the emissions from seeding are negligible and likely functionally equivalent to the baseline scenario.
P7 Fertilizer and Lime Distribution (On-Site)
N/A Controlled Include
B7 Fertilizer and Lime Distribution (On-Site)
Controlled N/A Include
N/A
P8 Fertilizer and Lime Use
N/A Controlled Exclude
B8 Fertilizer and Lime Use
Controlled N/A Exclude
Excluded as the emissions from seeding are likely functionally equivalent to the baseline scenario.
P11 Pesticide N/A Controlled Include N/A
Offset Project Plan for Carbon Credit Solutions Inc. Tillage Project #7 Page 12

Carbon Credit Solutions Inc. 2011
Distribution (On-Site) B11 Pesticide Distribution (On-Site)
Controlled N/A Include
P12 Pesticide Use N/A Controlled Exclude B12 Pesticide Use Controlled N/A Exclude
Excluded as the emissions from pesticide use are likely functionally equivalent to the baseline scenario.
P13 Soil Crop Dynamics
N/A Controlled Include
B13 Soil Crop Dynamics
Controlled N/A Include
N/A
P14 Farm Operations
N/A Controlled Exclude
B14 Farm Operations
Controlled N/A Exclude
Excluded as the farm operations are likely functionally equivalent to the baseline scenario.
P15 Crop Product Transportation (On-Site)
N/A Controlled Exclude
B15 Crop Product Transportation (On-Site)
Controlled N/A Exclude
Excluded as the emissions from crop harvesting and transportation are likely functionally equivalent to the baseline scenario.
Downstream SS’s P16 Crop Product Transportation (Off-Site)
N/A Related Exclude
B16 Crop Product Transportation (Off-Site)
Related N/A Exclude
Excluded as the emissions from transportation are negligible and likely functionally equivalent to the baseline scenario.
P17 Crop Product Processing
N/A Related Exclude
B17 Crop Product Processing
Related N/A Exclude
Excluded as the emissions from crop product processing are functionally equivalent to the baseline scenario.
Other P20 Building Equipment
N/A Related Exclude Emissions from building equipment are not material given the long project life, and the minimal building equipment typically required.
B20 Building Equipment
Related N/A Exclude Emissions from building equipment are not material for the baseline condition given the minimal building equipment typically required.
P21 Transportation of Equipment
N/A Related Exclude Emissions from transportation of equipment are not material given the long project life, and the minimal transportation of equipment typically required.
B21 Transportation of Equipment
Related N/A Exclude Emissions from transportation of equipment are not material for the baseline condition given the minimal transportation of equipment typically required.
P22 Testing of Equipment
N/A Related Exclude Emissions from testing of equipment are not material given the long project life, and the
Offset Project Plan for Carbon Credit Solutions Inc. Tillage Project #7 Page 13

Carbon Credit Solutions Inc. 2011
minimal testing of equipment typically required.
B22 Testing of Equipment
Related N/A Exclude Emissions from testing of equipment are not material for the baseline condition given the minimal testing of equipment typically required.
3. Identification of Baseline The baseline condition for the Project applying the Tillage Project is considered a performance based approach Project. The performance standard for no-till and reduced till farming has been set relative to a 1990 baseline and has been subject to review and revisions over time. The uptake of no-till and reduced till farming is considered within the coefficients implicit within the default methodology approach to assessing the relevant performance standard. The established baseline is considered static, where the coefficients remain constant, subject to periodic revision to reflect the evolving performance standard. The Tillage Protocol used an adjusted baseline approach. The adjusted baseline approach accounts for carbon gains from current adoption levels of no-till and reduced till farming practices within the given regions, adjusted with farm census data from Statistics Canada. Therefore, CCS does not have to provide or prove a particular baseline at the Project start date. The Tillage Protocol applies regardless of the historical practices associated with either the land or the Project. As such, this report does not contain historical information but focuses on the current practices at each farm land included in the Project and identification of the appropriate emission factors based on the region in which the lands are located and the tillage practice used. The regions and definitions of no-till and reduced till farming practices for the lands included within this Project are outlined below in Table 2 which is found on page 6 of the Tillage Protocol: Table 2 Definitions of tillage systems in the Parkland1 and Dry Prairie protocol areas.
Tillage System Cropped Land Period 2 Fallow Period 3 No Till Up to two passes with low-disturbance openers (up to
38%) 4, 5 or one pass with a slightly higher disturbance opener (up to 46%) to apply seed, fertilizer or manure 6, discretionary tillage of up to 10% 5 , no cultivation
No cultivations
Reduced Till Soil disturbance to apply seed, fertilizer, or manure exceeds no till definition and/or one cultivation in fall or spring
One to two cultivations
Full Till More than one cultivation between harvest and subsequent seeding if no fallow in that period, or, more than three cultivations between harvest to subsequent seeding if fallow
More than two cultivations
Notes:
1. The Peace River Lowland ecoregion is contained within the Parkland zone. 2. Cropped land period applies to the management cycle that terminates at harvest, (e.g. harvest to harvest defines the
cropped land period). This includes land preparation for seeding which may occur in the previous fall. 3. Fallow period extends from harvest for one full year to the next fall. 4. Percentage values associated with openers are based on maximum opener width (e.g. 5 inch openers actually measure
5.5 inches) divided by the shank spacing of the implement. 5. Additional operations with harrows, packers, or similar non-soil disturbing implements are accepted. Where a second low
soil disturbance operation is performed it is normally for injection of fertilizer or manure. 6. Discretionary tillage of up to 10% means that up to 10% of the surface area of a single agricultural field may be cultivated
to address specific management issues. These areas are determined on an annual basis, meaning that specific areas may change from year to year.
Offset Project Plan for Carbon Credit Solutions Inc. Tillage Project #7 Page 14

Carbon Credit Solutions Inc. 2011
The Tillage Protocol provides a flexibility mechanism that allows for the use of site-specific Soil Organic Carbon (SOC) sequestration and N2O coefficients, provided that the coefficients are adjusted for baseline considerations. This Project utilizes the generic coefficients, noted below, presented in the Tillage Protocol and does not use site-specific emission factors, in accordance with the Offset Credit Project Guidance Document (Version 1.2 February 2008). Greenhouse Gas Emission Reductions Calculation Reduced/No Tillage The coefficients and calculations used by the CCS software program in the calculation of reduced/no tillage greenhouse gas emission reductions uses the coefficients and calculations specified in the Tillage Protocol. Specified Gas Emitters Regulation Quantification Protocol for Tillage System Management Version 1.3 February 2009 provides an explanation of the calculations and coefficients used in the Tillage Protocol. In Table 3 below, the column titles provides the equation used to calculate default coefficients use in calculating greenhouse gas emission reductions. The baseline adjusted default coefficients to multiply by the number of hectares. Table 3 Tillage Change
Emission Factor
* Assurance Factor ╪
+ Nitrous Oxide Reduction ¥
+ Energy Reduction €
= Total
Parkland FT to NT 0.36 0.875 0.019 0.075 0.41 FT to RT 0.02 0.875 0.019 - 0.010 0.027 Dry Prairie FT to NT 0.20 0.925 0.005 0.030 0.22 Specified Gas Emitters Regulation Quantification Protocol for Tillage System Management Version 1.3 February 2009 also provides an explanation of the calculations and coefficients used in the Tillage Protocol when irrigation occurs in Dry Prairie. In Table 3a below, the column titles provides the equation used to calculate default coefficients use in calculating greenhouse gas emission reductions when irrigation has occurred on lands in the Dry Prairie zone. The baseline adjusted default coefficients to multiply by the number of hectares. Table 3a Irrigation in Dry Prairie Tillage Change
Emission Factor
* Assurance Factor ╪
+ Nitrous Oxide Reduction ¥
+ Energy Reduction €
= Total
Dry Prairie FT to NT 0.36 0.925 0.019 0.030 0.38 FT to RT 0.02 0.900 0.019 - 0.004 0.033 4. Quantification of Greenhouse Gas Emission Reductions
Offset Project Plan for Carbon Credit Solutions Inc. Tillage Project #7 Page 15

Carbon Credit Solutions Inc. 2011
Quantification of the reductions, removals and reversals of relevant SS’s for each of the greenhouse gases has been used the methodologies outlined Table 4, below as per emissions factors listed above in Table 3 (A listing of relevant emission factors is provided within Appendix A found on pages 27 -31 of the Tillage Protocol. These calculation methodologies serve to complete the following three equations for calculating the emission reductions from the comparison of the baseline and Project conditions). The calculations and emissions factors above and below in Tables 3 and 4 have been used in this project. Table 4 Emission Reduction = Emissions Baseline – Emissions Project Emissions Baseline = Emissions Energy Use + Emissions Carbon Sequestration* Assurance Factor + Emissions Nitrogen Emissions Project = 0 Where: Emissions Baseline = sum of the emissions under the baseline condition. Emissions Energy Use = component of emissions under SS’s B9 Pesticide Production, B3 Seed Distribution (On-Site), B7 Fertilizer and Lime Distribution (On-Site), B11 Pesticide Distribution (On-Site) Emissions Carbon Sequestration = component of emissions under SS B13 Soil and Crop Dynamics Assurance Factor = Factor to account for reversals due to tillage events. Relevant assurance factors are provided in Appendix B found on pages 27 -31 of the Tillage Protocol. Emissions Nitrogen = component of emissions under SS B13 Soil and Crop Dynamics Emissions Project = sum of the emissions under the project condition
CCS has collected information from each participant regarding the volume of GHG sources, sinks and reservoirs relevant to the activity and relevant to the baseline scenarios. CCS followed the guidelines in the Additional Guidance for Interpretation of the Quantification Protocol for Tillage System Management for Carbon Offsets in Alberta along with the Calculating Total Coefficients for a Region, using Tables A2 – A4, and B1, as contained within the Tillage Protocol on Page 35. These coefficients were inserted in the CCS data software program for calculations. No parts of the Tillage Protocol elements have been excluded in this Project. There were no quantification elements contained within the Tillage Protocol that were unique to the Project. 5. Monitoring Plan The quantification of the reductions, removals and reversals of relevant sinks and sources for each of the greenhouse gases has been completed using the methodologies outlined within Section 2.5 of the Tillage Protocol and the emission factors provided in Appendix A found on pages 27 -31 of the Tillage Protocol of
Offset Project Plan for Carbon Credit Solutions Inc. Tillage Project #7 Page 16

Carbon Credit Solutions Inc. 2011
the Tillage Protocol. These calculations have been entered into the CCS software program. The calculations and coefficient methodology is described on Pages 10 & 11 herein and provides details as to how the formulas and calculations were generated. Based on our land use information regarding size and distance between shanks, the coefficients were developed to ensure the data collection could not be modified by the participant since each participant provides evidence as to the size of the spacers and distances of shanks along with the number of cultivations per crop year. This information is entered into the system and the software program codes provide the reporting fields and are applied to the coefficients. As the information in the previous section indicates, there are two main data sources required for the calculation methodology outlined in the Tillage Protocol – the area of the lands cultivated under each tillage practice and the ecoregion each legal land description is located within. Within each participant file, the source information is provided and checked for accuracy. Within the Tillage Protocol data quality management requires sufficient data capture such as the mass and energy balances that provide for minimal assumptions and use of contingency procedures. The data must be of sufficient quality to fulfil the quantification requirements and be substantiated by company records for the purpose of verification. Written procedures were established for each measurement and documentation assurance factors. The requirements for CCS purposes were developed and required to satisfy the participation of each participant. These assurance factors have been previously discussed on pages 15 and 16 herein. For the purposes of this Project, the area of each of the lands cultivated under each tillage practice is calculated in one of the following ways:
a. from Land Title Certificates from Alberta Land Titles Registries, b. from Canadian Wheat Board permit books; c. from dealer equipment receipts; d. from Alberta Crop Insurance forms; e. from crop plans; f. from satellite reports; g. from field inspections; and h. from information provided by the participant.
If calculation methods other than those lists here are used, the methodology is noted and justification is provided in the participant’s file. The ecoregion of each field is based on the map provided by the Alberta Environment Data Services and downloaded to the CCS software program. The assurance process has been reviewed in great detail and the following assertions listed below in Table 5 have been made in this regard. The information below sets out the assurance information secured by CCS from each participant. If the land tax assessment was not available, a land title search was completed and a copy of the Land Title Certificate would be used for proof of land ownership. In most instances, the participant provided crop insurance documentation. However, if that was not available, the participant was asked to provide another assurance document. Table 5 Method Description of Method Assurance Factor Issues with method Land Title Search provincial land titles High Level of Assurance Land Title Certificate provides
Offset Project Plan for Carbon Credit Solutions Inc. Tillage Project #7 Page 17

Carbon Credit Solutions Inc. 2011
Certificate registry for proof of ownership
details on ownership and area of lands.
Crop Insurance
Inspectors review crops during seeding for insurance coverage provide certificate of same
High Level of Assurance Crop insurance forms are based on a field which can include several quarter sections.
Verified Information Document
The Verified Information Document is signed by the participant when they receives a copy of their data, in a summary report, that has been entered in our software
High Level of Assurance After reviewing the summary report the participant signs the Verified Information Document confirming the information is correct and accurate.
Equipment Purchases
Receipts from equipment dealers for the purchase of tillage equipment
Medium Level of Assurance
Receipts prove the type of equipment the participant owns.
Canadian Wheat Board Permit
Grain shipping staff track the information in a permit book issued per participant
Medium Level of Assurance
Permit books provide proof of the type of crop grown in specific fields.
Crop Plan A crop plan is provided to an agronomist and seed/chemical dealer to ensure product is available to the producer for the spring farming applications.
High Level of Assurance This plan is prepared on an annual basis and would provide a good understanding of what the farmer has planted and would list his/her farming practice.
Field Inspections
Most agents are at the field level at least twice in a year
High Level of Assurance While the agent is out in the field, it would be wise, if possible, to take a picture of the shanks with a measuring tape to put on file.
Field Inspections
The agronomist is a key person in the participant farming practises, providing guidance information and help. In most agronomist businesses, they are the field several times a growing season.
High Level of Assurance If the participant uses an agronomist not affiliated with another aggregator, a field inspection from the agronomist is accepted as a high level of assurance or an affidavit from the agronomist.
Satellite field reports
Satellite imagery appears to increase accuracy in estimating crop production. This can be done with pinpoint accuracy.
High Level of Assurance This is a very high level of assurance and some agronomist companies have the field reports that they use to ensure proper chemical coverage, if the agronomist is not part of another organization, the participant can request a copy and provide same as assurance.
Photograph equipment
The agent can go out to the storage area and take a picture of the equipment
High Level of Assurance This is a very high level of assurance since you have a picture of the actual equipment.
Offset Project Plan for Carbon Credit Solutions Inc. Tillage Project #7 Page 18

Carbon Credit Solutions Inc. 2011
It is best if the agent has a measuring tape or ruler to put next to the spacers and shanks as proof of size.
CCS has developed its program regarding the GHG emission reduction or removal factors that:
a. are derived from a recognized origin; b. are appropriate for the GHG sinks concerned; c. are current at the time of quantification; d. take into account the quantification uncertainty; e. are calculated in a manner that is intended to yield the most accurate and
consistent results; and f. are consistent with the intended use of this GHG Report.
a. CCS derived its program using a recognized origin. The Alberta Offset System recognizes the Tillage
Protocol and based information on historical information provided by the Soil Management Technical Working Group. CCS ensured the details on the technical elements of the Tillage Protocol were included within the development of the software program.
b. CCS reviewed the GHG sinks involved in this Tillage Protocol and the opportunity for generating
greenhouse gas emission reductions within the Tillage Protocol arising from the direct and indirect reductions of greenhouse gas emissions through implementing no-till and reduced till systems on agricultural lands.
c. CCS has used relevant emission factors, relevant assurance factors, and coefficients specific to the
ecoregions as outlined in the Tillage Protocol posted on the Carbon Offset Solutions website which are current at the time of quantification. These ecoregions are Dry Prairie and Parkland and site specific. These ecoregions are determined by our extraordinary software program based on the legal land description entered into the software by a CCS data entry member.
d. The Tillage Protocol uses the adjusted baseline approach which takes into account the quantification
of reductions achieved from the current adoption levels of reduced-till and no-till practices within the given regions, adjusted using current farm census data from Statistics Canada.
e. CCS’s data management system is a custom application developed on SQL Server 2005 and Microsoft’s
.Net framework. This internet application has been designed to manage the collection, manipulation and storage of all critical data elements required to identify, create, track, and sell greenhouse gas emission reductions. In order to support this Project the system stores and manages data including: farming practices, historical land use information, property owners, property renters, contracts and Tillage Protocol coefficients. All data is stored in a Microsoft SQL Server 2005 database. Direct access to this database is restricted to database administrators. Data cannot be modified or deleted from the system once it has been used to generate an approved greenhouse gas emission reduction. Copies (electronic and/or paper) of all field data, data analyses, estimates of the changes in carbon stocks and non-CO2 GHG and corresponding calculations and models used are stored in a dedicated and secure location.
f. CCS has followed the methodology and direction provided within the Tillage Protocol and its system is
Offset Project Plan for Carbon Credit Solutions Inc. Tillage Project #7 Page 19

Carbon Credit Solutions Inc. 2011
consistent with the intended use of this GHG Report. 6. Data Information Management System and Data Controls The CCS monitoring and quality assurance/quality control (QA/QC) methodology is incorporated within the CCS software program and is described in greater detail below. QA/QC are applied to provide confidence that all the measurements and calculations have been made and entered correctly. It includes using a software program that has internal checks and balances to safeguard against human error and data entry mistakes. It protects the records of the data in off-site dedicated servers. Members of the data input team regularly check each others work to ensure data integrity and to ensure against typing errors and data entry problems. CCS provides sufficient training to its agents and data input teams to ensure proper use of the equipment and software. CCS provides on-going training and supervision to ensure the establishment of minimum experience and requirement guidelines for its staff. Regular recalculations are made to ensure no mathematical errors have been made. To initiate participation in our program at a particular farm operation, the CCS salesman will conduct an initial onsite information meeting and interview with the farm operator. During this initial meeting, the CCS salesman will discuss the process and ascertain whether the particular farm operator will qualify using the definitions and guidelines provided in the Tillage Protocol. If the operator is also the owner of the lands, the contract will be discussed. If the operator rents the lands, he/she is provided with documentation that his/her landowner must sign for completion and entry of any data. The CCS salesman provides the participant with a list of information that he/she must provide and have available when the data input team arrives to collect the information and a contract. The contract will be provided to the verifier and government individuals upon request. The arrival of a contract triggers the creation of a new file and kicks of an orchestrated set of activities that result in marketable offsets. Upon receiving a new contract the data management team calls the farmer to review our process and to ensure that the farmer will qualify for offsets. In addition a time to meet with the farmer and collect all relevant farming data is arranged. A member of the data collection team then meets with the client and collects, assurance documents, cropping information and takes photographs of all seeding equipment. A list of all properties being farmed and the property owners is also completed. All the data is brought back to our office to be processed. All project data is processed in the same manner. First a project is created in our system along with contact data for the farmer. Once a project is made the real data processing can begin. Data entry starts with Land Titles. Land Title searches are completed and associated data is download from the SPIN II registry website into our data system. By using the digital files available from the registry we are able to mitigate data entry errors. Furthermore our system is structured so that a property can only be entered into our system if it has a corresponding ownership document. This means that clear ownership has to be established on all properties before we can work with the data. As ownership data is added to the system property records are created in our database. A property can only be created once. When a property does change hands our system manages both the historical and current ownership. The system does not allow a specific portion of a legal description to be entered more than once within the same vintage year. Within our system, the legal descriptions are tracked to ensure
Offset Project Plan for Carbon Credit Solutions Inc. Tillage Project #7 Page 20

Carbon Credit Solutions Inc. 2011
there are no duplicates are entered within the same vintage year. For example, a renter and a landowner cannot mistakenly be entered as separate participants. It also prevents errors in typing or in having been provided with an incorrect legal description since the legal descriptions are checked against either the land tax assessment information or a Land Title Certificate. A system report is generated to ensure no legal land description has been duplicated within the same vintage year. This further eliminates issues of double counting of acres. Once the data has been entered into the system and locked down, none of the CCS staff is authorized to tamper with or change any information. The system administrator is the only person authorized to make changes and any changes are recorded qualifying why system information was changed. Land title data used and displayed in our system includes: Legal land description Registration date Title reference number County/municipality Ownership type (Joint Tenancy, Undivided Interest etc) Acres - less any subdivisions, or road allowance Landowner names and addresses Date of the land title search When a property is entered into our system our software determines if it falls in the Parkland or Dry Prairie regions by comparing the legal land description against Alberta Agricultures list of Dry Prairie properties. Once a property is added to our system we can enter the related land use and management practices that occur on the land on an annual basis. The CCS data input team member collects field related data from the participant. He or she enters information including the legal land description, total area of the lands, area of the land farmed, shank and opener measurements, type of crop planted, crop years (usually 2002 to 2010) participant name and address, landowners name and address, payment split information, number of cultivations, percentage of discretionary tillage, crop residue, and irrigation details. Tillage method is automatically confirmed by the software program based on measurements of shank spacing, openers, number of passes, and number of cultivations. The CCS data input team member collects pertinent information from the participant to provide assurance backup documentation which is stored on the participant file and kept in the CCS offices. After the cropping details have been added to the database, this information is then saved to the remote server where it is provided a unique identifier code that is linked to the participant and is used for all documentation associated with the greenhouse gas emission reductions generated on those lands. As part of QA/QC every participants file goes through a review at the project management level. The project manager reviews each vintage year of land use data, acres, equipment sizes, number of passes, number of cultivations, discretionary tillage, as well as thoroughly reviews each ownership document. When this review is complete, the participant will receive a report summarizing of the all the cropping data they provided and are required to sign a certificate indicating the information we have entered in our software is true and accurate. Included in our QA/QC procedures is a review of each legal land description using the Alberta Soil Viewer and/or Google Earth. Each legal land description is viewed to ensure the cropped acres as claimed by the grower do not exceed the maximum arable acres, as viewed on Google Earth and/or Alberta Soil Viewer. If a discrepancy is found, a member of the Data Collection team will contact the grower to discuss this
Offset Project Plan for Carbon Credit Solutions Inc. Tillage Project #7 Page 21

Carbon Credit Solutions Inc. 2011
finding, as some of the images are outdated, or do not account for changes such as cleared land, or low, wet spots. The ALTALis Coordinate file was used to acquire the geographic coordinates used to locate sections on Google Earth. The server has an array of redundant hard drives to ensure that the data will not be lost if a hard drive fails. In addition the application database is backed up and stored on another computer on a regular basis. The formulas and coefficients are entered into the system using a series of fields, reporting programs and codes. This information is tested using sample data and manually reviewed to ensure accuracy within the calculation process. The mathematical formulas are also manually reviewed to ensure the same level of accuracy. The decimal system is set to a level of one then thousandth to ensure the most accurate process and to handle any rounding issues that may occur during the calculation of the formulas and coefficients. This information is again checked by the accounting team and the verification experts to provide confirmation of the accuracy of the programming. The data monitoring and quantification methodology utilized by CCS was developed to address the following potential sources of errors:
a. Inaccurate details from farm operators;
b. Transcription error during data input into the data base;
c. Double counting acres;
d. Changes to data in the system after it has been entered; and
e. Calculation error due to database programming.
a. The solution to ensure inaccurate details received from farm operators has been addressed at the farm
level as CCS provides the participant with copy of all the land use data we have entered in our software. CCS retains a copy of the ownership and assurance information in permanent files at the CCS office. By executing the contract, the farm operator confirms the information provided is accurate and true.
b. CCS data input team member data enters the information provided by the participant after collecting
this information at the farm. The participant answers the questions, if he/she does not understand or is confused, the issue is clarified. The participant is not left to guess what is intended with the questions. After the data is entered into our software the participant is provided with a copy of the land use information to review. As well the participant will be required to sign and return a certificate confirming the land use information is accurate.
c. The data system has been designed to not allow the same portion of a legal description be entered
into the system within the same vintage year. This eliminates the issues of both the landowner and the renter trying to both participate separately. Ownership of the lands is confirmed with proof of ownership prior to any data entered into the system. CCS also requires the signatures of the landowner and the renter on the contract. As well, a system report is generated to ensure no legal land description has been duplicated within the same vintage year. This further eliminates issues of double counting of acres.
Offset Project Plan for Carbon Credit Solutions Inc. Tillage Project #7 Page 22

Carbon Credit Solutions Inc. 2011
d. Once the data is entered into the system and the save button has been activated, no one other than
the CCS software system administrator has access to the data. If data must be changed, the system administrator is the only person authorized to make changes and any changes are recorded qualifying why system information was changed.
e. During the design of the system, the chart of protocols (formulas and coefficients) had been reviewed
by the administrator, the CCS staff, and the verification team to ensure accuracy and no errors in calculations. The coefficients and formulas are programmed into the system based on the data supplied within the Tillage Protocol. Software from Alberta Environment Data Services regarding the exact legal descriptions and land locations within the ecoregion has been downloaded into the system. The input team and the farmer do not need to worry about which ecoregion the lands are located; the precision of the software does this. The system also does not allow the participant or the CCS staff to decide the tillage practice, it is formulated directly from the measurements taken from the equipment used to plant the annual crop, and the information collected and entered into the system. The entire CCS Quantification process is outlined from start to finish in Table 6 below.
Offset Project Plan for Carbon Credit Solutions Inc. Tillage Project #7 Page 23

Carbon Credit Solutions Inc. 2011
Table 6
Agent meets with participant
Agent receivessigned contract from participant
Data Entry Staffenters farm information
into database
Data reviewedin office and locked down
Participant verifies collected data
is correct
Payment reportsare created
Crop Summary Sheetsand Verified InformationDocuments are sent to
the Participant
Cheque sent to Participant
Buyer purchases serialized offsets
Offsets are created and registered
with CCC
Third Party Verifierreviews all data
Carbon Credit Solutions Business Process
Data Entry Staffenters farm information
into database
Data Entry Staffenters farm information
into database
Data reviewedin office and locked down
Data Entry Staffenters farm information
into database
Crop Summary Sheetsand Verified InformationDocuments are sent to
the Participant
Data reviewedin office and locked down
Data Entry Staffenters farm information
into database
Participant verifies collected data
is correct
Crop Summary Sheetsand Verified InformationDocuments are sent to
the Participant
Data reviewedin office and locked down
Data Entry Staffenters farm information
into database
Data Entry Staffreceives crop information
Third Party Verifierreviews all data
Participant verifies collected data
is correct
Crop Summary Sheetsand Verified InformationDocuments are sent to
the Participant
Data reviewedin office and locked down
Data Entry Staffenters farm information
into database
Offsets are created and registered
with CCC
Third Party Verifierreviews all data
Participant verifies collected data
is correct
Crop Summary Sheetsand Verified InformationDocuments are sent to
the Participant
Data reviewedin office and locked down
Data Entry Staffenters farm information
into database
Buyer purchases serialized offsets
Offsets are created and registered
with CCC
Third Party Verifierreviews all data
Participant verifies collected data
is correct
Crop Summary Sheetsand Verified InformationDocuments are sent to
the Participant
Data reviewedin office and locked down
Data Entry Staffenters farm information
into database
Payment reportsare created
Buyer purchases serialized offsets
Offsets are created and registered
with CCC
Third Party Verifierreviews all data
Participant verifies collected data
is correct
Crop Summary Sheetsand Verified InformationDocuments are sent to
the Participant
Data reviewedin office and locked down
Data Entry Staffenters farm information
into database
Cheques sent to participant
Payment reportsare created
Buyer purchases serialized offsets
Offsets are created and registered
with CCC
Third Party Verifierreviews all data
Participant verifies entered data
is correct
Land Use Reportand Verified InformationDocuments are sent to
the participant
Internal QA/QC is performed and
file is locked down
Data Entry Staffenters farm information
into database
Data Entry Staffpulls Land Titles,enters ownership
Information indatabase
Data Entry Staffmeets withparticipant
Offset Project Plan for Carbon Credit Solutions Inc. Tillage Project #7 Page 24

Carbon Credit Solutions Inc. 2011
7. Verification of CCS Tillage Project #7
The CCS GHG Report for Tillage Project #7 has been provided to the independent third party verifier team chosen by CCS to conduct the verification. The scope of verification will be limited to emission reductions and removals for the practices of no-till and reduced till for annual crops grown throughout Alberta, by landowners who have contracted with Carbon Credit Solutions Inc. to claim greenhouse gas reductions. The verification process will adhere to the international standard CAN/CSA-ISO 14064 Part 3 – Greenhouse Gases: Specification with guidance for the validation and verification of greenhouse gas assertions. The time period to be covered in the initial verification audit will be from January 1, 2002 to December 31, 2010. Subsequent verification audits will occur on a yearly basis examining the previous year’s data. The verification process has been used to ensure we have:
enhanced our integrity through the GHG quantification; provided credibility, consistency and transparency; facilitated in the development and implementation of the GHG management strategies
and plans; provided assurance in the development and implementation of our Project; developed strong materiality in the development and implementation of our Project; ensured competence and transparency in tracking performance and progress of our
Project; provided solutions and identified the GHG risks or liabilities; presented sufficient strength to ensure investor confidence; and provided clarity and conservativeness in the crediting and trading of the CCS developed
GHG emission reductions. To demonstrate that the CCS Project met the requirements under the Tillage Protocol, CCS has collected and can supply sufficient evidence to demonstrate that:
Farms included within the CCS Project were producing annual crops on the applicable land as outlined in the CCS Project Report;
Farms in the CCS Project did operate on the applicable land in a no-till or reduced till
system as defined in the Tillage Protocol; The quantification of reductions achieved by the CCS Project is based on actual
measurement and monitoring as indicated by the Tillage Protocol; and The Project has met the requirements for offset eligibility as specified in the applicable
regulation and guidance documents for the Alberta Offset System. Verification criteria are the benchmarks or comparison standards to which the verifier compares the GHG assertion and supporting evidence.
Offset Project Plan for Carbon Credit Solutions Inc. Tillage Project #7 Page 25

Carbon Credit Solutions Inc. 2011
Carbon Credit Solutions Inc. has chosen ICF International to complete the verification for the Project. ICF International uses the Alberta Specified Gas Emitters Regulated system and ISO 14064;3 for compliant verification services and meets the requirements of the regulated facility. ICF International will verify that the Carbon Credit Solutions Inc. Tillage Project #7 is:
substantiated by sufficient and appropriate evidence, and;
meets the criteria of the Specified Gas Emitters Regulation Quantification Protocol for Tillage System Management Version 1.3 February 2009 along with the Specified Gas Emitters Regulation Additional Guidance for Interpretation of the Quantification Protocol for Tillage System Management for Carbon Offsets in Alberta Version 1 February 2008.
A Verification Report will be issued to Carbon Credit Solutions Inc. for inclusion in their greenhouse gas emission reductions submission to Alberta Environment. A management letter will be issued to CCS containing observations that were made during the course of the verification audit that are not material to the GHG assertion but could improve the efficiencies and effectiveness of the Project’s GHG data management system and data controls. Carbon Credit Solutions Inc. will correct any errors, omissions or misrepresentations identified during the course of the verification. The GHG reductions or removals (in tonnes CO2e) were calculated, including clearly identifying all inputs, emission factors, equations and methods using the Specified Gas Emitters Regulation Quantification Protocol for Tillage System Management Version 1.3 February 2009 along with the Specified Gas Emitters Regulation Additional Guidance for Interpretation of the Quantification Protocol for Tillage System Management for Carbon Offsets in Alberta Version 1 February 2008 using their inputs, tables, emission factors, equations and methods as outlined within section 2.5 Quantifications of Reductions, Removals and Reversals of Relevant SS’s. The verification criteria are described in the Verification and Sampling plan issued to Carbon Credit Solutions Inc. for inclusion in their greenhouse gas emission reductions submission to Alberta Environment.
The GHG Report for CCS Tillage Project #7, sets out the levels of assurance as prescribed by the Specified Gas Emitters Regulation Offset Credit Project Guidance Document February 2008 Version 1.2. They include: The highest level of assurance is known as an audit or reasonable level of assurance. This is also known as positive assurance because the opinion is a direct factual statement expressing the opinion of the assurance practitioner. The middle level is known as review or limited level of assurance. This is also known as negative assurance because the opinion is based on the identification of anomalies rather than the confirmation of the assertion. Typically, this is worded “Based on our review, nothing has come to our attention that causes us to believe that the GHG statement is not, in all material respects, in accordance with the approved quantification protocols.”
Offset Project Plan for Carbon Credit Solutions Inc. Tillage Project #7 Page 26

Carbon Credit Solutions Inc. 2011
The lowest level of assurance is a no assurance engagement. The most common example is a compilation engagement, such as hiring a person to prepare a tax return, which is not considered to be an assurance engagement because the verifier cannot express an opinion on their work. The level of effort and cost required to complete a verification increases with the level of assurance. Alberta Environment has requested that at a minimum that a review level of assurance be provided for the GHG emission reductions submissions. Given that all of the participants have provided an assurance document to support their tillage practices and that random land title searches have been conducted where land tax assessments were provided, it is believed the Auditor will be able to offer a limited level of assurance, depending on the results of the audit. The greenhouse gas emission reductions achieved as a result of this Project will be claimed on an annual basis and quantified in accordance with the calculation methodology described in the Specified Gas Emitters Regulation Quantification Protocol for Tillage System Management Version 1.3 February 2009 along with the Specified Gas Emitters Regulation Additional Guidance for Interpretation of the Quantification Protocol for Tillage System Management for Carbon Offsets in Alberta Version 1 February 2008. The greenhouse gas emission reductions have been verified by a third party verifier according to the Offset Credit Verification Guidance Document (2007 Version 1.0) provided by AENV.
Offset Project Plan for Carbon Credit Solutions Inc. Tillage Project #7 Page 27

Carbon Credit Solutions Inc. 2011
Appendix A Quantification Protocol for Tillage System Management Version 1.3 February 2009
Offset Project Plan for Carbon Credit Solutions Inc. Tillage Project #7 Page 28

SPECIFIED GAS EMITTERS REGULATION
Prepared By:
QQUUAANNTTIIFFIICCAATTIIOONN PPRROOTTOOCCOOLL FFOORR TTIILLLLAAGGEE SSYYSSTTEEMM MMAANNAAGGEEMMEENNTT
FEBRUARY 2009
Version 1.3

Tillage Systems Protocol February 2009
Disclaimer: The information provided in this document is intended as guidance only and is subject to revisions as learnings and new information comes forward as part of a commitment to continuous improvement. This document is not a substitute for the law. Please consult the Specified Gas Emitters Regulation and the legislation for all purposes of interpreting and applying the law. In the event that there is a difference between this document and the Specified Gas Emitters Regulation or legislation, the Specified Gas Emitters Regulation or the legislation prevail. This protocol allows for the incorporation of custom coefficients. In such cases, the following policy framework applies:
1. Government Approved Protocols Only • All credits used for compliance must be verified using Alberta Government
approved protocols. • This includes new protocols and any already approved protocols where
custom coefficients are being considered. • The process for submitting new protocols can be found
http://www.carbonoffsetsolutions.ca/.
2. Rigorous Scientific Foundation • All protocols will be based on best-available science. • Adjustments will be made as appropriate to ensure credits reflect beyond
business as usual reductions. • For carbon sequestration projects, the following adjustments will be made:
i. Baseline adjustment to account for existing practices. ii. Incorporation of an assurance factor to account for potential carbon
releases over the project period. • Guidance on developing new coefficients/protocols can be found on
http://www3.gov.ab.ca/env/climate/.
3. Retroactive Crediting • Where custom coefficients have been demonstrated to reflect sound science
and have incorporated the appropriate adjustments: i. The new coefficients will be made publically available as a revised
Alberta Government approved protocol. ii. All applicable projects are eligible to receive credit for the difference
in associated reductions between the originally approved and new quantification protocol, back to 2002.
Page i

Tillage Systems Protocol February 2009
Acknowledgements:
This protocol is largely based on the historical document called Tillage System Default Coefficient Technical Background Document dated October 2006. This work was completed under the Soil Management Technical Working Group (SMTWG). Dennis Haak from Agriculture and Agri-Food Canada was the principal author. This work represents the culmination of a multi-stakeholder consultation process and reliance on a number of guidance documents. This document represents an abridged and re-formatted version of this work. Therefore, the background document remains the source of additional detail on any of the technical elements of the protocol. Follow-up work by Dennis Haak has been substantial and very much appreciated. All Quantification Protocols approved under the Specified Gas Emitters Regulation are subject to periodic review as deemed necessary by the Department, and will be re-examined at a minimum of every 5 years from the original publication date to ensure methodologies and science continue to reflect best-available knowledge and best practices. This 5-year review will not impact the credit duration stream of projects that have been initiated under previous versions of the protocol. Any updates to protocols occurring as a result of the 5-year and/or other reviews will apply at the end of the first credit duration period for applicable project extensions. Any comments, questions, or suggestions regarding the content of this document may be directed to:
Alberta Environment Climate Change Policy Unit
12th Floor, 10025 – 106 Street Edmonton, Alberta, T5J 1G4
E-mail: [email protected] Date of Publication: March 2009 Copyright in this publication, regardless of format, belongs to Her Majesty the Queen in right of the Province of Alberta. Reproduction of this publication, in whole or in part, regardless of purpose, requires the prior written permission of Alberta Environment. © Her Majesty the Queen in right of the Province of Alberta, 2009
Page ii

Tillage Systems Protocol February 2009
Table of Contents List of Tables .................................................................................................................................... iii 1.0 Project and Methodology Scope and Description ...................................................... 1
1.1 Protocol Scope and Description...................................................................................... 1 1.2 Glossary of New Terms .................................................................................................. 5
2.0 Quantification Development and Justification........................................................... 7 2.1 Identification of Sources and Sinks for the Project......................................................... 7 2.2 Identification of Baseline.............................................................................................. 12 2.3 Identification of SS’s for the Baseline .......................................................................... 12 2.4 Selection of Relevant Project and Baseline SS’s .......................................................... 17 2.5 Quantification of Reductions, Removals and Reversals of Relevant SS’s ................... 21
2.5.1 Quantification Approaches .............................................................................. 21 2.5.2. Contingent Data Approaches ....................................................................... 24 2.6 Management of Data Quality........................................................................................ 24
2.6.1 Record Keeping ............................................................................................... 24 2.6.1 Quality Assurance/Quality Control (QA/QC) ................................................. 24
APPENDIX A: ................................................................................................................................ 27 Determination of Baseline Adjusted Emission Factors .......................................................... 28
APPENDIX B:................................................................................................................................. 32 APPENDIX C: ................................................................................................................................ 34 APPENDIX D: ................................................................................................................................ 36
List of Figures FIGURE 1.1 Process Flow Diagram for Project Condition 2 FIGURE 1.2 Process Flow Diagram for Baseline Condition 3 FIGURE 2.1 Project Element Life Cycle Chart 7 FIGURE 2.2 Baseline Element Life Cycle Chart 12
List of Tables TABLE 1.1 Definitions of No-Till and Reduced Till 5 TABLE 2.1 Project SS’s 8 TABLE 2.2 Baseline SS’s 13 TABLE 2.3 Comparison of SS’s 17 TABLE 2.4 Quantification Procedures 21 TABLE 2.5 Contingent Data Collection Procedures 24
Page iii

Tillage Systems Protocol February 2009
1.0 Project and Methodology Scope and Description The opportunity for generating carbon offsets with this protocol arises from the direct and indirect reductions of greenhouse gas (GHG) emissions through implementing no-till and reduced till systems on agricultural lands.
1.1 Protocol Scope and Description This protocol provides a default methodology for quantifying carbon offsets through projects that undertake reduced tillage on agricultural land. Theoretically, this protocol can be applied to all land and all agricultural producers across the country; however, more work will need to be done for soil zones outside the prairies with respect to the assurance factor (see Appendix B). To use this protocol, project developers will not have to prove their baseline at the project start date. This protocol will apply, regardless of historical practices associated with the land or a producer. This approach, termed as the adjusted baseline approach, accounts for carbon gains from current adoption levels of reduced-till and no-till practices within the given region, adjusted with farm census data from Statistics Canada. FIGURE 1.1 offers a process flow diagram for a typical project. FIGURE 1.2 offers a process flow diagram for a typical baseline configuration. Protocol Approach: In order to make the default approach feasible and credible, it is necessary to create project coefficients and baseline deductions that are regionally aggregated. In other words, in a given region, all project lands under no-till receive the same emission factor per area regardless of what tillage systems were used in the past. As such this protocol strives to simplify and minimize project administrative costs by not having to collect and analyze historical information for project land parcels. Protocol Applicability: This protocol is applicable to annual crops grown throughout Canada. Perennial crops are not within the scope of the protocol. While some perennial row crops may involve tillage (e.g. orchards, small fruits, nuts, nurseries, woodlots, etc.), the coefficients used in this protocol are not applicable since the tillage in these scenarios only involves part of the land area (i.e. the inter-row zone). It is recognized that farming and cropping systems are complex, often with interdependent practices. GHG emissions are potentially generated by many different specific practices, in addition to the tillage system. However, the reduction coefficients used in this protocol assume that when comparing the project and baseline scenarios for all other aspects of farm operation that there are negligible GHG impacts from the project. This assumption allows for the layering of protocols across a number of project areas. Aspects relating to nitrogen (N) fertilizer application timing and nitrogen application rate are independent of this Tillage Protocol and will be dealt with in a separate protocol dealing with nitrogen management. Protocol linkages will be considered as part of the development process.
Page 1

Tillage Systems Protocol February 2009
Page 2
To demonstrate that a project meets the requirements under this protocol, the project proponent must supply sufficient evidence to demonstrate that:
1. Farms must be producing annual crops on the applicable land as confirmed by an affirmation from the project developer and farm records;
2. Farms in the project must operate on the applicable land in a no-till or reduced till system as defined in this protocol as confirmed by an affirmation from the project developer and farm records;
3. The quantification of reductions achieved by the project is based on actual measurement and monitoring (except where indicated in this protocol) as indicated by the proper application of this protocol; and,
4. The project must meet the requirements for offset eligibility as specified in the applicable regulation and guidance documents for the Alberta Offset System.
5. Additional guidance to this protocol can be found at http://environment.alberta.ca/1238.html.

Tillage Systems Protocol February 2009
FIGURE 1.1: Process Flow Diagram for Project Condition
P17 Crop Product
Processing and
Utilization
P18 Fuel Extraction / Processing
P19 Fuel Delivery
P20 Building
Equipment
P22 Testing of
Equipment
P1 Seed Production
P2 Seed Distribution (Off-Site)
P9 Pesticide Production
P10 Pesticide
Distribution (Off-Site)
P5 Fertilizer and Lime
Production
P6 Fertilizer and Lime
Distribution (Off-Site)
P4 Seed Use
P12 Pesticide
Use
P8 Fertilizer and Lime
Use
P3 Seed Distribution
(On-Site)
P11 Pesticide
Distribution (On-Site)
P7 Fertilizer and Lime
Distribution (On-Site)
P13 Soil and Crop
Dynamics
P16 Crop Product
Transportation (Off-Site)
P15 Crop Product
Transportation (On-Site)
P14 Farm Operations
P21 Transportation of Equipment
Page 3

e Systems Protocol February 2009
Page 4
FIGURE 1.2: Process Flow Diagram for Baseline Condition
B18 Fuel Extraction / Processing
B19 Fuel Delivery
B20 Building
Equipment
B22 Testing of
Equipment
B21 Transportation of
Equipment
B1 Seed Production
B2 Seed Distribution (Off-Site)
B9 Pesticide Production
B10 Pesticide
Distribution (Off-Site)
B6 Fertilizer and Lime
Distribution (Off-Site)
B4 Seed Use
B12
Pesticide Use
B8 Fertilizer
and Lime Use
B3 Seed Distribution
(On-Site)
B11 Pesticide
Distribution (On-Site)
B7 Fertilizer and Lime
Distribution (On-Site)
B13 Soil
B13 Soil and Crop
Dynamics
B16 Crop Product
Transportation (Off-Site)
B17 Crop Product
Processing and
Utilization
B15 Crop Product
Transportation (On-Site)
B14 Farm Operations
B5 Fertilizer
and Lime Production
Tillag

Tillage Systems Protocol February 2009
Protocol Flexibility Flexibility in applying the quantification protocol is provided to project developers in two ways.
1. This protocol applies to a single component of farm operations. As such, this protocol can be combined with other protocols where multiple projects are undertaken to reduce overall greenhouse gas emission from the farming operations in question; and
2. A project operator may define and justify site-specific Soil Organic Carbon (SOC) sequestration and nitrous oxide (N2O) coefficients adjusted for baseline considerations. These factors may be substituted for the generic emission factors indicated in this protocol document. The methodology must ensure reasonable accuracy and certainty, and be based on available principles-based guidance from Alberta Agriculture and Food. Further, these emission factors must be assessed to ensure that the project developer has properly accounted for any impact on emission factors, assumptions and assurance factor estimates stated in this protocol. These site-specific coefficients would need to be approved by Alberta Environment for use in the Alberta Offset System.
This quantification protocol is written for the farm operator or project developer. Some familiarity with, or general understanding of, the operation of farming practices is expected.
1.2 Glossary of New Terms Assurance Factor The assurance factor accounts for the risk and magnitude of
carbon sequestration reversal due to tilling events occurring in fields that would otherwise be under reduced and no-till practices. This factor accounts for the average number of tillage events anticipated over a 20 year period. Reversals are contemplated as linear, in keeping with the model for sequestration under reduced and no-till practises. The assurance factor accounts reversal events across the years that the field is credited for the sequestration from reduced and no-till practises. This prevents a liability accruing on the field in years where tillage events occur, as the fields would receive neither a credit nor reversal of a credit in years where the tillage events occurred.
No-Till and Reduced Till These terms are defined regionally as per TABLE 1.1,
below.
Page 5

Tillage Systems Protocol February 2009
Table 1.1 Definitions of tillage systems in the Parkland1 and Dry Prairie protocol areas. Tillage System Cropped Land Period 2 Fallow Period 3 No Till Up to two passes with low-disturbance openers (up
to 38%) 4, 5 or one pass with a slightly higher disturbance opener (up to 46%) to apply seed, fertilizer or manure 6, discretionary tillage of up to 10% 5 , no cultivation
No cultivations
Reduced Till Soil disturbance to apply seed, fertilizer, or manure exceeds no till definition and/or one cultivation in fall or spring
One to two cultivations
Full Till More than one cultivation between harvest and subsequent seeding if no fallow in that period, or, more than three cultivations between harvest to subsequent seeding if fallow
More than two cultivations
Notes: 1 The Peace River Lowland ecoregion is contained within the Parkland zone. 2 Cropped land period applies to the management cycle that terminates at harvest, (e.g. harvest to
harvest defines the cropped land period). This includes land preparation for seeding which may occur in the previous fall.
3 Fallow period extends from harvest for one full year to the next fall. 4 Percentage values associated with openers are based on maximum opener width (e.g. 5 inch
openers actually measure 5.5 inches) divided by the shank spacing of the implement. 5 Additional operations with harrows, packers, or similar non-soil disturbing implements are
accepted. Where a second low soil disturbance operation is performed it is normally for injection of fertilizer or manure.
6 Discretionary tillage of up to 10% means that up to 10% of the surface area of a single agricultural field may be cultivated to address specific management issues. These areas are determined on an annual basis, meaning that specific areas may change from year to year.
Page 6

Tillage Systems Protocol February 2009
Page 7
2.0 Quantification Development and Justification The following sections outline the quantification development and justification.
2.1 Identification of Sources and Sinks for the Project Sources and sinks (SS’s) were identified for the project by reviewing the seed protocol document and relevant process flow diagram. This process confirmed that the SS’s in the process flow diagrams covered the full scope of eligible project activities under the protocol. Based on the process flow diagrams provided in FIGURE 1.1, the project SS’s were organized into life cycle categories in FIGURE 2.1. Descriptions of each of the SS’s and their classification as controlled, related or affected are provided in TABLE 2.1.

Tillage Systems Protocol February 2009
FIGURE 2.1: Project Element Life Cycle Chart =
P21 Transportation of Equipment
P20 Building Equipment
Upstream SS’s Before Project
On Site SS’s During Project Downstream SS’s After Project
P4 Seed Use
P14 Farm Operations
P13 Soil and Crop
Dynamics
P11 Pesticide Distribution
(On-Site)
P3 Seed Distribution
(On-Site)
P8 Fertilizer and Lime Use
P6 Fertilizer and Lime
Distribution (Off-Site)
P5 Fertilizer and Lime
Production
P2 Seed Distribution (Off-Site)
P1 Seed Production
Upstream SS’s During Project
P9 Pesticide Production
P10 Pesticide Distribution (Off-Site)
P18 Fuel Extraction / Processing
P19 Fuel Delivery
P22 Testing of Equipment
P7 Fertilizer and Lime
Distribution (On-Site)
P12 Pesticide Use
P15 Crop Product
Transportation (On-Site)
P17 Crop Product
Processing
P16 Crop Product
Transportation (Off-Site)
Downstream SS’s During Project
Page 8

Tillage Systems Protocol February 2009
TABLE 2.1: Project SS’s
1. SS 2. Description 3. Controlled, Related or Affected
Upstream SS’s during Project Operation
P1 Seed Production Seed production may include several energy inputs such as natural gas, diesel and electricity. Quantities and types for each of the energy inputs would be contemplated to evaluate functional equivalence with the project condition.
Related
P2 Seed Transportation (Off-Site)
Seeds may be transported to the project site by truck, barge and/or train. The related energy inputs for fuelling this equipment are captured under this SS, for the purposes of calculating the resulting greenhouse gas emissions. Type of equipment, number of loads and distance travelled would be used to evaluate functional equivalence with the baseline condition.
Related
P5 Fertilizer and Lime Production
Fertilizer and lime production may include several material and energy inputs such as natural gas, diesel and electricity. Quantities and types for each of the energy inputs would be contemplated to evaluate functional equivalence with the project condition.
Related
P6 Fertilizer and Lime Distribution (Off-Site)
Fertilizer and lime may be transported to the project site by truck, barge and/or train. The related energy inputs for fuelling this equipment are captured under this SS, for the purposes of calculating the resulting greenhouse gas emissions. Type of equipment, number of loads and distance travelled would be used to evaluate functional equivalence with the baseline condition.
Related
P9 Pesticide Production Pesticide production may include several material and energy inputs such as natural gas, diesel and electricity. Quantities and types for each of the energy inputs would be contemplated to evaluate functional equivalence with the project condition.
Related
P10 Pesticide Distribution (Off-Site
Pesticide may be transported to the project site by truck, barge and/or train. The related energy inputs for fuelling this equipment are captured under this SS, for the purposes of calculating the resulting greenhouse gas emissions. Type of equipment, number of loads and distance travelled would be used to evaluate functional equivalence with the baseline condition.
Related
P18 Fuel Extraction and Processing
Each of the fuels used throughout the on-site component of the project will need to sourced and processed. This will allow for the calculation of the greenhouse gas emissions from the various processes involved in the production, refinement and storage of the fuels. The total volumes of fuel for each of the on-site SS’s are considered under this SS. Volumes and types of fuels are the important characteristics to be tracked.
Related
P19 Fuel Delivery
Each of the fuels used throughout the on-site component of the project will need to be transported to the site. This may include shipments by tanker or by pipeline, resulting in the emissions of greenhouse gases. It is reasonable to exclude fuel sourced by taking equipment to an existing commercial fuelling station as the fuel used to take the equipment to the site is captured under other SS’s and there is no other delivery.
Related
Page 9

Tillage Systems Protocol February 2009
Onsite SS’s during Project Operation
P3 Seed Distribution (On-Site)
Seed would need to be transported from storage to the field. The related energy inputs for fuelling this equipment are captured under this SS, for the purposes of calculating the resulting greenhouse gas emissions. Type of equipment, number of loads and distance travelled would be used to evaluate functional equivalence with the baseline condition.
Controlled
P4 Seed Use Emissions associated with the use of the seeds. Inputs of embedded energy and materials would need to be tracked to ensure equivalency with the baseline condition. Controlled
P7 Fertilizer and Lime Distribution (On-Site)
Fertilizer and lime would need to be transported from storage to the field. The related energy inputs for fuelling this equipment are captured under this SS, for the purposes of calculating the resulting greenhouse gas emissions. Type of equipment, number of loads and distance travelled would be used to evaluate functional equivalence with the baseline condition.
Controlled
P8 Fertilizer and Lime Use
Emissions associated with the use of the fertilizer and lime. Timing, composition, concentration and volume of fertilizer need to be tracked. Controlled
P11 Pesticide Distribution (On-Site)
Pesticide distribution would need to be transported from storage to the field. The related energy inputs for fuelling this equipment are captured under this SS, for the purposes of calculating the resulting greenhouse gas emissions. Type of equipment, number of loads and distance travelled would be used to evaluate functional equivalence with the baseline condition.
Controlled
P12 Pesticide Use Emissions associated with the use of the pesticide. Timing, composition, concentration and volume of fertilizer need to be tracked to ensure equivalency with the baseline condition. Controlled
P13 Soil Crop Dynamics Flows of materials and energy that comprise the cycling of soil and plant carbon and nitrogen, including deposition in plant tissue, decomposition of crop residues, stabilization in organic matter and emission as carbon dioxide and nitrous oxide.
Controlled
P14 Farm Operations Greenhouse gas emissions may occur that are associated with the operation and maintenance of the farm facility and related equipment. This may include running vehicles and facilities at the project site. Quantities and types for each of the energy inputs would be tracked.
Controlled
P15 Crop Product Transportation (On-Site)
Crops would need to be harvested and transported from the field to storage. The related energy inputs for fuelling this equipment are captured under this SS, for the purposes of calculating the resulting greenhouse gas emissions. Type of equipment, number of loads and distance travelled would be used to evaluate functional equivalence with the baseline condition.
Controlled
Downstream SS’s during Project Operation
P16 Crop Product Transportation (Off-Site)
Crops would need to be transported from storage to the market by truck, barge and/or train. The related energy inputs for fuelling this equipment are captured under this SS, for the purposes of calculating the resulting greenhouse gas emissions. Type of equipment, number of loads and distance travelled would be used to evaluate functional equivalence with the baseline condition.
Related
P17 Crop Product Processing
Inputs of materials and energy involved in the processing and end product utilization of the crop would need to be tracked to ensure functional equivalence with the baseline condition. Related
Page 10

e Systems Protocol February 2009
Page 11
Other
P20 Building Equipment
Equipment may need to be built either on-site or off-site. This includes all of the components of the storage, handling, processing, combustion, air quality control, system control and safety systems. These may be sourced as pre-made standard equipment or custom built to specification. Greenhouse gas emissions would be primarily attributed to the use of fossil fuels and electricity used to power equipment for the extraction of the raw materials, processing, fabricating and assembly.
Related
P21 Transportation of Equipment
Equipment built off-site and the materials to build equipment on-site, will all need to be delivered to the site. Transportation may be completed by train, truck, by some combination, or even by courier. Greenhouse gas emissions would be primarily attributed to the use of fossil fuels to power the equipment delivering the equipment to the site.
Related
P22 Testing of Equipment
Equipment may need to be tested to ensure that it is operational. This may result in running the equipment using test anaerobic digestion fuels or fossil fuels in order to ensure that the equipment runs properly. These activities will result in greenhouse gas emissions associated with the combustion of fossil fuels and the use of electricity.
Related
Tillag

Tillage Systems Protocol February 2009
Page 12
2.2 Identification of Baseline The baseline condition for projects applying this protocol is considered as a performance-based approach. The performance standards for no-till and reduced till farming are set relative to a 1990 baseline and would be subject to revision over time. The uptake of no-till and reduced till farming is considered within the coefficients implicit within the default methodology approach to assessing the relevant performance standard. The established baseline would be considered as static, where the coefficients remain constant, subject to periodic revision to reflect the evolving performance standard. The baseline condition is defined, including the relevant SS’s and processes, as shown in FIGURE 1.2. More detail on each of these SS’s is provided in Section 2.3 below.
2.3 Identification of SS’s for the Baseline Based on the process flow diagrams provided in FIGURE 1.2, the project SS’s were organized into life cycle categories in FIGURE 2.2. Descriptions of each of the SS’s and their classification as either ‘controlled’, ‘related’ or ‘affected’ is provided in TABLE 2.2.

Tillage Systems Protocol February 2009
FIGURE 2.2: Baseline Element Life Cycle Chart =
B20 Building Equipment
B3 Seed Distribution
(On-Site)
B8 Fertilizer and Lime Use
B6 Fertilizer and Lime
Distribution (Off-Site)
B5 Fertilizer and Lime
Production
B2 Seed Distribution (Off-Site)
B1 Seed Production
Upstream SS’s During Baseline
Downstream SS’s During Baseline
B4 Seed Use
B12 Pesticide Use
B11 Pesticide Distribution
(On-Site)
B15 Crop Product
Transportation (On-Site)
B17 Crop Product
Processing
B14 Farm Operations
B7 Fertilizer and Lime
Distribution (On-Site)
B22 Testing of Equipment
B21 Transportation of Equipment
B16 Crop Product
Transportation (Off-Site)
On Site SS’s During Baseline Upstream SS’s Before Baseline
Downstream SS’s After Baseline
B9 Pesticide Production
B10 Pesticide Distribution (Off-Site)
B18 Fuel Extraction / Processing
B19 Fuel Delivery
B13 Soil and Crop
Dynamics
Page 13

Tillage Systems Protocol February 2009
TABLE 2.2: Baseline SS’s
1. SS 2. Description 3. Controlled, Related or Affected
Upstream SS’s during Baseline Operation
B1 Seed Production Seed production may include several energy inputs such as natural gas, diesel and electricity. Quantities and types for each of the energy inputs would be contemplated to evaluate functional equivalence with the project condition.
Related
B2 Seed Transportation (Off-Site)
Seeds may be transported to the project site by truck, barge and/or train. The related energy inputs for fuelling this equipment are captured under this SS, for the purposes of calculating the resulting greenhouse gas emissions. Type of equipment, number of loads and distance travelled would be used to evaluate functional equivalence with the baseline condition.
Related
B5 Fertilizer and Lime Production
Fertilizer and lime production may include several material and energy inputs such as natural gas, diesel and electricity. Quantities and types for each of the energy inputs would be contemplated to evaluate functional equivalence with the project condition.
Related
B6 Fertilizer and Lime Distribution (Off-Site)
Fertilizer and lime may be transported to the project site by truck, barge and/or train. The related energy inputs for fuelling this equipment are captured under this SS, for the purposes of calculating the resulting greenhouse gas emissions. Type of equipment, number of loads and distance travelled would be used to evaluate functional equivalence with the baseline condition.
Related
B9 Pesticide Production Pesticide production may include several material and energy inputs such as natural gas, diesel and electricity. Quantities and types for each of the energy inputs would be contemplated to evaluate functional equivalence with the project condition.
Related
B10 Pesticide Distribution (Off-Site
Pesticide may be transported to the project site by truck, barge and/or train. The related energy inputs for fuelling this equipment are captured under this SS, for the purposes of calculating the resulting greenhouse gas emissions. Type of equipment, number of loads and distance travelled would be used to evaluate functional equivalence with the baseline condition.
Related
P18 Fuel Extraction and Processing
Each of the fuels used throughout the on-site component of the project will need to sourced and processed. This will allow for the calculation of the greenhouse gas emissions from the various processes involved in the production, refinement and storage of the fuels. The total volumes of fuel for each of the on-site SS’s are considered under this SS. Volumes and types of fuels are the important characteristics to be tracked.
Related
B19 Fuel Delivery
Each of the fuels used throughout the on-site component of the project will need to be transported to the site. This may include shipments by tanker or by pipeline, resulting in the emissions of greenhouse gases. It is reasonable to exclude fuel sourced by taking equipment to an existing commercial fuelling station as the fuel used to take the equipment to the site is captured under other SS’s and there is no other delivery.
Related
Page 14

Tillage Systems Protocol February 2009
Onsite SS’s during Baseline Operation
B3 Seed Distribution (On-Site)
Seed would need to be transported from storage to the field. The related energy inputs for fuelling this equipment are captured under this SS, for the purposes of calculating the resulting greenhouse gas emissions. Type of equipment, number of loads and distance travelled would be used to evaluate functional equivalence with the baseline condition.
Controlled
B4 Seed Use Emissions associated with the use of the seeds. Inputs of embedded energy and materials would need to be tracked to ensure equivalency with the baseline condition. Controlled
B7 Fertilizer and Lime Distribution (On-Site)
Fertilizer and lime would need to be transported from storage to the field. The related energy inputs for fuelling this equipment are captured under this SS, for the purposes of calculating the resulting greenhouse gas emissions. Type of equipment, number of loads and distance travelled would be used to evaluate functional equivalence with the baseline condition.
Controlled
B8 Fertilizer and Lime Use
Emissions associated with the use of the fertilizer and lime. Timing, composition, concentration and volume of fertilizer need to be tracked. Controlled
B11 Pesticide Distribution (On-Site)
Pesticide distribution would need to be transported from storage to the field. The related energy inputs for fuelling this equipment are captured under this SS, for the purposes of calculating the resulting greenhouse gas emissions. Type of equipment, number of loads and distance travelled would be used to evaluate functional equivalence with the baseline condition.
Controlled
B12 Pesticide Use Emissions associated with the use of the pesticide. Timing, composition, concentration and volume of fertilizer need to be tracked to ensure equivalency with the baseline condition. Controlled
B13 Soil Crop Dynamics Flows of materials and energy that comprise the cycling of soil and plant carbon and nitrogen, including deposition in plant tissue, decomposition of crop residues, stabilization in organic matter and emission as carbon dioxide and nitrous oxide.
Controlled
B14 Farm Operations Greenhouse gas emissions may occur that are associated with the operation and maintenance of the farm facility and related equipment. This may include running vehicles and facilities at the project site. Quantities and types for each of the energy inputs would be tracked.
Controlled
B15 Crop Product Transportation (On-Site)
Crops would need to be harvested and transported from the field to storage. The related energy inputs for fuelling this equipment are captured under this SS, for the purposes of calculating the resulting greenhouse gas emissions. Type of equipment, number of loads and distance travelled would be used to evaluate functional equivalence with the baseline condition.
Controlled
Downstream SS’s during Baseline Operation
B16 Crop Product Transportation (Off-Site)
Crops would need to be transported from storage to the market by truck, barge and/or train. The related energy inputs for fuelling this equipment are captured under this SS, for the purposes of calculating the resulting greenhouse gas emissions. Type of equipment, number of loads and distance travelled would be used to evaluate functional equivalence with the baseline condition.
Related
B17 Crop Product Processing
Inputs of materials and energy involved in the processing and end product utilization of the crop would need to be tracked to ensure functional equivalence with the baseline condition. Related
Page 15
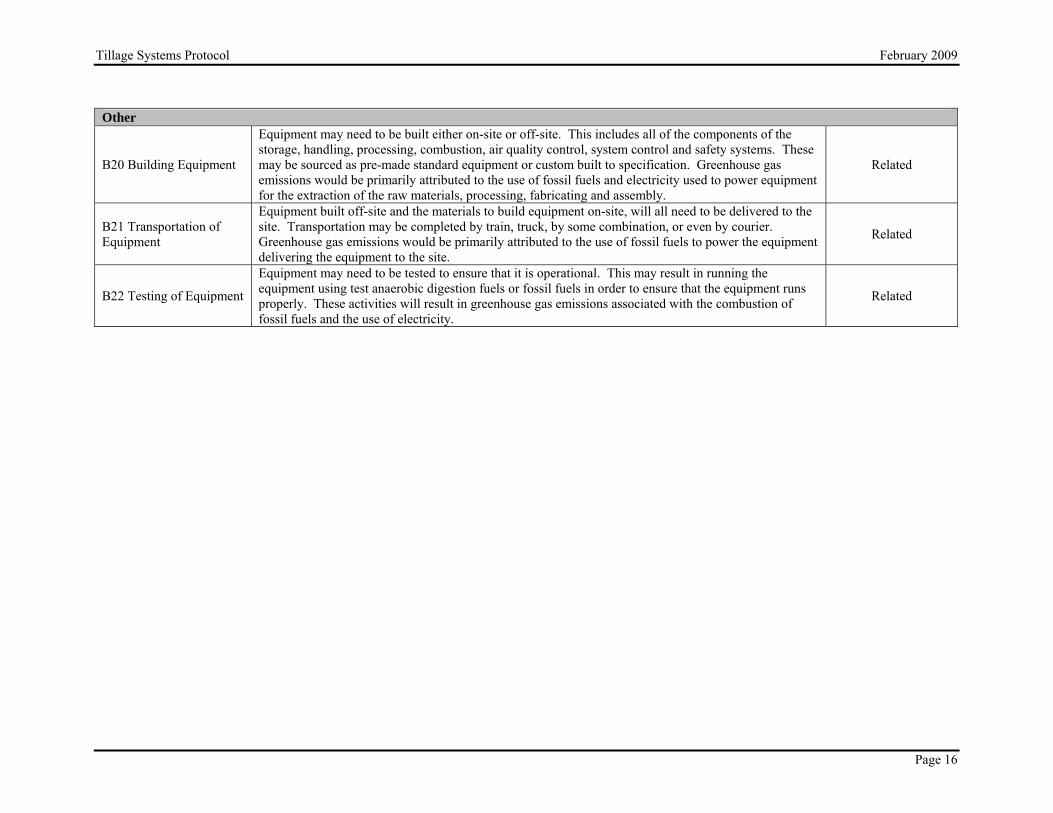
e Systems Protocol February 2009
Page 16
Other
B20 Building Equipment
Equipment may need to be built either on-site or off-site. This includes all of the components of the storage, handling, processing, combustion, air quality control, system control and safety systems. These may be sourced as pre-made standard equipment or custom built to specification. Greenhouse gas emissions would be primarily attributed to the use of fossil fuels and electricity used to power equipment for the extraction of the raw materials, processing, fabricating and assembly.
Related
B21 Transportation of Equipment
Equipment built off-site and the materials to build equipment on-site, will all need to be delivered to the site. Transportation may be completed by train, truck, by some combination, or even by courier. Greenhouse gas emissions would be primarily attributed to the use of fossil fuels to power the equipment delivering the equipment to the site.
Related
B22 Testing of Equipment
Equipment may need to be tested to ensure that it is operational. This may result in running the equipment using test anaerobic digestion fuels or fossil fuels in order to ensure that the equipment runs properly. These activities will result in greenhouse gas emissions associated with the combustion of fossil fuels and the use of electricity.
Related
Tillag

Tillage Systems Protocol February 2009
Page 17
2.4 Selection of Relevant Project and Baseline SS’s Each of the SS’s from the project and baseline condition were compared and evaluated as to there relevancy using the guidance provided in Annex VI of the “Guide to Quantification Methodologies and Protocols: Draft”, dated March 2006. The justification for the exclusion or conditions upon which SS’s may be excluded is provided below. All other SS’s listed previously are included. This information is summarized in TABLE 2.3, below

Tillage Systems Protocol February 2009
TABLE 2.3: Comparison of SS’s
1. Identified SS 2. Baseline (C, R, A)
3. Project (C, R, A)
4. Include or Exclude from Quantification
5. Justification for Exclusion
Upstream SS’s
P1 Seed Production N/A Related Exclude
B1 Seed Production Related N/A Exclude
Excluded as these SS’s are not relevant to the project as the emissions from these practises are covered under proposed greenhouse gas regulations. Further, the baseline and project conditions will be functionally equivalent.
P2 Seed Transportation (Off-Site) N/A Related Exclude
B2 Seed Transportation (Off-Site) Related N/A Exclude
Excluded as the emissions from transportation are negligible and likely functionally equivalent to the baseline scenario.
P5 Fertilizer and Lime Production N/A Related Exclude
B5 Fertilizer and Lime Production Related N/A Exclude
Excluded as these SS’s are not relevant to the project as the emissions from these practises are covered under proposed greenhouse gas regulations. Further, the baseline and project conditions will be functionally equivalent.
P6 Fertilizer and Lime Distribution (Off-Site) N/A Related Exclude
B6 Fertilizer and Lime Distribution (Off-Site) Related N/A Exclude
Excluded as the emissions from transportation are negligible and likely functionally equivalent to the baseline scenario.
P9 Pesticide Production N/A Related Include
B9 Pesticide Production Related N/A Include N/A
P10 Pesticide Distribution (Off-Site N/A Related Exclude
B10 Pesticide Distribution (Off-Site Related N/A Exclude
Excluded as the emissions from transportation are negligible and likely functionally equivalent to the baseline scenario.
P17 Fuel Extraction and Processing N/A Related Exclude
B17 Fuel Extraction and Processing Related N/A Exclude
Excluded as the emissions from the baseline are greater than the project condition so this is a conservative approach, allowing application of the default methodology with available factors.
P18 Fuel Delivery N/A Related Exclude
B18 Fuel Delivery Related N/A Exclude Excluded as these SS’s are not relevant to the project as the emissions from these practises are covered under proposed greenhouse gas regulations.
Page 18

Tillage Systems Protocol February 2009
Onsite SS’s P3 Seed Distribution (On-Site) N/A Controlled Include B3 Seed Distribution (On-Site) Controlled N/A Include
N/A
P4 Seed Use N/A Controlled Exclude B4 Seed Use Controlled N/A Exclude
Excluded as the emissions from seeding are negligible and likely functionally equivalent to the baseline scenario.
P7 Fertilizer and Lime Distribution (On-Site) N/A Controlled Include
B7 Fertilizer and Lime Distribution (On-Site) Controlled N/A Include
N/A
P8 Fertilizer and Lime Use N/A Controlled Exclude B8 Fertilizer and Lime Use Controlled N/A Exclude
Excluded as the emissions from seeding are likely functionally equivalent to the baseline scenario.
P11 Pesticide Distribution (On-Site) N/A Controlled Include
B11 Pesticide Distribution (On-Site) Controlled N/A Include
N/A
P12 Pesticide Use N/A Controlled Exclude B12 Pesticide Use Controlled N/A Exclude
Excluded as the emissions from pesticide use are likely functionally equivalent to the baseline scenario.
P13 Soil Crop Dynamics N/A Controlled Include B13 Soil Crop Dynamics Controlled N/A Include
N/A
P14 Farm Operations N/A Controlled Exclude B14 Farm Operations Controlled N/A Exclude
Excluded as the farm operations are likely functionally equivalent to the baseline scenario.
P15 Crop Product Transportation (On-Site) N/A Controlled Exclude
B15 Crop Product Transportation (On-Site) Controlled N/A Exclude
Excluded as the emissions from crop harvesting and transportation are likely functionally equivalent to the baseline scenario.
Downstream SS’s P16 Crop Product Transportation (Off-Site) N/A Related Exclude
B16 Crop Product Transportation (Off-Site) Related N/A Exclude
Excluded as the emissions from transportation are negligible and likely functionally equivalent to the baseline scenario.
P17 Crop Product Processing N/A Related Exclude B17 Crop Product Processing Related N/A Exclude
Excluded as the emissions from crop product processing are functionally equivalent to the baseline scenario.
Other
P20 Building Equipment N/A Related Exclude Emissions from building equipment are not material given the long project life, and the minimal building equipment typically required.
Page 19

e Systems Protocol February 2009
Page 20
B20 Building Equipment Related N/A Exclude Emissions from building equipment are not material for the baseline condition given the minimal building equipment typically required.
P21 Transportation of Equipment N/A Related Exclude Emissions from transportation of equipment are not material given the long
project life, and the minimal transportation of equipment typically required.
B21 Transportation of Equipment Related N/A Exclude
Emissions from transportation of equipment are not material for the baseline condition given the minimal transportation of equipment typically required.
P22 Testing of Equipment N/A Related Exclude Emissions from testing of equipment are not material given the long project life, and the minimal testing of equipment typically required.
B22 Testing of Equipment Related N/A Exclude Emissions from testing of equipment are not material for the baseline condition given the minimal testing of equipment typically required.
Tillag

Tillage Systems Protocol February 2009
Page 21
2.5 Quantification of Reductions, Removals and Reversals of Relevant SS’s
2.5.1 Quantification Approaches Quantification of the reductions, removals and reversals of relevant SS’s for each of the greenhouse gases will be completed using the methodologies outlined in TABLE 2.4, below. A listing of relevant emission factors is provided in Appendix A. These calculation methodologies serve to complete the following three equations for calculating the emission reductions from the comparison of the baseline and project conditions.
Where:
Emissions Baseline = sum of the emissions under the baseline condition.
Emissions Energy Use = component of emissions under SS’s B9 Pesticide Production, B3 Seed Distribution (On-Site), B7 Fertilizer and Lime Distribution (On-Site), B11 Pesticide Distribution (On-Site)
Emissions Carbon Sequestration = component of emissions under SS B13 Soil and Crop Dynamics
Assurance Factor = Factor to account for reversals due to tillage events. Relevant assurance factors are provided in
Appendix B. Emissions Nitrogen = component of emissions under SS B13 Soil and Crop
Dynamics
Emissions Project = sum of the emissions under the project condition.
Emissions Project = 0
Emissions Baseline = Emissions Energy Use + Emissions Carbon Sequestration * Assurance Factor + Emissions Nitrogen
Emission Reduction = Emissions Baseline – Emissions Project

Tillage Systems Protocol February 2009
TABLE 2.4: Quantification Procedures 1.0 Project/ Baseline SS
2. Parameter / Variable
3. Unit 4. Measured / Estimated
5. Method 6. Frequency 7. Justify measurement or estimation and frequency
Project SS’s
P9 Pesticide Production
P3 Seed Distribution (On-Site)
P7 Fertilizer and Lime Distribution (On-Site)
P11 Pesticide Distribution (On-Site)
P13 Soil and Crop Dynamics
Captured in Baseline Adjusted Factors
Baseline SS’s Emissions Energy Use = ∑Area Till Practice y * EFEnergy Use B9 Pesticide
Production Emission Reductions from Carbon Sequestration / Emissions Energy Use
kg CO2E / yr N/A N/A N/A Quantity being calculated. B3 Seed Distribution (On-Site) Area of Field under
Each Till Practice / Area Till Practice Y
ha Measured
Continuous
B7 Fertilizer and Lime Distribution (On-Site)
B11 Pesticide Distribution (On-Site)
Reduction Factor For Relevant Till Practice in Relevant Area and Geographic Zone / EF Energy Use
kg CO2E / ha / yr Estimated
Default factor based on project farm location, as available at January 1 of the first year of the project. Transition zones should be characterized based on the dominant soil zone.
Annually As per NCGAVS process.
Page 22

e Systems Protocol February 2009
Page 23
Emissions Carbon Sequestration = ∑Area Till Practice y * EF 20 yr Linear SOC Coefficient
Emission Reductions from Carbon Sequestration / Emissions Carbon
Sequestration
kg CO2E / yr N/A N/A N/A Quantity being calculated.
Area of Field under Each Till Practice / Area Till Practice Y
ha Measured Continuous
Sequestration Factor For Relevant Till Practice in Relevant Area and Geographic Zone / EF 10 yr Linear
SOC Coefficient
kg CO2E / ha / yr Estimated
Default factor based on project farm location, as available at January 1 of the first year of the project. Transition zones should be characterized based on the dominant soil zone.
Annually As per NCGAVS process.
Emissions Nitrogen = ∑Area Till Practice y * EF N2O Coefficient Emission Reductions from Nitrogen Oxide Reduction / Emissions Nitrogen
kg CO2E / yr N/A N/A N/A Quantity being calculated.
Area of Field under Each Till Practice / Area Till Practice Y
ha Measured Continuous
B13 Soil and Crop Dynamics
Reduction Factor For Relevant Till Practice in Relevant Area and Geographic Zone / EF N2O Coefficient
kg CO2E / ha / yr Estimated
Default factor based on project farm location, as available at January 1 of the first year of the project. Transition zones should be characterized based on the dominant soil zone.
Annually As per NCGAVS process.
Tillag

Tillage Systems Protocol February 2009
2.5.2. Contingent Data Approaches Contingent means for calculating or estimating the required data for the equations outlined in Section 2.5.1 are summarized in TABLE 2.5, below.
2.6 Management of Data Quality In general, data quality management must include sufficient data capture such that the mass and energy balances may be easily performed with the need for minimal assumptions and use of contingency procedures. The data should be of sufficient quality to fulfill the quantification requirements and be substantiated by company records for the purpose of verification. The project proponent shall establish and apply quality management procedures to manage data and information. Written procedures should be established for each measurement task outlining responsibility, timing and record location requirements. The greater the rigour the management system for the data, the more easily the audit will be for the project.
2.6.1 Record Keeping Record keeping practises should include:
a. Electronically record values of logged primary parameters for each measurement interval.
b. Print monthly back-up hard copies of all logged data. c. Keep written logs of operations and maintenance of the project system
including notation of all shut-downs, start-ups and process adjustments. d. Retain copies of logs and all logged data for a period of 7 years. e. Keep all records available for review by a verification body.
2.6.1 Quality Assurance/Quality Control (QA/QC) QA/QC can also be applied to add confidence that all measurements and calculations have been made correctly. These include, but are not limited to:
a Protecting monitoring equipment (sealed meters and data loggers). b Protecting records of monitored data (hard copy and electronic storage). c Checking data integrity on a regular and periodic basis (manual assessment,
comparing redundant metered data, and detection of outstanding data/records).
d Comparing current estimates with previous estimates as a ‘reality check’. e Provide sufficient training to operators to perform maintenance and
calibration of monitoring devices.
Page 24

Tillage Systems Protocol February 2009
Page 25
f Establish minimum experience and requirements for operators in charge of project and monitoring.
g Performing recalculations to make sure no mathematical errors have been made.

e Systems Protocol February 2009
Page 26
TABLE 2.5: Contingent Data Collection Procedures 1.0 Project / Baseline SS
2. Parameter / Variable
3. Unit 4. Measured /
Estimated 5. Contingency Method
6. Frequency 7. Justify measurement or estimation and frequency
Baseline SS’s B9 Pesticide Production B17 Fuel Extraction and Processing B3 Seed Distribution (On-Site) B7 Fertilizer and Lime Distribution (On-Site) B11 Pesticide Distribution (On-Site)
Area of Field under Each Till Practice / Area Till Practice Y
ha
Tillag

Tillage Systems Protocol February 2009
APPENDIX A: Relevant Emission Factors
Page 27

Tillage Systems Protocol February 2009
Determination of Baseline Adjusted Emission Factors The analysis described below is described in more detail in the original work completed under the Soil Management Technical Working Group (SMTWG). Dennis Haak from Agriculture and Agri-Food Canada was the lead author. Table A1: Designation of Protocol Areas within Canada’s Ecostratification Framework
Protocol Area
In Canada Ecozone Ecoregions Ecodistricts
1 East Atlantic Canada, Boreal Shield (Newfoundland)
106-109, 112-116, 117-131
453-456, 458, 460-464, 466-468, 470-472, 475-539
2 East Central
St. Lawrence Lowlands, Manitoulin– Lake Simcoe-Frontenac, Lake Erie Lowland, Boreal Shield (eastern Ontario, Québec)
132-135 400, 401, 407-415, 418, 419, 422-426, 434, 438, 440, 441, 540-572
3 Parkland Black Soil Zone, Boreal Plains, Lake Manitoba Plain, Boreal Shield (AB, SK, MB, and NW Ont), Montane Cordillera (AB)
136-156, 161-164
358, 371, 375-377, 379-381, 383, 386, 391, 573-766, 839-855, 998, 1016-1019
4 Dry Prairie
Dark Brown Soil Zone, Brown Soil Zone
157-160 767-838
5 West Pacific Maritime, Montane Cordillera (BC)
184-214 940, 943, 944, 948, 950, 951, 955-960, 971-982, 984
Page 28

Tillage Systems Protocol February 2009
Figure A1. The boundary between Dry Praire and Parkland is the Black-Dark Brown soil zone boundary. The east-central and east is the boundary is that between the Atlantic Maritime and Mixed Wood Plains ecozones. From McConkey 2006.
Table A2: 2001 Census data land area in No Till (NT), Reduced Till (RT), and Full Till (FT) in percent of total seeded plus summerfallowed land area.
NT (%)
RT (%)
FT (%)
East 4.80 19.10 76.10 East-Central 20.72 20.81 58.46 Parkland 23.66 33.90 42.44 Dry Prairie 36.25 29.66 34.09 West 15.06 17.39 67.56
Page 29

Tillage Systems Protocol February 2009
Table A3: Summary of raw coefficients associated with tillage change between No Till (NT), Reduced Till (RT) and Full Till (FT) management, (adapted from Haak, 2006.)
Region Tillage Change 10 year CO2e (t CO2E / ha / yr)
N2O (t CO2E / ha / yr)
Energy (t CO2E / ha / yr)
FT to NT 0.25 0.1649 FT to RT 0.20 0.1186 RT to NT 0.08 0.0463 NT to FT -0.25 -0.1649 RT to FT -0.20 -0.1186
East
NT to RT -0.08 -0.0463 FT to NT 0.41 0.1649 FT to RT 0.16 0.1186 RT to NT 0.26 0.0463 NT to FT -0.41 -0.1649 RT to FT -0.16 -0.1186
East Central
NT to RT -0.26 -0.0463 FT to NT 0.59 0.045 0.1091 FT to RT 0.22 0.045 0.0239 RT to NT 0.31 0.000 0.0852 NT to FT -0.59 -0.045 -0.1091 RT to FT -0.22 -0.045 -0.0239
Parkland
NT to RT -0.31 0.000 -0.0852 FT to NT 0.41 0.014 0.0589 FT to RT 0.15 0.014 0.0250 RT to NT 0.19 0.000 0.0339 NT to FT -0.41 -0.014 -0.0589 RT to FT -0.15 -0.014 -0.0250
Dry Prairie
NT to RT -0.19 0.000 -0.0339 FT to NT 0.20 0.1091 FT to RT 0.03 0.0239 RT to NT 0.16 0.0852 NT to FT -0.20 -0.1091 RT to FT -0.03 -0.0239
West
NT to RT -0.16 -0.0852 The following equations are used to adjust the above raw coefficients for tillage change with 2001 Census adoption rates (Table A2) for relevant regions: Net NT coefficient = Raw Coeff(FT to NT)*(%Area in FT)/100%
+ Raw Coeff(RT to NT)*(%Area in RT)/100%] Net RT coefficient = [Raw Coeff(FT to RT)*(%Area in FT)/100%
+ Raw Coeff(NT to RT)*(%Area in NT)/100%]
Page 30

Tillage Systems Protocol February 2009
Table A4: Baseline adjusted emission factors for 2002 through 2012 (inclusive) for No Till (NT) and Reduced Till (RT) management.
Baseline Adjusted Emission Factors
Region Practise Sequestration of Carbon in Soil
(t CO2E / ha / yr)
Nitrous Oxide Reduction
(t CO2E / ha /yr )
Energy
(t CO2E / ha / yr)
NT 0.21 0.134 East
RT 0.15 0.088 NT 0.29 0.106
East Central RT 0.04 0.060 NT 0.36 0.019 0.075
Parkland RT 0.02 0.019 -0.010 NT 0.20 0.005 0.030
Dry Prairie RT -0.02 0.005 -0.004 NT 0.17 0.089
West RT 0.00 0.003
Note: These values will remain constant for the 2002 to 2012 crediting period, as indicated by a verification for any of these years. On a go-forward basis, per revised version being published, additional acres and years, these emission factors are to be used for quantification.
Page 31

Tillage Systems Protocol February 2009
APPENDIX B: Relevant Assurance Factors
Page 32

Tillage Systems Protocol February 2009
Development of Assurance Factors
The assurance factor accounts for the average risk of reversal across all farms within a given region. Prairie-based technical experts (6 contributing sources) were consulted to assess both the range of values and to explore the relationships across regions and across practises. Their mandate was to conservatively estimate the number of tillage reversal events for each of the regions and practise types. As such, there is an intended bias within the assurance factors as a means of managing the liability to the provincial government for reversals. Given the outcome, however, it was found that the range of values represents a reasonable balance of conservativeness and reasonableness, for the prairie region. For the East, West and East-Central soil zones, further expert consultation will need to occur. Further scientific analysis may serve to adjust the assurance factor over time as better data becomes available. This adjustment, coupled with improved practise and technological innovation would be anticipated to push the assurance factor higher over time. Based on the feedback from the contributing technical experts, the range of data for the number of reversals anticipated over a 20 year tillage period is provided. Where the range was slim, a simplified analysis was facilitated. Where the range was broader, a review of the ranges was completed to assess whether outliers were robust. Based on this analysis, a chosen average number of reversals were selected. As the sequestration of carbon over time is linearized, reversals are assumed to be equivalent in magnitude. As such, the assurance factor could then be estimated using the following formula:
Assurance Factor = (1 - (# of Reversal Events / 20 year period)) * 100%
Table B1: Assurance factors by region and practise type*
Region Factor Reduced Till No Till
Assurance Factor 85.0% 80.0% Chosen Number of Reversals 3 4 East
Range of Values Range: 2-4 Range: 1-6 Assurance Factor 87.5% 85.0%
Chosen Number of Reversals 2.5 3 East-Central
Range of Values Range: 2-3 Range: 1-5 Assurance Factor 87.5% 87.5%
Chosen Number of Reversals 2.5 2.5 Parkland
Range of Values Range: 2-3 Range: 1-4 Assurance Factor 90.0% 92.5%
Chosen Number of Reversals 2 1.5 Dry Prairie
Range of Values 0 - 3 1 - 2 Assurance Factor 87.5% 92.5%
Chosen Number of Reversals 2.5 1.5 West
Range of Values 2 - 3 1 - 2 Note – assurance factors for the West, East and East-Central require more expert review.
Page 33

Tillage Systems Protocol February 2009
APPENDIX C: Deriving Total Coefficients for a Region
Page 34

Tillage Systems Protocol February 2009
Calculating Total Coefficients for a Region, using Tables A2 - A4, and B1. Example Calculation for Deriving the Total Coefficient for a No Till in the Parkland Region Step 1. Take the numbers in Table A2 and A3 and the Net Coefficient Equations indicated at the base of Table A3, to produce the Net Coefficients/Baseline Adjusted numbers as calculated for Table A4. SOC Net NT Coefficient = [Raw Coeff(FT to NT)*(%Area in FT)/100%+ Raw Coeff(RT
to NT)*(%Area in RT)/100%] = [(0.59*42.44/100) + (0.31*33.90/100)] (Table A3 and A2) = 0.25 + 0.10 = 0.36 tonnes of C02e/ha (Table A4 result)
N20 Net NT Coeff. = [Raw Coeff(FT to NT)*(%Area in FT)/100%+ Raw Coeff(RT to NT)*(%Area in RT)/100%] = [(0.045*42.44/100) + (0.000*33.90/100)] = 0.019 + 0.000 = 0.019 tonnes of C02e/ha (Table A4 result)
Energy Net NT Coeff = [Raw Coeff(FT to NT)*(%Area in FT)/100%+ Raw Coeff(RT to NT)*(%Area in RT)/100%] = [(0.1091*42.44/100) + (0.0852*33.09/100)] = 0.046 + 0.029 = 0.075 tonnes of CO2e/ha (Table A4 result)
Step 2. Apply the Assurance Factor to SOC only and add N20 and Energy Coefficients to derive the Total Coefficient Total Coefficient = (Net SOC Coefficient * Assurance factor) + (Net N20 Coefficient) +
(Net Energy Coefficient) = (0.36*0.875) + (0.019) + (0.075) = 0.41 tonnes of CO2e/ha for Parkland Region under No Till.
Page 35

Tillage Systems Protocol February 2009
APPENDIX D: References
Page 36

Tillage Systems Protocol February 2009
This protocol is largely based on the historical document called Tillage System Default Coefficient Technical Background Document (TBD) dated October 2006. The TBD work was completed by the Soil Management Technical Working Group, listed within the document. Dennis Haak, Sr. Soil Resource Specialist, Agriculture and Agri-Food Canada was the principal author of the work. This work represents the culmination of a number of multi-stakeholder consultation processes and reliance on a number of guidance documents. This document represents an abridged and re-formatted version of this work. Therefore, TBD remains the source of additional detail on any of the technical elements of the protocol. While not a complete listing of references, Tables A1, A2, A3 are adapted from the following sources: McConkey, B.G. 2006. Carbon Change Estimation Method Used for Agricultural
Practice Changes in Canadian Greenhouse-Gas Inventory. National Carbon and Greenhouse Gas Accounting and Verification System (NCGAVS) Report.
Nagy, C.N. 1999. Energy Coefficients for Agriculture Inputs in Western Canada.
Canadian Agricultural Energy End-Use Data Analysis Centre (CAEEDAC) Report. Rochette, P. and D. Worth. 2005. Inventory of N2O Emission from Canadian
Agricultural Soils at the EcoDistrict Scale Using an IPCC Tier II Methodology. National Carbon and Greenhouse Gas Accounting and Verification System (NCGAVS) Report.
Page 37

Carbon Credit Solutions Inc. 2011
Offset Project Plan for Carbon Credit Solutions Inc. Tillage Project #7 Page 29
Appendix B Additional Guidance for Interpretation of the Quantification Protocol for Tillage System Management for Carbon Offsets in Alberta Version 1 February 2008

Tillage Systems Protocol Guidance
SPECIFIED GAS EMITTERS REGULATION
AADDDDIITTIIOONNAALL GGUUIIDDAANNCCEE FFOORR
IINNTTEERRPPRREETTAATTIIOONN OOFF TTHHEE QQUUAANNTTIIFFIICCAATTIIOONN PPRROOTTOOCCOOLL FFOORR TTIILLLLAAGGEE SSYYSSTTEEMM MMAANNAAGGEEMMEENNTT
FFOORR CCAARRBBOONN OOFFFFSSEETTSS IINN AALLBBEERRTTAA
FEBRUARY 2008
Version 1

Tillage Systems Protocol Guidance
Page i
Disclaimer: The information provided in this document is intended as guidance only and is subject to revisions as learnings and new information comes forward as part of a commitment to continuous improvement. This document is not a substitute for the law. Please consult the Specified Gas Emitters Regulation and the legislation for all purposes of interpreting and applying the law. In the event that there is a difference between this document and the Specified Gas Emitters Regulation or legislation, the Specified Gas Emitters Regulation or the legislation prevail. Any comments, questions, or suggestions regarding the content of this document may be directed to:
Environmental Assurance Alberta Environment 10th Floor, Oxbridge Place 9820 - 106th Street Edmonton, Alberta, T5K 2J6 E-mail: [email protected]
ISBN: 978-0-7785-7338-8 (Printed) ISBN: 978-0-7785-7339-5 (On-line)
Copyright in this publication, regardless of format, belongs to Her Majesty the Queen in right of the Province of Alberta. Reproduction of this publication, in whole or in part, regardless of purpose, requires the prior written permission of Alberta Environment. © Her Majesty the Queen in right of the Province of Alberta, 2008

Tillage Systems Protocol Guidance
Page ii
Table of Contents
1.0 Introduction and Background ................................................................................ 1 2.0 Identification of Protocol Areas ............................................................................. 2 3.0 Definitions of Tillage Activity ................................................................................. 3 4.0 Guidance on Specific Management Scenarios..................................................... 4 5.0 References............................................................................................................... 6
List of Figures FIGURE 1.1 Protocol Areas for Carbon Change Coefficients in Alberta 2
List of Tables TABLE 1.1 Definitions of Tillage Systems in the Parkland1 and Dry Prairie Protocol Areas 3

Tillage Systems Protocol Guidance
Page 1
1.0 Introduction and Background This document is for project developers who are using the Alberta Tillage System Management protocol to develop projects for greenhouse gas (GHG) emission removal. It provides further guidance on how to interpret complex management scenarios encountered in reduced tillage systems in Alberta. The Alberta Tillage System Management protocol quantifies rates of soil carbon sequestration resulting from agricultural projects where there is a practice change from reduced tillage management relative to a baseline condition of full tillage. The protocol was developed around quantification methods that were designed to achieve acceptable levels of assurance, as prescribed by the Alberta Offset System for Greenhouse Gases (Alberta Environment, 2007). The science-based quantification methods developed by Agriculture and Agri-Food Canada (AAFC) to meet Canada’s GHG reporting requirement under the UNFCCC were used to identify coefficients to calculate annual rates of carbon sequestration with tillage management changes from full tillage (FT) to either reduced tillage (RT) or no tillage (NT), based on measured changes in levels of soil organic carbon (McConkey et al. 2006). Reductions in nitrous oxide emissions from soils as a result of changes in tillage management (Rochette et al. 2006) were also included. The protocol also includes GHG emission reductions associated with changes in energy use as a result of changes in tillage management that derived from the GHG Model Farm (Helgason et al. 2005). The results of measurements and simulation modelling were averaged across larger reporting zones to accommodate differences in site and management conditions, as it was assumed that the average represents the best regional value for use in greenhouse gas reporting and quantification. The resulting coefficients were adopted as the default values in the Alberta Tillage System Management protocol. The activity definitions for NT, RT and FT that were used to develop the default coefficients were based on consultations with tillage and annual crop system experts across Canada to identify and resolve management scenarios and issues related to tillage systems. The results of a number of pilot projects and monitoring programs were used, including tillage surveys conducted by the Prairie Farm Rehabilitation Administration (PFRA) Branch of Agriculture and Agri-Food Canada and the Pilot Emissions Reductions, Removals, and Learnings (Environment Canada 2004) initiative, as outlined by the Soil Management Technical Working Group (SMTWG, Haak et al. 2006). Further clarifications and adaptations of the activity definitions were needed to address conditions specific to Alberta. Experts on tillage and management practices in Alberta consulted with members of the SMTWG, as well as AAFC developers of the default coefficients, to arrive at the criteria listed in this guidance document.

Tillage Systems Protocol Guidance
Page 2
2.0 Identification of Protocol Areas The scientific community widely recognizes the Parkland and Dry Prairie regions of Alberta as being distinct ecoregions for a wide variety of agricultural interpretations (e.g. cropping systems, yield). Since the GHG removal coefficients were similar within, but differed between these regional areas, the regions were used to determine the appropriate protocol areas for use in the Tillage System Management protocol. The boundary between the protocol areas is based on the following criteria:
1) Soil zone: The Black–Dark Brown soil zone boundary is an important demarcation of soil organic matter levels and thus potentials to sequester or emit carbon, based upon management.
2) Moisture regime: The boundary coincides with the –300 Climatic Moisture Index (precipitation minus evapotranspiration).
3) Historical precedence: Crop and fertilizer recommendations, research analysis and coefficients have historically been separated by soil zone boundaries.
The precise location of this boundary has been identified using Alberta’s digital soils database (AGRASID, Brierly et al. 2001) and is illustrated in Fig. 1. For the purposes of this protocol, the boundary is considered to be the fence-line on the Dry Prairie side of the quarter sections that represent the boundary. The quarter sections of the boundary are considered to be in the Parkland and the adjacent quarters toward the drier part of the province (usually south or east) are considered in the Dry Prairie zone. Figure 1. Protocol areas for carbon change coefficients in Alberta. The boundary between Dry Praire and Parkland protocol areas is the Black-Dark Brown soil zone boundary. The Peace River Lowland ecoregion is considered to be part of the Parkland protocol area (not shown.)

Tillage Systems Protocol Guidance
Page 3
3.0 Definitions of Tillage Activity A fundamental variable in any tillage system impact upon soil organic carbon is the degree of soil disturbance that occurs. Since the intent of this protocol is to sequester carbon in the soil, management needs to be adjusted to accommodate the identified level of soil disturbance in order to qualify. The tillage activity definitions outlined in Table 1 are designed to be clearly understood, and feasible for producer implementation, proponent monitoring, and third party verification. Table 1: Definitions of tillage systems in the Parkland1 and Dry Prairie protocol areas.
Tillage System Cropped Land Period 2 Fallow Period 3 No Till Up to two passes with low-disturbance openers (up
to 38%) 4, 5 or one pass with a slightly higher disturbance opener (up to 46%) to apply seed, fertilizer or manure 6, discretionary tillage of up to 10% 5 , no cultivation
No cultivations
Reduced Till Soil disturbance to apply seed, fertilizer, or manure exceeds no till definition and/or one cultivation in fall or spring
One to two cultivations
Full Till More than one cultivation between harvest and subsequent seeding if no fallow in that period, or, more than three cultivations between harvest to subsequent seeding if fallow
More than two cultivations
Notes: 1 The Peace River Lowland ecoregion is contained within the Parkland zone. 2Cropped land period applies to the management cycle that terminates at harvest, (e.g. harvest to harvest is the
cropped land period). This includes land preparation for seeding which may occur in the previous fall. 3 Fallow period extends from harvest for one full year to the next fall. 4 Percentage values associated with openers are based on maximum opener width (e.g. 5 inch openers actually
measure 5.5 inches) divided by the shank spacing of the implement. 5 Additional operations with harrows, packers, or similar non-soil disturbing implements are accepted. Where a
second low soil disturbance operation is performed it is normally for injection of fertilizer or manure. 6 Discretionary tillage of up to 10% means that up to 10% of the surface area of a single agricultural field may be
cultivated to address specific management issues. These areas are determined on an annual basis, meaning that specific areas may change from year to year.

Tillage Systems Protocol Guidance
Page 4
4.0 Guidance on Specific Management Scenarios Since annual cropping systems are complex, additional guidance is provided for the variety of management scenarios that occur in Alberta. It is important to remember that the objective is to determine the appropriate tillage system: NT, RT, or FT.
1) The timing of nitrogen fertilizer is not quantified in this protocol. Applying fertilizer in the fall may qualify for NT if both the fertilization and subsequent seeding operation both involved low disturbance openers, e.g. meets the first part of the definition in (Table 1).
2) Fall seeding also qualifies for NT if it meets the disturbance criteria. However, these criteria apply to a much narrower period of time between harvest and the subsequent seeding shortly thereafter.
3) Most sweeps would not qualify as NT, because there is normally greater than 46% disturbance.
4) Tillage definitions apply to the normal harvest year for the crop. This would apply to fall seeded crops or situations when weather delays harvest to the following spring.
5) Carbon accumulation is deemed to be on a calendar year basis for the year in which the crop is harvested or the land is fallowed, even though tillage definitions relate to the cropped land period.
6) The carbon sequestration potential of perennial crops is not quantified within this protocol. Tillage practices associated with seeding perennials into annual crop stubble in the spring or fall will qualify if disturbance is within the constraints of the tillage definitions (Table 1). Tillage definitions also apply when perennials are rotated back into annual crops. If the perennial crop is terminated and immediately seeded to an annual crop in fall or spring, apply the coefficient for the current year. If the perennial crop is terminated in the spring, fallowed and then seeded in the fall or the next spring, apply coefficients for two years – the first as a fallow year and the second as a seeding year. If the perennial crop is terminated between June 15 and August 1 and the next crop is seeded the following spring, apply coefficients for 1.5 years – the first as a partial fallow year with the coefficient reduced by one half, and the second year as a seeding year.
7) Since some research supports the fact that irrigation will increase soil organic carbon levels in drier regions (Liebig et al. 2005), the Parkland protocol area coefficient will be used for irrigated land within the Dry Prairie protocol area. To use the Parkland coefficients in lands under irrigation in the Dry Prairie region, project developers should only apply the Parkland soil organic carbon (SOC) and N20 coefficients, and not the energy coefficients. The rationale is that irrigated soils within the Dry Prairie region will have a higher metabolism because of the extra additions of carbon (higher yields thus more biomass) and nitrogen inputs (fertilizer + biomass) approaching those of the Parkland region. As for the assurance factor, it is appropriate to apply the Dry Prairie assurance factor in the irrigated Dry Prairie, to the Parkland SOC coefficient in this circumstance. The Energy coefficient applied under irrigated Dry Prairie remains the same as the Dry Prairie – project developers should not apply the Parkland energy coefficient, since energy coefficients are derived independent of C and N methodologies. The use of irrigation within the Parkland protocol area will not affect the coefficient since there are no data to support increased soil organic carbon due to irrigation within this region.

Tillage Systems Protocol Guidance
Page 5
8) If a crop must be reseeded, or if a cover or green manure crop is seeded, the NT coefficient applies if one additional low-disturbance operation meets the definition of NT. If tillage is used to incorporate a cover crop or green manure, the definitions provided in Table 1 must be applied and may result in a RT or FT designation.
9) The addition of soil carbon through the application of manure is not quantified within this protocol. Although manure applications are permitted, they must adhere to the definitions of soil disturbance that are outlined in Table 1 in order to qualify as NT or RT.
10) The occurrence of inter-row tillage to control weeds during the growing season in annual row crops such as corn results in a FT tillage practice.

Tillage Systems Protocol Guidance
Page 6
5.0 References Alberta Environment. 2007. Alberta Offset System for Greenhouse Gases (Available at:
http://environment.alberta.ca/documents/Guidance_Document_Alberta_Offsets.pdf. Accessed Jan. 23, 2008).
Brierly, J. A., T.C. Martin and D.J. Spiess. 2001. Agricultural Region of Alberta Soil Inventory Database (AGRASID 3.0). Soil Landscape User’s Manual. Available at: http://www1.agric.gov.ab.ca/$department/deptdocs.nsf/all/sag6903. Accessed Jan. 23, 2008).
Environment Canada. 2004. Pilot Emissions Reductions, Removals, and Learnings Initiative (PERRL): Proponents Application Manual Version 4.0.
Environment Canada, 2005. Offset System for Greenhouse Gases, Technical Background Document.
Haak, D., with Soil Management Technical Working Group for Canada’s GHG Offset System. 2006. Tillage System Default Coefficient Protocol based on Canada’s Offset System for Greenhouse Gases Technical Background Document (DRAFT).
Helgason, B.L.; Smith, E. 2005. GHGFarm: An assessment tool for estimating net greenhouse gas emissions from Canadian farms, Agriculture and Agri-Food Canada.
ISO 14064-3, 2006. Greenhouse gases -- Part 3: Specification with guidance for the validation and verification of greenhouse gas assertions. Available at: http://www.iso.org/iso/iso_catalogue/catalogue_tc/catalogue_detail.htm?csnumber=38700. Accessed Jan. 23, 2008).
McConkey, B.G., Brierley A., Martin, T., Vandenbygaart, A., Angers, D., Smith, W. 2006. National Inventory of C Change for Agricultural Soils in Canada, NCGAVS.
Liebig, M.A., J.A. Morgan, J.D. Reeder, B.H. Ellert, H.T. Gollany, and G.E. Schuman. 2005. Review: Greenhouse gas contributions and mitigation potential of agricultural practices in northwestern USA and western Canada. Soil & Tillage Research. 83:25–52.
Rochette, P., Worth, D., Lemke, R., McConkey, B., Desjardins, R., Huffman, E., Pennock, D., Brierley, A., Yang, J., Gameda, S., Hutchinson, J. 2006. National Inventory of N2O Emissions from Agricultural Soils in Canada, NCGAVS.


