Embed Size (px)
Citation preview
Submitted 7 June 2017Accepted 10 October 2017Published 3 November 2017
Corresponding authorsLeandro Rodríguez-Viera,[email protected],[email protected] Perera,[email protected],[email protected]
Academic editorKristin Hamre
Additional Information andDeclarations can be found onpage 16
DOI 10.7717/peerj.3975
Copyright2017 Rodríguez-Viera et al.
Distributed underCreative Commons CC-BY 4.0
OPEN ACCESS
Carbohydrates digestion and metabolismin the spiny lobster (Panulirus argus):biochemical indication for limitedcarbohydrate utilizationLeandro Rodríguez-Viera1,2,*, Erick Perera3,*, Vivian Montero-Alejo4,Rolando Perdomo-Morales4, Tsai García-Galano1, Gonzalo Martínez-Rodríguez5
and Juan M. Mancera2
1Center for Marine Research, University of Havana, Havana, Havana, Cuba2 Faculty of Marine and Environmental Sciences, Campus de Excelencia Internacional del Mar (CEIMAR),University of Cadiz, Puerto Real, Cadiz, Spain
3Nutrigenomics and Fish Growth Endocrinology, Institute of Aquaculture Torre de la Sal, IATS-CSIC,Castellón, Valencia, Spain
4Department of Biochemistry, Center for Pharmaceuticals Research and Development, Havana, Cuba5 ICMAN-CSIC, Instituto de Ciencias Marinas de Andalucía, Puerto Real, Cadiz, Spian*These authors contributed equally to this work.
ABSTRACTAs other spiny lobsters, Panulirus argus is supposed to use preferentially proteins andlipids in energy metabolism, while carbohydrates are well digested but poorly utilized.The aim of this studywas to evaluate the effect of dietary carbohydrate level on digestionand metabolism in the spiny lobster P. argus. We used complementary methodologiessuch as post-feeding flux of nutrients and metabolites, as well as measurements ofα-amylase expression and activity in the digestive tract. Lobsters readily digested andabsorbed carbohydrates with a time-course that is dependent on their content in diet.Lobster showed higher levels of free glucose and stored glycogen in different tissuesas the inclusion of wheat flour increased. Modifications in intermediary metabolismrevealed a decrease in amino acids catabolism coupledwith a higher use of free glucose ascarbohydrates rise up to 20%. However, this effect seems to be limited by the metaboliccapacity of lobsters to use more than 20% of carbohydrates in diets. Lobsters were notable to tightly regulate α-amylase expression according to dietary carbohydrate levelbut exhibited a marked difference in secretion of this enzyme into the gut. Resultsare discussed to highlight the limitations to increasing carbohydrate utilization bylobsters. Further growout trials are needed to link the presented metabolic profileswith phenotypic outcomes.
Subjects Aquaculture, Fisheries and Fish Science, Marine BiologyKeywords α-amylase, Carbohydrate, Energy metabolism, Crustaceans, Glycemia, Gene expres-sion, Panulirus argus, Lobster, Carbohydrate digestion
INTRODUCTIONDespite significant achievements made on the larval propagation of spiny lobsters(Barnard, Johnston & Phillips, 2011; Perera & Simon, 2014), a major interest remains on
How to cite this article Rodríguez-Viera et al. (2017), Carbohydrates digestion and metabolism in the spiny lobster (Panulirus argus):biochemical indication for limited carbohydrate utilization. PeerJ 5:e3975; DOI 10.7717/peerj.3975
the growout of lobsters based on the capture of wild seed (Williams, 2007; Perera & Simon,2014; Radhakrishnan, 2015), especially for fast-growing tropical species (e.g., Panulirusargus, Panulirus ornatus) (Jeffs & David, 2003; Williams, 2007; Nguyen, Long & Hoc, 2009).However, the absence of appropriate diets is so far the main impediment to the sustainableexpansion of this activity (Williams, 2007); during growout, spiny lobsters are currently fedwith trash fish (Perera & Simon, 2014; Radhakrishnan, 2015), with downstream negativeeffects such as environmental pollution, poor feed conversion, appearance of emergingdiseases, and overpressure onwild fish stocks (Perera & Simon, 2014;Radhakrishnan, 2015).Although the nutritional requirements of some spiny lobsters have been evaluated, growthrates with formulated diets are still low for most species (Crear et al., 2000; Glencross etal., 2001; Smith et al., 2003;Ward et al., 2003; Johnston et al., 2003; Smith, Williams & Irvin,2005; Simon & Jeffs, 2008).
It is recognized that problems for feeding spiny lobsters with formulated diets arepartially due to gaps in our knowledge on their digestive physiology andmetabolism (Perera& Simon, 2014). Different studies in the spiny lobster P. argus digestive physiology havebeen focused on protein digestion (Perera et al., 2008a; Perera et al., 2008b; Perera et al.,2010a; Perera et al., 2010b; Perera et al., 2012a; Perera et al., 2012b), while digestion of othernutrients has received less attention. From a diet development perspective, carbohydrates(CHs) would provide a cheap source of energy, which is assumed to be advantageous interm of growth and profitability. However, there is no evidence of a significant use of CHsfor energy in spiny lobsters, though some energy appears to be derived from glycogen of thedigestive gland (DG) during short term fasting (Simon & Jeffs, 2013). P. argus is currentlysupposed to use preferentially proteins and lipids in energymetabolism (Perera et al., 2005),and studies in this and other spiny lobster species have provided indication that several CHsare well digested but poorly utilized (Simon, 2009a; Simon, 2009b; Simon, 2009c; Simon& Jeffs, 2013; Rodríguez-Viera et al., 2014). The metabolism of other crustaceans such aspenaeid shrimps is also directed to the use of proteins and lipids for energy, but CHs canspare dietary proteins to a certain extent (Cuzon et al., 2000).
Previous studies indicated that native wheat flour (∼70% starch) results in a gradualdigestion and liberation of glucose to the hemolymph and may have the major potentialfor optimizing energy metabolism of lobsters (Simon, 2009a; Simon, 2009b; Simon, 2009c;Simon & Jeffs, 2011; Simon & Jeffs, 2013; Rodríguez-Viera et al., 2014). Although differentfactors affecting starch hydrolysis come from the CH source itself (e.g., granule size andshape, amylose content), the true digestion rate arises from the interaction between CHsand digestive carbohydrases. As in other crustaceans (Pavasovic et al., 2004), adaptationof α-amylase to dietary CHs has been demonstrated in the spiny lobster J. edwardsii. Theα-amylase activity in this species significantly decreased with increasing inclusion of CHsin diet (Simon & Jeffs, 2011; Simon & Jeffs, 2013). Preliminary gene expression analysis inP. argus suggested that dietary regulation of α-amylase activity in spiny lobsters may beexerted at the transcriptional level (Rodríguez-Viera et al., 2016). However, this flexibility ingene expression of P. argus α-amylase seems not sufficient to control CHs digestion when
Rodríguez-Viera et al. (2017), PeerJ, DOI 10.7717/peerj.3975 2/21
lobsters are fed on formulated diets, probably due to lowKm of the enzyme (Rodríguez-Vieraet al., 2016) and its high activity in the conditions of the gastric juice (Perera et al., 2008a;Perera et al., 2008b).
The aim of this study was to evaluate the effect of CH level on digestive α-amylasetranscriptional regulation, CH digestion and metabolism in the spiny lobster P. argus.Complementary methodologies such as post-feeding fluxes of nutrients and metabolites,as well as assessments of activity and gene expression of α-amylase in the digestive tractwere used. Results suggest that regulatory mechanisms of digestive α-amylases in thelobster are not well developed at the transcriptional level, with more complexity addedat the level of secretion of the enzymes. Furthermore, this is probably the first studyproviding biochemical evidence of the protein sparing effect of dietary CHs in spinylobsters. However, this effect seems to be limited by the metabolic capacity of lobster to usediet-derived glucose, with no improvement with increments in dietary CHs beyond 20%.
MATERIALS & METHODSExperimental diets and feeding trialThree experimental diets were formulated to contain different inclusion levels of CHs(6%, 20%, and 35%) (Table 1). All feedstuffs were obtained from commercial suppliers(Table 1). Pellets were made as described in a previous work (Perera et al., 2012a; Perera etal., 2012b). Spiny lobsters were collected in theGulf of Batabanó, Cuba, under permission ofthe Fisheries Regulator Department from theMinistry of the Fishing Industry of Cuba. Thefeeding trial was conducted at the Center for Marine Research of the University of Havana,Cuba, in a facility equipped recirculated sea water, constant aeration, and photoperiod of12 h light: 12 h darkness. Water quality was monitored twice a week: ∼26 ◦C, pH∼8.0,salinity 36 ups, oxygen ∼6.0 mg/L, and ammonia-N∼0.07 mg/L. Each experimental dietwas sorted at random to six lobsters (∼250 g), housed individually in 60 L tanks. Onlyintermolt individuals (Drach & Tchemigovzteff, 1967; Lyle & MacDonald, 1983) were used.
Lobsters were acclimatized for one week to experimental diets by gradually reducing fishflesh as food until they consumed only the pellets. The ration was progressively adjusted to2% of body weight per day (BW day−1). This ration is sufficient for lobsters to feed closeto satiation (Simon, 2009a; Simon, 2009b; Simon, 2009c). After this period, lobsters werefasted for two days and then they were provided with a 2% BW ration of the experimentaldiets for serial collection of gastric juice and hemolymph.
Serial collection of gastric juice and hemolymphSamples of gastric fluid were obtained through the oral cavity using insulin syringes with aplastic cannula over the needle as described before (Perera et al., 2012b). Gastric juice wasnot sampled before feeding as this affects feed intake. Serial samples (∼100 µL) of gastricjuice were taken at 2, 6, 12, 24 and 30 h after ingestion, centrifuged at 10,000× g for 10 min,frozen in liquid nitrogen and stored at−80 ◦C. Samples were rapidly taken (less than 1min)to avoid excessive stress. Hemolymph was not sampled prior to feeding, as this is known toaffect feed intake in other spiny lobster species (Simon, 2009a) and by previous observationin our laboratory (Rodríguez-Viera et al., 2014). Hemolymph sampling began 2 h after
Rodríguez-Viera et al. (2017), PeerJ, DOI 10.7717/peerj.3975 3/21
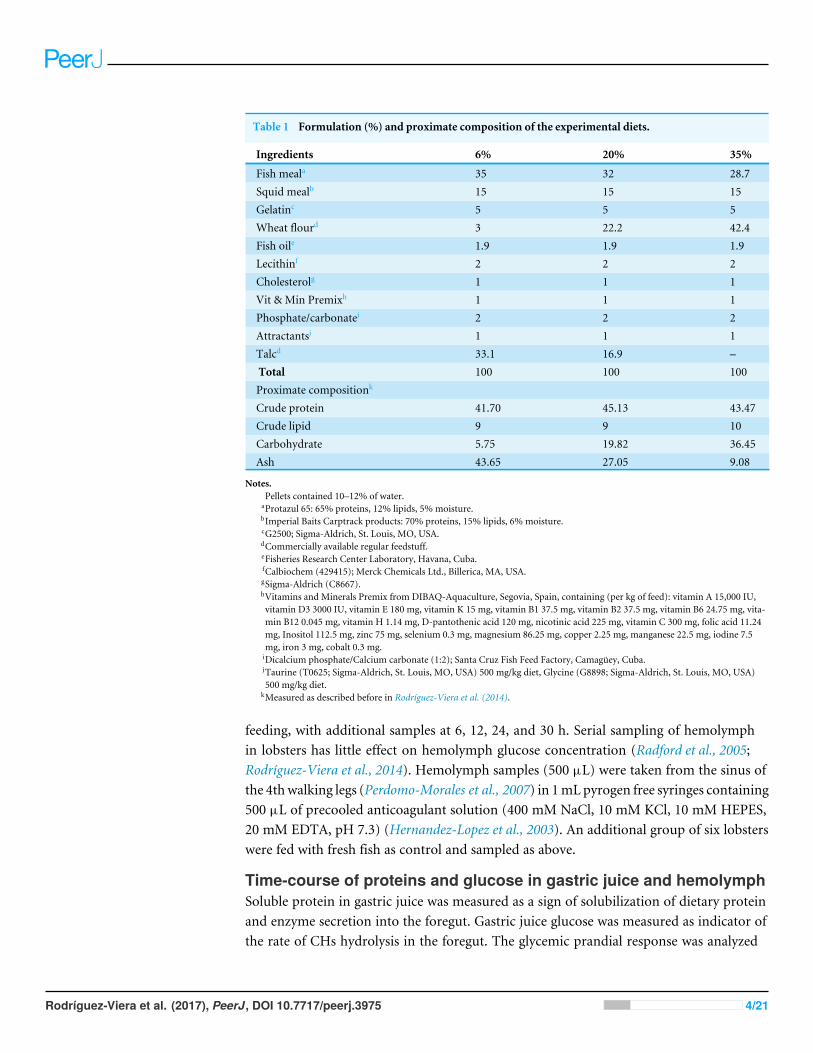
Table 1 Formulation (%) and proximate composition of the experimental diets.
Ingredients 6% 20% 35%
Fish meala 35 32 28.7Squid mealb 15 15 15Gelatinc 5 5 5Wheat flourd 3 22.2 42.4Fish oile 1.9 1.9 1.9Lecithinf 2 2 2Cholesterolg 1 1 1Vit & Min Premixh 1 1 1Phosphate/carbonatei 2 2 2Attractantsj 1 1 1Talcd 33.1 16.9 –Total 100 100 100Proximate compositionk
Crude protein 41.70 45.13 43.47Crude lipid 9 9 10Carbohydrate 5.75 19.82 36.45Ash 43.65 27.05 9.08
Notes.Pellets contained 10–12% of water.
aProtazul 65: 65% proteins, 12% lipids, 5% moisture.bImperial Baits Carptrack products: 70% proteins, 15% lipids, 6% moisture.cG2500; Sigma-Aldrich, St. Louis, MO, USA.dCommercially available regular feedstuff.eFisheries Research Center Laboratory, Havana, Cuba.fCalbiochem (429415); Merck Chemicals Ltd., Billerica, MA, USA.gSigma-Aldrich (C8667).hVitamins and Minerals Premix from DIBAQ-Aquaculture, Segovia, Spain, containing (per kg of feed): vitamin A 15,000 IU,vitamin D3 3000 IU, vitamin E 180 mg, vitamin K 15 mg, vitamin B1 37.5 mg, vitamin B2 37.5 mg, vitamin B6 24.75 mg, vita-min B12 0.045 mg, vitamin H 1.14 mg, D-pantothenic acid 120 mg, nicotinic acid 225 mg, vitamin C 300 mg, folic acid 11.24mg, Inositol 112.5 mg, zinc 75 mg, selenium 0.3 mg, magnesium 86.25 mg, copper 2.25 mg, manganese 22.5 mg, iodine 7.5mg, iron 3 mg, cobalt 0.3 mg.iDicalcium phosphate/Calcium carbonate (1:2); Santa Cruz Fish Feed Factory, Camagüey, Cuba.jTaurine (T0625; Sigma-Aldrich, St. Louis, MO, USA) 500 mg/kg diet, Glycine (G8898; Sigma-Aldrich, St. Louis, MO, USA)500 mg/kg diet.
kMeasured as described before in Rodríguez-Viera et al. (2014).
feeding, with additional samples at 6, 12, 24, and 30 h. Serial sampling of hemolymphin lobsters has little effect on hemolymph glucose concentration (Radford et al., 2005;Rodríguez-Viera et al., 2014). Hemolymph samples (500 µL) were taken from the sinus ofthe 4thwalking legs (Perdomo-Morales et al., 2007) in 1mLpyrogen free syringes containing500 µL of precooled anticoagulant solution (400 mM NaCl, 10 mM KCl, 10 mM HEPES,20 mM EDTA, pH 7.3) (Hernandez-Lopez et al., 2003). An additional group of six lobsterswere fed with fresh fish as control and sampled as above.
Time-course of proteins and glucose in gastric juice and hemolymphSoluble protein in gastric juice was measured as a sign of solubilization of dietary proteinand enzyme secretion into the foregut. Gastric juice glucose was measured as indicator ofthe rate of CHs hydrolysis in the foregut. The glycemic prandial response was analyzed
Rodríguez-Viera et al. (2017), PeerJ, DOI 10.7717/peerj.3975 4/21

as indicator of digestibility and absorption of dietary CHs in lobsters (Rodríguez-Vieraet al., 2014; Simon, 2009a; Radford et al., 2005) and protein in the hemolymph as a signof their digestion and absorption. Soluble protein concentrations were quantified by theLowry method using bovine serum albumin as standard (Lowry et al., 1951). Glucose levelwas determined using a HELFA R© RapiGluco-Test glucose oxidase kit (Quimefa BiologicalProducts Inc., Havana, Cuba).
Amylase activityAmylase activity was measured as described before (Rodríguez-Viera et al., 2016) in amixture composed of 5 µL of DG extract or gastric juice and 200 µL of assay buffer(50 mMMES (2-(N-morpholino) ethanesulfonic acid), pH 5.5), with 0.5 mM 2-Chloro-4-nitrophenyl-a-D-maltotrioside (CNP-G3) as the substrate. CNP released was measured (at405 nmand 37 ◦C) kinetically for 10min in an ELx808IUmicroplate reader. Initial velocitieswere obtained using the software KC4 version 3.4 (BioTek Instruments, Winooski, VT,USA). The extinction coefficient of p-nitrophenol at 405 nm (reaction volume of 205 µL)was 9.774 mM−1 cm−1. A unit of amylase activity was defined as the amount of enzymethat produces 1 µmol p-nitrophenol/minute. Amylase activity was expressed per volumeof gastric juice (µL) or DG weight (mg).
Metabolites in digestive gland and muscleAfter the 30 h time-course sampling of gastric juice and hemolymph, lobsters were fed forone month with the corresponding diets, left unfed for 48 h, and then fed again with therespective diets (Rodríguez-Viera et al., 2014). They were killed 24 h later in ice-cold waterto remove DG, muscle, and hemolymph samples, which were immediately frozen in liquidnitrogen and freeze-dried for metabolite and metabolic enzyme measurements. Samplesof ∼20 mg were homogenized in 1 mL water, centrifuged (30 min, 10,000× g, 4 ◦C), andthe supernatant taken to assess tissue metabolites. Before centrifugation, an aliquot wastaken for triglyceride (TG) determination. Soluble protein and glucose concentrations weremeasured as detailed above. Free amino acid concentration was assessed colorimetricallyby the nynhidrin method (Yemm, Cocking & Ricketts, 1955; Rosen, 1957) with L-alanine asthe standard. TG and lactate concentrations were measured using the commercial kits TAG(Spinreact, Girona, Spain) and Lactate (Spinreact, Girona, Spain), respectively. Glycogenconcentration was assessed by the breakdown of glycogen by amyloglucosidase (Keppler &Decker, 1974) and the determination of resultant glucose by a commercial kit (Spinreact,Girona, Spain) as in our previous work (Rodríguez-Viera et al., 2014).
Metabolic enzymes in HP and muscleThe activities of enzymes from different metabolic pathways were quantified in two keytissues for lobster metabolism, DG and muscle. Lyophilized samples of DG and musclewere homogenized in 10 volumes of ice-cold buffer (50 mM imidazole hydrochloride, pH7.5, 1mM2-mercaptoethanol, 50mM sodium fluoride, 4mMEDTA, 250mM sucrose, and0.5 mM PMSF). Homogenates were centrifuged for 30 min at 10,000× g and supernatantsused for assays. Enzymes activities measured were: hexokinase (HK, EC 2.7.1.11), glycerol-3-phosphate dehydrogenase (G3PDH, EC 1.1.1.8), pyruvate kinase (PK, EC 2.7.1.40),
Rodríguez-Viera et al. (2017), PeerJ, DOI 10.7717/peerj.3975 5/21
L-lactate dehydrogenase (LDH, EC 1.1.1.27), fructose 1,6-biphosphatase (FBPase, EC3.1.3.11), glycogen phosphorylase (GPase, EC 2.4.1.1), glucose-6-phosphate dehydrogenase(G6PDH, EC 1.1.1.49), aspartate transaminase (AST, EC 2.6.1.1), alanine transaminase(ALT, EC 2.6.1.2), glutamate dehydrogenase (GDH, EC 1.4.1.2), and 3-hydroxyacyl-CoAdehydrogenase (HOAD, EC 1.1.1.35). The amount of sample was set to ensure initialvelocities. Conditions for enzyme assays (e.g., buffer composition, cofactors, additionalenzymes for coupled enzyme assays, and electron donor (NADH) or acceptors (NADP,NAD)) were according to Laiz-Carrión et al. (2003) and Sangiao-Alvarellos et al. (2003).Substrates were as in our previous work (Rodríguez-Viera et al., 2014): 5 mM D-glucosefor HK and PK, 0.2 mM dihydroxyacetone phosphate for G3PDH, 6.25 mM lactic acid forLDH, 0.1 mM fructose-1,6-bisphosphate for FBPase, 5 mg/mL glycogen for GPase, 1 mMglucose-6-phosphate for G6PDH, 10 mM L-aspartate for AST, 7.5 mM L-alanine for ALT,1.40 mM α-ketoglutarate for GDH, and 0.1 mM acetoacetyl-CoA for HOAD. Reactionswithout substrates were performed as negative controls. Reaction rates of enzymes weredetermined in duplicate by the increase or decrease in absorbance at 340 nm and 37 ◦C,as a result of NADPH production for HK, LDH, FBPase, GPase, and G6PDH activities,or NADH consumption for G3PDH, PK, AST, ALT, GDH, HOAD activities, respectively.All assays were performed using a Bio-Tek PowerWave 340 Microplate spectrophotometerusing KCjunior Data Analysis Software (Bio-Tek Instruments, Winooski, VT, USA). Oneunit of enzyme activity (U) was defined as the amount of enzyme needed to transform1 µmoL of substrate or produce 1 µmoL of product per min. Enzyme activity was expressedas U/mg of soluble protein.
Effects of carbohydrate level on lobster α-amylase gene expressionand activityAmylase gene expression and activity were assessed in lobsters (n= 6 per diet) acclimatedto the three experimental diets and fresh fish for one month, left unfed for 48 h, then fedagain with the respective diets, and then killed 24 h after last ingestion. For amylase activitydetermination, DGs were homogenized with chilled Milli-Q R© water (90 mg/500 µL) usinga glass piston homogenizer and the homogenates were centrifuged at 10,000× g, 30 min at4 ◦C. The resultant upper lipid layers were discarded and the remaining supernatants storedat −80 ◦C. Samples for gene expression analyses were immediately placed in RNAlater at4 ◦C for 24 h and then stored at −20 ◦C until total RNA extraction.
Total RNA was isolated from individual DGs using an Ultra-Turrax R© T25 (IKA R©-Werke) and the illustraTM RNAspin Mini Kit (GE Healthcare, Dornstadt, Germany).Concentration of total RNA was measured at 260 nm with the BioPhotometer Plus(Eppendorf), and its quality was determined in an Agilent 2100 Bioanalyzer (AgilentTechnologies, SantaClara, CA,USA) using theAgilent RNA6000NanoKit. Specific primers(Table 2) were designed using the software Primer3 v.0.4.0 (http://frodo.wi.mit.edu/) forassessing the relative expression of α-amylase and elongation factor 1 alpha (ef1a) asthe internal reference gene (Perera et al., 2010a; Perera et al., 2010b). ef1a showed lowvariability (less than 0.20 Ct) among experimental groups. Primers were synthesized byIDT (Integrated DNA Technologies, Leuven, Belgium). First, 500 ng of total RNA were
Rodríguez-Viera et al. (2017), PeerJ, DOI 10.7717/peerj.3975 6/21
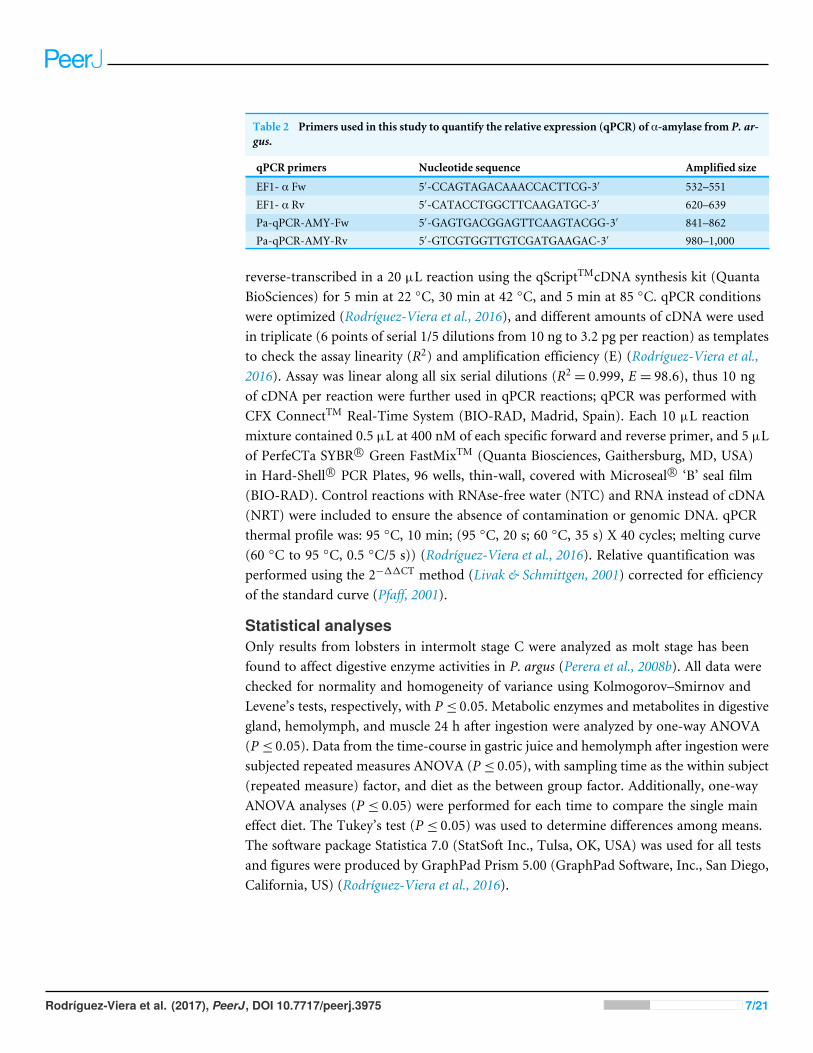
Table 2 Primers used in this study to quantify the relative expression (qPCR) of α-amylase from P. ar-gus.
qPCR primers Nucleotide sequence Amplified size
EF1- α Fw 5′-CCAGTAGACAAACCACTTCG-3′ 532–551EF1- α Rv 5′-CATACCTGGCTTCAAGATGC-3′ 620–639Pa-qPCR-AMY-Fw 5′-GAGTGACGGAGTTCAAGTACGG-3′ 841–862Pa-qPCR-AMY-Rv 5′-GTCGTGGTTGTCGATGAAGAC-3′ 980–1,000
reverse-transcribed in a 20 µL reaction using the qScriptTMcDNA synthesis kit (QuantaBioSciences) for 5 min at 22 ◦C, 30 min at 42 ◦C, and 5 min at 85 ◦C. qPCR conditionswere optimized (Rodríguez-Viera et al., 2016), and different amounts of cDNA were usedin triplicate (6 points of serial 1/5 dilutions from 10 ng to 3.2 pg per reaction) as templatesto check the assay linearity (R2) and amplification efficiency (E) (Rodríguez-Viera et al.,2016). Assay was linear along all six serial dilutions (R2
= 0.999, E = 98.6), thus 10 ngof cDNA per reaction were further used in qPCR reactions; qPCR was performed withCFX ConnectTM Real-Time System (BIO-RAD, Madrid, Spain). Each 10 µL reactionmixture contained 0.5 µL at 400 nM of each specific forward and reverse primer, and 5 µLof PerfeCTa SYBR R© Green FastMixTM (Quanta Biosciences, Gaithersburg, MD, USA)in Hard-Shell R© PCR Plates, 96 wells, thin-wall, covered with Microseal R© ‘B’ seal film(BIO-RAD). Control reactions with RNAse-free water (NTC) and RNA instead of cDNA(NRT) were included to ensure the absence of contamination or genomic DNA. qPCRthermal profile was: 95 ◦C, 10 min; (95 ◦C, 20 s; 60 ◦C, 35 s) X 40 cycles; melting curve(60 ◦C to 95 ◦C, 0.5 ◦C/5 s)) (Rodríguez-Viera et al., 2016). Relative quantification wasperformed using the 2−11CT method (Livak & Schmittgen, 2001) corrected for efficiencyof the standard curve (Pfaff, 2001).
Statistical analysesOnly results from lobsters in intermolt stage C were analyzed as molt stage has beenfound to affect digestive enzyme activities in P. argus (Perera et al., 2008b). All data werechecked for normality and homogeneity of variance using Kolmogorov–Smirnov andLevene’s tests, respectively, with P ≤ 0.05. Metabolic enzymes and metabolites in digestivegland, hemolymph, and muscle 24 h after ingestion were analyzed by one-way ANOVA(P ≤ 0.05). Data from the time-course in gastric juice and hemolymph after ingestion weresubjected repeated measures ANOVA (P ≤ 0.05), with sampling time as the within subject(repeated measure) factor, and diet as the between group factor. Additionally, one-wayANOVA analyses (P ≤ 0.05) were performed for each time to compare the single maineffect diet. The Tukey’s test (P ≤ 0.05) was used to determine differences among means.The software package Statistica 7.0 (StatSoft Inc., Tulsa, OK, USA) was used for all testsand figures were produced by GraphPad Prism 5.00 (GraphPad Software, Inc., San Diego,California, US) (Rodríguez-Viera et al., 2016).
Rodríguez-Viera et al. (2017), PeerJ, DOI 10.7717/peerj.3975 7/21

Figure 1 Soluble protein (A) and α-amylase activity (B) in the gastric juice of Panulirus argus afterfeeding. Diets were named according to the level of CH they contained (6%, 20%, 35%), and a controlwith fresh fish muscle. Each value is the mean± SEM (N = 6 lobsters per diet). Differences among di-ets throughout the 30 h studied are marked by different superscript letters in legend (P ≤ 0.05). For eachsampling time, statistically different (Tukey’s test, P ≤ 0.05) dietary treatments are indicated by asterisks.
Full-size DOI: 10.7717/peerj.3975/fig-1
RESULTSSoluble proteins and amylase activity in gastric juiceSoluble proteins in the gastric juice did not vary among diets (Repeated measures ANOVA,F = 0.83, P > 0.05). Time and time x diet interaction were not significant factors (Repeatedmeasures ANOVA, F = 1.39, P > 0.05) either. However, two apparent peaks of solubleproteins were found in the gastric juice at 6 and 24 h after ingestion, except with thediet containing 6% CH (Fig. 1A). Differences among diets (one-way ANOVA, F = 8.52,P ≤ 0.05) in soluble protein concentration of the gastric juice 6 h after ingestion wereobserved, being significantly higher in the diets with 35% CH and with fresh fish (Tuckey’stest, P ≤ 0.05) (Fig. 1A). Thirty hours after ingestion, basal values for soluble protein wereonly achieved by lobster fed fresh fish (one-way ANOVA, F = 5.10, P ≤ 0.05) (Fig. 1A).Lobsters from all treatments showed similar values at 12 and 24 h (Fig. 1A). Amylaseactivity per volume of gastric juice significantly varied among diets (Repeated measuresANOVA, F = 5.61, P ≤ 0.05), and through time (Repeated measures ANOVA, F = 3.21,P ≤ 0.05). Lobsters ingesting low CH diets (i.e., 6%CH diet and fresh fish) exhibited higheramylase activity in the gastric juice, especially during the first hours post-ingestion. After30 h, only lobster fed the fresh fish decreased amylase activity in the gastric juice (Fig. 1B).Accordingly, the interaction time x diet resulted significant (Repeated measures ANOVA,F = 2.32, P ≤ 0.05). Amylase activity was higher for the 6% CH diet 2 h after ingestion(Tuckey’s test, P ≤ 0.05) (Fig. 1B).
Time-course of glucose in gastric juice and hemolymph after feedingFree glucose concentration in gastric juice was affected by diets (Repeated measuresANOVA, F = 4.91, P ≤ 0.05) but no interaction time x diet was found (Repeated measuresANOVA, F = 1.96, P > 0.05). The main effect time had the major impact on the liberationof glucose into the gastric juice (Repeated measures ANOVA, F = 6.77, P ≤ 0.001), witha peak 2 h after ingestion (Fig. 2A). As expected, diets with 20 and 30% CH produced
Rodríguez-Viera et al. (2017), PeerJ, DOI 10.7717/peerj.3975 8/21
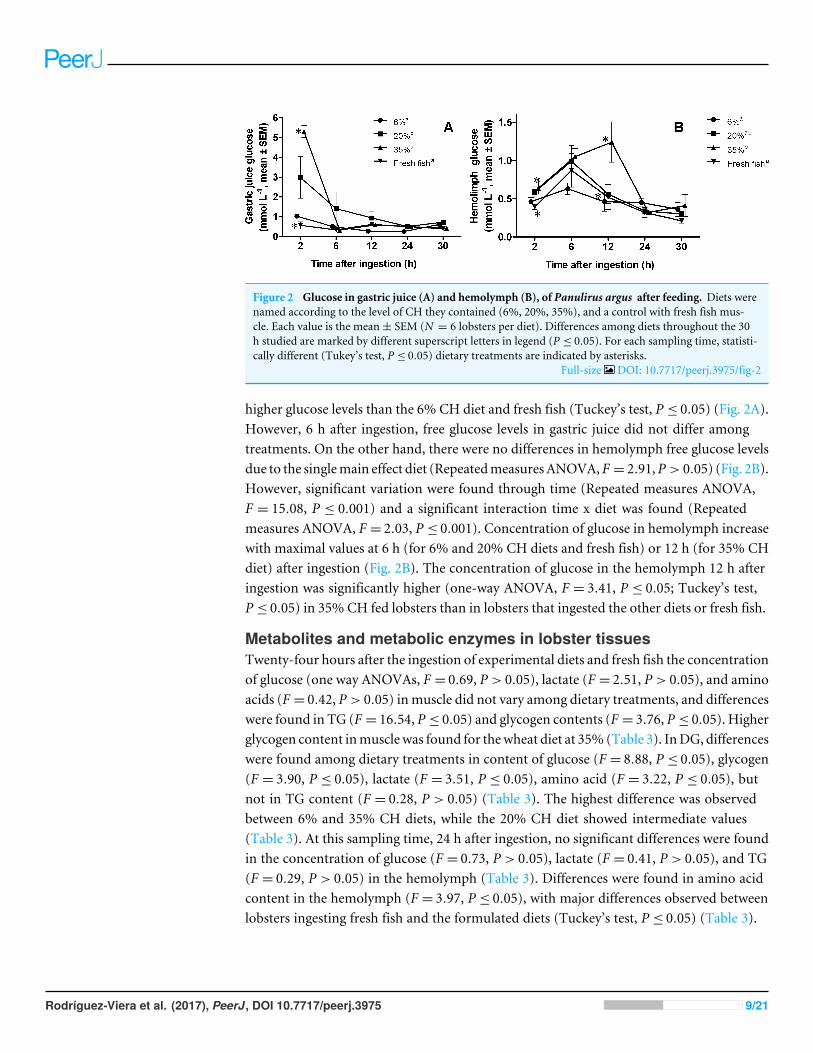
Figure 2 Glucose in gastric juice (A) and hemolymph (B), of Panulirus argus after feeding. Diets werenamed according to the level of CH they contained (6%, 20%, 35%), and a control with fresh fish mus-cle. Each value is the mean± SEM (N = 6 lobsters per diet). Differences among diets throughout the 30h studied are marked by different superscript letters in legend (P ≤ 0.05). For each sampling time, statisti-cally different (Tukey’s test, P ≤ 0.05) dietary treatments are indicated by asterisks.
Full-size DOI: 10.7717/peerj.3975/fig-2
higher glucose levels than the 6% CH diet and fresh fish (Tuckey’s test, P ≤ 0.05) (Fig. 2A).However, 6 h after ingestion, free glucose levels in gastric juice did not differ amongtreatments. On the other hand, there were no differences in hemolymph free glucose levelsdue to the singlemain effect diet (RepeatedmeasuresANOVA,F = 2.91,P > 0.05) (Fig. 2B).However, significant variation were found through time (Repeated measures ANOVA,F = 15.08, P ≤ 0.001) and a significant interaction time x diet was found (Repeatedmeasures ANOVA, F = 2.03, P ≤ 0.001). Concentration of glucose in hemolymph increasewith maximal values at 6 h (for 6% and 20% CH diets and fresh fish) or 12 h (for 35% CHdiet) after ingestion (Fig. 2B). The concentration of glucose in the hemolymph 12 h afteringestion was significantly higher (one-way ANOVA, F = 3.41, P ≤ 0.05; Tuckey’s test,P ≤ 0.05) in 35% CH fed lobsters than in lobsters that ingested the other diets or fresh fish.
Metabolites and metabolic enzymes in lobster tissuesTwenty-four hours after the ingestion of experimental diets and fresh fish the concentrationof glucose (one way ANOVAs, F = 0.69, P > 0.05), lactate (F = 2.51, P > 0.05), and aminoacids (F = 0.42, P > 0.05) inmuscle did not vary among dietary treatments, and differenceswere found in TG (F = 16.54, P ≤ 0.05) and glycogen contents (F = 3.76, P ≤ 0.05). Higherglycogen content inmusclewas found for thewheat diet at 35% (Table 3). InDG, differenceswere found among dietary treatments in content of glucose (F = 8.88, P ≤ 0.05), glycogen(F = 3.90, P ≤ 0.05), lactate (F = 3.51, P ≤ 0.05), amino acid (F = 3.22, P ≤ 0.05), butnot in TG content (F = 0.28, P > 0.05) (Table 3). The highest difference was observedbetween 6% and 35% CH diets, while the 20% CH diet showed intermediate values(Table 3). At this sampling time, 24 h after ingestion, no significant differences were foundin the concentration of glucose (F = 0.73, P > 0.05), lactate (F = 0.41, P > 0.05), and TG(F = 0.29, P > 0.05) in the hemolymph (Table 3). Differences were found in amino acidcontent in the hemolymph (F = 3.97, P ≤ 0.05), with major differences observed betweenlobsters ingesting fresh fish and the formulated diets (Tuckey’s test, P ≤ 0.05) (Table 3).
Rodríguez-Viera et al. (2017), PeerJ, DOI 10.7717/peerj.3975 9/21
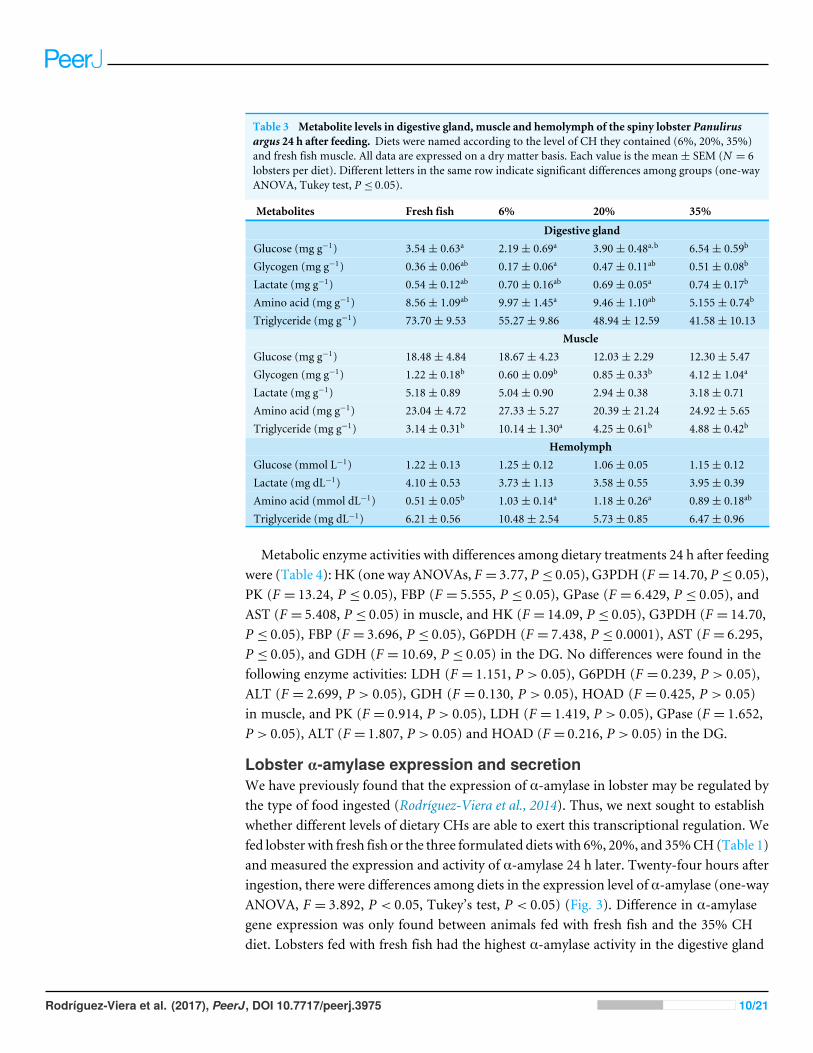
Table 3 Metabolite levels in digestive gland, muscle and hemolymph of the spiny lobster Panulirusargus 24 h after feeding. Diets were named according to the level of CH they contained (6%, 20%, 35%)and fresh fish muscle. All data are expressed on a dry matter basis. Each value is the mean± SEM (N = 6lobsters per diet). Different letters in the same row indicate significant differences among groups (one-wayANOVA, Tukey test, P ≤ 0.05).
Metabolites Fresh fish 6% 20% 35%
Digestive glandGlucose (mg g−1) 3.54± 0.63a 2.19± 0.69a 3.90± 0.48a,b 6.54± 0.59b
Glycogen (mg g−1) 0.36± 0.06ab 0.17± 0.06a 0.47± 0.11ab 0.51± 0.08b
Lactate (mg g−1) 0.54± 0.12ab 0.70± 0.16ab 0.69± 0.05a 0.74± 0.17b
Amino acid (mg g−1) 8.56± 1.09ab 9.97± 1.45a 9.46± 1.10ab 5.155± 0.74b
Triglyceride (mg g−1) 73.70± 9.53 55.27± 9.86 48.94± 12.59 41.58± 10.13Muscle
Glucose (mg g−1) 18.48± 4.84 18.67± 4.23 12.03± 2.29 12.30± 5.47Glycogen (mg g−1) 1.22± 0.18b 0.60± 0.09b 0.85± 0.33b 4.12± 1.04a
Lactate (mg g−1) 5.18± 0.89 5.04± 0.90 2.94± 0.38 3.18± 0.71Amino acid (mg g−1) 23.04± 4.72 27.33± 5.27 20.39± 21.24 24.92± 5.65Triglyceride (mg g−1) 3.14± 0.31b 10.14± 1.30a 4.25± 0.61b 4.88± 0.42b
HemolymphGlucose (mmol L−1) 1.22± 0.13 1.25± 0.12 1.06± 0.05 1.15± 0.12Lactate (mg dL−1) 4.10± 0.53 3.73± 1.13 3.58± 0.55 3.95± 0.39Amino acid (mmol dL−1) 0.51± 0.05b 1.03± 0.14a 1.18± 0.26a 0.89± 0.18ab
Triglyceride (mg dL−1) 6.21± 0.56 10.48± 2.54 5.73± 0.85 6.47± 0.96
Metabolic enzyme activities with differences among dietary treatments 24 h after feedingwere (Table 4): HK (one way ANOVAs, F = 3.77, P ≤ 0.05), G3PDH (F = 14.70, P ≤ 0.05),PK (F = 13.24, P ≤ 0.05), FBP (F = 5.555, P ≤ 0.05), GPase (F = 6.429, P ≤ 0.05), andAST (F = 5.408, P ≤ 0.05) in muscle, and HK (F = 14.09, P ≤ 0.05), G3PDH (F = 14.70,P ≤ 0.05), FBP (F = 3.696, P ≤ 0.05), G6PDH (F = 7.438, P ≤ 0.0001), AST (F = 6.295,P ≤ 0.05), and GDH (F = 10.69, P ≤ 0.05) in the DG. No differences were found in thefollowing enzyme activities: LDH (F = 1.151, P > 0.05), G6PDH (F = 0.239, P > 0.05),ALT (F = 2.699, P > 0.05), GDH (F = 0.130, P > 0.05), HOAD (F = 0.425, P > 0.05)in muscle, and PK (F = 0.914, P > 0.05), LDH (F = 1.419, P > 0.05), GPase (F = 1.652,P > 0.05), ALT (F = 1.807, P > 0.05) and HOAD (F = 0.216, P > 0.05) in the DG.
Lobster α-amylase expression and secretionWe have previously found that the expression of α-amylase in lobster may be regulated bythe type of food ingested (Rodríguez-Viera et al., 2014). Thus, we next sought to establishwhether different levels of dietary CHs are able to exert this transcriptional regulation. Wefed lobster with fresh fish or the three formulated diets with 6%, 20%, and 35%CH (Table 1)and measured the expression and activity of α-amylase 24 h later. Twenty-four hours afteringestion, there were differences among diets in the expression level of α-amylase (one-wayANOVA, F = 3.892, P < 0.05, Tukey’s test, P < 0.05) (Fig. 3). Difference in α-amylasegene expression was only found between animals fed with fresh fish and the 35% CHdiet. Lobsters fed with fresh fish had the highest α-amylase activity in the digestive gland
Rodríguez-Viera et al. (2017), PeerJ, DOI 10.7717/peerj.3975 10/21
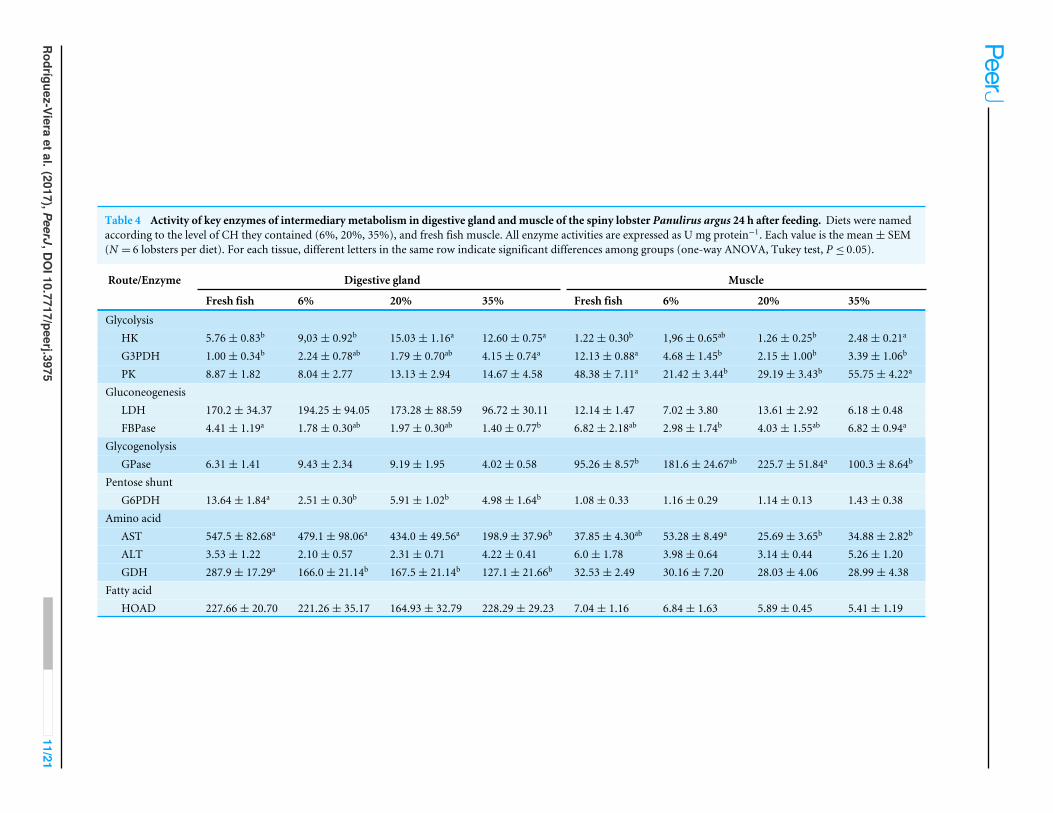
Table 4 Activity of key enzymes of intermediary metabolism in digestive gland andmuscle of the spiny lobster Panulirus argus 24 h after feeding. Diets were namedaccording to the level of CH they contained (6%, 20%, 35%), and fresh fish muscle. All enzyme activities are expressed as U mg protein−1. Each value is the mean± SEM(N = 6 lobsters per diet). For each tissue, different letters in the same row indicate significant differences among groups (one-way ANOVA, Tukey test, P ≤ 0.05).
Route/Enzyme Digestive gland Muscle
Fresh fish 6% 20% 35% Fresh fish 6% 20% 35%
GlycolysisHK 5.76± 0.83b 9,03± 0.92b 15.03± 1.16a 12.60± 0.75a 1.22± 0.30b 1,96± 0.65ab 1.26± 0.25b 2.48± 0.21a
G3PDH 1.00± 0.34b 2.24± 0.78ab 1.79± 0.70ab 4.15± 0.74a 12.13± 0.88a 4.68± 1.45b 2.15± 1.00b 3.39± 1.06b
PK 8.87± 1.82 8.04± 2.77 13.13± 2.94 14.67± 4.58 48.38± 7.11a 21.42± 3.44b 29.19± 3.43b 55.75± 4.22a
GluconeogenesisLDH 170.2± 34.37 194.25± 94.05 173.28± 88.59 96.72± 30.11 12.14± 1.47 7.02± 3.80 13.61± 2.92 6.18± 0.48FBPase 4.41± 1.19a 1.78± 0.30ab 1.97± 0.30ab 1.40± 0.77b 6.82± 2.18ab 2.98± 1.74b 4.03± 1.55ab 6.82± 0.94a
GlycogenolysisGPase 6.31± 1.41 9.43± 2.34 9.19± 1.95 4.02± 0.58 95.26± 8.57b 181.6± 24.67ab 225.7± 51.84a 100.3± 8.64b
Pentose shuntG6PDH 13.64± 1.84a 2.51± 0.30b 5.91± 1.02b 4.98± 1.64b 1.08± 0.33 1.16± 0.29 1.14± 0.13 1.43± 0.38
Amino acidAST 547.5± 82.68a 479.1± 98.06a 434.0± 49.56a 198.9± 37.96b 37.85± 4.30ab 53.28± 8.49a 25.69± 3.65b 34.88± 2.82b
ALT 3.53± 1.22 2.10± 0.57 2.31± 0.71 4.22± 0.41 6.0± 1.78 3.98± 0.64 3.14± 0.44 5.26± 1.20GDH 287.9± 17.29a 166.0± 21.14b 167.5± 21.14b 127.1± 21.66b 32.53± 2.49 30.16± 7.20 28.03± 4.06 28.99± 4.38
Fatty acidHOAD 227.66± 20.70 221.26± 35.17 164.93± 32.79 228.29± 29.23 7.04± 1.16 6.84± 1.63 5.89± 0.45 5.41± 1.19
Rodríguez-Viera
etal.(2017),PeerJ,DOI10.7717/peerj.3975
11/21
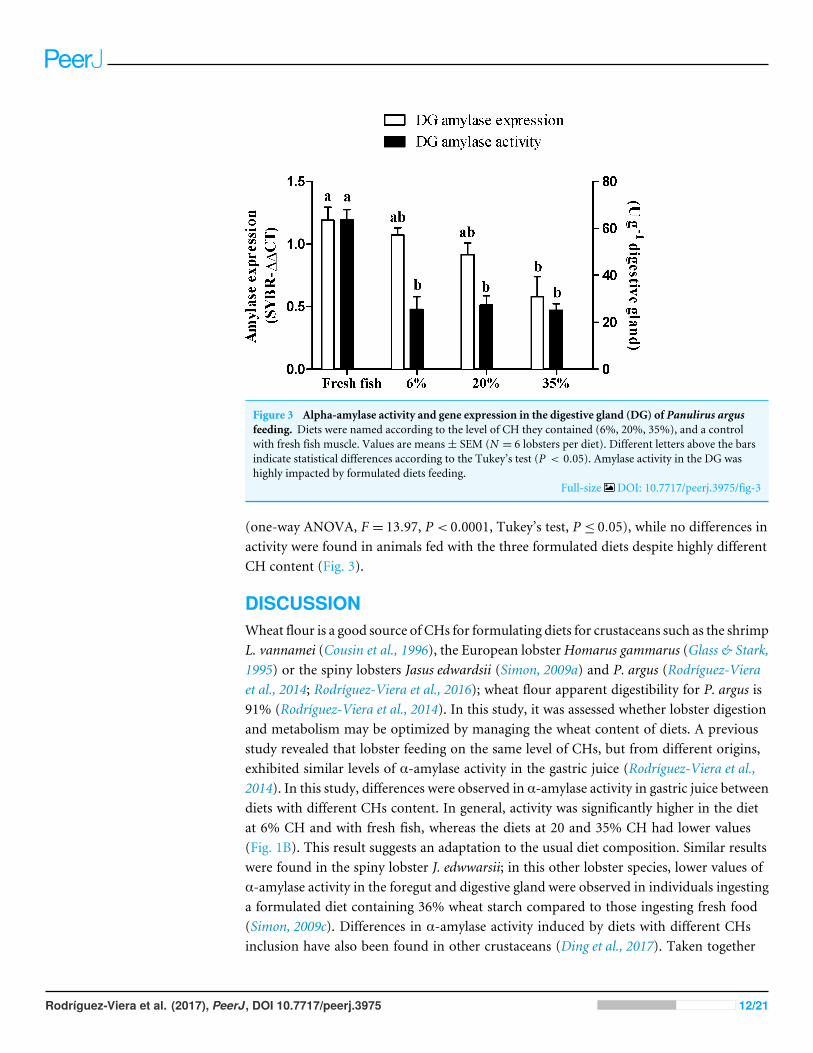
Figure 3 Alpha-amylase activity and gene expression in the digestive gland (DG) of Panulirus argusfeeding. Diets were named according to the level of CH they contained (6%, 20%, 35%), and a controlwith fresh fish muscle. Values are means± SEM (N = 6 lobsters per diet). Different letters above the barsindicate statistical differences according to the Tukey’s test (P < 0.05). Amylase activity in the DG washighly impacted by formulated diets feeding.
Full-size DOI: 10.7717/peerj.3975/fig-3
(one-way ANOVA, F = 13.97, P < 0.0001, Tukey’s test, P ≤ 0.05), while no differences inactivity were found in animals fed with the three formulated diets despite highly differentCH content (Fig. 3).
DISCUSSIONWheat flour is a good source of CHs for formulating diets for crustaceans such as the shrimpL. vannamei (Cousin et al., 1996), the European lobsterHomarus gammarus (Glass & Stark,1995) or the spiny lobsters Jasus edwardsii (Simon, 2009a) and P. argus (Rodríguez-Vieraet al., 2014; Rodríguez-Viera et al., 2016); wheat flour apparent digestibility for P. argus is91% (Rodríguez-Viera et al., 2014). In this study, it was assessed whether lobster digestionand metabolism may be optimized by managing the wheat content of diets. A previousstudy revealed that lobster feeding on the same level of CHs, but from different origins,exhibited similar levels of α-amylase activity in the gastric juice (Rodríguez-Viera et al.,2014). In this study, differences were observed in α-amylase activity in gastric juice betweendiets with different CHs content. In general, activity was significantly higher in the dietat 6% CH and with fresh fish, whereas the diets at 20 and 35% CH had lower values(Fig. 1B). This result suggests an adaptation to the usual diet composition. Similar resultswere found in the spiny lobster J. edwwarsii; in this other lobster species, lower values ofα-amylase activity in the foregut and digestive gland were observed in individuals ingestinga formulated diet containing 36% wheat starch compared to those ingesting fresh food(Simon, 2009c). Differences in α-amylase activity induced by diets with different CHsinclusion have also been found in other crustaceans (Ding et al., 2017). Taken together
Rodríguez-Viera et al. (2017), PeerJ, DOI 10.7717/peerj.3975 12/21
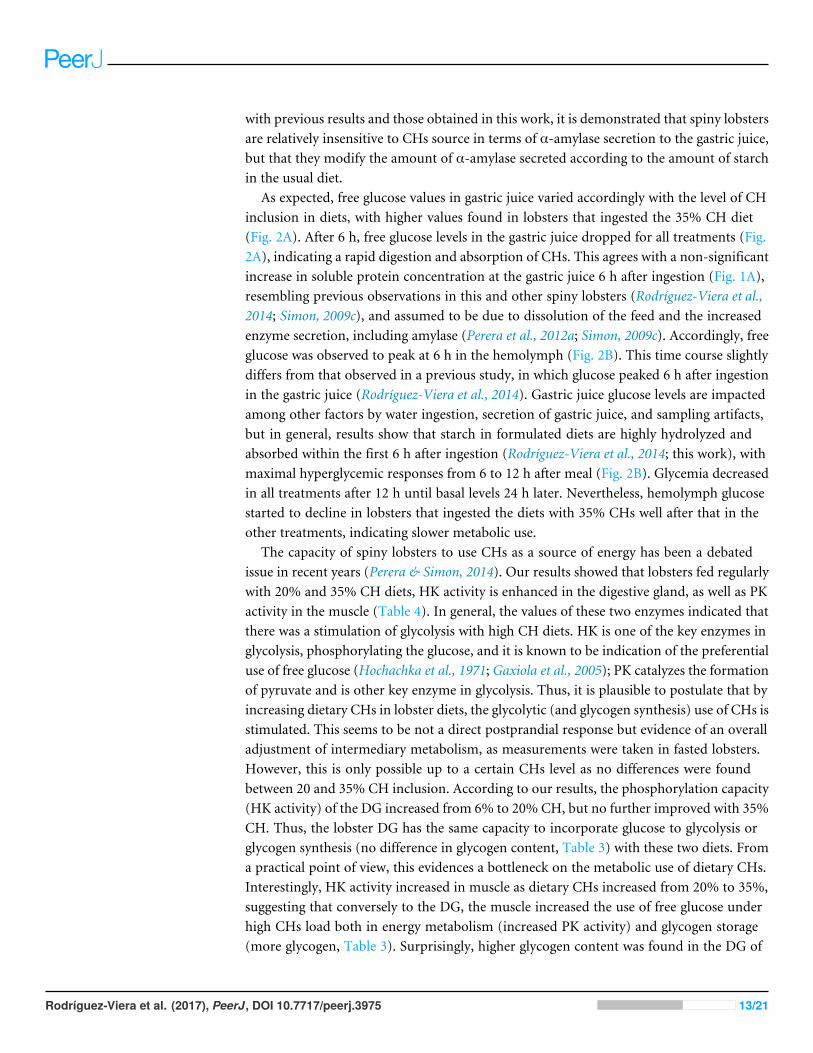
with previous results and those obtained in this work, it is demonstrated that spiny lobstersare relatively insensitive to CHs source in terms of α-amylase secretion to the gastric juice,but that they modify the amount of α-amylase secreted according to the amount of starchin the usual diet.
As expected, free glucose values in gastric juice varied accordingly with the level of CHinclusion in diets, with higher values found in lobsters that ingested the 35% CH diet(Fig. 2A). After 6 h, free glucose levels in the gastric juice dropped for all treatments (Fig.2A), indicating a rapid digestion and absorption of CHs. This agrees with a non-significantincrease in soluble protein concentration at the gastric juice 6 h after ingestion (Fig. 1A),resembling previous observations in this and other spiny lobsters (Rodríguez-Viera et al.,2014; Simon, 2009c), and assumed to be due to dissolution of the feed and the increasedenzyme secretion, including amylase (Perera et al., 2012a; Simon, 2009c). Accordingly, freeglucose was observed to peak at 6 h in the hemolymph (Fig. 2B). This time course slightlydiffers from that observed in a previous study, in which glucose peaked 6 h after ingestionin the gastric juice (Rodríguez-Viera et al., 2014). Gastric juice glucose levels are impactedamong other factors by water ingestion, secretion of gastric juice, and sampling artifacts,but in general, results show that starch in formulated diets are highly hydrolyzed andabsorbed within the first 6 h after ingestion (Rodríguez-Viera et al., 2014; this work), withmaximal hyperglycemic responses from 6 to 12 h after meal (Fig. 2B). Glycemia decreasedin all treatments after 12 h until basal levels 24 h later. Nevertheless, hemolymph glucosestarted to decline in lobsters that ingested the diets with 35% CHs well after that in theother treatments, indicating slower metabolic use.
The capacity of spiny lobsters to use CHs as a source of energy has been a debatedissue in recent years (Perera & Simon, 2014). Our results showed that lobsters fed regularlywith 20% and 35% CH diets, HK activity is enhanced in the digestive gland, as well as PKactivity in the muscle (Table 4). In general, the values of these two enzymes indicated thatthere was a stimulation of glycolysis with high CH diets. HK is one of the key enzymes inglycolysis, phosphorylating the glucose, and it is known to be indication of the preferentialuse of free glucose (Hochachka et al., 1971; Gaxiola et al., 2005); PK catalyzes the formationof pyruvate and is other key enzyme in glycolysis. Thus, it is plausible to postulate that byincreasing dietary CHs in lobster diets, the glycolytic (and glycogen synthesis) use of CHs isstimulated. This seems to be not a direct postprandial response but evidence of an overalladjustment of intermediary metabolism, as measurements were taken in fasted lobsters.However, this is only possible up to a certain CHs level as no differences were foundbetween 20 and 35% CH inclusion. According to our results, the phosphorylation capacity(HK activity) of the DG increased from 6% to 20% CH, but no further improved with 35%CH. Thus, the lobster DG has the same capacity to incorporate glucose to glycolysis orglycogen synthesis (no difference in glycogen content, Table 3) with these two diets. Froma practical point of view, this evidences a bottleneck on the metabolic use of dietary CHs.Interestingly, HK activity increased in muscle as dietary CHs increased from 20% to 35%,suggesting that conversely to the DG, the muscle increased the use of free glucose underhigh CHs load both in energy metabolism (increased PK activity) and glycogen storage(more glycogen, Table 3). Surprisingly, higher glycogen content was found in the DG of
Rodríguez-Viera et al. (2017), PeerJ, DOI 10.7717/peerj.3975 13/21
lobsters fed the fresh fish, compared to the 6% CH diet (Table 3), in spite of fish havinglower CH content (∼2%). This may be partially explained by higher FBPase activity, akey enzyme in gluconeogenesis, which may give lobsters the capacity to synthesize glucosefrom non-CH substrates (Tables 3 and 4). While previous studies have indicated that spinylobsters have a limited capacity for glycogen synthesis during the feeding period in moltstage C (Travis, 1955; Simon & Jeffs, 2011; Rodríguez-Viera et al., 2014), our results pointto a general effect of fresh fish meat on glycogen accumulation.
On the other hand, enzymes activities involved in amino acids catabolism such asAST activity tend to decrease both in the muscle and in the DG as dietary CHs increased(Table 4). In addition, GH activity, which is involved in ammonia formation (Mayzaud& Conover, 1988; Bidigare & King, 1981), mostly in the DG, was lower in lobsters fed ontest diets, especially those with high CHs content (Table 4). Altogether, these biochemicalresults indicated that there is a protein sparing effect of dietary CHs as their inclusion levelincreased. This is probably the first study providing biochemical evidence, though indirect(i.e., not direct measurements of N-retention), of a protein sparing effect of CHs in spinylobsters. However, this effect seems to be limited by the metabolic capacity of lobster touse diet-derived glucose, with no improvement with increments in CHs inclusion beyond20%. On the other hand, while a previous study revealed that the use of wheat flour in dietsimproves P. argus utilization of fatty acids (FA) (Rodríguez-Viera et al., 2014), the presentwork shows that further improvement in FA utilization cannot be achieved by managingwheat flour inclusion. This suggestion derived from the absence of differences in HOADactivity (a key enzyme for FA β-oxidation) between the different diets or fresh fish meat(Table 4). However, lobster ingesting fish meat accumulated more fat in the DG, thusmetabolic factors affecting dietary lipid storage or oxidation in lobsters deserve furtherinvestigation. It is apparent that an interaction occurs between carbohydrate content ofdiet and lipid utilization in P. argus. A previous study on the spiny lobster J. edwardsiishowed that lobsters fed low CH, high lipid diets, were in the best nutritional condition,with higher lipid accumulation (Johnston et al., 2003). Interestingly, G6PDH, a key enzymein the pentose shunt pathway (HMS), was significantly higher in the DG of lobsters thatusually fed on fish meat than in lobsters fed the test diets (Table 4). Given that the HMSpathway provide NADPH for lipid biosynthesis, higher activity of G6PDH in DG of lobsterfeeding fresh fish would indicate a higher potential for lipid synthesis and storage, whichis a key factor determining growth in crustaceans. Also, HMS is involved in nucleotidesynthesis, and thus may also indicate a major growth potential of lobster on a fresh meat.The causes of these metabolic differences between fresh feed and formulated diets arecurrently unknown and still deserve investigation.
Diet composition is known to have a significant effect on the regulation of digestiveα-amylase, mostly at the transcription level, in different invertebrate groups such as insects(Benkel & Hickey, 1987; Inomata et al., 1995), mollusks (Huvet et al., 2008; Huvet et al.,2012; Huang et al., 2016), and crustaceans (Rodríguez-Viera et al., 2016). It was found thatlobsters fed with CHs sources such as corn, wheat and rice at 30% inclusion showed similarvalues of activity and expression of α-amylase, but when fed fresh fish (∼2% glycogen)both increased (Rodríguez-Viera et al., 2016). These results were taken as evidence of an
Rodríguez-Viera et al. (2017), PeerJ, DOI 10.7717/peerj.3975 14/21
effect of CH level on α-amylase gene expression. However, the CH level per se is not thecause of previously observed transcriptional variations, as this study covered a wide rangeof CH inclusion (6 to 35%) and no difference in transcript abundance was found. It isnoteworthy, however, that a non-significant trend was observed, in which less α-amylaseis expressed as starch increased (Fig. 3). Thus, the transcriptional regulation of α-amylasein lobster by CHs cannot be totally ruled out. However, there exists a general stimulatoryeffect of fresh fish meat on α-amylase expression and maybe other digestive enzymes.Therefore, the previous hypothesis on the role of high α-amylase activity in the gastricjuice of fasted lobsters as sentinel for the CHs level of diet, and downstream regulationof α-amylase expression (Rodríguez-Viera et al., 2016), can be discarded. Current resultsare more in agreement with the genome simplification that the α-amylase gene in lobsterhas undergone through evolution (Rodríguez-Viera et al., 2016), probably as a result of acarnivorous feeding habits. It is now apparent that in addition to gene and intron lossesin the lobster α-amylase gene (Rodríguez-Viera et al., 2016), transcriptional regulatorymechanisms have been simplified, being more responsive to unknown general signalsfrom fresh food vs. test diets than to specific CHs level. However, while gene expressionin the DG is similar in lobsters ingesting fresh fish (∼2% CH), 6% CHs, and 20% CHs,lobster fed fresh fish exhibited a higher activity in the gland in fasting animals. This findingsuggests that there is a regulation of α-amylase activity at the secretion level. As DG enzymeactivities cannot differentiate between the secreted enzymes and the enzymes that are storedas zymogens and activated as an artifact of tissue homogenization, we considered amylaseactivity in the gastric juice as a better indicator of enzyme secretion (in fasted lobsters, withno starch in gastric juice). Lobsters that usually ingested fresh fish had less α-amylase inthe gastric juice during fasting (Fig. 1B, 30 h), while most enzymes remained stored in theDG (higher activity in the gland) (Fig. 3). This may be a reason for higher post-prandialresponse in α-amylase secretion in lobster fed fresh fish (Fig. 1B, 2–6 h). Also, note thatlobsters fed on fresh fish were the only group decreasing gastric juice amylase duringfasting (Fig. 1B, 30 h). Conversely, most test diets seemed to stimulate continuous enzymesecretion into the gastric juice under fasting conditions. This remarkable difference suggeststhat test diets may induce changes in the secretory activity of the DG, or produce overallstructural changes in the organ that preclude the correct timing of α-amylase secretionafter feeding.
CONCLUDING REMARKSIn general, P. argus is able to digest and absorb CHs (e.g., wheat flour starch) efficiently.Most intense CHs digestion in the gastric juice of the lobster occurs during the first 6 h,which matches with the time course of the hyperglycemic response. The slow clearance ofglucose from hemolymph in lobster ingesting 35% CHs indicates that such an inclusionlevel exceeds the capacity of lobster to utilize this nutrient. Some protein sparing effectof CHs exists in lobsters, but is limited by their intermediary metabolism to 20% CH.Regulatory mechanisms for digestive α-amylase activity in lobsters are complex and notcompletely understood, especially at the secretion level. Future studies are required to
Rodríguez-Viera et al. (2017), PeerJ, DOI 10.7717/peerj.3975 15/21
broaden this issue, as it may lie behind the inability of lobster to control the intensity andtime-course of CHs digestion when fed formulated diets. Given that lobsters are not able totightly regulate α-amylase expression in response to a wide range of dietary CH inclusion,high enzyme activity in gastric juice may have arisen as an adaptation to diets with few ormoderate CH content. However, even when some anticipatory response (according to theusual CH content in diet) in gastric juice α-amylase activity was observed in this study,this may be not suited to control digestion of highly digestible CHs or high CH formulateddiets, likely because of uncontrolled secretion of α-amylase into the foregut during fastingand its high activity in the conditions of the gastric juice (Perera et al., 2008a; Perera et al.,2008b; Rodríguez-Viera et al., 2016).
ACKNOWLEDGEMENTSSpecial thanks to Lázaro Macias for technical support during experiments.
ADDITIONAL INFORMATION AND DECLARATIONS
FundingThis work was partially supported by Ministry of Economy and Competitiveness throughProject AGL2013-48835-C2-R and AGL2016-76069-C2-1-R granted to Juan M. Mancera,UCA-International fellowship granted to Leandro Rodriguez-Viera, and AUIP grant in theframework of the Academic Mobility Program between Andalusian and Ibero-AmericanUniversities associated to the AUIP granted to Leandro Rodríguez-Viera. The funders hadno role in study design, data collection and analysis, decision to publish, or preparation ofthe manuscript.
Grant DisclosuresThe following grant information was disclosed by the authors:Ministry of Economy and Competitiveness: AGL2013-48835-C2-R, AGL2016-76069-C2-1-R.AUIP grant.
Competing InterestsThe authors declare there are no competing interests.
Author Contributions• Leandro Rodriguez-Viera and Erick Perera conceived and designed the experiments,performed the experiments, analyzed the data, wrote the paper, prepared figures and/ortables, reviewed drafts of the paper.• Vivian Montero-Alejo and Rolando Perdomo-Morales performed the experiments,contributed reagents/materials/analysis tools, reviewed drafts of the paper.• Tsai García-Galano performed the experiments, reviewed drafts of the paper.• GonzaloMartínez-Rodríguez performed the experiments, analyzed the data, contributedreagents/materials/analysis tools, reviewed drafts of the paper.
Rodríguez-Viera et al. (2017), PeerJ, DOI 10.7717/peerj.3975 16/21
• JuanM.Mancera conceived and designed the experiments, analyzed the data, contributedreagents/materials/analysis tools, wrote the paper, reviewed drafts of the paper.
Data AvailabilityThe following information was supplied regarding data availability:
The raw data has been uploaded as Supplementary Files.
Supplemental InformationSupplemental information for this article can be found online at http://dx.doi.org/10.7717/peerj.3975#supplemental-information.
REFERENCESBarnard RM, JohnstonMD, Phillips B. 2011. Exciting developments: generation F2 of
the tropical Panulirus ornatus. AQUA Culture Asia Pacific Magazine 7(1):37–38.Benkel BF, Hickey DA. 1987. Drosophila gene is subject to glucose repression. Proceeding
of the National Academic Science s of the United States of America 84:1337–1339DOI 10.1073/pnas.84.5.1337.
Bidigare RR, King FD. 1981. The measurement of glutamate dehydrogenase ac-tivity in Praunus flexuosus and its role in the regulation of ammonium ex-cretion. Comparative Biochemistry and Physiology Part B 70(3):409–413DOI 10.1016/0305-0491(81)90274-1.
CousinM, Cuzon G, Guillaume J, AQUACOP. 1996. Digestibility of starch in Penaeusvannamei: in vivo and in vitro study on eight samples of various origins. Aquaculture140:361–372 DOI 10.1016/0044-8486(95)01201-X.
Crear BJ, Thomas CW, Hart PR, Carter CG. 2000. Growth of juvenile southernrock lobsters, Jasus edwardsii, is influenced by diet and temperature, whilstsurvival is influenced by diet and tank environment. Aquaculture 190:169–182DOI 10.1016/S0044-8486(00)00391-4.
Cuzon G, Rosas C, Gaxiola G, Taboada G, VanWormhoudt A. 2000. Utilization ofcarbohydrates by shrimp. In: Cruz-Suárez LE, Ricque-Marie D, Tapia-SalazarM, Olvera-Novoa M, Civera-Cerecedo R, eds. Avances en Nutrición Acuícola V.Memorias del V Simposium Internacional de Nutrición Acuícola. 19–22 Noviembre,2000. Mérida, Yucatán.
Ding ZL, Kong YQ, Li JF, Cao F, Zhang YX, Du ZY, Ye JY. 2017. Growth and metabolicresponses of juvenileMacrobrachium nipponense to different dietary carbohydratelevels. Aquaculture Nutrition 23:1136–1144 DOI 10.1111/anu.12482.
Drach P, Tchemigovzteff C. 1967. Sur la méthode de détennination des stadesd’intennue et son application générale aux crustacés. Vie et milieu. Série A, Biologiemarine 18(3A):595–610.
Gaxiola G, Cuzon G, García T, Taboada G, Brito R, Chimal ME, Paredes A, Soto L,Rosas C, VanWormhoudt A. 2005. Factorial effects of salinity, dietary carbohy-drate and moult cycle on digestive carbohydrases and hexokinases in Litopenaeus
Rodríguez-Viera et al. (2017), PeerJ, DOI 10.7717/peerj.3975 17/21
vannamei (Boone, 1931). Comparative Biochemistry and Physiology 140A:29–39DOI 10.1016/j.cbpb.2004.10.018.
Glass HJ, Stark JR. 1995. Carbohydrate digestion in the European lobster Homarus gam-marus. Journal of Crustacean Biology 15:424–433 DOI 10.1163/193724095X00433.
Glencross B, SmithM, Curnow J, Smith D,Williams K. 2001. The dietary proteinand lipid requirements of post-puerulus western rock lobster, Panulirus cygnus.Aquaculture 199:119–129 DOI 10.1016/S0044-8486(01)00520-8.
Hernandez-Lopez J, Gollas-Galvan T, Gomez-Jimenez S, Portillo-Clark G, Vargas-Albores F. 2003. In the spiny lobster (Panulirus interruptus) the prophenoloxidaseis located in plasma not in haemocytes. Fish & Shellfish Immunology 14:105–114DOI 10.1006/fsim.2002.0419.
Hochachka PM, Freed JM, Somero GN, Prosser L. 1971. Control sites in glycol-ysis of crustacean muscle. International Journal of Biochemistry 2:125–130DOI 10.1016/0020-711X(71)90201-1.
Huang G, Guo Y, Li L, Fan S, Yu Z, Yu D. 2016. Genomic structure of the α-amylasegene in the pearl oyster Pinctada fucata and its expression in response to salinity andfood concentration. Gene 587(1):98–105 DOI 10.1016/j.gene.2016.04.044.
Huvet A, Jeffroy F, Daniel JY, Quere C, Le Souchu P, VanWormhoudt A, Boudry P,Moal J, Samain JF. 2012. Starch supplementation modulates amylase enzymaticproperties and amylase B mRNA level in the digestive gland of the Pacific oysterCrassostrea gigas. Comparative Biochemistry and Physiology B: Biochemistry andMolecular Biology 163:96–100 DOI 10.1016/j.cbpb.2012.05.003.
Huvet A, Jeffroy F, Fabioux C, Daniel JY, Quillien V, VanWormhoudt A, MoalJ, Samain JF, Boudry P, Pouvreau S. 2008. Association among growth, foodconsumption-related traits and amylase gene polymorphism in the Pacific oysterCrassostrea gigas. Animal Genetics 39:662–665 DOI 10.1111/j.1365-2052.2008.01776.x.
Inomata N, Kanda K, CariouML, Tachida H, Yamazaki T. 1995. Evolution of theresponse patterns to dietary carbohydrates and the developmental differentiationof gene expression of α-amylase in Drosophila. Journal of Molecular Evolution41:1076–1085 DOI 10.1007/BF00173189.
Jeffs AJ, DavidM. 2003. An assessment of the aquaculture potential of the Caribbeanspiny lobster, Panulirus argus. In: Proceedings of the Gulf and Caribbean FisheriesInstitute.
Johnston DJ, Calvert KA, Crear BJ, Carter CG. 2003. Dietary carbohydrate/lipidratios and nutritional condition in juvenile southern rock lobster, Jasus edwardsii.Aquaculture 220:667–682 DOI 10.1016/S0044-8486(02)00562-8.
Keppler D, Decker K. 1974. Glycogen. Determination with amyloglucosidase. In:Bergmeyer HU, ed.Methods of enzymatic analysis. New York: Academic Press,127–1131.
Laiz-Carrión R, Martín del RíoMP, Miguez JM, Mancera JM, Soengas JL. 2003.Influence of cortisol on osmoregulation and energy metabolism in giltheadsea bream Sparus aurata. Journal of Experimental Zoology 298A:105–118DOI 10.1002/jez.a.10256.
Rodríguez-Viera et al. (2017), PeerJ, DOI 10.7717/peerj.3975 18/21
Livak KJ, Schmittgen TD. 2001. Analysis of relative gene expression data using real-time quantitative PCR and the 2(-Delta Delta C (T)) method.Methods 25:402–408DOI 10.1006/meth.2001.1262.
Lowry OH, Rosebrough NJ, Farr AL, Randall RJ. 1951. Protein measurement with theFolin phenol reagent. Journal of Biological Chemistry 193:265–275.
LyleWG,MacDonald CD. 1983.Molt stage determination in the Hawaiian spiny lobsterPanulirus marginatus. Journal of Crustacean Biology 3:208–216 DOI 10.2307/1548257.
Mayzaud P, Conover RJ. 1988. O:N atomic ratio as a tool to describe zooplanktonmetabolism.Marine Ecology Progress Series 45:289–302 DOI 10.3354/meps045289.
Nguyen VL, Long V, Hoc DT. 2009. Census of lobster seed captured from the centralcoastal waters of Vietnam for aquaculture grow-out, 2005–2008. In: Williams KC,ed. Spiny lobster aquaculture in the Asia–Pacific region. Proceedings of an internationalsymposium held at Nha Trang, Vietnam, 9–10 December 2008, ACIAR Proceedings No.132, Canberra: Australian Centre for International Agricultural Research, 162 pp.
Pavasovic M, Richardson NA, Andersonb AJ, Mann D, Mather PB. 2004. Effect of pH,temperature and diet on digestive enzyme profiles in the mud crab, Scylla serrata.Aquaculture 242:641–654 DOI 10.1016/j.aquaculture.2004.08.036.
Perdomo-Morales R, Montero-Alejo V, Perera E, Pardo-Ruiz Z, Alonso-Jimenez E.2007. Phenoloxidase activity in the hemolymph of the spiny lobster Panulirus argus.Fish and Shellfish Immunology 23:1187–1195 DOI 10.1016/j.fsi.2007.04.001.
Perera E, Fraga I, Carrillo O, Díaz-Iglesias E, Cruz R, Báez M, Galich G. 2005. Evalu-ation of practical diets for the Caribbean spiny lobster Panulirus argus (Latreille,1804): effects of protein sources on substrate metabolism and digestive proteases.Aquaculture 244:251–262 DOI 10.1016/j.aquaculture.2004.11.022.
Perera E, Moyano FJ, Díaz M, Perdomo-Morales R, Montero V, Rodríguez-VieraL, Alonso E, Carrillo O, Galich G. 2008b. Changes in digestive enzymes throughdevelopmental and molt stages in the spiny lobster, Panulirus argus. ComparativeBiochemistry and Physiology B: Biochemistry and Molecular Biology 151:250–256DOI 10.1016/j.cbpb.2008.07.005.
Perera E, Moyano FJ, Díaz M, Perdomo-Morales R, Montero-Alejo V, AlonsoE, Carrillo O, Galich GS. 2008a. Polymorphism and partial characterizationof digestive enzymes in the spiny lobster Panulirus argus. Comparative Bio-chemistry and Physiology B: Biochemistry and Molecular Biology 150:247–254DOI 10.1016/j.cbpb.2008.03.009.
Perera E, Moyano FJ, Rodríguez-Viera L, Cervantes A. 2010a. In vitro digestion ofprotein sources by crude enzyme extracts of the spiny lobster Panulirus argus (La-treille, 1804) hepatopancreas with different trypsin isoenzyme patterns. Aquaculture310:178–185 DOI 10.1016/j.aquaculture.2010.10.009.
Perera E, Pons T, Hernández D, Moyano FJ, Martínez-Rodríguez G, Mancera JM.2010b. New members of the brachyurins family in lobster include a trypsin-likeenzyme with amino acid substitutions in the substrate-binding pocket. FEBS Journal277:3489–3501 DOI 10.1111/j.1742-4658.2010.07751.x.
Rodríguez-Viera et al. (2017), PeerJ, DOI 10.7717/peerj.3975 19/21
Perera E, Rodríguez-Casariego J, Rodríguez-Viera L, Calero J, Perdomo-MoralesR, Mancera MJ. 2012b. Differences among trypsin isoforms account for vari-ation in protein digestion in the spiny lobster Panulirus argus: kinetic approx-imation to physiological efficiency. The Biologival Bulleting 222:158–170DOI 10.1086/BBLv222n2p158.
Perera E, Rodríguez-Viera L, Rodríguez-Casariego J, Fraga I, Carrillo O, Martínez-Rodríguez G, Mancera JM. 2012a. Dietary protein quality differentially regu-lates trypsin enzymes at the secretion and transcription level in Panulirus argusby distinct signaling pathways. Journal of Experimental Biology 215:853–862DOI 10.1242/jeb.063925.
Perera E, Simon C. 2014. Digestive physiology of spiny lobsters: implications for formu-lated diet development. Reviews in Aquaculture 6:1–19 DOI 10.1111/raq.12021.
Pfaff MW. 2001. A new mathematical model for relative quantification in real-time RT–PCR. Nucleic Acids Research 29(9):e45–e45 DOI 10.1093/nar/29.9.e45.
Radford CA, Marsden ID, DavisonW, Taylor HH. 2005.Haemolymph glucose concen-trations of juvenile rock lobsters, Jasus edwardsii, feeding on different carbohydratediets. Comparative Biochemistry and Physiology Part A: Molecular & IntegrativePhysiology 140(2):241–249 DOI 10.1016/j.cbpb.2005.01.002.
Radhakrishnan EV. 2015. Review of prospects for lobster farming (chapter 10). In:Perumal S, et al., eds. Advances in marine and brackishwater aquaculture. New Delhi:Springer, 173–185.
Rodríguez-Viera L, Perera E, Casuso A, Perdomo-Morales R, Gutierrez O, Scull I,Carrillo O, Martos-Sitcha JA, García-Galano T, Mancera JM. 2014. A holistic viewof dietary carbohydrate utilization in lobster: digestion, postprandial nutrient flux,and metabolism. PLOS ONE 9(9):e108875 DOI 10.1371/journal.pone.0108875.
Rodríguez-Viera L, Perera E, Martos-Sitcha JA, Perdomo-Morales R, Casuso A,Montero-Alejo V, Mancera JM. 2016.Molecular, biochemical, and dietary regula-tion features of α-amylase in a carnivorous crustacean, the spiny lobster Panulirusargus. PLOS ONE 11(7):e0158919 DOI 10.1371/journal.pone.0158919.
Rosen H. 1957. A modified ninhydrin calorimetric analysis for amino acids. Archives ofBiochemistry and Biophysics 67:10–15 DOI 10.1016/0003-9861(57)90241-2.
Sangiao-Alvarellos S, Laiz-Carrión R, Guzmám JM,Martín del RíoMP, ManceraJM, Soengas JL. 2003. Acclimation of S. aurata to various salinities alters energymetabolism of osmoregulatory and nonosmoregulatory organs. American Journalof Physiology. Regulatory, Integrative and Comparative Physiology 285:R897–R907DOI 10.1152/ajpregu.00161.2003.
Simon CJ. 2009a. Identification of digestible carbohydrate sources for inclusion in in for-mulated diets for juvenile spiny lobsters, Jasus edwardsii. Aquaculture 290:275–282DOI 10.1016/j.aquaculture.2009.02.026.
Simon CJ. 2009b. The effect of carbohydrate source, inclusion level of gelatinisedstarch, feed binder and fishmeal particle size on the apparent digestibility of for-mulated diets for spiny lobster juveniles, Jasus edwardsii. Aquaculture 296:329–336DOI 10.1016/j.aquaculture.2009.08.032.
Rodríguez-Viera et al. (2017), PeerJ, DOI 10.7717/peerj.3975 20/21
Simon CJ. 2009c. Digestive enzyme response to natural and formulated diets incultured juvenile spiny lobster, Jasus edwardsii. Aquaculture 294:271–281DOI 10.1016/j.aquaculture.2009.06.023.
Simon CJ, Jeffs A. 2008. Feeding and gut evacuation of cultured juvenile spiny lobsters,Jasus edwardsii. Aquaculture 280:211–219 DOI 10.1016/j.aquaculture.2008.05.019.
Simon CJ, Jeffs A. 2011. The effect of dietary carbohydrates on the growth response,digestive gland glycogen and digestive enzyme activities of early spiny lobsterjuveniles, Jasus edwardsii. Aquaculture Nutrition 17:613–626DOI 10.1111/j.1365-2095.2011.00861.x.
Simon CJ, Jeffs A. 2013. The effect of dietary carbohydrate on the appetite revival andglucose metabolism of juveniles of the spiny lobster, Jasus edwardsii. Aquaculture384–287:111–118 DOI 10.1016/j.aquaculture.2013.01.003.
Smith DM,Williams KC, Irvin SJ. 2005. Response of the tropical spiny lobster Panulirusornatus to protein content of pelleted feed and to a diet of mussel flesh. AquacultureNutrition 11:209–217 DOI 10.1111/j.1365-2095.2005.00344.x.
Smith DM,Williams KS, Irvin S, Barclay M, Tabrett S. 2003. Development of a pelletedfeed for juvenile tropical spiny lobster (Panulirus ornatus): response to dietaryprotein and lipid. Aquaculture Nutrition 9:231–237DOI 10.1046/j.1365-2095.2003.00248.x.
Travis DF. 1955. The moulting cycle of the spiny lobster, Panulirus argus Latreille. IV.Pre-ecdysal histological and histochemical changes in the hepatopancreas. BiologicalBulletin 108:88–112 DOI 10.2307/1538400.
Ward LR, Carter CG, Crear BJ, Smith DM. 2003. Optimal dietary protein level forjuvenile southern rock lobster, Jasus edwardsii, at two lipid levels. Aquaculture217:483–500 DOI 10.1016/S0044-8486(02)00258-2.
Williams KC. 2007. Nutritional requirements and feeds development for post-larvalspiny lobster: a review. Aquaculture 263:1–14 DOI 10.1016/j.aquaculture.2006.10.019.
Yemm EW, Cocking EC, Ricketts RE. 1955. The determination of amino acids withninhydrin. Analyst 80:209–214 DOI 10.1039/an9558000209.
Rodríguez-Viera et al. (2017), PeerJ, DOI 10.7717/peerj.3975 21/21