Embed Size (px)
Citation preview

SUSTAINABILITY PLAN 2013-2017 WITH SELECTED TARGETS FOR 2020

AGENDA
1
PIRELLI SUSTAINABILITY TODAY
ACKNOWLEDGEMENTS AND ACHIEVEMENTS
THE EVOLVING CONTEXT
SUSTAINABILITY PLAN: RETURN ON CAPITAL
• GROWTH
• PRODUCTIVITY
• GOVERNANCE & RISK MANAGEMENT
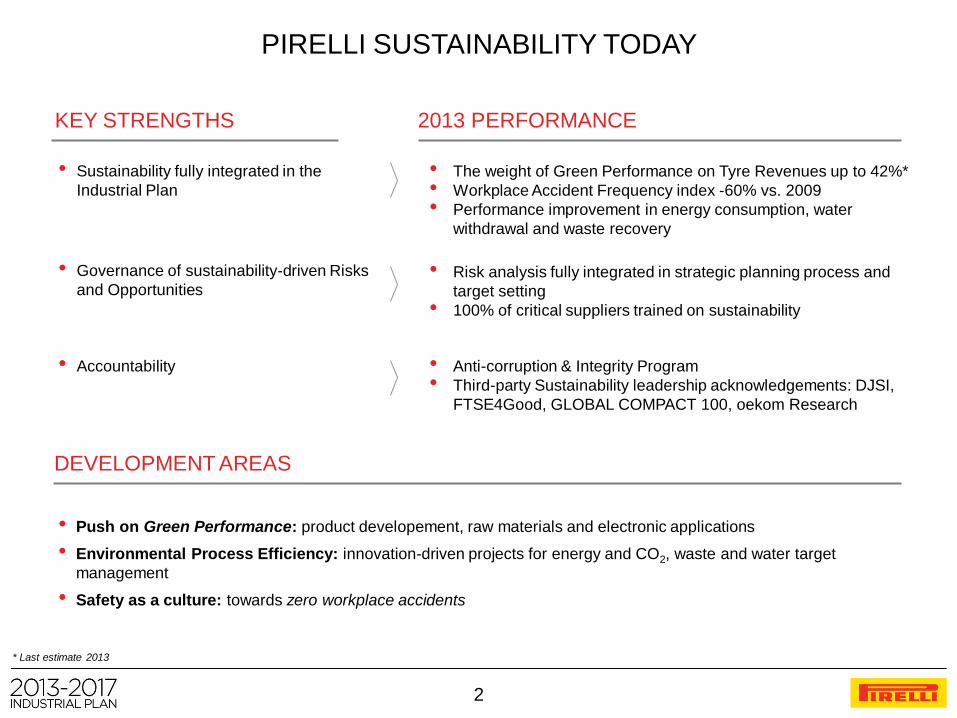
PIRELLI SUSTAINABILITY TODAY
• Sustainability fully integrated in the
Industrial Plan
• The weight of Green Performance on Tyre Revenues up to 42%*
• Workplace Accident Frequency index -60% vs. 2009
• Performance improvement in energy consumption, water
withdrawal and waste recovery
• Push on Green Performance: product developement, raw materials and electronic applications
• Environmental Process Efficiency: innovation-driven projects for energy and CO2, waste and water target
management
• Safety as a culture: towards zero workplace accidents
* Last estimate 2013
KEY STRENGTHS 2013 PERFORMANCE
DEVELOPMENT AREAS
• Governance of sustainability-driven Risks
and Opportunities
• Accountability
• Risk analysis fully integrated in strategic planning process and
target setting
• 100% of critical suppliers trained on sustainability
• Anti-corruption & Integrity Program
• Third-party Sustainability leadership acknowledgements: DJSI,
FTSE4Good, GLOBAL COMPACT 100, oekom Research
2

AGENDA
3
PIRELLI SUSTAINABILITY TODAY
ACKNOWLEDGEMENTS
AND ACHIEVEMENTS
THE EVOLVING CONTEXT
SUSTAINABILITY PLAN: RETURN ON CAPITAL
• GROWTH
• PRODUCTIVITY
• GOVERNANCE & RISK MANAGEMENT

FTSE Global and European STOXX
Score 2012-2013: 100/100
Dow Jones Sustainability World and Europe
Global Leadership in the Auto Components sector
for the seventh year in a row
Score 2013-2014: 85 vs sector avg. of 51
Carbon Disclosure Leadership Index (CDLI)
Score 2012: 89 vs sector avg. of 69 (score 2013 in December) Carbon Disclosure Leadership Index
2013 MAJOR ACKNOWLEDGEMENTS
GLOBAL COMPACT 100
Pirelli the only included Tyre Company
oekom Research
Pirelli Global Leader in the Tyre Industry
4

• Green Performance Revenues: 42%* on Tyre sales
• Anti-corruption & Integrity Program
• New Whistleblowing Policy applied to External Community
• Green Sourcing Policy
• Risk analysis fully integrated in strategic planning process and target setting
* Last estimate 2013
5
2013 MAJOR ACHIEVEMENTS
• Process environmental efficiency*
• Energy specific consumption -2% vs. 2009
• Water specific withdrawal -28% vs. 2009
• Waste recovery rate +10% vs. 2009
• Project for an industrial steam solar power plant - first in the world - feeding the production
cycle of Feira de Santana in partnership with the Italian Ministry for the Environment
• New product Life Cycle Assessment tool implemented
• New Pirelli Green Performance products
• Accident Frequency index* -60%* vs. 2009
• Supplier Sustainability risk assessment updating; 62 ESG** audits performed by independent
party; 100% of critical suppliers trained on sustainability
• New training model implemented worldwide: Training Academies and School of
Management; new Employer Branding campaign
• Proactive engagement within high level international bodies on Sustainable Development
(including WBCSD, UN Global Compact, CSR Europe, World Rubber Summit, World Forum
Lille, IRSG)
** ESG: Environmental, Social, Governance

AGENDA
6
PIRELLI SUSTAINABILITY TODAY
ACKNOWLEDGEMENTS AND ACHIEVEMENTS
THE EVOLVING CONTEXT
SUSTAINABILITY PLAN: RETURN ON CAPITAL
• GROWTH
• PRODUCTIVITY
• GOVERNANCE & RISK MANAGEMENT

Downside risks dominate the
world economic outlook
Strong move towards
low-carbon economies
Demographic changes, aging
population, virtual mobility,
continued urbanisation
EXTERNAL FORCES DRIVING THE AUTOMOTIVE MARKET
2013 2017 2025 2030
Macroeconomic uncertainty Regulatory constraints Changes in social behaviour
Impact on Automotive industry
Industry intercepting and addressing long-term market opportunities
7

LOW-CARBON EMISSIONS Automotive CO2 regulatory framework and car manufacturers strategy
MEXICO 2016: 169
USA/CANADA
2025: 109
2000 2005 2010 2015 2020 2025
EUROPE 2020: 95
JAPAN 2020: 105
INDIA 2021: 113
CHINA 2020: 117
S. KOREA 2015: 153
280
240
200
160
120
80
Gra
ms C
O2 p
er
km
no
rma
lize
d to
NE
DC
Te
st C
ycle
Premium and Synergic manufacturers committed to conventional and innovative (hybrid, full electric)
technologies towards low-carbon mobility while developing new business models
Hystorical performance
Target
Global passenger
vehicle CO2
reduction standards
Source: ICCT (the International Council on Clean Transportation)
Supporting data can be found at: www.theicct.org/info-tools/global-passenger-vehicle-standards
8

are influenced by the EU tyre label* consider rolling resistance the most
important info on the EU label*
* Pirelli internal data, Goodyear publications and other sources
WORLDWIDE SPREADING OF TYRE LABELLING
Influence on consumer behaviour
71% 66% of car Tyre consumers of truck Tyre consumers
TYRE LABELLING EVOLUTION
JAPAN
EUROPE
SOUTH KOREA
ISRAEL
USA
BRAZIL
AUSTRALIA
CHINA
ARABIAN GULF COUNTRIES
X
X
X
X
X
X
X
X
X
X
Active now
Active now
Active now
Active now
Expected 2014
Expected 2015
Under discussion
Wet grip Noise Status
X
X
X
X
X
X
X
Rolling
Resistance COUNTRY
X
Wear
Strong interest in regulations for rolling resistance and wet grip,
Tyre labelling not yet defined
9

AGENDA
10
PIRELLI SUSTAINABILITY TODAY
ACKNOWLEDGEMENTS AND ACHIEVEMENTS
THE EVOLVING CONTEXT
SUSTAINABILITY PLAN:
RETURN ON CAPITAL • GROWTH
• PRODUCTIVITY
• GOVERNANCE & RISK MANAGEMENT

* The Pirelli model is inspired by the Value Driver framework of the UN-PRI (United Nations – Principles for Responsible Investment) and UN Global Compact , aimed at
supporting dialogue between investors and corporations on ESG themes
Plan is presented through three sustainability-driven enablers
PIRELLI VALUE DRIVER MODEL*
RETURN ON CAPITAL
GROWTH PRODUCTIVITY GOVERNANCE & RISK
MANAGEMENT
• Long-Term Strategy
• Product Innovation
• Operational Efficiency
• Human Capital Management
• Enterprise Risk Management
• Supply Chain Risk
Revenue growth Cost saving
& avoidance
Revenue and reputation
risk reduction;
Sustainability risk containment
11

SUSTAINABILITY LEVERS OF THE INDUSTRIAL PLAN
Integrating, supporting and protecting Group targets and values
CO
ST
CO
MP
ET
ITIV
EN
ES
S
TO
P L
INE
GR
OW
TH
INDUSTRIAL PLAN 2013-17 SUSTAINABILITY PLAN 2013-17 + TARGETS 2020
• Reduce energy consumption by 18% within 2020 vs. 2009: expected
savings of ~25 €/mln and 400,000 Tons of CO2 in 2014-2017
• Towards zero waste to landfill: expected savings of ~60 €/mln by 2017
thanks to internal recovery of scrap
• Reduce water withdrawal by 58% by 2020 vs. 2009
• Target zero workplace accidents: Frequency Index reduction by 90% by
2020 vs. 2009
• Training to reach 7 man / days on average from 2015 onwards
• Push on Green Performance innovation
• Raw materials: from rice husks to industrial silica
• Electronic Applications: Pirelli CYBER TYRE from Truck to Premium
car
• Product developement: strong improvement in Eco Label KPIs with
double-digit reduction in Car Rolling Resistance by 2017
• Green Performance Tyre revenues up to 48% on total Tyre revenues by
2017
• Dialogue with end-users
• Growing investment in risk mitigation and business continuity: 8.3%
CAGR by 2017 vs 2013
• Reduce the environmental impact of purchased goods and services
through Pirelli New Green Sourcing Policy
OE PULL-THROUGH
PRODUCT RENEWAL
PREMIUM GO TO MARKET
AND RETAIL COVERAGE
CONSUMER ENGAGEMENT
DE-COMPLEXITY
DESIGN TO COST
PLANT SPECIALIZATION
RE-SHAPED
MANUFACTURING ASSETS
12
RE
TU
RN
ON
CA
PIT
AL

AGENDA
13
PIRELLI SUSTAINABILITY TODAY
ACKNOWLEDGEMENTS AND ACHIEVEMENTS
THE EVOLVING CONTEXT
SUSTAINABILITY PLAN:
RETURN ON CAPITAL • GROWTH
• PRODUCTIVITY
• GOVERNANCE & RISK MANAGEMENT

GROWTH: LIFE CYCLE THINKING Focusing strategy on materiality
GLOBAL WARMING POTENTIAL OF OUR MODEL TYRE
The EU medium car
carbon footprint of which
≈ 15% is the average
contribution of
FOUR TYRES
Raw Materials Production Distribution Use End of Life
5.5% 2.6%
0.2% 2.2%
89.5%
14

GROWTH: PRODUCT INNOVATION New technologies in materials and electronic applications
• CAR: “Base” Tyre Monitoring System to
manage tyre performance through
pressure - 2014
PIRELLI CYBER TYRE
• CAR: “Premium” Tyre Monitoring System
with management of static load, tear
consumption, hydroplaning alert, road
surface alert and tyre vectorial strenghts
- 2015
• TRUCK: Cyber Fleet system to manage
the tyres of whole fleets, to minimize fuel
consumption and CO2 emissions - 2013
• SILICA: expansion of the Pirelli
technology to produce silica from rice
husk also for Premium tyres - 2017
MATERIALS
• NATURAL RUBBER: research on
alternative sources; Guayule project with
Versalis (ENI Group) – 2016
• FUNCTIONALIZED POLYMERS:
research on innovative polymers that
guarantee reduced environmental
impact, greater driving safety and
improved production efficiency - 2015
Increasing safety
Decreasing environmental impact
Increasing production efficiency is the steady amount of R&D
investments for the 2014-2017 period
7% OF PREMIUM TYRE REVENUES
15

GROWTH: PRODUCT DEVELOPMENT Enhancement of Green and Safety performance
Rolling Resistance
Wet grip
Noise
BASE -10% -20%
BASE +5% maintained
BASE -12% -15%
TRUCK
BASE -0% -10%
BASE +20% +40%
MOTO
BASE -20% -40%
BASE +5% maintained
BASE -10% -20%
CAR
2007 Today 2020 2007 Today 2020 2007 Today 2020
CAR
Rolling Resistance
Mileage
Noise Dry grip
Wet grip
Weight
TRUCK
Traction Handling
Weight
Rolling Resistance Noise
Mileage
Retreadibility
Tear
Resistance
Wet Braking Weight
Rolling Resistance Predictability
Wet Performance Mileage
Braking
MOTO
Current generation Previous generation (before 2007) 2015 2020
Less CO2 emissions
Better living environment
Increased tyre life
Less impact on natural resources
Less rolling resistance
Less noise
Increased mileage
Less weight
TARGET 2020
Milan – Rome – Milan (1,100 km)
Old tyre vs. 2020 Pirelli tyre:
- 14 litres gasoline
- 42 kg CO2
16

2011
48%
37%
40%
42%
47%
CONSOLIDATED PLAN
45% postponed
GROWTH: PIRELLI GREEN PERFORMANCE REVENUES
• Strong growth of Tyre Green Performance revenues on total Tyre revenues
• The key performance indicator covers products with Rolling Resistance and Wet Grip in the A, B, C classes of
EU Tyre label. The strictest rule applies to:
• all Tyre business units (CAR, TRUCK, MOTO, AGRO)
• worldwide products and markets
• Target set in 2010 (45% by 2013) to be reached in 2015 in line with market slowdown impacts
Tyre revenues driven by sustainable products
2012 2013 2015 2017
17
AGENDA
18
PIRELLI SUSTAINABILITY TODAY
ACKNOWLEDGEMENTS AND ACHIEVEMENTS
THE EVOLVING CONTEXT
SUSTAINABILITY PLAN:
RETURN ON CAPITAL • GROWTH
• PRODUCTIVITY
• GOVERNANCE & RISK MANAGEMENT

PRODUCTIVITY
2009 2010 2011 2012 2013 2014 2015 2016 2017
100*
97
99 100
98
92
88
85
100 99 102 102
96
91
88
2020
82
85
Energy consumption & CO2 emissions
-18% ENERGY SPECIFIC CONSUMPTION 2020
-15% CO2 SPECIFIC EMISSION 2020
15 €/mln will be invested in energy efficiency projects in 2014-17 with expected savings of ~25 €/mln
and environmental benefits equal to 6,400,000 GJ of energy saved and 400,000 tons of avoided CO2
85 postponed
91
94
CONSOLIDATED PLAN TARGET
• Energy consumption and CO2 emissions expected to strongly decrease by 2020
• Targets set in 2010 of -15% by 2015 vs. 2009 for both energy and CO2 are postponed to 2017 and 2020 respectively, due to the economic slowdown for energy, and disproportionate growth of productive volume in carbon-intensive markets for CO2
• New pilot projects (photovoltaic plants, solar heat plants, biomass heat plants) are planned to balance the growth of CO2 emissions in carbon-intensive markets
• 20 Mln € invested since 2010, already saved 10.6 Mln€ with an environmental advantage of 1,600,000 GJ of energy saved and 50,000 tons of avoided CO2
* Value calculated in % and normalized on tons of produced tyres; trends restated with new acquisitions (Russia)
19

100*
93
76
83
72 68
64
58 50
PRODUCTIVITY Water withdrawal
42
* Value calculated in % and normalized on tons of produced tyres; trends restated with new acquisitions (Russia)
30 postponed and restated -58% WATER SPECIFIC WITHDRAWAL 2020
Driving our investment also based on a water-availability risk scenario;
11,000,000 m3 of water saved since 2010 and 2,700,000 m3 to be saved in 2014-17 period
• Water withdrawal trend strongly decreased and improvement is expected to continue until 2020, with a target of -50% by
2017 and of -58% by 2020 vs. 2009
• Target set in 2011 of -70% by 2015 vs. 2009 is postponed because of the economic slowdown and investment
rationalization
2009 2010 2011 2012 2013 2014 2015 2016 2017 2020
CONSOLIDATED PLAN TARGET
20

73* 70
76
82 83 84
85
88 90
• Target for waste recovery rate on track (85% by 2015)
• Target no waste to landfill by 2020 (≥95% by 2020)
• Efficiency actions for scrap internal recovery: ~60 €/mln savings in the 2013-17 period
PRODUCTIVITY Waste recovery
>95
*Trends restated with new acquisitions (Russia)
Towards zero waste to landfill
>95% WASTE RECOVERY RATE 2020
2009 2010 2011 2012 2013 2014 2015 2016 2017 2020
CONSOLIDATED PLAN TARGET
21

MERIT & ETHICS
• Remuneration Policy alignment with Pirelli development strategy through long-term
Incentive plans
• Non-financial targets in Executive evaluation system
TRAINING & EDUCATION
• Further increase the T&E investment: from 5.5 man/days on average in 2013 to 7
man/days on average in 2015, and ≥7 onwards
• Academies dedicated to specific training for each Professional Family
• School of Management: cross-function soft skills and leadership training
OCCUPATIONAL HEALTH & SAFETY
• Engaging Employees in safety as a culture: Target Accident Frequency Index ≤0.2 in
2020
DIVERSITY
• Representation of Women in the Board: 15%
• Women in management positions: 19%
• 91% of Employees work outside Italy
• 61% of senior manager experienced at least an expat during her/his career
• New proxy matching performance, grade, seniority, etc. to identify any remuneration
gap
DIALOGUE & RULES
• Regular consultation of our Employees through opinion surveys: new Trust Index
measurement
• Applying the same Procedures and Policies group-wide
PRODUCTIVITY: HUMAN CAPITAL MANAGEMENT An employer of choice strategy
22
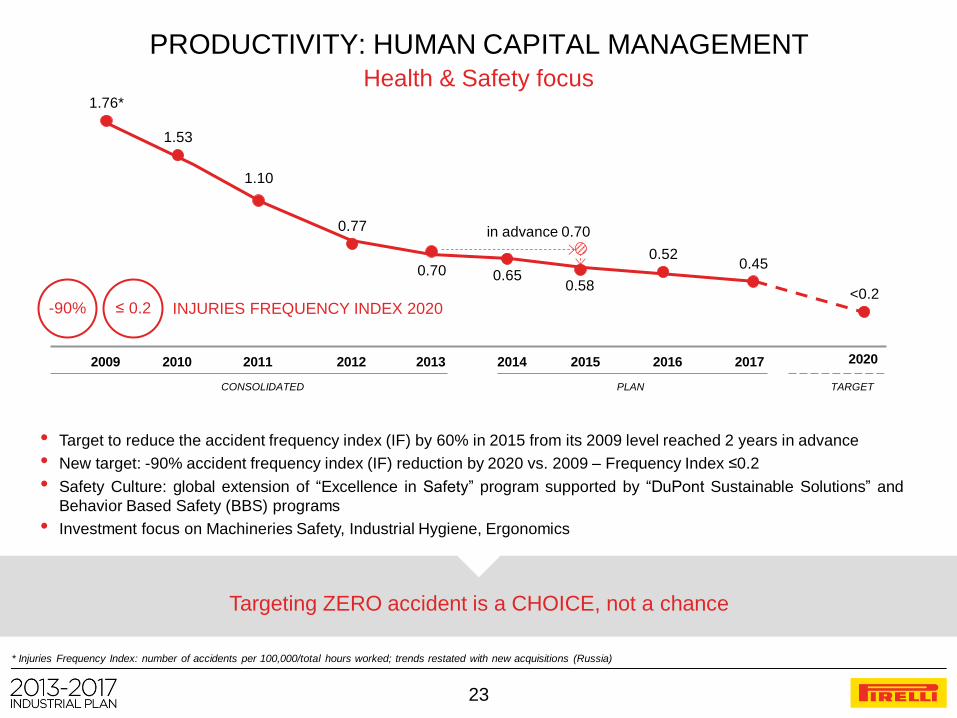
Targeting ZERO accident is a CHOICE, not a chance
23
2009 2010 2011 2012 2013 2014 2015 2016 2017 2020
• Target to reduce the accident frequency index (IF) by 60% in 2015 from its 2009 level reached 2 years in advance
• New target: -90% accident frequency index (IF) reduction by 2020 vs. 2009 – Frequency Index ≤0.2
• Safety Culture: global extension of “Excellence in Safety” program supported by “DuPont Sustainable Solutions” and
Behavior Based Safety (BBS) programs
• Investment focus on Machineries Safety, Industrial Hygiene, Ergonomics
1.76*
1.53
1.10
0.77
0.70 0.65 0.58
0.52 0.45
<0.2
in advance 0.70
CONSOLIDATED PLAN TARGET
≤ 0.2 INJURIES FREQUENCY INDEX 2020 -90%
PRODUCTIVITY: HUMAN CAPITAL MANAGEMENT Health & Safety focus
* Injuries Frequency Index: number of accidents per 100,000/total hours worked; trends restated with new acquisitions (Russia)

AGENDA
24
PIRELLI SUSTAINABILITY TODAY
ACKNOWLEDGEMENTS AND ACHIEVEMENTS
THE EVOLVING CONTEXT
SUSTAINABILITY PLAN:
RETURN ON CAPITAL • GROWTH
• PRODUCTIVITY
• GOVERNANCE & RISK MANAGEMENT
25
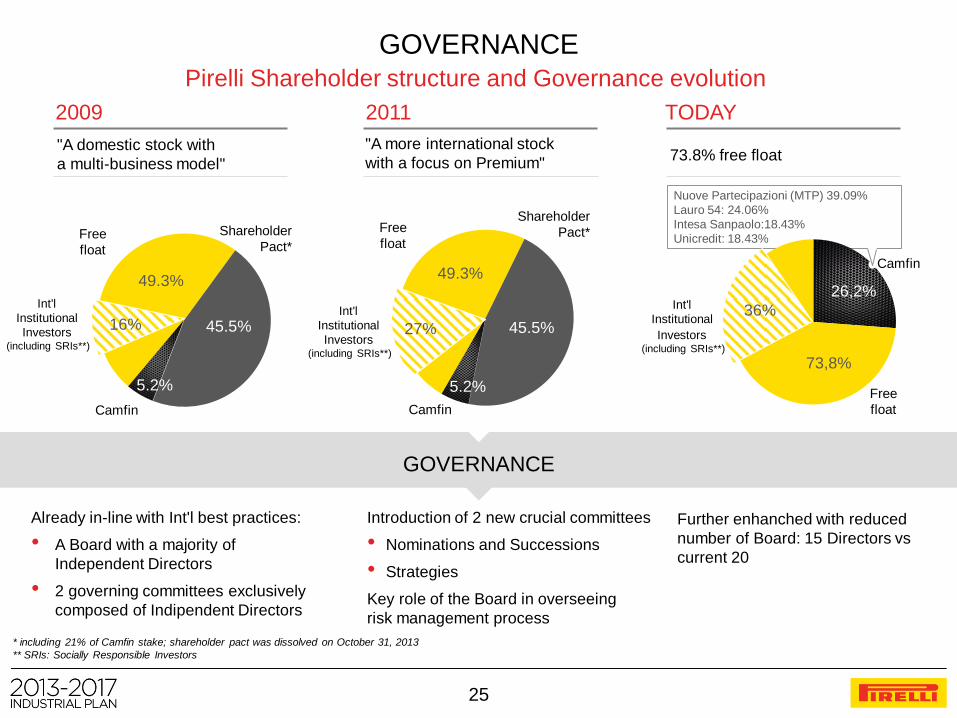
"A domestic stock with
a multi-business model"
"A more international stock
with a focus on Premium"
Already in-line with Int'l best practices:
• A Board with a majority of
Independent Directors
• 2 governing committees exclusively
composed of Indipendent Directors
2009 2011
73.8% free float
TODAY
49.3%
45.5%
5.2%
Shareholder
Pact*
Camfin
Free
float
16%
49.3%
45.5%
5.2%
Free
float
Camfin
Shareholder
Pact*
Int'l
Institutional
Investors (including SRIs**)
27%
Camfin
36%
Free
float
26,2%
73,8%
Nuove Partecipazioni (MTP) 39.09%
Lauro 54: 24.06%
Intesa Sanpaolo:18.43%
Unicredit: 18.43%
GOVERNANCE
Introduction of 2 new crucial committees
• Nominations and Successions
• Strategies
Further enhanched with reduced
number of Board: 15 Directors vs
current 20
Key role of the Board in overseeing
risk management process
* including 21% of Camfin stake; shareholder pact was dissolved on October 31, 2013
** SRIs: Socially Responsible Investors
GOVERNANCE Pirelli Shareholder structure and Governance evolution
Int'l
Institutional
Investors (including SRIs**)
Int'l
Institutional
Investors (including SRIs**)

PBIT@Risk and CASH_FLOW@Risk
ENTERPRISE RISK MANAGEMENT 360°approach
Business interruption
Health and safety
Environment
Information technology
Asset & people security
Business compliance
Product innovation
Industrial capacity and
process quality
HR management
JV and M&A
Tax planning
Financial assets & liability
management
2013 2017
47
€/Mln
64
€/Mln
Risk mitigation and transfer with
investments through all operational areas
Risk-taking Risk measurement tools
and stress test analysis
Commodity price
volatility
Future regulations
Competitor and
consumer behaviour
Country risks
Exchange rates
Market trends
CAPEX and OPEX invested in Risk Mitigation / Prevention and Transfer
0,0%
0,5%
1,0%
1,5%
2,0%
2,5%
3,0%
3,5%
Pro
bability
AR PBIT [M EUR]
424 M €
74% probabilità di avere PBIT < AR PBIT 26% probabilità di avere PBIT > AR PBIT
Probabilità di avere:
PBIT < 540 M€ 19 %
540 < PBIT < 599,5 M€ 55 %
599,5 < PBIT < 660 M€ 25 %
PBIT > 660 M€ 1 %
718 M €
660 M €
PBIT atteso 572,6 M€
AR PBIT 599,5 M€
540 M €
CAGR
+8.3%
26
STRATEGIC BUSINESS RISKS OPERATIONAL TRANSVERSAL RISKS
Risk
minimization
& business
continuity

ESG DRIVERS INTEGRATED INTO GROUP-WIDE SUPPLY CHAIN MANAGEMENT
• Scouting and homologation phases: ESG assessment (weight of Sustainability score is 33% on final selection rate)
• Contractual phase: Sustainability Clauses
• Risk Assessment: Economic, Environmental, Social, Governance, Reputation with an ESG Vendor rating phase
through third party audits – 190 Audits performed = 100% of Suppliers at risk assessed since 2009
NEW GREEN SOURCING POLICY
• Key concepts: “lifecycle” and “reduction, reuse and recovery”
• From Engineering to Logistics: broadening the organization vision to reduce the environmental impact of purchased
goods and services throughout the entire supply chain
SUSTAINABILITY IN SUPPLIERS AWARD
• Acknowledging Suppliers sustainable performance on Economics, Environmental, Social, Business Ethics as a
competitive advantage
SPREADING SUSTAINABLE DEVELOPEMENT IN NATURAL RUBBER VALUE CHAIN
• Proactive role within International Rubber Study Group (IRSG) to draft “ Sustainability in Natural Rubber Industry”
standard
Governance and Engagement
SUPPLY CHAIN RISK
* ESG: Environmental, Social, Governance
27

PIRELLI VISION 2020
SMART, EFFICIENT, PROFITABLE, INNOVATION-DRIVEN
ACCOUNTABLE AND ENGAGED TO ITS STAKEHOLDERS
A SUSTAINABLE COMPANY
28

DISCLAIMER
29
This presentation contains statements that constitute forward-looking statements based on Pirelli & C SpA’s current
expectations and projections about future events and does not constitute an offer or solicitation for the sale, purchase or
acquisition of securities of any of the companies mentioned and is directed to professionals of the financial community.
These statements appear in a number of places in this presentation and include statements regarding the intent, belief or
current expectations of the customer base, estimates regarding future growth in the different business lines and the global
business, market share, financial results and other aspects of the activities and situation relating to the Company. \
Such forward looking statements are not guarantees of future performance and involve risks and uncertainties, and actual
results may differ materially from those expressed in or implied by these forward looking statements as a result of various
factors, many of which are beyond the ability of Pirelli & C SpA to control or estimate precisely. Consequently it is
recommended that they be viewed as indicative only.
Analysts are cautioned not to place undue reliance on those forward looking statements, which speak only as of the date of
this presentation.
Pirelli & C. SpA undertakes no obligation to release publicly the results of any revisions to these forward looking statements
which may be made to reflect events and circumstances after the date of this presentation, including, without limitation,
changes in Pirelli & C. SpA business or acquisition strategy or to reflect the occurrence of unanticipated events.
Statement
The Manager mandated to draft corporate accounting documents of Pirelli & C. SpA. Francesco Tanzi, attests – as per
art.154-bis. comma 2 of the Testo Unico della Finanza (D.Lgs. 58/1998) – that all the accounting information contained in this
presentation correspond to the documented results, books and accounting of the Company.