Embed Size (px)
Citation preview

NBER WORKING PAPER SERIES
CAPITAL STRUCTURE WITH RISKYFOREIGN INVESTMENT
Mihir A. DesaiC. Fritz Foley
James R. Hines Jr.
Working Paper 12276http://www.nber.org/papers/w12276
NATIONAL BUREAU OF ECONOMIC RESEARCH1050 Massachusetts Avenue
Cambridge, MA 02138May 2006
The statistical analysis of firm-level data on U.S. multinational companies was conducted at the InternationalInvestment Division, Bureau of Economic Analysis, U.S. Department of Commerce under arrangements thatmaintain legal confidentiality requirements. The views expressed are those of the authors and do not reflectofficial positions of the U.S. Department of Commerce. The authors thank Rohan Williamson, Bill Zeile,Marc Zenner, and various seminar participants for helpful comments and the Division of Research at HarvardBusiness School for generous funding. The views expressed herein are those of the author(s) and do notnecessarily reflect the views of the National Bureau of Economic Research.
©2006 by Mihir A. Desai, C. Fritz Foley and James R. Hines Jr. All rights reserved. Short sections of text,not to exceed two paragraphs, may be quoted without explicit permission provided that full credit, including© notice, is given to the source.

Capital Structure with Risky Foreign InvestmentMihir A. Desai, C. Fritz Foley and James R. Hines Jr.NBER Working Paper No. 12276May 2006JEL No. F23, G32, G15, G18
ABSTRACT
American multinational firms respond to politically risky environments by adjusting their capitalstructures abroad and at home. Foreign subsidiaries located in politically risky countries havesignificantly more debt than do other foreign affiliates of the same parent companies. American firmsfurther limit their equity exposures in politically risky countries by sharing ownership with localpartners and by serving foreign markets with exports rather than local production. The residualpolitical risk borne by parent companies leads them to use less domestic leverage, resulting in lowerfirm-wide leverage. Multinational firms with above-average exposures to politically risky countrieshave 8.4 percent less domestic leverage than do other firms. These findings illustrate the impact ofrisk exposures on capital structure.
Mihir A. DesaiGraduate School of Business AdministrationHarvard UniversitySoldiers FieldBoston, MA 02163and [email protected]
C. Fritz FoleyHarvard Business SchoolSoldiers FieldBoston, MA 02163and [email protected]
James R. Hines Jr.Department of EconomicsUniversity of Michigan611 Tappan StreetAnn Arbor, MI 48109-1220and [email protected]

1
1. Introduction
The business risks associated with investment carry implications for firm financial
decisions. The relationship between risk exposures and firm financial decisions is an
element of many theories of capital structure, but these theories have received mixed
empirical support. Multinational firms operating around the world face a wide variety of
political regimes and associated business risks. This paper examines how exposures to
political risks influence the financing choices of multinational firms in order to explore
the relationship between capital structure and risky investments.
Using detailed data on American multinational firms, the analysis begins by
considering the extent to which reported political risks translate into distinctive return
environments for multinational firms. The evidence indicates that investment returns of
subsidiaries of the same parent are more volatile in countries that are politically riskier.
An increase in political risk corresponding to the difference between Canada and Mexico
translates into an increase in the standard deviation of the return on assets of a
multinational subsidiary equal to 13.5% of its mean value. This increased volatility of
returns is also manifest in a greater likelihood of annual losses among foreign affiliates in
politically risky countries.
Multinational firms facing costly external finance have incentives to manage their
capital structures in two ways that mitigate risks imposed by foreign business
environments. First, such firms should economize on equity in politically risky locations.
Second, firms exposed to foreign risks should reduce aggregate leverage. As limiting
foreign equity exposures typically entails taking on greater debt in risky foreign
locations, aggregate leverage can fall only if firms borrow less domestically and in
relatively safe foreign locations. Such behavior entails managing political risks by
shifting some of the risks to foreign capital providers for whom it is relatively less costly,
and by foregoing some of the benefits of high levels of aggregate debt finance.
The behavior of American multinational firms broadly supports these predictions.
The analysis indicates that foreign subsidiaries located in politically risky countries are
more highly levered than other foreign subsidiaries of the same multinational parents.
The difference in political risk between Canada and Mexico translates into a difference in
2
subsidiary leverage equal to 4.3% of its mean value. Efforts to economize on equity
extend beyond financing decisions to operational decisions. Multinational firms serving
politically risky foreign markets are more likely to share ownership with local partners
and to serve customers through exports from the United States rather than produce
locally. Multinational firms alter both financial and operating decisions to hedge their
exposures in politically risky markets.
Parent companies exposed to significant foreign political risks are also shown to
use less debt domestically than parent companies without such exposures. A one
standard deviation increase in exposure to foreign risks reduces domestic leverage by
3.2% of its mean level. This effect is large enough that overall firm leverage falls,
despite the greater leverage of affiliates in risky countries. The estimated effects are
similar whether political risk is defined as an aggregate measure of country conditions or
as an index that focuses more narrowly on political institutions. These results highlight a
cost of operating in politically risky markets and illuminate the degree to which risk
exposures can influence financing decisions.
The results in this paper are related to earlier studies of the determinants of capital
structure decisions, the distinctive nature of finance in emerging markets, and the
determinants of multinational financing and investment behavior. As reviewed in Harris
and Raviv (1991), empirical efforts to link the volatility of firm or industry returns to
capital structure decisions have not provided strong or consistent results. The more
recent literature on determinants of cash holdings similarly emphasizes the role of
volatility, as in Opler, Pinkowitz and Stulz (1999). The relative absence of results on the
role of volatility in determining capital structure is particularly surprising given that the
Graham and Harvey (2001) survey of Chief Financial Officers finds that informal criteria
such as financial flexibility, credit ratings, and the volatility of earnings and cash flows
are the most important debt policy factors. The results in this paper employ
heterogeneity in exposures to political risk to identify the role of firm risk on capital
structure, finding significant effects in the multinational setting.1
1 Evidence of the impact of risk on the capital structures of foreign affiliates extend the results of Geczy, Minton and Schrand (1997), Kedia and Mazumdar (2003) and Allayanis, Brown and Klapper (2003) on hedging decisions in emerging markets by considering the response of multinational firms.

3
As noted in Bekaert (1995), Harvey (1995) and Bekaert and Harvey (1997, 2000),
stock markets in emerging markets feature distinctive return distributions, and in
particular, aspects of institutional environments, including measures of political risks,
contribute to higher return volatilities. The evidence indicates that these patterns carry
over for multinational firms operating in risky environments, providing some support for
the various capital budgeting practices, described in Sabal (2004), used to capture risks.
Corporate finance practices in emerging markets have also received increasing attention
with particular emphasis on the role of legal or contractual institutions, as in La Porta,
Lopez-de-Silanes, Shleifer and Vishny (1997, 1998). While several studies trace the
effects of legal or contracting rules on financing and investment patterns, Acemoglu and
Johnson (2005) emphasize the distinction between property rights institutions
(protections from expropriation by the state) and contractual institutions (the environment
for enforcing contacts between private parties), showing that property rights institutions
more strongly affect economic outcomes than do contractual institutions. Indeed,
Bekaert, Harvey and Lundblad (2005, forthcoming) and Bekaert, Harvey, Lundblad and
Siegel (forthcoming) find that political institutions mediate the effects of capital markets
liberalizations. This analysis of the behavior of American multinational firms offers
evidence of the distinctive role of political institutions in influencing financing decisions.
The choice between serving foreign customers through exports and foreign direct
investment (FDI) has been traced to tariffs, as in Helpman (1984), or firm attributes, as in
Helpman, Melitz and Yeaple (2004). The results in this paper add political risk as
another determinant of the export/FDI decision. Desai, Foley and Hines (2004a, 2004b)
emphasize capital market conditions and the importance of intrafirm transactions in
dictating ownership and financing decisions. The evidence indicates that political risk
appears to shape these decisions as well, and to have aggregate effects on multinational
firms operating in these markets.
Section 2 of the paper motivates subsequent empirical tests by sketching the
effects of business risks on the financing of multinational firms. Section 3 describes the
available data on the operations of American firms. Section 4 presents empirical
evidence of the effects of political risk on business outcomes in foreign countries, the
4
financing decisions of subsidiaries, and the domestic and total leverage of multinational
companies. Section 5 is the conclusion.
2. Business risks and capital structure
Exposures to business risks have the potential to influence capital structure in a
variety of ways. The relationship between business risks and the capital structures of
multinational firms is affected by the separate incorporation of activities around the world
and the possibility of segmented capital markets. This section considers the impact of
political risks on the behavior of multinational firms facing costly external financing.
Political risks contribute to the uncertainty of returns to foreign investment by
introducing the possibility that foreign governments will take arbitrary actions that
directly or indirectly influence the returns of American investors.2 This uncertainty is
costly in environments in which parent companies may require the use of costly external
finance.
Multinational firms can respond to political risk exposures in at least three ways.
The first, and most obvious, response is to avoid or limit risky investments relative to
what would be consistent with maximizing expected returns. Multinational firms can
limit their investments by sharing ownership with local owners or by serving customers
in politically risky countries through exports from the United States rather than through
local production. The second response is to modify the financing of investments in
political risky countries to allow for risk sharing with local lenders. Finally, firms can
reduce domestic borrowing to mitigate the potential costs of risky foreign return streams.
When parent firms reduce their foreign equity exposures by financing foreign
investments with debt or by taking joint venture partners, another party assumes the
residual risk. Why would unrelated parties find such investments worthwhile, particularly
in view of the moral hazard costs that are intrinsic to such risk-sharing arrangements?
There are a number of reasons to expect such investments to be priced in a way that
would make them attractive to outside investors. First, local investors may be more
2 Nearly all affiliates are separate legal entities from their parents and, as documented in Desai, Foley, and Hines (2004b), financial claims on affiliates do not represent claims on the affiliate’s parent. Therefore, a parent’s exposure to political risk does not extend beyond the equity and debt provided by the parent to finance the affiliate. This exposure is, on average, equal to 42% of the value of affiliate assets.

5
knowledgeable of the true extent of these risks and ways of avoiding them. Such
investors may be better able to assess what actions are required to be in compliance with
regulations and to assuage the interests of political actors. Second, political actors may
be less likely to take actions that run counter to the interests of local, as opposed to
foreign, investors. Local investors could be more important constituents to politicians
than foreign ones since they are likely to have stronger ties to the local community.
Third, local investors in politically risky countries may face limited investment choices.
Political riskiness can manifest itself in the adoption of regulations that restrict the range
of allowable investments by domestic firms and individuals. Foreign investors seeking to
borrow locally or to start a joint venture provide a ready outlet for local investment funds
for which the opportunity cost is low. Any of these reasons would make local investors
more tolerant of political risk than foreign investors and make them price such risk
differently than foreign investors.
While sharing their foreign risks with investors who price this risk differentially,
multinational investors can also reduce the costs of foreign income fluctuations by
modifying their domestic capital structures. Reduced domestic leverage lowers the
likelihood that a firm is unable to meet its contractual obligations. Consequently, firms
with particularly risky cash flows will stand to benefit from reducing their exposures to
these risks by reducing their leverage. The following sections consider evidence of the
extent to which American firms respond to these incentives.
3. Data
The empirical work presented in section 4 is based on the most comprehensive
available data on the activities of American multinational firms. The Bureau of
Economic Analysis (BEA) annual survey of U.S. Direct Investment Abroad from 1982
through 1999 provides a panel of data on the financial and operating characteristics of
U.S. firms operating abroad.3 U.S. direct investment abroad is defined as the direct or
indirect ownership or control by a single U.S. legal entity of at least ten percent of the
voting securities of an incorporated foreign business enterprise or the equivalent interest
in an unincorporated foreign business enterprise. A U.S. multinational entity is the
3 Coverage and methods of the BEA survey are described in Desai, Foley and Hines (2002).

6
combination of a single U.S. legal entity that has made the direct investment, called the
U.S. parent, and at least one foreign business enterprise, called the foreign affiliate. As a
result of confidentiality assurances and penalties for noncompliance, BEA believes that
coverage is close to complete and levels of accuracy are high.
The foreign affiliate survey forms that U.S. multinational enterprises are required
to complete vary depending on the year, the size of the affiliate, and the U.S. parent’s
percentage of ownership of an affiliate. The most extensive data for the period examined
in this study are available for 1982, 1989, 1994, and 1999 when BEA conducted
Benchmark Surveys. For 1982, 1989 and 1994, all affiliates with sales, assets, or net
income in excess of $3 million in absolute value and their parents were required to file
extensive reports; in 1999, the exemption limit increased to $7 million.4
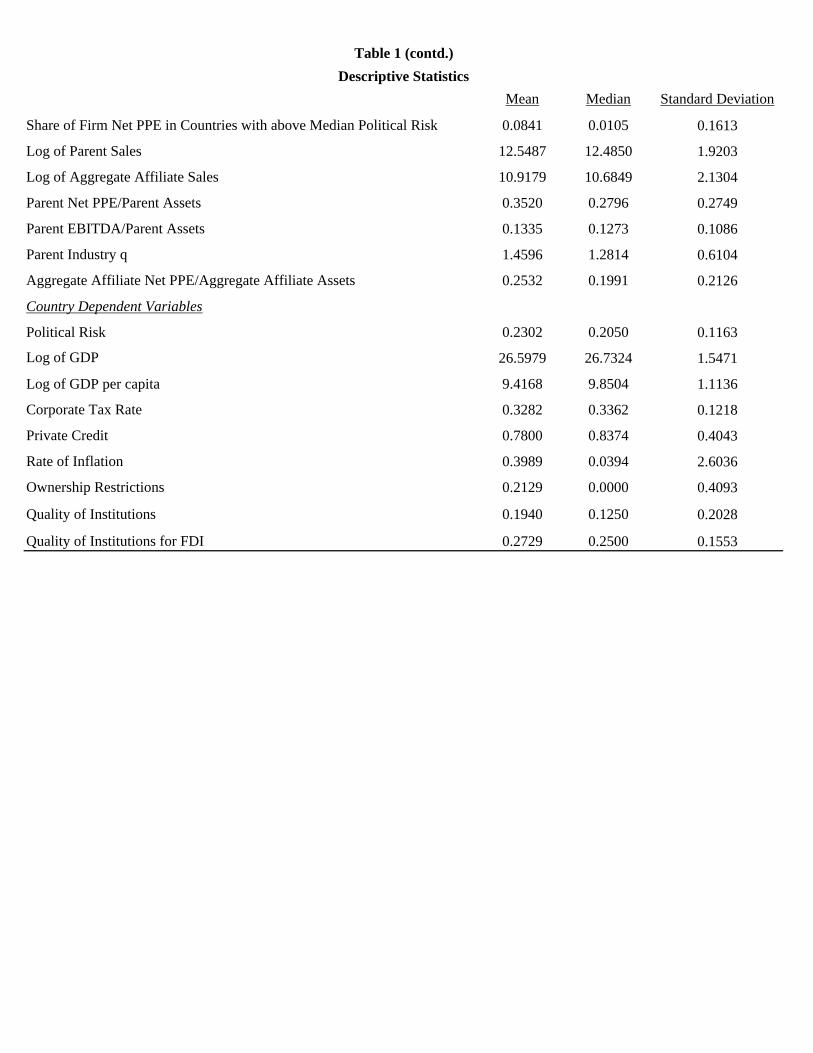
The first panel of Table 1 provides descriptive statistics for the dependent
variables investigated below including measures of the return experiences of affiliates,
affiliate leverage, ownership and export decisions, and parent domestic and parent
worldwide leverage. These measures are typically based only on benchmark year data
with the exception that variables describing the return experiences of multinational firms
use a panel of annual data that includes benchmark years. The second and third panels of
Table 1 provide descriptive statistics for the independent variables that are, respectively,
firm or country specific.
An index of country specific, time varying political risk is available from the
International Country Risk Guide (ICRG). This guide assigns numbers between 0 and
100 to countries that represent aggregations of various components of political stability.5
The political risk variables used in the analysis equal one minus the ratio of the
4 In non-benchmark years, exemption levels were higher and less information was collected. From 1983 to 1988, data on affiliates with sales, assets, or net income greater than $10 million were collected, and this cutoff rose to $15 million for 1990-1993 and $20 million for 1995-1998. 5 The International Country Risk Guide data are compiled by the editors of International Reports based on subjective evaluations of specific features of local political conditions in each country. These specific features are aggregated to produce local measures of government stability, socioeconomic conditions, investment profile, internal conflict, external conflict, corruption, military in politics, religious tensions, law and order, ethnic tensions, democratic accountability, and bureaucracy quality; and, in turn, these measures are aggregated to produce single measures of local political stability. The analysis uses annual measures of monthly averages. Since these data are available from 1984 onwards, 1984 data are used for the 1982 period in the BEA data. The International Country Risk Guide methodology is described in detail at www.icrgonline.org. Further analysis employing selected components of the index is described below.
7
corresponding ICRG measures to 100, thereby imposing that measures of political risk lie
between 0 and 1, with higher numbers corresponding to greater political instability.
The political risk measure exhibits considerable variation, with a mean value
across all affiliate-year observations of 0.2302, and a standard deviation of 0.1163. In
1989, for example, Canada had a value of 0.13, Mexico a value of 0.33, and Nigeria a
measure of 0.53. While such measures are sufficient to characterize political risk
exposures of individual subsidiaries, characterizing parent company political risk
exposures requires aggregation across foreign subsidiaries. Parent measures of risk
exposures are created by taking the share of worldwide activity, measured by sales,
employment or net PPE, in countries evaluated to have political risk above the median
level of 0.2050. These measures indicate that, on average, parents have about 10% of
their activities in such risky countries.
4. Empirical Results
This section presents evidence of the impact of foreign political risks on
investment returns and financial decisions of American multinational firms.
4.1. Multinational return characteristics in politically risky countries
While previous studies describe links between political risks and stock market
return variability, it is useful to consider the extent to which multinational firms are
exposed to political risks. Some multinational firms have market positions and political
power that could limit the exposure to political risk relative to local individual investors.
Furthermore, previous studies of stock market returns may reflect capital market
conditions rather than the operating environments of individual firms.
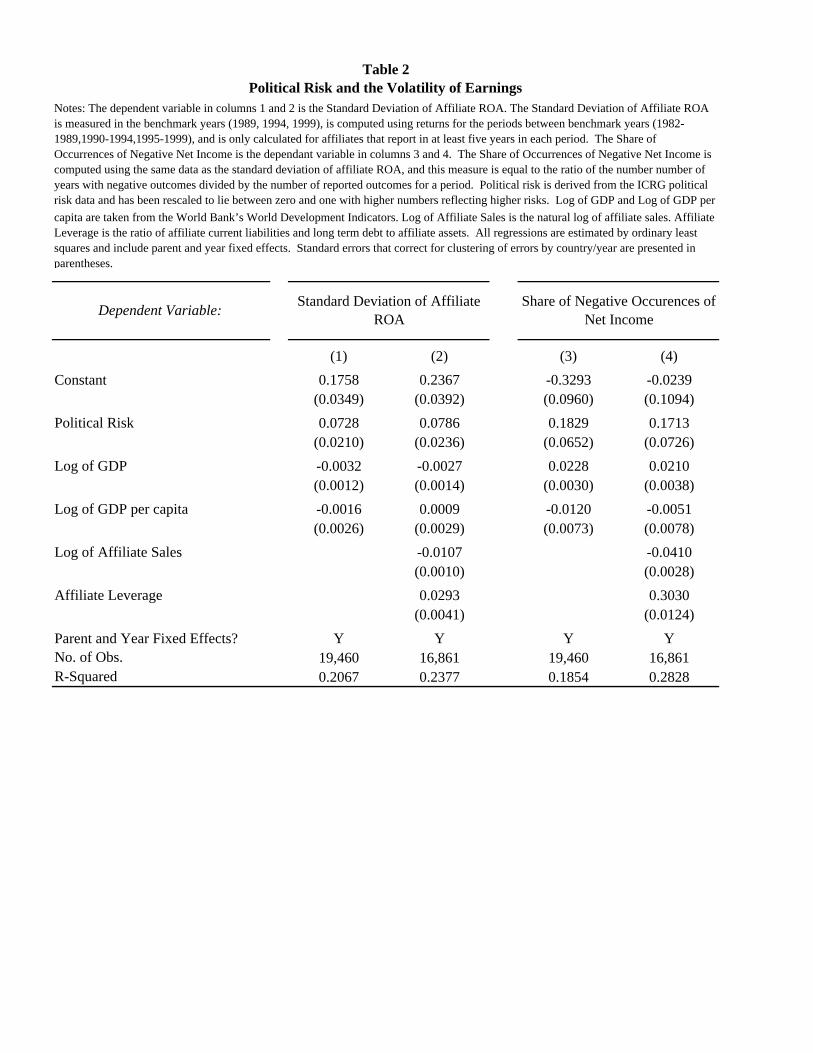
An analysis of multinational firm returns reflects the impact of political risk on
operational outcomes. Table 2 presents the results of estimating the effect of political risk
on two different measures of earnings volatility. The first two columns of Table 2 report
estimated coefficients from regressions in which the dependent variable is the standard
deviation of an affiliate’s local return on assets, calculated only for those affiliates that

8
report at least five times between benchmark years.6 Column 1 presents estimated
coefficients from regressing these standard deviations on political risk, log of GDP, and
log of GDP per capita. The estimated 0.0728 coefficient in column one implies that 0.1
higher political risk (approximately a one standard deviation change in political risk) is
associated with a 0.0073 higher standard deviation of returns. Evaluated at the mean
standard deviation of return on assets of 0.0866, this corresponds to an 8.4 percent greater
variability of returns. Log of GDP and log of GDP per capita are both negatively
associated with the standard deviation of returns, though only the effect of GDP is
statistically significant. It is noteworthy that this regression, along with all others
reported in Table 2, includes parent company and year fixed effects as independent
variables, so the effect of political risk is identified by comparing the variability of
returns earned by affiliates of the same company located in different foreign countries in
the same period.
More variable returns may reflect endogenous operational and financial decisions
in response to political risk. In order to explore this possibility, the regression reported in
column two includes independent variables corresponding to affiliate size and leverage.
The estimated effects of these variables indicate that small affiliates, and those financed
disproportionately with debt, exhibit the greatest return variability. The –0.0107
coefficient in column two implies that reducing the size of a foreign affiliate by ten
percent increases the standard deviation of its rate of return by approximately 0.11
percent, which would represent a 1.3 percent increase at the sample mean. The 0.0293
coefficient reported in column two implies that increasing affiliate leverage by seven
percent of its mean value of 0.5446 similarly increases the standard deviation of returns
by 0.11 percent. Inclusion of these variables slightly increases the estimated effect of
political risk on the standard deviation of returns.
While the standard deviation of returns is a conventional measure of risk, many
claims about the role of political risk suggest a greater likelihood of negative returns.
Table 1 reports that foreign affiliate net income is negative 21.65 percent of the time.
Columns 3 and 4 of Table 2 present regressions in which the dependent variable is the 6 Accordingly, there is a maximum of three observations for each affiliate, representing standard deviations of returns separately calculated for 1982-1989, 1990-1994, and 1995-1999.
9
fraction of the years between benchmark surveys in which net income is negative, and the
independent variables are the same as those in the regressions presented in columns 1 and
2. The 0.1829 coefficient on political risk in column 3 implies that 0.1 higher political
risk is associated with a 1.8 percent greater chance that annual returns are negative,
thereby raising the chance of negative returns by 8.3 percent. Greater political risk
appears to influence both the volatility of returns and the likelihood of a negative
outcome.7
4.2. Political risk and the capital structures of foreign affiliates
Table 3 presents estimates of the determinants of foreign affiliate capital structure.
The dependent variable in the regressions reported in columns 1 and 2 is the ratio of
affiliate debt to total assets, and the independent variables include measures of affiliate
size, capital intensity and profitability, as well as country-specific variables such as tax
rates, extent of private credit availability, inflation, log GDP, log GDP per capita, and of
course political risk.
The regressions reported in Table 3 indicate that greater political risk is associated
with higher levels of affiliate leverage. The 0.1062 coefficient in column 1 implies that a
0.1 higher level of political risk induces firms to increase their leverage by 1.062 percent
of assets, which is 2.0 percent of the mean debt/assets ratio. Noteworthy among the other
results is the 0.2365 coefficient on the host country tax rate, a reflection of benefits of the
tax deductibility of interest payments to creditors but not dividend payments to
shareholders; this tax effect is consistent with those reported by Desai, Foley and Hines
(2004b). Adding inflation, log of GDP, and log of GDP per capita as independent
variables increases the estimated coefficient on political risk by 45 percent, to 0.1544.
All of the regressions in Table 3 include dummy variables for parent firms and affiliate
industries.
A variety of recent empirical efforts identify the particular role of cash in
financing decisions and the characterization of cash positions as negative debt. In this
context, it is possible that the estimated effects of political risk on capital structure
reported in columns 1 and 2 could reflect effects that are offset by cash positions. Higher 7 Additional analysis indicates that mean returns do not vary systematically with political risk.
10
political risk might possibly be associated with greater borrowing together with greater
cash holdings, which would be inconsistent with the use of leverage to reduce equity
exposures.8 In order to consider this possibility, the dependent variable in the regressions
reported in columns 3 and 4 of Table 3 is the ratio of affiliate debt minus cash assets to
total affiliate assets. While the mean of this dependent variable is somewhat smaller than
that used in the regressions reported in columns 1 and 2, the estimated coefficients,
particularly those on the political risk variable, differ minimally.
In addition to altering their capital structures, parent firms can reduce their
exposures to political risks by finding partners with whom to share ownership. Table 4
presents regressions estimating the determinants of affiliate ownership by American
parent companies. The dependent variable in the regressions presented in columns 1 and
2 takes the value of one if an American affiliate is wholly owned by its parent company,
and zero otherwise; 77 percent of the sample is wholly owned. Due to the limited nature
of the dependent variable, the regressions are run as conditional logits that account for
fixed effects that are specific to parent/affiliate industry/year cells.
A higher level of local political risk significantly reduces the likelihood that an
American parent owns 100% of its foreign affiliate, as evidenced by the negative 3.6733
coefficient in column 1.9 Laws restricting the ability of foreign investors to own 100% of
local enterprises have the predictable effect of reducing 100% ownership; these laws are
described in Desai, Foley and Hines (2004a). High tax rates reduce the extent to which
affiliates are 100% owned, a phenomenon that Desai, Foley and Hines (2004a) attribute
to the need to own 100% of enterprises in low-tax countries in order to maximize
potential benefits from tax planning. Host country capital market conditions also appear
to influence ownership shares perhaps indicating the desirability of local partners in
underdeveloped capital markets. The effect of political risk on ownership shares persists
with the inclusion of additional macroeconomic variables in the regression reported in
column 2. Given the distinction in control conferred by majority ownership it is useful to 8 Hartzell, Titman, and Twite (2006) document that affiliates of U.S. multinational firms hold substantial amounts of cash as a consequence of transactions costs, precautionary motives, and the tax costs of repatriating earnings. 9 To consider the effects of clustering by country/year on the standard errors presented in this Table 4, the specifications are also run as linear probability models that allow error terms to be clustered in this manner. The coefficients on political risk remain significant in these specifications.

11
consider if these effects persist in settings where the multinational firm has at least
majority control. The regressions reported in columns 3 and 4 are run on a sample of
foreign affiliates that excludes minority owned affiliates, so the dependent variable takes
the value one if an affiliate is 100% owned, and zero if it is majority but less than 100%
owned. These regressions also indicate that greater political risk discourages whole
ownership, and the coefficients in these regressions resemble those in the regressions
reported in columns 1 and 2.
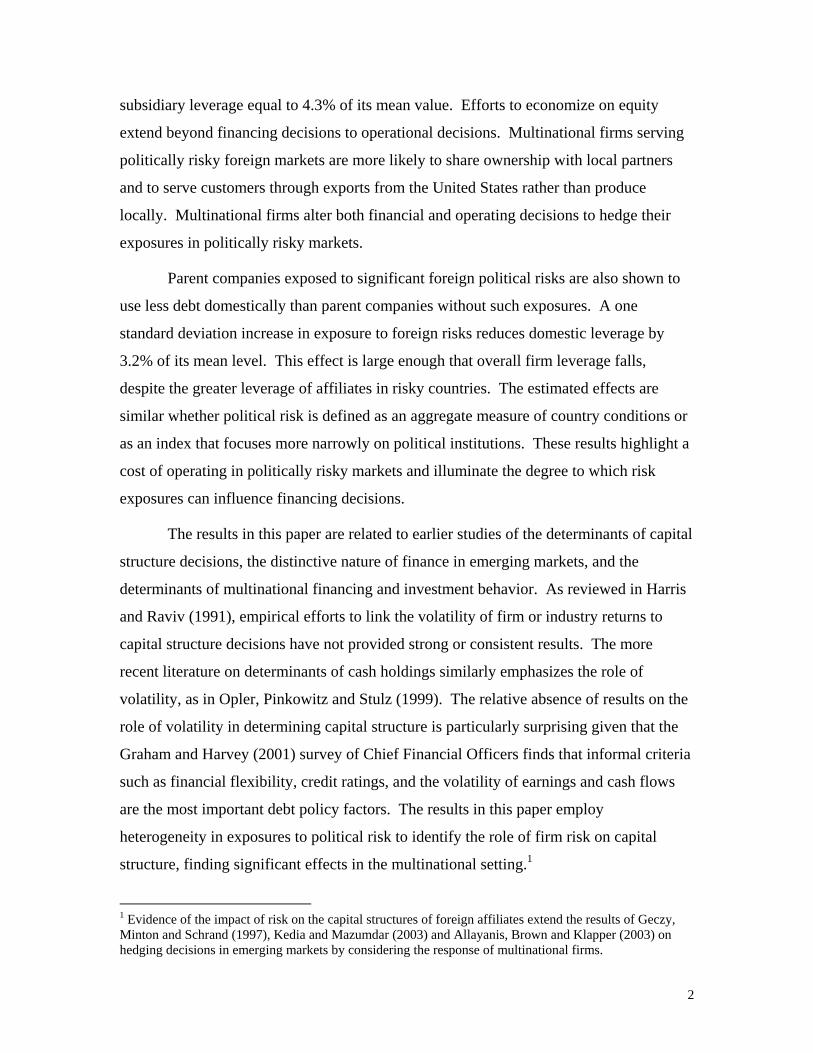
American firms can also respond to political risk by limiting their local exposures
in the most extreme manner - by serving foreign markets with exports from the United
States rather than local production. In order to consider this possibility, Figure 1
compares mean levels of local political risks in foreign locations to which American
multinational firms export but do not produce locally, and risks in locations where
American firms produce but to which they do not export.10 As the figure reveals, places
where firms locate their production are significantly less risky than those to which firms
export, a pattern that is consistent with a desire to avoid exposure to political risks.
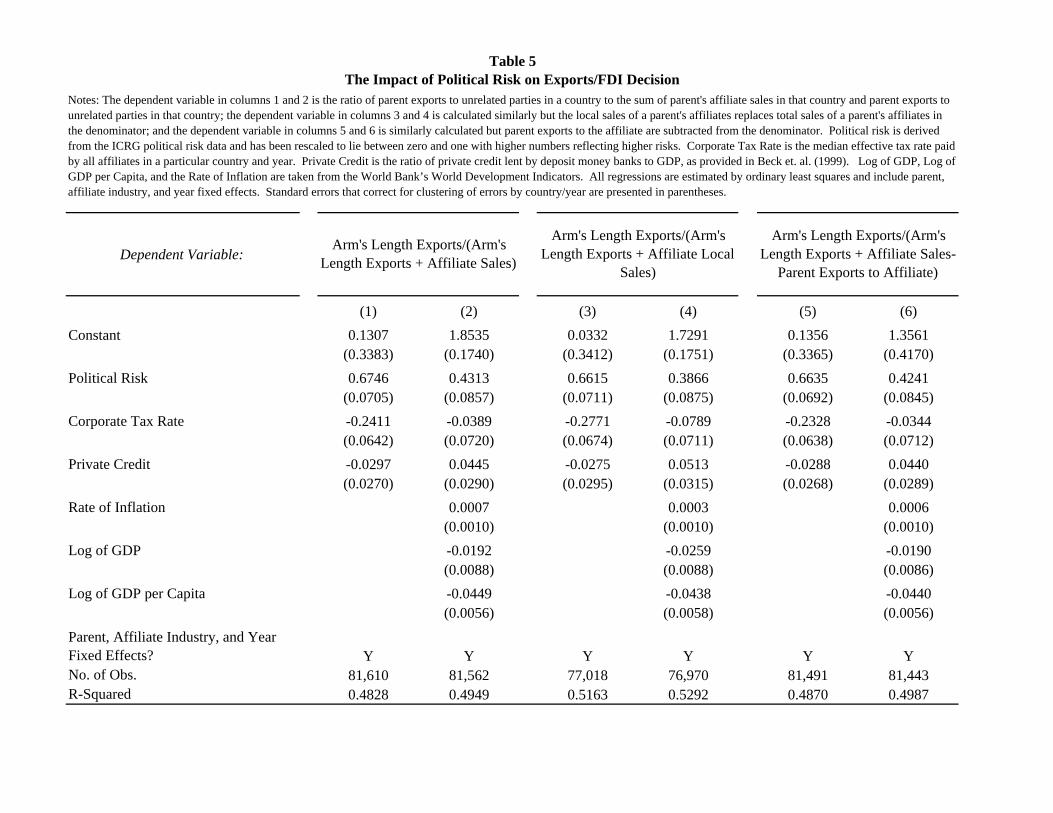
Table 5 presents regressions that estimate the determinants of the choice between
exports and local production as methods of serving foreign markets. The dependent
variable in the regressions presented in columns 1 and 2 is the ratio of the value of parent
company exports to unrelated parties to the sum of these parent exports and sales by the
parent company’s local affiliates.11 Local political risk contributes positively to this
ratio: the 0.6746 coefficient in column 1 implies that 0.1 greater political risk is
associated with a 7 percent higher ratio of exports to total local sales, increasing this ratio
by 12 percent of its mean value. The inclusion of additional macroeconomic variables in
the regression reported in column 2 reduces the estimated magnitude of this effect,
though it remains large and statistically significant. All of the regressions in Table 5
include fixed effects for parent companies, affiliate industries, and years.
10 This figure is constructed by computing the ratio of parent exports from the U.S. to a country to the sum of these exports and all sales of that parent through affiliates. A value of zero corresponds to serving customers entirely through a local entity and a value of one corresponds to serving customers entirely through exports. 11 This variable excludes parent company exports to local affiliates in order to avoid double counting the value of parent company exports that subsequently contribute to affiliate sales.
12
Given the importance of intrafirm trade and global production chains, measures of
total affiliate sales may include sales that are not targeted toward local customers. The
dependent variable in the regressions presented in columns 3 and 4 is the same as that in
the regressions presented in columns 1 and 2 except that only local sales are included in
the measure of affiliate sales, in order to restrict attention to measures directed at local
markets. Data limitations related to reporting requirements slightly reduce the sample
sizes in these regressions, but the effects of political risk and other explanatory variables
are very similar to those obtained in the regressions reported in columns 1 and 2. Finally,
the dependent variable in the regressions presented in columns 5 and 6 is constructed
using a measure of affiliate sales that subtracts parent company exports to its affiliates, in
order better to identify the value of local production undertaken by affiliates; the results
are very similar to those presented in columns 1-4.
4.3. Parent leverage and total borrowing
The discussion in section 2 notes that multinational parents with particularly high
operating risks stand to benefit from reducing their financial risks since these parent firms
may need to draw on costly external finance to fund ongoing operations. Anticipating
this possibility, parent companies whose foreign investments are located in countries with
significant political risk have incentives to economize on the use of debt. The empirical
work presented in this section measures the extent to which this consideration appears to
influence domestic leverage levels. Given the prior results on the role of political risk in
increasing affiliate leverage, it is conceivable that risk effects on parent leverage are
offsetting so overall leverage levels are investigated as well.
Figure 2 compares the leverage of parent companies whose foreign affiliates are
located in countries with greater than average political risks with leverage ratios of parent
companies whose foreign affiliates are located in politically safer countries. For such a
comparison, political risk must be aggregated to the parent level. This is accomplished
by computing the share of worldwide activity each parent system performs in countries
with above the median level of political risk. Figure 2 breaks the sample of parent
companies into two groups, those with above-average and below-average sales-weighted
foreign political risks. As is evident from the figure, parent companies facing greater
foreign political risks use less debt (defined as the sum of current liabilities and long-term
13
debt) than do parent companies operating in safer foreign environments. The median
debt/asset ratio of the sample of parent companies with risky foreign operations is
0.4217, whereas the corresponding median debt/asset ratio for parent firms whose foreign
operations are located in safer countries is 0.4614, a difference of 8.4 percent of the mean
value of parent leverage in the overall sample.
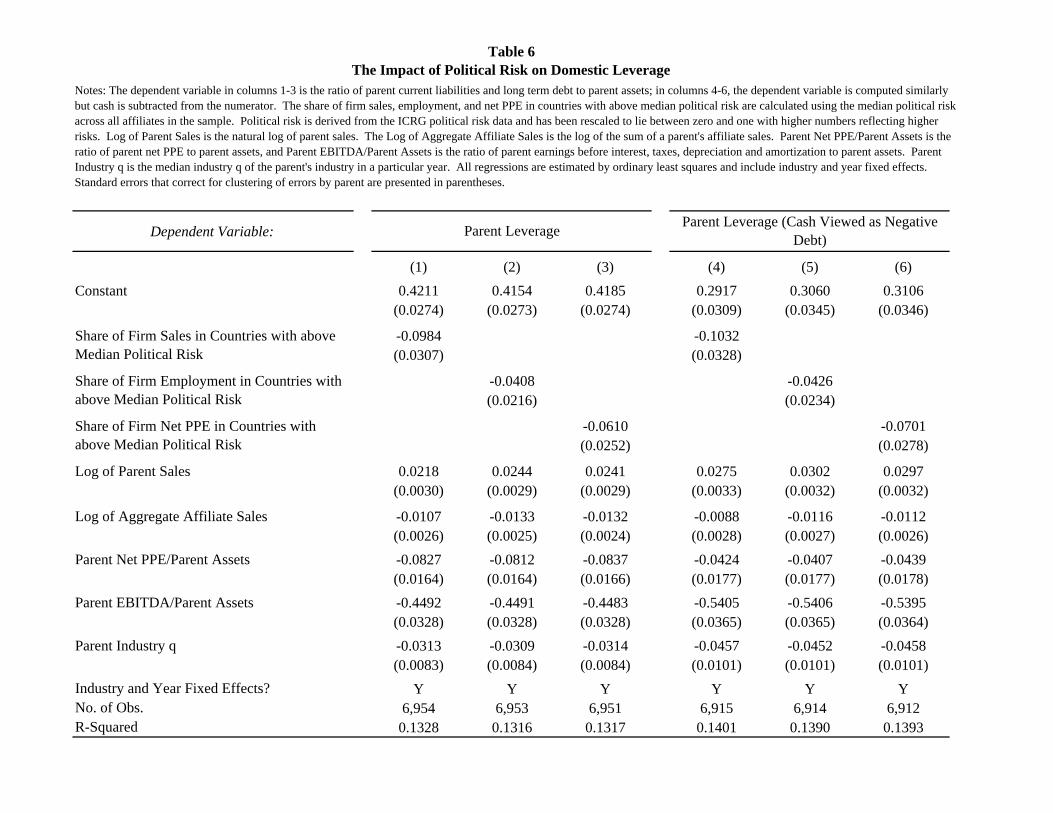
While illustrative, the comparison in Figure 2 does not control for various parent
characteristics that have the potential to influence capital structures. Table 6 presents the
results of regressing two measures of parent company leverage on independent variables
that include the fraction of parent company foreign investments in countries with above-
average political risks. The dependent variable in the regressions presented in columns 1-
3 is the same parent leverage measure depicted in Figure 2, but the exposure to political
risk is measured using sales as well as two alternative weights. The regressions include
independent variables measuring firm size, the degree of multinationality, profitability,
concentration of assets in tangible capital, and contemporaneous market measures of
parent industry q. The regressions also include industry and year dummy variables.
The -0.0984 coefficient in column 1 indicates that a ten percent increase in the
share of firm sales in countries with above-average political risk is associated with 1.0%
reduced parent borrowing as a fraction of assets. A similar result appears in the
regression reported in column 2, in which shares of firm activity in risky environments
are measured on the basis of employment. The -0.0610 coefficient in column three
likewise implies that parent companies with property, plant and equipment in risky
countries borrow less than do otherwise-similar companies who locate their assets in
safer foreign jurisdictions. Columns 4-6 repeat these regressions using a dependent
variable in which parent cash holdings are treated as negative debt; the results are quite
similar to those appearing in columns 1-3.
Exposures to risky foreign environments encourage parent companies to reduce
their domestic leverage ratios. The mean parent leverage ratio is 0.47, so a one standard
deviation increase in a firm’s foreign risk exposure from the mean value would,
according to the estimate in column 1, reduce the parent company’s leverage ratio by
0.015, or 3.2 percent of its mean value.

14
American multinational firms with exposures to political risky environments
respond by increasing the leverage of the exposed foreign operation and decreasing
leverage domestically. These results leave open the question of the net effect of such
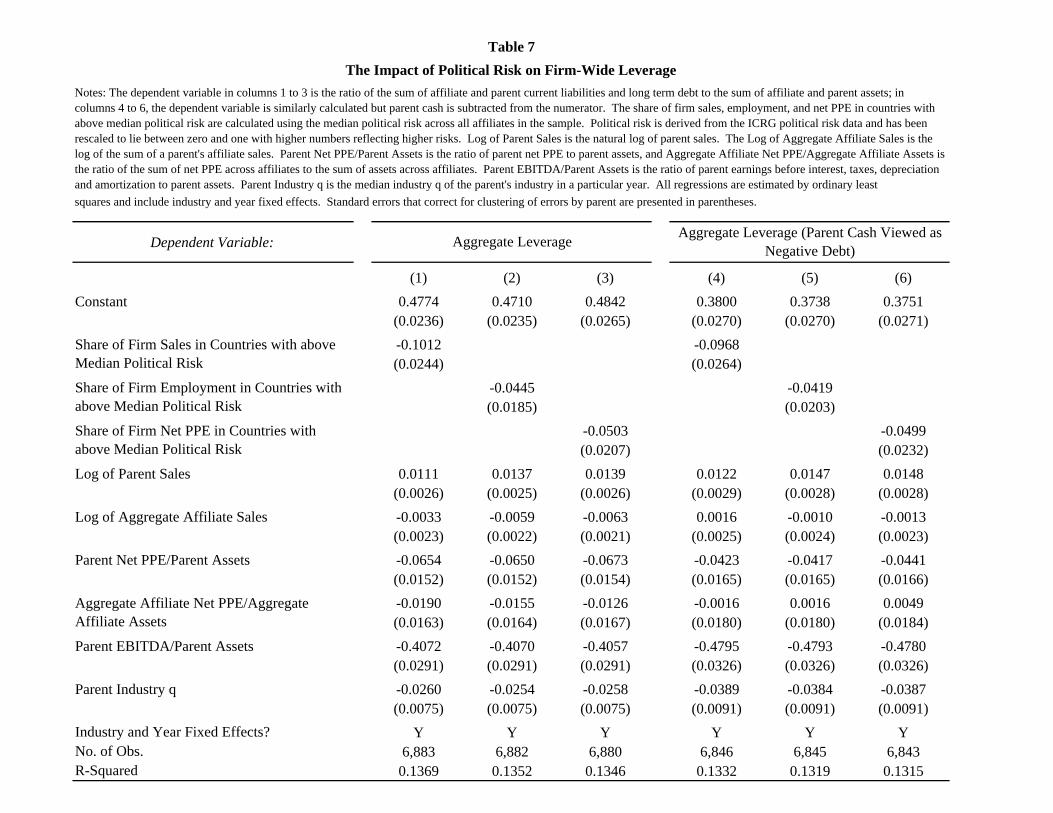
exposures. In order to consider these net effects, the regressions in Table 7 use as
dependent variables firm-wide leverage ratios, defined to include total parent and affiliate
borrowing. Specifically, the dependent variable in the regressions presented in columns
1-3 of Table 7 is the ratio of the sum of parent and affiliate borrowing to total parent and
affiliate assets; the dependent variable in the regressions presented in columns 4-6 is the
same variable minus parent company cash assets.12
The coefficient estimates in the regressions reported in Table 7 imply that greater
exposure to foreign political risks is associated with reduced overall leverage. The -
0.1012 coefficient in column 1 implies that a one standard deviation increase in the
fraction of foreign sales in risky countries would reduce total firm leverage by 1.6 percent
of assets, or 3.3 percent of its mean value. This effect, which is smaller in percentage
terms than the effect of foreign riskiness on domestic borrowing alone, nonetheless is
both statistically significant and economically consequential for multinational investors.
Political riskiness is associated with reduced net borrowing in each of the regressions
presented in columns 2-6, with magnitudes that are similar to those appearing in the
corresponding parent leverage regressions presented in Table 6. These results imply that
the net effect of exposures to risky environments is reduced overall leverage.
This analysis of the relationship between political risk and capital structure takes a
firm’s investment profile as given. As investment and financing choices are jointly
determined, it is worth considering the implications of the endogeneity of investment to
financing. Myers (1977) notes that the incomplete nature of debt contracts creates an
incentive for equity holders to undertake risky investments. This incentive increases with
the share of debt financing, thus inducing a positive correlation between leverage and the
riskiness of investment choices. In the context of multinational firms exposed to political
risk, this potential endogeneity of investment choice implies that heavily leveraged
multinational parent companies have incentives to to locate investment in unusually risky 12 Given the selective reporting of cash assets at the affiliate level, affiliate cash is not aggregated in constructing the dependent variable for the regressions reported in columns 4-6.

15
countries. In fact, the opposite pattern appears in the data, suggesting that the effects of
risky investment returns on capital structure dominate any effects of capital structure
choice on the riskiness of investment.
The evidence indicates that foreign subsidiaries located in countries with high
levels of political risk are more highly leveraged than other foreign affiliates. This
relationship, while superficially consistent with the incentives identified by Myers
(1977), must have different origins as the Myers point concerns noncontractible elements
in debt contracts. Lenders to local subsidiaries know the countries in which subsidiaries
are located and the political risks to which they are exposed, since these are country risks
rather than asset-specific risks. As such, the positive correlation between country risks
and higher subsidiary leverage likely reflects risk-shifting to local lenders in response to
differential risk pricing rather than asset substitution. The endogeneity of investment
riskiness to leverage, if it is important at all, should appear at the parent level and operate
against finding the results that the paper reports.
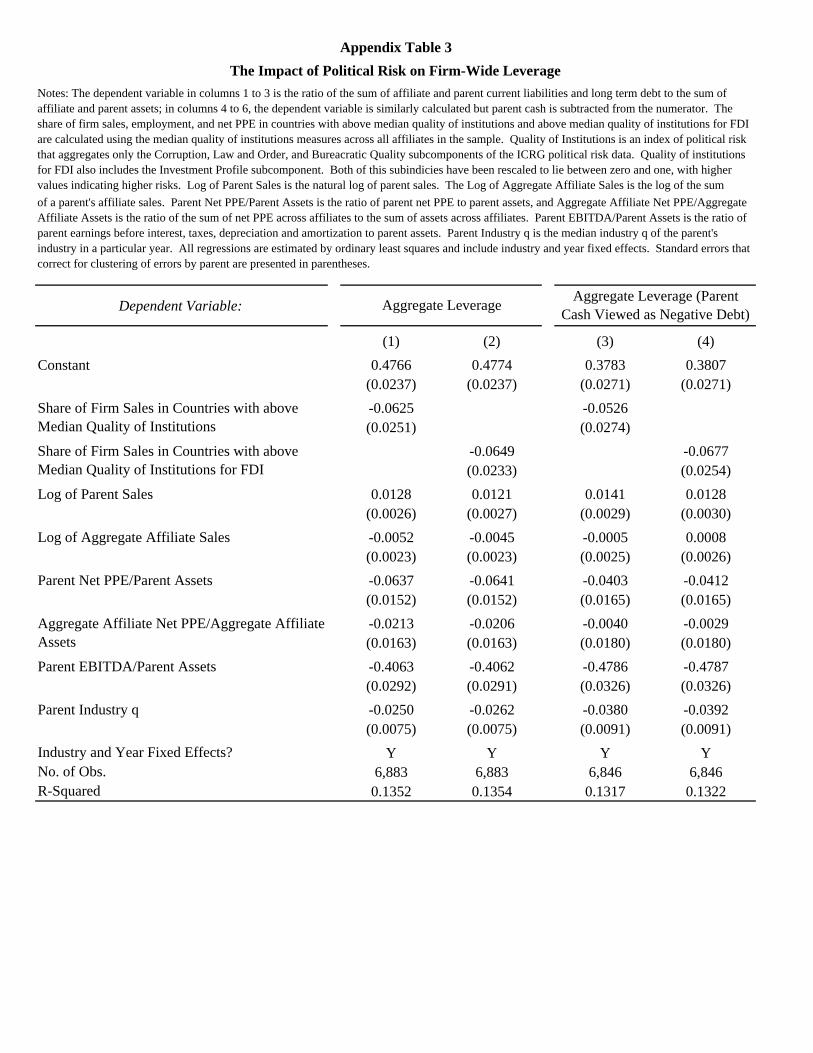
4.4. Robustness to alternative measures of political risk
The preceding analysis employs the aggregate measure of political risk that ICRG
provides to investors and scholars. Several previous studies have also chosen to
investigate the relevance of a subset of the components that make up this aggregate
measure. Such investigations are particularly useful as they emphasize those components
of the broader index that are of the greatest relevance to the problems at hand.
Specifically, Bekaert, Harvey and Lundblad (2005, forthcoming) develop a Quality of
Institutions index designed to capture the quality of political institutions that aggregates
the subcomponents of corruption, law and order and bureaucratic quality, and also
investigate the role of the investment profile component of the aggregate index. Given
the focus in the analysis on the effects of political risk on financial choices of foreign
investors, it is also informative to add the investment profile component to the Quality of
Institutions index. This added component captures risks that are likely to be especially
relevant to foreign investors, risks related to contract viability, expropriation, profit
repatriation, and payment delays.
16
In order to consider the robustness of the results to these alternative measures of
political risk, Appendix Tables 1, 2 and 3 report estimated coefficients from repeating the
main regressions of Tables 3, 6 and 7, in which the dependent variables are the leverage
levels of foreign subsidiaries, domestic parent companies, and total and domestic
operations. The regression reported in column 1 of Appendix Table 1 repeats the
specification reported in column 2 of Table 3, but uses in place of the Political Risk
variable a measure of Quality of Institutions drawn from Bekeart, Harvey and Lundblad
(2005, forthcoming). Column 2 of Appendix Table 1 reports a regression in which the
Quality of Institutions index is modified to incorporate the investment risk profile
component reported by ICRG. Columns 3 and 4 present a parallel set of results for the
specification reported in column 4 of Table 3. In each of these specifications, the results
are broadly consistent with those reported in the primary tables. Appendix Tables 2 and
3 similarly report coefficients using these alternative risk measures that resemble those
presented in Tables 6 and 7.
5. Conclusion
American firms investing abroad face significantly greater risks than they do
when they invest in the United States. These political risks are manifest in more volatile
returns, and firms respond by financing risky foreign investments with high levels of debt
and by sharing ownership with other investors. Firms facing higher foreign political risks
also reduce domestic leverage, and thereby reduce overall leverage. As these adjustments
are costly, their magnitudes illuminate one aspect of the costs that foreign investors bear
in politically unstable environments.
This paper examines the impact of risks created through foreign investments both
because these risks loom ever larger to American companies and because foreign risks
are relatively easily identified. The ease of identifying risks in this setting provides a
window onto corporate reactions to general operating risks, an area emphasized by
practitioners but given sparing treatment in academic work. Operating risks faced by
firms are likely to reduce firm leverage for many of the same reasons that foreign
business risks do so. This evidence is inconsistent with the prevailing theory of the effect
of capital structure on operating risks. As such, it appears that risky investment returns

17
faced by multinational firms have implications for capital structure that are stronger than
any effects of their capital structure on the riskiness of their investments.
18
References Acemoglu, Daron and Simon Johnson, 2005, Unbundling Institutions, Journal of Political Economy 113 (5 October): 949-995. Allayannis, George, Gregory W. Brown, Leora F. Klapper, 2003, Capital Structure and Financial Risk: Evidence from Foreign Debt Use in East Asia, Journal of Finance 58 (6 December): 2285-2812. Beck, Thorsten, Asli Demirgüç-Kunt and Ross Levine, 1999, A New Database on Financial Development and Structure, Policy Research Working Paper No. 2146, Washington DC: World Bank. Bekaert, Geert, 1995, Market Integration and Investment Barriers in Emerging Equity Markets, World Bank Economic Review 9 (1 January): 75-107. Bekaert, Geert and Campbell R Harvey, 2000, Foreign Speculators and Emerging Equity Markets, Journal of Finance 55 (2 April): 565-613. Bekaert, Geert and Campbell R. Harvey, 1997, Emerging Equity Market Volatility, Journal of Financial Economics 43 (1 January): 29-77. Bekaert, Geert, Campbell R. Harvey and Christian Lundblad, 2005, "Does Financial Liberalization Spur Growth," Journal of Financial Economics 77 (1 July): 3-56. Bekaert, Geert, Campbell R. Harvey and Christian Lundblad, (forthcoming), Growth Volatility and Equity Market Liberalization, Journal of International Money and Finance. Bekaert, Geert, Campbell R. Harvey, Christian Lundblad, and Stephan Siegel, (forthcoming), Global Growth Opportunities and Market Integration, Journal of Finance. Desai, Mihir A., C. Fritz Foley, and James R. Hines Jr., 2002, Dividend Policy Inside the Firm, NBER Working Paper No. 8698. Desai, Mihir A., C. Fritz Foley and James R. Hines Jr., 2004a, The Costs of Shared Ownership: Evidence from International Joint Ventures, Journal of Financial Economics 73 (2 August): 323-374. Desai, Mihir A., C. Fritz Foley, and James R. Hines Jr., 2004b, A Multinational Perspective on Capital Structure Choice and Internal Capital Markets, Journal of Finance 59 (6 December): 2451-2488. Géczy, Christopher, Bernadette A. Minton, and Catherine Schrand, 1997, Why Firms Use Currency Derivatives, Journal of Finance 52 (4 September): 1323-1354.

19
Graham, John R. and Campbell R. Harvey, 2001, The Theory and Practice of Corporate Finance: Evidence from the Field, Journal of Financial Economics 60 (2-3 May):187-243. Harris, Milton and Artur Raviv, 1991, The Theory of Capital Structure, Journal of Finance 46 (1 March): 297-355. Hartzell, Jay C., Sheridan Titman, and Garry Twite, 2006, Why Do Firms Hold So Much Cash? A Tax-based Explanation, Working Paper. Harvey, Campbell R. 1995, Predictable Risk and Returns in Emerging Markets, Review of Financial Studies 8 (3 Fall): 773-816. Helpman, Elhanan, 1984, A Simple Theory of International Trade with Multinational Corporations, Journal of Political Economy 92 (3 June): 451-471. Helpman, Elhanan, Marc J.Melitz, and Stephen R.Yeaple, 2004, Export versus FDI with Heterogeneous Firms, American Economic Review 94 (1 March): 300-316. Kedia, Simi and Abon Mozumdar, 2003, Foreign Currency Denominated Debt: An Empirical Examination, Journal of Business 76 (4 October): 521-546. La Porta, Rafael, Florencio Lopez-de-Silanes, Andrei Shleifer, and Robert W. Vishny, 1998, Law and Finance, Journal of Political Economy 106 (6 December): 1113-1155. La Porta, Rafael, Florencio Lopez-de-Silanes, Andrei Shleifer, and Robert W. Vishny, 1997, Legal Determinants of External Finance, Journal of Finance 52 (3 July): 1131-1150. Myers, Steward, 1977, Determinants of corporate borrowing. Journal of Financial Economics. 5(2 November):147–175. Opler, Tim, Lee Pinkowitz, René Stulz and Rohan Williamson, 1999, The Determinants and Implications of Corporate Cash Holdings, Journal of Financial Economics 52 (1 April): 3-46. Sabal, Jaime, 2004, The Discount Rate in Emerging Markets: A Guide, Journal of Applied Corporate Finance 16 (2-3 March): 155-166. Shatz, Howard, 2000, The Location of U.S. Multinational Affiliates, Harvard University Ph.D. Thesis.

Notes: The figure plots the median ratio of parent domestic current liabilities and long term debt to parent domestic assets for firms with above and below average exposures to political risk. A firm's exposure to political risk is measured as the share of firm sales in countries with above median political risk. Political risk is derived from the ICRG political risk data and has been rescaled to lie between zero and one with higher numbers reflecting higher risks. The sample is divided at the median political risk measure across all affiliates in the sample.
Notes: The figure plots the mean political risk of parent/country pairs by the degree to which parents serve customers in that country by exports or local sales. Political risk is derived from the ICRG political risk data and has been rescaled to lie between zero and one with higher numbers reflecting higher risks. The sample is divided into parent/country cells where the variable "Arm’s Length Exports/(Arm’s Length Exports + Affiliate Sales)" is either zero, between zero and one, or one, from left to right.
Figure 2: The Relationship Between Political Risk Exposures and Domestic Leverage
Figure 1: The Relationship Between Political Risk and the Export/FDI Decision
0.38
0.40
0.42
0.44
0.46
0.48
0.50
Above Average SalesShare in Riskier Countries
Below Average SalesShare in Riskier Countries
Pare
nt D
omes
tic L
ever
age
0.10
0.15
0.20
0.25
0.30
0.35
CompletelyServed Through
FDI
Mixed Methods CompletelyServed Through
Exports
Mea
n Po
litic
al R
isk

Mean Median Standard Deviation
Multinational Firm Dependent Variables
Standard Deviation of Affiliate ROA 0.0866 0.0566 0.0949
Share of Occurences of Negative Net Income 0.2165 0.1250 0.2701
Affiliate Leverage 0.5446 0.5281 0.3068
Affiliate Leverage (Cash Viewed as Negative Debt) 0.5117 0.4951 0.2882
Dummy for Whole Ownership 0.7707 1.0000 0.4204
Dummy for Whole v. Majority Ownership 0.8897 1.0000 0.3132
Arm's Length Exports/(Arm's Length Exports + Affiliate Sales) 0.5704 1.0000 0.4792
Arm's Length Exports/(Arm's Length Exports + Affiliate Local Sales) 0.6132 1.0000 0.4704
0.5743 1.0000 0.4781
Parent Leverage 0.4712 0.4497 0.2424
Parent Leverage (Cash Viewed as Negative Debt) 0.4160 0.4115 0.2704
Aggregate Leverage 0.4857 0.4668 0.2127
Aggregate Leverage (Parent Cash Viewed as Negative Debt) 0.4416 0.4372 0.2344
Multinational Firm Independent Variables
Log of Affiliate Sales 9.7081 9.7371 2.0959
Affiliate Net PPE/Affiliate Assets 0.2346 0.1557 0.2971
Affiliate EBITDA/Affiliate Assets 0.1454 0.1330 0.2061
Share of Firm Sales in Countries with above Median Political Risk 0.0940 0.0232 0.1543
0.1175 0.0283 0.1887
Table 1Descriptive Statistics
Arm's Length Exports/(Arm's Length Exports + Affiliate Sales-Parent Exports to Affiliate)
Share of Firm Employment in Countries with above Median Political Risk
Notes: The Standard Deviation of Affiliate ROA is measured in the benchmark years (1989, 1994, 1999), is computed using returns for the periods between benchmark years (1982-1989,1990-1994,1995-1999), and is only calculated for affiliates that report in at least five years in each period. The Share of Occurrences of Negative Net Income is computed using these same data and is equal to the ratio of the number number of years with negative outcomes divided by the number of reported outcomes for a period. All other data items are measured for each benchmark year (1982, 1989, 1994, 1999). Affiliate Leverage is the ratio of affiliate current liabilities and long term debt to affiliate assets. Affiliate Leverage (Cash Viewed as Negative Debt) is calculated similarly but cash is removed from the numerator. The Dummy for Whole Ownership is a dummy equal to one for wholly owned affiliates and zero for other affiliates. The Dummy for Whole v. Majority Ownership is a dummy equal to one for affiliates that are wholly owned and zero for all other majority owned affiliates. Arm’s Length Exports/(Arm’s Length Exports + Affiliate Sales) is the ratio of parent exports to unrelated parties in a country to the sum of such exports and the sales of parent affiliates in that country. Arm’s Length Exports/(Arm’s Length Exports + Affiliate Local Sales) is similarly calculated but the local sales of parent affiliates replaces total sales of parent affiliates; Arm’s Length Exports/(Arm’s Length Exports + Affiliate Sales – Parent Exports to Affiliate) is also similarly calculated but parent exports to the affiliate are subtracted from the denominator. Parent Leverage is the ratio of parent current liabilities and long term debt to parent assets; Parent Leverage (Cash Viewed as Negative Debt) is calculated similarly but cash is removed from the numerator. Aggregate Leverage is the ratio of the sum of affiliate and parent current liabilities and long term debt to the sum of affiliate and parent assets. Aggregate Leverage (Parent Cash Viewed as Negative Debt) is calculated similarly but parent cash is removed from the numerator. Affiliate Net PPE/Affiliate Assets is the ratio of affiliate net property plant and equipment (PPE) to affiliate assets, and Affiliate EBITDA/Assets is the ratio of affiliate earnings before interest, taxes, depreciation and amortization to affiliate assets. The share of firm sales, employment, and net PPE in countries with above median political risk are calculated using the median political risk across all affiliates in the sample. Political risk is derived from the ICRG political risk data and has been rescaled to lie between zero and one with higher numbers reflecting higher risks. The Log of Aggregate Affiliate Sales is the log of the sum of a parent's affiliate sales. Parent Net PPE/Parent Assets is the ratio of parent net PPE to parent assets and Parent EBITDA/Parent Assets is the ratio of parent earnings before interest, taxes, depreciation and amortization to parent assets. Parent Industry q is the median industry q of the parent's industry in a particular year. Aggregate Affiliate Net PPE/Aggregate Affiliate Assets is the ratio of the sum of net PPE across affiliates to the sum of assets across affiliates. Log of GDP, Log of GDP per Capita, and the Rate of Inflation are taken from the World Bank’s World Development Indicators. Corporate Tax Rate is the median effective tax rate paid by affiliates in a particular country and year. Private Credit is the ratio of private credit lent by deposit money banks to GDP, as provided in Beck et. al. (1999). Ownership Restrictions is a dummy equal to one if two measures of restrictions on foreign ownership as measured by Shatz (2000) are above 3 on a scale of 1 to 5 and zero otherwise. Quality of institutions is an index of political risk based only on the Corruption, Law and Order, and Bureacratic Quality subcomponents of the political risk index. Quality of institutions for FDI also incorporates the Investment Profile subcomponent. Both of this subindicies have been rescaled to lie between zero and one, with higher values indicating higher risks.
Mean Median Standard Deviation
Share of Firm Net PPE in Countries with above Median Political Risk 0.0841 0.0105 0.1613
Log of Parent Sales 12.5487 12.4850 1.9203
Log of Aggregate Affiliate Sales 10.9179 10.6849 2.1304
Parent Net PPE/Parent Assets 0.3520 0.2796 0.2749
Parent EBITDA/Parent Assets 0.1335 0.1273 0.1086
Parent Industry q 1.4596 1.2814 0.6104
Aggregate Affiliate Net PPE/Aggregate Affiliate Assets 0.2532 0.1991 0.2126
Country Dependent Variables
Political Risk 0.2302 0.2050 0.1163
Log of GDP 26.5979 26.7324 1.5471
Log of GDP per capita 9.4168 9.8504 1.1136
Corporate Tax Rate 0.3282 0.3362 0.1218
Private Credit 0.7800 0.8374 0.4043
Rate of Inflation 0.3989 0.0394 2.6036
Ownership Restrictions 0.2129 0.0000 0.4093
Quality of Institutions 0.1940 0.1250 0.2028
Quality of Institutions for FDI 0.2729 0.2500 0.1553
Table 1 (contd.)Descriptive Statistics
(1) (2) (3) (4)Constant 0.1758 0.2367 -0.3293 -0.0239
(0.0349) (0.0392) (0.0960) (0.1094)0.0728 0.0786 0.1829 0.1713
(0.0210) (0.0236) (0.0652) (0.0726)Log of GDP -0.0032 -0.0027 0.0228 0.0210
(0.0012) (0.0014) (0.0030) (0.0038)-0.0016 0.0009 -0.0120 -0.0051(0.0026) (0.0029) (0.0073) (0.0078)
-0.0107 -0.0410(0.0010) (0.0028)0.0293 0.3030
(0.0041) (0.0124)Parent and Year Fixed Effects? Y Y Y YNo. of Obs. 19,460 16,861 19,460 16,861R-Squared 0.2067 0.2377 0.1854 0.2828
Affiliate Leverage
Dependent Variable: Standard Deviation of Affiliate ROA
Share of Negative Occurences of Net Income
Political Risk
Log of Affiliate Sales
Log of GDP per capita
Notes: The dependent variable in columns 1 and 2 is the Standard Deviation of Affiliate ROA. The Standard Deviation of Affiliate ROA is measured in the benchmark years (1989, 1994, 1999), is computed using returns for the periods between benchmark years (1982-1989,1990-1994,1995-1999), and is only calculated for affiliates that report in at least five years in each period. The Share of Occurrences of Negative Net Income is the dependant variable in columns 3 and 4. The Share of Occurrences of Negative Net Income is computed using the same data as the standard deviation of affiliate ROA, and this measure is equal to the ratio of the number number of years with negative outcomes divided by the number of reported outcomes for a period. Political risk is derived from the ICRG political risk data and has been rescaled to lie between zero and one with higher numbers reflecting higher risks. Log of GDP and Log of GDP per
Table 2Political Risk and the Volatility of Earnings
capita are taken from the World Bank’s World Development Indicators. Log of Affiliate Sales is the natural log of affiliate sales. Affiliate Leverage is the ratio of affiliate current liabilities and long term debt to affiliate assets. All regressions are estimated by ordinary least squares and include parent and year fixed effects. Standard errors that correct for clustering of errors by country/year are presented in parentheses.

Dependent Variable:
(1) (2) (3) (4)Constant 0.0698 0.1811 0.4771 -0.1622
(0.1929) (0.1278) (0.0812) (0.1889)Political Risk 0.1062 0.1544 0.0935 0.1705
(0.0422) (0.0662) (0.0411) (0.0635)Log of Affiliate Sales 0.0036 0.0021 0.0032 0.0015
(0.0024) (0.0026) (0.0025) (0.0027)Affiliate Net PPE/Assets -0.0169 -0.0165 0.0185 0.0203
(0.0185) (0.0184) (0.0172) (0.0171)Affiliate EBITDA/Assets -0.4081 -0.3999 -0.4497 -0.4413
(0.0271) (0.0260) (0.0312) (0.0302)Corporate Tax Rate 0.2365 0.1482 0.2102 0.1316
(0.0592) (0.0620) (0.0615) (0.0617)Private Credit 0.0023 -0.0150 0.0083 -0.0122
(0.0196) (0.0209) (0.0192) (0.0198)Rate of Inflation -0.0030 -0.0033
(0.0012) (0.0013)Log of GDP 0.0166 0.0146
(0.0047) (0.0043)Log of GDP per Capita -0.0011 0.0053
(0.0069) (0.0066)Parent, Affiliate Industry, and Year Fixed Effects? Y Y Y YNo. of Obs. 22,696 22,692 21,674 21,670R-Squared 0.3225 0.3254 0.3004 0.3031
Affiliate Leverage
Table 3The Impact of Political Risk on Affiliate Leverage
Notes: The dependent variable in columns 1 and 2 is Affiliate Leverage, defined as the ratio of affiliate current liabilities and long term debt to affiliate assets. The dependent variable in columns 3 and 4, Affiliate Leverage (Cash Viewed as Negative Debt), is computed similarly but cash is subtracted from the numerator of the calculation. Political risk is derived from the ICRG political risk data and has been rescaled to lie between zero and one with higher numbers reflecting higher risks. Log of Affiliate Sales is the natural log of affiliate sales. Affiliate Net PPE/ Assets is the ratio of affiliate net PPE to affiliate assets, and Affiliate EBITDA/Assets is the ratio of affiliate earnings before interest, taxes, depreciation and amortization to assets. Corporate Tax Rate is the median effective tax rate paid by all affiliates in a country and year. Private Credit is the ratio of private credit lent by deposit money banks to GDP, as provided in Beck et. al. (1999). Log of GDP, Log of GDP per Capita, and the Rate of Inflation are taken from the World Bank’s World Development Indicators. All regressions are estimated by ordinary least squares and include
Affiliate Leverage (Cash Viewed as Negative Debt)
parent, affiliate industry, and year fixed effects. Standard errors that correct for clustering of errors by country/year are presented in parentheses.

Dependent Variable:
(1) (2) (3) (4)Political Risk -3.6733 -2.7387 -4.5315 -3.1549
(0.2464) (0.2940) (0.3147) (0.3829)Ownership Restrictions -1.0242 -0.9004 -0.8646 -0.6572
(0.0440) (0.0479) (0.0609) (0.0675)Corporate Tax Rate -2.1971 -1.4870 -1.3542 -1.0394
(0.1928) (0.2116) (0.2402) (0.2784)Private Credit -0.7259 -0.6409 -0.6364 -0.6320
(0.0579) (0.0657) (0.0826) (0.0883)Rate of Inflation 0.0436 0.0339
(0.0057) (0.0070)Log of GDP -0.1922 -0.1653
(0.0208) (0.0269)Log of GDP per Capita 0.2579 0.3374
(0.0353) (0.0440)Parent/Affiliate Industry/Year Fixed Effects? Y Y Y YNo. of Obs. 28,001 28,001 17,724 17,724Log Likelihood -10,185 -10,053 -5,443 -5,366
Dummy for whole v. majority ownership
The Impact of Political Risk on Affiliate OwnershipTable 4
Notes: The dependent variable in columns 1 and 2 is a dummy equal to one for wholly owned affiliates and zero for other affiliates, and the dependent variable in columns 3 and 4 is a dummy equal to one for affiliates that are wholly owned and zero for all other majority owned affiliates. Political risk is derived from the ICRG political risk data and has been rescaled to lie between zero and one with higher numbers reflecting higher risks. Ownership Restrictions is a dummy equal to one if two measures of restrictions on foreign ownership as measured by Shatz (2000) are above 3 on a scale of 1 to 5 and zero otherwise. Corporate Tax Rate is the median effective tax rate paid by affiliates in a particular country and year. Private Credit is the ratio of private credit lent by deposit money banks to GDP, as provided in Beck et. al. (1999). Log of GDP, Log of GDP per Capita, and the Rate of Inflation are taken from the World Bank’s World Development Indicators. All regressions are estimated as conditional logits using parent/affiliate industry/year fixed effects.
Dummy for whole ownership
Dependent Variable:
(1) (2) (3) (4) (5) (6)Constant 0.1307 1.8535 0.0332 1.7291 0.1356 1.3561
(0.3383) (0.1740) (0.3412) (0.1751) (0.3365) (0.4170)Political Risk 0.6746 0.4313 0.6615 0.3866 0.6635 0.4241
(0.0705) (0.0857) (0.0711) (0.0875) (0.0692) (0.0845)Corporate Tax Rate -0.2411 -0.0389 -0.2771 -0.0789 -0.2328 -0.0344
(0.0642) (0.0720) (0.0674) (0.0711) (0.0638) (0.0712)Private Credit -0.0297 0.0445 -0.0275 0.0513 -0.0288 0.0440
(0.0270) (0.0290) (0.0295) (0.0315) (0.0268) (0.0289)Rate of Inflation 0.0007 0.0003 0.0006
(0.0010) (0.0010) (0.0010)Log of GDP -0.0192 -0.0259 -0.0190
(0.0088) (0.0088) (0.0086)Log of GDP per Capita -0.0449 -0.0438 -0.0440
(0.0056) (0.0058) (0.0056)Parent, Affiliate Industry, and Year Fixed Effects? Y Y Y Y Y YNo. of Obs. 81,610 81,562 77,018 76,970 81,491 81,443R-Squared 0.4828 0.4949 0.5163 0.5292 0.4870 0.4987
Table 5The Impact of Political Risk on Exports/FDI Decision
Arm's Length Exports/(Arm's Length Exports + Affiliate Sales)
Arm's Length Exports/(Arm's Length Exports + Affiliate Local
Sales)
Arm's Length Exports/(Arm's Length Exports + Affiliate Sales-
Parent Exports to Affiliate)
Notes: The dependent variable in columns 1 and 2 is the ratio of parent exports to unrelated parties in a country to the sum of parent's affiliate sales in that country and parent exports to unrelated parties in that country; the dependent variable in columns 3 and 4 is calculated similarly but the local sales of a parent's affiliates replaces total sales of a parent's affiliates in the denominator; and the dependent variable in columns 5 and 6 is similarly calculated but parent exports to the affiliate are subtracted from the denominator. Political risk is derived from the ICRG political risk data and has been rescaled to lie between zero and one with higher numbers reflecting higher risks. Corporate Tax Rate is the median effective tax rate paid by all affiliates in a particular country and year. Private Credit is the ratio of private credit lent by deposit money banks to GDP, as provided in Beck et. al. (1999). Log of GDP, Log of GDP per Capita, and the Rate of Inflation are taken from the World Bank’s World Development Indicators. All regressions are estimated by ordinary least squares and include parent, affiliate industry, and year fixed effects. Standard errors that correct for clustering of errors by country/year are presented in parentheses.
Dependent Variable:
(1) (2) (3) (4) (5) (6)Constant 0.4211 0.4154 0.4185 0.2917 0.3060 0.3106
(0.0274) (0.0273) (0.0274) (0.0309) (0.0345) (0.0346)
-0.0984 -0.1032(0.0307) (0.0328)
-0.0408 -0.0426(0.0216) (0.0234)
-0.0610 -0.0701(0.0252) (0.0278)
Log of Parent Sales 0.0218 0.0244 0.0241 0.0275 0.0302 0.0297(0.0030) (0.0029) (0.0029) (0.0033) (0.0032) (0.0032)
Log of Aggregate Affiliate Sales -0.0107 -0.0133 -0.0132 -0.0088 -0.0116 -0.0112(0.0026) (0.0025) (0.0024) (0.0028) (0.0027) (0.0026)
Parent Net PPE/Parent Assets -0.0827 -0.0812 -0.0837 -0.0424 -0.0407 -0.0439(0.0164) (0.0164) (0.0166) (0.0177) (0.0177) (0.0178)
Parent EBITDA/Parent Assets -0.4492 -0.4491 -0.4483 -0.5405 -0.5406 -0.5395(0.0328) (0.0328) (0.0328) (0.0365) (0.0365) (0.0364)
Parent Industry q -0.0313 -0.0309 -0.0314 -0.0457 -0.0452 -0.0458(0.0083) (0.0084) (0.0084) (0.0101) (0.0101) (0.0101)
Industry and Year Fixed Effects? Y Y Y Y Y YNo. of Obs. 6,954 6,953 6,951 6,915 6,914 6,912R-Squared 0.1328 0.1316 0.1317 0.1401 0.1390 0.1393
Share of Firm Net PPE in Countries with above Median Political Risk
Share of Firm Sales in Countries with above Median Political Risk
Share of Firm Employment in Countries with above Median Political Risk
Table 6The Impact of Political Risk on Domestic Leverage
Notes: The dependent variable in columns 1-3 is the ratio of parent current liabilities and long term debt to parent assets; in columns 4-6, the dependent variable is computed similarly but cash is subtracted from the numerator. The share of firm sales, employment, and net PPE in countries with above median political risk are calculated using the median political risk across all affiliates in the sample. Political risk is derived from the ICRG political risk data and has been rescaled to lie between zero and one with higher numbers reflecting higher risks. Log of Parent Sales is the natural log of parent sales. The Log of Aggregate Affiliate Sales is the log of the sum of a parent's affiliate sales. Parent Net PPE/Parent Assets is the ratio of parent net PPE to parent assets, and Parent EBITDA/Parent Assets is the ratio of parent earnings before interest, taxes, depreciation and amortization to parent assets. Parent Industry q is the median industry q of the parent's industry in a particular year. All regressions are estimated by ordinary least squares and include industry and year fixed effects. Standard errors that correct for clustering of errors by parent are presented in parentheses.
Parent Leverage Parent Leverage (Cash Viewed as Negative Debt)
Dependent Variable:
(1) (2) (3) (4) (5) (6)Constant 0.4774 0.4710 0.4842 0.3800 0.3738 0.3751
(0.0236) (0.0235) (0.0265) (0.0270) (0.0270) (0.0271)-0.1012 -0.0968(0.0244) (0.0264)
-0.0445 -0.0419(0.0185) (0.0203)
-0.0503 -0.0499(0.0207) (0.0232)
Log of Parent Sales 0.0111 0.0137 0.0139 0.0122 0.0147 0.0148(0.0026) (0.0025) (0.0026) (0.0029) (0.0028) (0.0028)
Log of Aggregate Affiliate Sales -0.0033 -0.0059 -0.0063 0.0016 -0.0010 -0.0013(0.0023) (0.0022) (0.0021) (0.0025) (0.0024) (0.0023)
Parent Net PPE/Parent Assets -0.0654 -0.0650 -0.0673 -0.0423 -0.0417 -0.0441(0.0152) (0.0152) (0.0154) (0.0165) (0.0165) (0.0166)-0.0190 -0.0155 -0.0126 -0.0016 0.0016 0.0049(0.0163) (0.0164) (0.0167) (0.0180) (0.0180) (0.0184)
Parent EBITDA/Parent Assets -0.4072 -0.4070 -0.4057 -0.4795 -0.4793 -0.4780(0.0291) (0.0291) (0.0291) (0.0326) (0.0326) (0.0326)
Parent Industry q -0.0260 -0.0254 -0.0258 -0.0389 -0.0384 -0.0387(0.0075) (0.0075) (0.0075) (0.0091) (0.0091) (0.0091)
Industry and Year Fixed Effects? Y Y Y Y Y YNo. of Obs. 6,883 6,882 6,880 6,846 6,845 6,843R-Squared 0.1369 0.1352 0.1346 0.1332 0.1319 0.1315
Share of Firm Sales in Countries with above Median Political Risk
Share of Firm Employment in Countries with above Median Political Risk
Share of Firm Net PPE in Countries with above Median Political Risk
Aggregate Affiliate Net PPE/Aggregate Affiliate Assets
Table 7The Impact of Political Risk on Firm-Wide Leverage
Aggregate Leverage Aggregate Leverage (Parent Cash Viewed as Negative Debt)
Notes: The dependent variable in columns 1 to 3 is the ratio of the sum of affiliate and parent current liabilities and long term debt to the sum of affiliate and parent assets; in columns 4 to 6, the dependent variable is similarly calculated but parent cash is subtracted from the numerator. The share of firm sales, employment, and net PPE in countries with above median political risk are calculated using the median political risk across all affiliates in the sample. Political risk is derived from the ICRG political risk data and has been rescaled to lie between zero and one with higher numbers reflecting higher risks. Log of Parent Sales is the natural log of parent sales. The Log of Aggregate Affiliate Sales is the log of the sum of a parent's affiliate sales. Parent Net PPE/Parent Assets is the ratio of parent net PPE to parent assets, and Aggregate Affiliate Net PPE/Aggregate Affiliate Assets is the ratio of the sum of net PPE across affiliates to the sum of assets across affiliates. Parent EBITDA/Parent Assets is the ratio of parent earnings before interest, taxes, depreciation and amortization to parent assets. Parent Industry q is the median industry q of the parent's industry in a particular year. All regressions are estimated by ordinary least squares and include industry and year fixed effects. Standard errors that correct for clustering of errors by parent are presented in parentheses.

Dependent Variable:
(1) (2) (3) (4)Constant -0.4190 -0.4042 -0.2027 -0.2165
(0.2452) (0.2449) (0.1934) (0.2031)Quality of Institutions 0.1588 0.1491
(0.0677) (0.0585)Quality of Institutions for FDI 0.2053 0.2016
(0.0922) (0.0826)Log of Affiliate Sales 0.0023 0.0023 0.0018 0.0018
(0.0025) (0.0025) (0.0026) (0.0026)Affiliate Net PPE/Assets -0.0148 -0.0152 0.0215 0.0213
(0.0188) (0.0188) (0.0175) (0.0174)Affiliate EBITDA/Assets -0.3993 -0.3981 -0.4405 -0.4395
(0.0267) (0.0263) (0.0310) (0.0307)Corporate Tax Rate 0.1711 0.1701 0.1507 0.1516
(0.0583) (0.0579) (0.0585) (0.0587)Private Credit -0.0148 -0.0101 -0.0119 -0.0074
(0.0200) (0.0185) (0.0193) (0.0179)Rate of Inflation -0.0029 -0.0031 -0.0032 -0.0034
(0.0010) (0.0012) (0.0011) (0.0013)Log of GDP 0.0150 0.0147 0.0130 0.0126
(0.0042) (0.0044) (0.0037) (0.0039)Log of GDP per Capita 0.0109 0.0100 0.0140 0.0143
(0.0119) (0.0117) (0.0103) (0.0103)Parent, Affiliate Industry, and Year Fixed Effects? Y Y Y YNo. of Obs. 22,692 22,692 21,670 21,670R-Squared 0.3272 0.3279 0.3043 0.3051
Affiliate Leverage Affiliate Leverage (Cash Viewed as Negative Debt)
Appendix Table 1The Impact of Political Risk on Affiliate Leverage
Notes: The dependent variable in columns 1 and 2 is Affiliate Leverage, defined as the ratio of affiliate current liabilities and long term debt to affiliate assets. The dependent variable in columns 3 and 4, Affiliate Leverage (Cash Viewed as Negative Debt), is computed similarly but cash is subtracted from the numerator of the calculation. Quality of Institutions is an index of political risk that aggregates only the Corruption, Law and Order, and Bureacratic Quality subcomponents of the ICRG political risk data. Quality of institutions for FDI also includes the Investment Profile subcomponent. Both of this subindicies have been rescaled to lie between zero and one, with higher values indicating higher risks. Log of Affiliate Sales is the natural log of affiliate sales. Affiliate Net PPE/ Assets is the ratio of affiliate net PPE to affiliate assets, and Affiliate EBITDA/Assets is the ratio of affiliate earnings before interest, taxes, depreciation and amortization to assets. Corporate Tax Rate is the median effective tax rate paid by all affiliates in a country and year. Private Credit isthe ratio of private credit lent by deposit money banks to GDP, as provided in Beck et. al. (1999). Log of GDP, Log of GDP per Capita, and the Rate of Inflation are taken from the World Bank’s World Development Indicators. All regressions are estimated by ordinary least squares and include parent, affiliate industry, and year fixed effects. Standard errors that correct for clustering of errors by country/year are presented in parentheses.

Dependent Variable:
(1) (2) (3) (4)Constant 0.4230 0.4231 0.2937 0.2947
(0.0277) (0.0276) (0.0311) (0.0310)
-0.0858 -0.0895(0.0308) (0.0331)
-0.0783 -0.0901(0.0292) (0.0313)
Log of Parent Sales 0.0224 0.0219 0.0282 0.0273(0.0031) (0.0031) (0.0033) (0.0033)
Log of Aggregate Affiliate Sales -0.0114 -0.0110 -0.0096 -0.0088(0.0026) (0.0026) (0.0028) (0.0028)
Parent Net PPE/Parent Assets -0.0819 -0.0821 -0.0416 -0.0419(0.0164) (0.0164) (0.0177) (0.0177)
Parent EBITDA/Parent Assets -0.4484 -0.4484 -0.5398 -0.5398(0.0328) (0.0328) (0.0365) (0.0365)
Parent Industry q -0.0305 -0.0318 -0.0448 -0.0463(0.0084) (0.0084) (0.0101) (0.0101)
Industry and Year Fixed Effects? Y Y Y YNo. of Obs. 6,954 6,954 6,915 6,915R-Squared 0.1324 0.1323 0.1397 0.1399
Share of Firm Sales in Countries with above Median Quality of Institutions
Share of Firm Sales in Countries with above Median Quality of Institutions for FDI
Appendix Table 2The Impact of Political Risk on Domestic Leverage
Notes: The dependent variable in columns 1-3 is the ratio of parent current liabilities and long term debt to parent assets; in columns 4-6, the dependent variable is computed similarly but cash is subtracted from the numerator. The share of firm sales, employment, and net PPE in countries with above median quality of institutions and above median quality of institutions for FDI are calculated using the median quality of institutions measures across all affiliates in the sample. Quality of Institutions is an index of political risk that aggregates only the Corruption, Law and Order, and Bureacratic Quality subcomponents of the ICRG political risk data. Quality of institutions for FDI also includes the Investment Profile subcomponent. Both of this subindicies have been rescaled to lie between zero and one, with higher values indicating higher risks. Log of Parent Sales is the natural log of parent sales. The Log of Aggregate Affiliate Sales is the log of the sum of a parent's affiliate sales. Parent Net PPE/Pare,nt Assets is the ratio of parent net PPE to parent assets, and Parent EBITDA/Parent Assets is the ratio of parent earnings before interest,
Parent Leverage Parent Leverage (Cash Viewed as Negative Debt)
taxes, depreciation and amortization to parent assets. Parent Industry q is the median industry q of the parent's industry in a particular year. All regressions are estimated by ordinary least squares and include industry and year fixed effects. Standard errors that correct for clustering of errors by parent are presented in parentheses.
Dependent Variable:
(1) (2) (3) (4)Constant 0.4766 0.4774 0.3783 0.3807
(0.0237) (0.0237) (0.0271) (0.0271)-0.0625 -0.0526(0.0251) (0.0274)
-0.0649 -0.0677(0.0233) (0.0254)
Log of Parent Sales 0.0128 0.0121 0.0141 0.0128(0.0026) (0.0027) (0.0029) (0.0030)
Log of Aggregate Affiliate Sales -0.0052 -0.0045 -0.0005 0.0008(0.0023) (0.0023) (0.0025) (0.0026)
Parent Net PPE/Parent Assets -0.0637 -0.0641 -0.0403 -0.0412(0.0152) (0.0152) (0.0165) (0.0165)-0.0213 -0.0206 -0.0040 -0.0029(0.0163) (0.0163) (0.0180) (0.0180)
Parent EBITDA/Parent Assets -0.4063 -0.4062 -0.4786 -0.4787(0.0292) (0.0291) (0.0326) (0.0326)
Parent Industry q -0.0250 -0.0262 -0.0380 -0.0392(0.0075) (0.0075) (0.0091) (0.0091)
Industry and Year Fixed Effects? Y Y Y YNo. of Obs. 6,883 6,883 6,846 6,846R-Squared 0.1352 0.1354 0.1317 0.1322
Aggregate Affiliate Net PPE/Aggregate Affiliate Assets
Aggregate Leverage Aggregate Leverage (Parent Cash Viewed as Negative Debt)
Share of Firm Sales in Countries with above Median Quality of Institutions
Share of Firm Sales in Countries with above Median Quality of Institutions for FDI
Appendix Table 3The Impact of Political Risk on Firm-Wide Leverage
Notes: The dependent variable in columns 1 to 3 is the ratio of the sum of affiliate and parent current liabilities and long term debt to the sum of affiliate and parent assets; in columns 4 to 6, the dependent variable is similarly calculated but parent cash is subtracted from the numerator. The share of firm sales, employment, and net PPE in countries with above median quality of institutions and above median quality of institutions for FDI are calculated using the median quality of institutions measures across all affiliates in the sample. Quality of Institutions is an index of political risk that aggregates only the Corruption, Law and Order, and Bureacratic Quality subcomponents of the ICRG political risk data. Quality of institutions for FDI also includes the Investment Profile subcomponent. Both of this subindicies have been rescaled to lie between zero and one, with higher values indicating higher risks. Log of Parent Sales is the natural log of parent sales. The Log of Aggregate Affiliate Sales is the log of the sumof a parent's affiliate sales. Parent Net PPE/Parent Assets is the ratio of parent net PPE to parent assets, and Aggregate Affiliate Net PPE/Aggregate Affiliate Assets is the ratio of the sum of net PPE across affiliates to the sum of assets across affiliates. Parent EBITDA/Parent Assets is the ratio of parent earnings before interest, taxes, depreciation and amortization to parent assets. Parent Industry q is the median industry q of the parent's industry in a particular year. All regressions are estimated by ordinary least squares and include industry and year fixed effects. Standard errors that correct for clustering of errors by parent are presented in parentheses.