Embed Size (px)
Citation preview

Capital Markets and Investment Banking 2016: Time for Tough Choices And Bold Actions
Global Corporate & Investment Banking Practice


Capital Markets and Investment Banking 2016: Time for Tough Choices And Bold Actions
Introduction
Despite Improved Performance, Challenges Remain for CMIB
Amid Persistent Strong Headwinds, Tailwinds Emerge
Tough Choices: Four Business Models for the Future
Bold Actions: Attaining Sustainable Profitability
Introduction
Despite Improved Performance, Challenges Remain for CMIB
Amid Persistent Strong Headwinds, Tailwinds Emerge
Tough Choices: Four Business Models For the Future
Bold Actions: Attaining Sustainable Profitability
2
5
11
22
27

2 Capital Markets and Investment Banking 2016: Time for Tough Choices and Bold Actions
IntroductionIntroductionNearly a decade after the global financial crisis, the capital
markets and investment banking (CMIB) industry remains
under pressure amid weak profits, high costs and lingering
strategic uncertainty. The inescapable reality is that the
industry’s restructuring efforts to date have failed to
produce sustainable performance. A more fundamental
change is required, based on the realization that for most
banks, the traditional model of global capital markets and
investment banking is no longer an option.
Globally, the average return on equity (ROE) for the
industry in 2015 was around 10 percent, unchanged from
2014. U.S. banks outperformed, with the biggest banks
generating an average ROE double that of their European
peers (10 percent versus 5 percent). The top 10 global
CMIB banks posted declining revenues for the third straight
year. This decline was driven by fixed income. Equities and

3Capital Markets and Investment Banking 2016: Time for Tough Choices and Bold Actions
Introductioninvestment banking actually experi-
enced some revenue growth in the last
three years. Many national and regional
banks were notable outperformers, win-
ning clients and taking a bigger share of
industry revenues.
For global banks saddled with high
operating costs and complexity, the
macro environment is particularly chal-
lenging, with persistently low interest
rates and slow economic growth under-
mining returns. The key fixed income,
currency and commodities sector
(FICC) is under particular pressure in
terms of revenues, capital charges
and costs, and FICC accounted for
just 46 percent of revenues for the
top 10 banks in 2015, compared with
61 percent in 2010. Across the indus-
try, the FICC price-to-book ratio was
about 0.6x at the end of 2015, implying
value destruction of $105 billion based
on the book value of equity allocated to
the business.
In the face of adversity, many banks
have retrenched, scaling back some
businesses and exiting others, which
has led to liquidity concerns in some
asset classes. Nonetheless, high costs
continue to undermine performance.
New technologies remain underutilized,
and many banks are struggling to make
fundamental changes in their operat-
ing models and embrace the potential
benefits of digitization. Moreover, CMIB
clients are challenging the value added
by banks today, with many reporting
that they feel overserved by sales in an
electronic/flow products world, and that
banks are struggling to provide critical li-
quidity in products when it really matters.
Clients are increasingly unbundling their
decision making and selecting the best
provider in each product and region.
Persistent and formidable headwinds
continue to hinder CMIB performance,
including lackluster revenue growth, re-
lentless waves of regulation, entrenched
product complexity, new competition
and increased uncertainty following the
UK’s vote to leave the European Union.
Nonetheless, McKinsey sees some
encouraging tailwinds beginning to de-
velop. These include a growing digital
toolkit, the emergence of specialized
FinTech players with which the industry
can collaborate and new industry util-
ities that are poised to drive economies
of scale. In addition, fines and litigation
costs have fallen over the past year and
may be set to decline further.
Based on proprietary data sources, in-
cluding McKinsey’s CMIB Revenue and
Profit Pools, the most comprehensive
data set in the industry encompass-
ing 175 banks, and on interviews with
200 industry leaders, McKinsey sees
a new market structure emerging for
CMIB over the next three to five years.
Four business models are likely to
succeed as economic, regulatory and
technological trends play out:
■ Global full-service players at scale
across products and services (three
to five banks).
■ Focused global players with scale
in chosen product bundles (eight to
12 banks).
■ National and regional commercial
banks with strong corporate fran-
chises and CMIB product factories.
■ Non-bank competitors starting out in
specific areas and then expanding into
related businesses.
Many banks will need to undergo
transformative change to transition to

4 Capital Markets and Investment Banking 2016: Time for Tough Choices and Bold Actions
Despite Improved Performance, Challen-ges Remain for CMIB
a successful operating model, scaling
back their aspirations for their CMIB
businesses and reducing their product
set, client mix and regional footprint, ac-
companied by a commensurate change
in their cost structure. Hard decisions
must be made, particularly with regard
to costs and banks’ commitment to the
CMIB business. Amid increased price
competition, banks must differentiate
themselves based on value propositions
that meet segmented client needs. Part
of the solution is to make better use of
data and analytics, along with financial
technology and electronic execution
and distribution.
There are eight key initiatives bank lead-
ers need to implement regardless of
which of the four operating models they
choose to pursue:
■ Defining the long-term business port-
folio; for many players this means
canceling the call option on rev-
enue growth.
■ Optimizing the balance sheet, lever-
aging integrated tools to address mul-
tiple constraints simultaneously.
■ Developing a clear client value propos-
ition and allocating scarce resources to
clients that are willing to pay for them.
■ Implementing a new cost framework,
fully leveraging digital technology
across the organization.
■ Participating in industry utilities, includ-
ing distributed ledgers (blockchains).
■ Leveraging advanced analytics, ma-
chine learning and robotics.
■ Upgrading management skills and win-
ning the war for talent.
■ Addressing conduct risk, risk culture
and incentives.
These eight areas together provide a
framework for action, with implementa-
tion based on banks’ individual resour-
ces and strategic purpose. The road to
a sustainable future remains open for
CMIB banks, but only if they make tough
choices and take bold actions now.
5Capital Markets and Investment Banking 2016: Time for Tough Choices and Bold Actions
Despite Improved Performance, Challenges Remain for CMIBCMIB has been travelling a slow road toward sustainable
performance, amid challenging market conditions,
regulatory burdens and increased competition.
Industry ROE was flat in 2015, at around 10 percent, in
line with the cost of equity, but the critical FICC business
remained under pressure, generating a declining share of
revenues for the third straight year.
European CMIB earnings were especially weak, with the
largest banks generating an average ROE of 5 percent in
2015, half that of their U.S. counterparts. High costs were
a significant drag on returns.
Despite Improved Performance, Challen-ges Remain for CMIB

6 Capital Markets and Investment Banking 2016: Time for Tough Choices and Bold Actions
U.S. banks benefited from a healthier
domestic market and leading positions in
key product franchises.
Continuing the trend seen in recent
years, the top 101 global banks struggled
the most, posting a combined ROE of
7 percent (Exhibit 1). For some of these
banks, all three components of the ROE
equation were headed in the wrong dir-
ection—revenues declined, costs rose
and the capital denominator became ever
more onerous. While almost all of these
banks had major cost-cutting efforts
underway, as a group they were only able
to reduce their cost-income ratio (CIR)
from 79 percent in 2014 to 76 percent
in 2015. This compares with a CIR of 52
percent for regional and national banks in
Europe and 53 percent in the U.S.
The leading banks’ share of the income
pie also declined. The top 10 accounted
for 51 percent of global fees in 2015,
compared with 57 percent in 2012.
Niche and regional players have gained
share and have significantly lower
cost-income ratios. This reflects their
simpler product sets and business mod-
els, as well as strong retail and corporate
franchises. Some of them have also
benefited from lighter capital burdens,
and most have lower litigation and com-
pliance costs. Attractive domestic market
structures, for example in Canada and
Australia, have also worked to the ad-
vantage of a number of banks.
The top 10 banks struggled more than
others in fixed income and investment
banking, but less so in equities. Their
rates businesses contracted signifi-
cantly, compared with national and
regional banks. In FX, the top 10 banks’
revenues rose from $16 billion in 2012
110 ~9~3 10058 17.4 10.5
min max Global CMIB industry post-tax ROE1 analysis, 2015E, based on nationality of banksPercent
Global CMIB
APAC 16
Americas 13
12
7
EMEA
10
Top 102
12.4
12.0
11.8
13.2
12.4
46
58
35
144
282 64
53
76
49
52
~5
~5
~4
~5
~6
ROERWA1
Cost/income ratio4
Revenues2
US$ billion Revenues/RWA
Tier 1 capital ratio3
ROE for top 10 CMIB banks was a disappointing 7% in 2015
Exhibit 1
1 Return on Tier 1 equity (ROERWA
), assuming tax rate of 30%
2 Includes both core and non-core divisions (i.e. bad banks) for Bank of America/Merrill Lynch, Barclays, BNP Paribas, Citicorp, Credit Suisse, Deutsche Bank, Goldman Sachs, JP Morgan, Morgan Stanley, UBS
3 Group level ratio
4 Includes operating expenses, litigation and restructuring expenses, one-offs, as well as costs in bad banks
Source: McKinsey CMIB Revenue Pools; McKinsey analysis; Coalition data
1 Coalition data has been used for analysis of Top 10 global banks. Note: McKinsey taxonomy for revenue pools is different from Coalition taxonomy, and hence Top 10 revenue trends would be different in Coalition publications.
7Capital Markets and Investment Banking 2016: Time for Tough Choices and Bold Actions
to $17 billion in 2015. Regional and
national banks grew revenues from
$22 billion in 2012 to $31 billion in 2015,
driven by expansion in Asian. In repo, a
key enabler of success in fixed income,
regional and national banks increased
balances as many of the top 10 banks
cut back significantly.
Regional disparities persisted in 2015
among regional and national banks.
Domestic Asia-Pacific (APAC) banks out-
performed their rivals in the U.S. and Eur-
ope. APAC ROE was 16 percent, on the
back of 8 percent CAGR. U.S. and EMEA
banks outside the top 10 posted ROEs of
12 percent and 13 percent, respectively,
against a relatively stable revenue base
(Exhibit 2).
FICC undermines top 10 banks
Despite significant restructuring efforts,
FICC last year remained one of the
most challenged businesses in terms
of revenues, capital charges and costs.
Among the top 10 banks, trading vol-
umes declined significantly, and FICC
accounted for 46 percent of revenues
in 2015, compared with 61 percent in
2010 (Exhibit 3, page 8). The business
generated $59 billion of revenues for the
top 10 banks in 2015, compared with a
$92 billion peak five years ago.
According to McKinsey analysis, the
FICC price-to-book ratio for the top
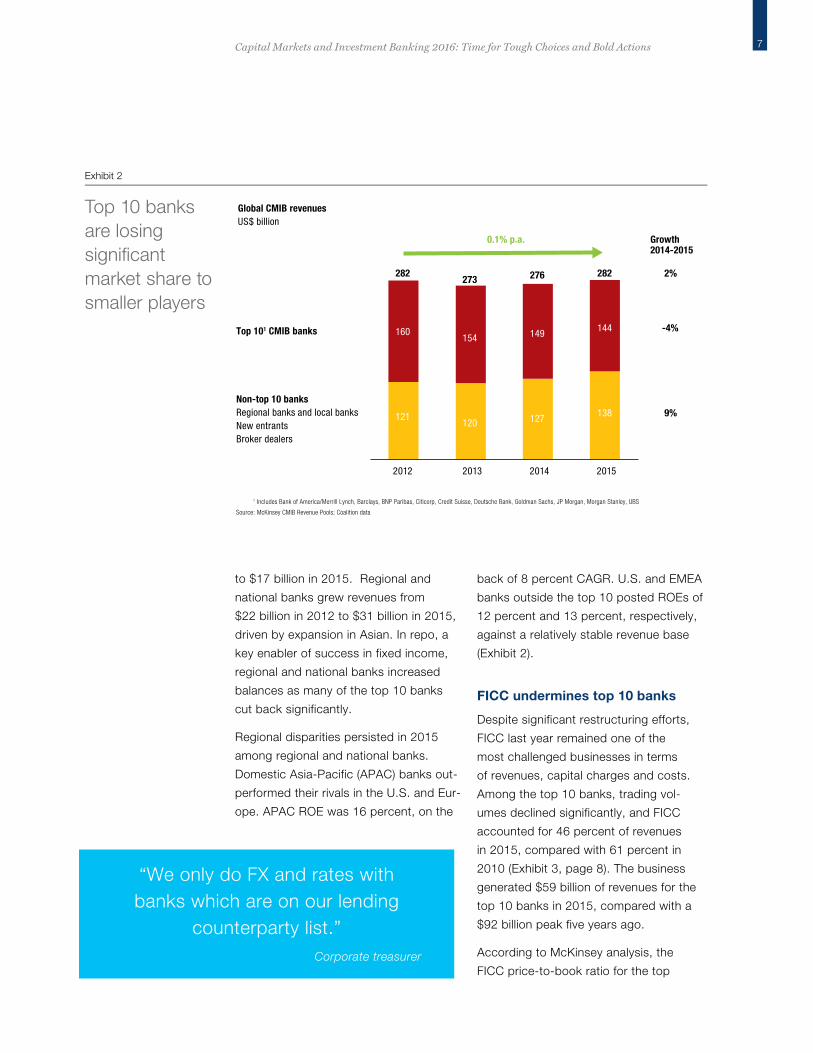
Growth2014-2015
-4%
9%
2%
2012 20142013 2015
Non-top 10 banksRegional banks and local banksNew entrantsBroker dealers
Top 101 CMIB banks
0.1% p.a.
144149154160
282276273282
138127120121
Global CMIB revenuesUS$ billion
Top 10 banks are losing signi�cant market share to smaller players
Exhibit 2
1 Includes Bank of America/Merrill Lynch, Barclays, BNP Paribas, Citicorp, Credit Suisse, Deutsche Bank, Goldman Sachs, JP Morgan, Morgan Stanley, UBS
Source: McKinsey CMIB Revenue Pools; Coalition data
“We only do FX and rates with banks which are on our lending
counterparty list.” Corporate treasurer

8 Capital Markets and Investment Banking 2016: Time for Tough Choices and Bold Actions
10 banks was about 0.6x at the end
of 2015, implying value destruction of
$105 billion compared with book value of
equity and suggesting that more restruc-
turing is required. In the past six months,
several banks have launched additional
rounds of cost cuts, reducing front-office
staff by 5 to 20 percent.
Four structural trends continue to inhibit
the economics of FICC:
■ Regulation is constraining capital, en-
couraging balance-sheet contraction
and reducing trading inventory.
■ Limitations on principal trading are
tempering banks’ ability to generate
significant risk-driven returns.
■ Electronification and market structure
changes (e.g., SEF trading and central
clearing) are driving continued margin
compression in flow markets.
■ New entrants are taking market share
by exploiting cost and capital arbitrage
in asset classes without barriers to
entry (i.e., areas with central clearing,
impartial access and central trading
venues such as SEFs or exchanges).
Over the next few years, the FICC busi-
ness is likely to remain challenged by a
combination of structural and cyclical
factors. Capital requirements will con-
tinue to increase, as the latest wave of
regulations come into force (e.g., Fun-
damental Review of the Trading Book
[FRTB]). The economics of new agency
models do not compensate for lost
principal business, and continued slow
economic growth and low interest rates
may make the business–especially rates–
less attractive.
61% 55% 60% 51% 48% 46%
-13%
Fixed income:
CAGR 2009-2015
104
3631
79
3629
97
3429
79
4233
72
4136
66
4434
… Fixed income as share of total CMIB revenue pool FICC Equities IBD
2010
66%
148
4233
2009 2011 2012 2013 2014 2015
Top 10 CMIB banks’ FICC revenue pools have declined since 2010
Exhibit 3
1 Top 10 includes: (2009 to 2010) BAML, BARC, CITI, CS, DB, GS, JPM, MS, RBS, UBS; (2011 onwards) BAML, BARC, BNPP, CITI, CS, DB, GS, JPM, MS, UBS. Revenue pool excludes proprietary trading and principal investments.
Source: Coalition data; McKinsey analysis
1 Includes Bank of America/Merrill Lynch, Barclays, BNP Paribas (after 2013), Royal Bank of Scotland (before 2013) , Citicorp, Credit Suisse, Deutsche Bank, Goldman Sachs, JP Morgan, Morgan Stanley, UBS; excludes commodities and proprietary trading
2 Revenue pool for capital market and investment banks; includes �xed income, commodities, equities and investment banking; excludes proprietary trading and PI
Source: Coalition data; McKinsey analysis

9Capital Markets and Investment Banking 2016: Time for Tough Choices and Bold Actions
Crosscurrents on costs
CMIB operating costs have declined by
just 2 percent since 2010, with efficiency
efforts offset by stranded costs caused
by incomplete exits, increased compli-
ance and regulatory expenses and fines.
Efforts to reduce costs have accelerated,
with the largest banks in particular di-
vesting assets or exiting select sub-busi-
nesses or lines of business. Banks have
also cut headcount, with FICC numbers
falling 33 percent across the top 10
banks between 2010 and 2015.
Still, crosscurrents have impeded prog-
ress, as banks have sought to disen-
tangle complex global operations. Cost
cutting in technology and support func-
tions has been particularly challenging,
with platforms often deeply embedded
and decommissioning programs tend-
ing to run over long periods.
In addition, banks often take a
front-office view on restructuring and
cost-cutting, e.g., they try to reduce
costs but salvage as much revenue as
they can, often preserving the option
to return to a business when condi-
tions improve. Managers making these
decisions are often incentivized by
revenue targets and do not always fully
understand the downstream cost impli-
cations. When a trading desk is closed,
for example, its supporting technology
may be necessary for other parts of the
franchise, leading to a smaller revenue
base supporting the same level of fixed
costs. The economics of this scenario
and the stranded costs are sub-opti-
mal. The cost challenge has been
particularly severe for the top 10 CMIB
banks, where average CIRs rose to
an estimated 76 percent in 2015 from
61 percent in 2010 (Exhibit 4).
CAGR 2010-2015
RevenuesUS$ billion
-3%
Operating costs1
US$ billion-2%
Average front of�ce FTEThousands
-4%
CIR2
Percent +4%
Operating cost1 per producer US$ million per head
+3%
Revenues per producer US$ mn per head
+1%
144
2011
102
6.1
71
1.7
2.4
160
2012
103
5.5
66
1.9
2.9
154
2013
99
5.2
70
1.9
2.9
149
2014
99
5.0
74
2.0
3.0
171
2010
104
6.1
61
1.7
2.8
144
2015
97
4.9
74
2.0
2.9
76% including non-core
Top 10 global investment banks (core CMIB divisions)Top 10 CMIB banks’ cost-to-income ratios have risen
Exhibit 4
1 Excludes costs allocated to non-core divisions, litigation, and restructuring expense
2 Includes litigation and restructuring expense, but excludes costs in non-core divisions
Source: Coalition data, McKinsey analysis

10 Capital Markets and Investment Banking 2016: Time for Tough Choices and Bold Actions
Compulsory expenses have also in-
creased, driven by regulation, IT invest-
ment and fines. Large banks have spent
hundreds of millions of dollars a year on
regulatory costs related to stress testing,
the comprehensive capital analysis and
review, requirements under Basel III for
improved oversight and reporting and
compliance and conduct-related invest-
ments. Expenditure has increased both
in FTEs and systems, and firms have not
yet realized the benefits of automation.
Fines and litigation costs have amounted
to more than $175 billion over the past
seven years, averaging more than 8 per-
cent of revenues.
Capital impact on balance sheets
Higher capital requirements have been
a drag on ROE for all CMIB banks, but
for global banks the amount of capital
required per unit of revenue has risen by
up to 500 percent in businesses such as
repo, structured credit and some areas
of rates.
The top 10 banks (five in Europe and five
in the U.S.) reduced their collective CMIB
balance sheet from a peak of almost
$13 trillion in 2008 to less than $8 trillion
in 2015. This calculation includes the
absorption of Bear Stearns, Lehman and
Merrill Lynch. The vast majority of the cuts
came from European banks, which re-
duced their collective balance sheets from
around $9 trillion to $4 trillion (Exhibit 5).
Banks’ efforts to reduce balance sheets
and cut costs have paid some dividends,
but the largest players continue to strug-
gle with legacy portfolios and sub-opti-
mal product offerings. High costs and
relatively weak performance in FICC are
continuing concerns, and with interest
rates low net interest margins are likely
to remain under pressure.
2006 2007 2008 2009 2010 2011 2012 2013 2014 2015
8,000
3,000
9,000
10,000
6,000
5,000
4,000
1,000
7,000
2,000
0
Top 5 Europe Top 5 U.S.US$ billion
Top 5 U.S. CMIB banks: Bank of America/Merrill Lynch1
CiticorpGoldman SachsJP Morgan2
Morgan Stanley
Top 5 European CMIB banks: BarclaysBNP ParibasCredit Suisse3
Deutsche BankUBS
Assets: Top 5 U.S. versus European CMIB banks
Exhibit 5
1 Includes Merrill Lynch for 2006-2008
2 Includes Bear Stearns for 2006 and 2007
3 Includes corporate banking assets
Source: Company annual reports, McKinsey analysis
Amid Persistent Strong Head-winds,Tailwinds

11Capital Markets and Investment Banking 2016: Time for Tough Choices and Bold Actions
Amid Persistent Strong Head-winds,Tailwinds Amid Persistent
Strong Headwinds, Tailwinds EmergeOver the past five years, low interest rates, heightened
regulation and economic uncertainty have undermined
CMIB profitability. Banks have responded with major cost-
cutting, but these measures have failed to significantly
improve performance. The chances of a cyclical
macroeconomic upturn in the medium-term appear slim.
That suggests that top-line growth will remain constrained,
while regulation will continue to dampen earnings. Regional
and national banks, along with alternative broker-dealers,
are intensifying competition, and the still evolving impact of
Brexit may lead to new strategic challenges.
Still, some tailwinds are starting to emerge, with digitization
offering a potential 30 percent P&L boost over the next

12 Capital Markets and Investment Banking 2016: Time for Tough Choices and Bold Actions
three years and growing opportunities
for partnering with FinTechs and joining
industry utilities. In addition, the worst of
the post-crisis wave of fines and litigation
may be over.
Formidable headwinds continue to blow
No relief from the top line
As the global economy began recovering
in 2012, many in the CMIB industry ex-
pected revenues to resume growing and
possibly jump back to pre-crisis levels
(e.g., $326 billion in 2006; $362 billion in
2007). Since then, however, the industry
revenue pool has remained stubbornly flat.
Global CMIB revenues in 2015 were $282
billion, and performance for the top CMIB
banks has shown no signs of improve-
ment thus far in 2016. Matching 2015 rev-
enues would be a best-case scenario, and
would depend on a potential rate hike in
the U.S. to boost some of the most chal-
lenged parts of the FICC business.
Relentless waves of regulation
Regulation continues to be a primary
challenge, increasing the cost of some
businesses beyond economic sustain-
ability and dampening ROEs. McKinsey
estimates the unmitigated effects of pend-
ing regulation could cut ROE at the top
10 banks to 3.4 percent, from 6.6 percent
in 2015 (Exhibit 6). Mitigation efforts, in-
cluding in the extreme case the closure of
some businesses, could offset the impact.
The most important impending regula-
tions include the following:
Fundamental Review of the Trading Book
FRTB overhauls the market risk frame-
work introduced under Basel 2.5. It is
vast in scope and touches on a number
of complex and pivotal issues, from the
design of internal market risk models to a
new mandatory standardized calculation
for trading book assets.
McKinsey anticipates a substantial
impact on capital requirements, with
market risk weighted assets rising to
more than $1 trillion by 2020, from about
$650 billion at the end of 2015, absent
mitigating actions.2
The overall impact of FTRB, prior to
mitigating actions, could require the top
banks to hold approximately $40 billion
to $65 billion of additional capital to
maintain current Common Equity Tier 1
(CET1) ratios, likely reducing ROE by
0.7 percentage points on average.
The top banks also had to establish
budgets of as much as $100 million to
$150 million to ensure compliance, and
are working on actions including target-
ing technical improvements (RWA opti-
mization) and business levers (redesign
of products, hedging approaches, busi-
ness model adjustments). Maintaining a
trading risk infrastructure and managing
required data will be cost intensive.
Therefore, it is crucial for the industry to
find ways to work together; for example
to address some of the underlying data
challenges, such as un-modelable risk
factors, to reduce implementation and
running costs. McKinsey believes that
there will be a race to the finish line in
2019. Not all players will be able to get
their advanced models approved in time
and so will have to revert to the more
punitive standardized models.
Basel IV rules
New capital requirements under so-
called Basel IV rules, including RWA
capital floors for credit and operational
2 The Fundamental Review of the Trading Book: Implications and Actions for Banks, McKinsey Working Papers on Corporate & Investment Banking, No. 11, December 2015.

13Capital Markets and Investment Banking 2016: Time for Tough Choices and Bold Actions
risk capital based on standardized
approaches and higher Tier 1 cap-
ital requirements, may reduce the top
10 banks’ ROE up to 0.6 percentage
points by 2019.
■ Revised IRB credit risk modeling
and standardized approach floors.
The current Basel consultation paper
on the Internal Rating Based (IRB)
approach for calculating credit risk
reduces the scope of IRB models for
some exposures (e.g., banks/ financial
institutions, large corporates, special-
ized lending and equity), introduces
input parameter floors for core credit
risk parameters (probability of default,
loss given default and credit con-
version factors), and specifies other
parameter requirements. Overall, an
aggregated output floor based on
the standardized approach is envis-
aged. In derivatives, calculation of the
CVA capital charge will be limited to
standardized and basic approaches.
The internal model method (IMM) for
counterparty credit risk will remain,
but there will be a standardized ap-
proach floor.
■ Mandatory operational risk stan-
dardized approach. Banks will no
longer be able to calculate operational
risk capital using internal models, and
Capital demand
Capital supply
Liquidity/ funding/other
FRTB2
Baseline 2015E
STA/cap �oor3 – credit risk
OTC shift to CCP
LCR/NSFR
TLAC4
Post regulation (2019)
Structural reform
Leverage ratio (including G-SIB)
Capital ratio (including G-SIB)
Standardized approach – operational risk
3.4
6.6
0.3
0.7
0.7
0.2
0.4
0.1
0.2
0.2
-50%
Impact of regulations1 on CMIB ROE for top 10 global investment banksPercent
Additional regulation impacting CMIB businesses:• Capital charges for FRTB and
STA capital �oors on credit and operational risk
• Capital and leverage ratios including G-SIB surcharges
• TLAC with minor incremental impact5 as Tier 1 capital requirement already ful�lled through capital and leverage ratios
• Shift to CCP with small impact as 60% of OTC derivatives have already shifted (potential move capped at ~75%)
• Liquidity and funding requirements with limited impact as top 10 banks already meet LCR/NSFR requirements
• Structural reforms impacting funding costs from expected rating downgrade
• Other regulations like MiFID II will impact ROE to a lesser extent, primarily through costs
0.6
Regulation could halve future ROE for top 10 CMIB banks, before mitigating actions
Exhibit 6
1 Only direct impact from regulation included (�rst-order effects), before mitigation actions and business changes
2 Fundamental Review of the Trading Book
3 Standardized Approach capital �oor
4 Total loss absorption capacity
5 Impact quanti�ed as additional cost of funding to raise subordinated debt
Source: McKinsey analysis

14 Capital Markets and Investment Banking 2016: Time for Tough Choices and Bold Actions
the Advanced Measurement Approach
will be abolished. The Basel Com-
mittee has published a consultation
document on the Standardized Meas-
urement Approach (SMA) for oper-
ational risk, which will replace current
approaches as a ”single non-model-
based method.” Due to their currently
low operational capital charges, Euro-
pean banks will likely be impacted
more than their U.S. peers.
■ Dual capital constraints: RWA and
leverage. Capital ratios and the lever-
age ratio will be phased in by 2019.
U.S. Global Systemically Important
Banks (G-SIBs) face a capital buffer of
up to 4.5 percent and a 5 percent en-
hanced supplementary leverage ratio.
G-SIB surcharges may be added to
Comprehensive Capital Analysis and
Review (CCAR) requirements in 2017
or 2018, which could significantly
restrain ROEs.
Derivative rules
A wave of regulation is increasing capital
requirements for over-the-counter (OTC)
derivatives and pushing trades onto
regulated venues and into central clear-
ing. The latter is expected to reduce the
top 10 banks’ ROE by 0.4 percentage
points by 2020. In addition to the Dodd-
Frank Act Title VII, which is largely in
effect, the primary drivers are:
■ European Market Infrastructure
Regulation: Central clearing for
mandated OTC products, new risk
management standards, reporting and
margining of non-cleared derivatives.
■ Markets in Financial Instruments
Directive II (MiFID II)/ Markets in
Financial Instruments Regulation
(MiFIR): Trading of shares and cer-
tain classes of derivatives moves to
regulated markets, multilateral trading
facilities or organized trading facilities,
mirroring in Europe the requirements of
the Dodd-Frank Act.
MiFID II and MiFIR have six broad impli-
cations for CMIB businesses:
1. MiFID II changes the revenue model
for sell-side research and is likely to
reshape the sales revenue model by
concentrating trade execution. Mc-
Kinsey expects an increase in hard
currency payments for research and
advisory services and a reduction in
the number of brokers used for re-
search, as clients reassess value and
consider administrative costs. Several
brokerage firms have already started
to adjust by downsizing and “junior-
izing” research teams, while some
smaller broker dealers have exited the
research business.
2. Product and sales trading processes
will change, due to extended trade
transparency and transaction reporting.
3. Streamlined market platforms will re-
sult in higher minimum professional
and operational market standards.
Transparency of fixed-income organ-
ized trading facilities might also de-
crease market efficiency and liquidity.
4. Banning inducements in retail and
private banking could result in rev-
enue losses in a relatively attractive
client segment.
5. Cross-border market access will lead
to increased competition, with more
third-country and non-discriminatory
access to central counterparties and
trading venues.
15Capital Markets and Investment Banking 2016: Time for Tough Choices and Bold Actions
6. Tighter regulation of commodity trad-
ing will result in clearer position limits
and increased reporting requirements
for commodity derivatives.
IFRS 9
Banks switching to IFRS 9 accounting
standards for financial instruments (re-
placing IAS 39) by 2018 will incur a one-
time hit, due to a new impairment model
(one of three core IFRS 9 changes). IFRS
9 requires loan loss provisions based on
expected credit losses instead of incurred
losses for assets held at amortized costs
and measured at fair value through other
comprehensive income. The strategic
and business implications of IFRS 9 have
been largely ignored, the primary focus
being on achieving compliance and tech-
nical and methodological issues.
XVA derivatives valuation adjustments
In recent years, the growing number of
fair-value adjustments, collectively called
XVAs, has prompted institutions with
active trading books to examine their
pricing and infrastructure capabilities.
In addition, banks must now measure
and effectively manage the KPIs of sales
and trading units. Long-dated business,
uncollateralised or with “dirty” credit sup-
port annexes (CSAs)—i.e., non-cash col-
lateral—are particularly impacted, where
most institutions are looking to review
CSA collateral terms in a restructuring
and simplification effort.
Banks also view various valuation adjust-
ments differently. While credit valuation
adjustments, funding valuation adjust-
ments and initial margin adjustments
have become commonplace, there is less
consensus around the treatment of regu-
latory capital cost adjustments, known
as KVAs.
McKinsey sees three important near-term
themes for the industry to address:
1. The typically large upfront derivatives
P/L, which is driven by accounting
rules, versus the economic value of
the trades over time as a function of
capital costs.
2. Organizational challenges involved in
having an XVA desk separate from
individual trading desks and capital
management, particularly in the context
of business selection, hedging and col-
lateral management.
3. The large computational effort required
to evaluate the XVA bundle and smart
optimization methods available for
real-time decision making.
Banks should focus further on desk gov-
ernance, business steering methodology
and enabling analytics. Banks can review
their XVA desk operating model, with
increased focus on standardized KPIs
across desks, additional management
transparency and centralized report-
ing. They can start by creating a map
of stakeholders and decision points for
trade approvals, CSA negotiation, hedg-
ing and collateral. In addition, banks
often have opportunities to standardize
approval procedures and centralize re-
porting capabilities of capital hurdles,
XVA trade pricing, and KVA consumption
per line of business. Banks should also
assess opportunities to optimize deriva-
tives portfolios to significantly reduce the
overall XVA calculation burden, and re-
view options for cost-efficient implemen-
tation of calculation frameworks.
Capital Markets Union
Europe’s planned Capital Markets Union
aims to lower the cost of funding across
the eurozone and make the financial sys-
16 Capital Markets and Investment Banking 2016: Time for Tough Choices and Bold Actions
tem more resilient. In September 2015,
the European Commission adopted
a plan for 33 actions to establish the
building blocks of an integrated capital
market in the European Union by 2019.
The Capital Markets Union might create
a new business opportunity for securitiz-
ations and alternative funding for small
to medium enterprises, moving Europe
closer to the funding structure mix seen
in the U.S. (banking book versus debt
capital markets), assuming securitization
is still economically attractive post-FRTB.
The positive news for CMIB banks is that
the major building blocks of the post-
crisis regulatory framework are falling
more clearly into place. The final act has
yet to play out, but at some point banks
should start to feel the benefits of regula-
tory certainty in setting business priorities
and allocating capital.
New entrants and rising competition
New entrants are leveraging technology,
a lower cost base and lighter capital loads
to make inroads into the CMIB industry.
■ Asset managers, high-frequency trading
firms and technology players are com-
peting in derivative markets including
swaps, options, futures and FX.
■ High-speed traders dominate U.S.
equity and government bond trading
volumes (two-thirds of NYSE traders
are non-traditional players).
■ Private equity funds are entering
the collateralized loan obligation
(CLO) management business (mainly
originate-to-distribute).
■ Commercial and national banks are
using their stronger balance sheets and
higher credit ratings to offer repo as lar-
ger banks withdraw.
Whether disruptors will gain market
share at the expense of full-service rivals
remains to be seen. Established players
have strong franchises and valuable re-
sources (balance sheet, research, cor-
porate access).
Uncertainty surrounding Brexit
The UK vote to leave the European Union
on June 23, 2016 has created high lev-
els of uncertainty and is another factor
to consider with potentially far-reaching
medium- and long-term implications.
Light tailwinds gather strength
While CMIB businesses face numerous
headwinds, there are also some encour-
aging tailwinds emerging. These include
tech-enablement as a tool for both
growth and cost reduction, the potential
for collaboration with specialized FinTech
players and new industry utilities that are
poised to deliver economies of scale.
Fines and litigation costs are also set to
diminish, as long as banks continue to
focus on strong operational risk manage-
ment and improvements to risk culture.
Tech-enablement comes of age
While it has yet to be fully realized,
digitization has the potential to de-
liver an estimated 20 to 30 percent
P&L improvement or a 2 to 3 percent
improvement in ROE over three years
for CMIB banks.3 There are two paths
banks can take in pursuit of these
benefits. The first, the “all-in” approach,
makes sense for a few institutions with
a strong focus on electronic trading and
a track record of technology delivery.
Successful transformation for these
banks will lead to improved electronic
market-making, execution and ana-
lytics, and an increased share of liquid
3 Two Routes to Digital Success in Capital Markets, McKinsey Working Papers on Corporate & Investment Banking, Number 10, October 2015.

17Capital Markets and Investment Banking 2016: Time for Tough Choices and Bold Actions
asset classes. All-in banks implementing
digital solutions throughout the value
chain could achieve 30 percent-plus
growth in digital businesses, even in a
low-growth environment.
A more effective path for the majority of
banks is the less risky and less expen-
sive “targeted” approach, with digital
investment focused on protecting client
franchises and reducing operating costs.
Unlike the all-in banks, targeted institu-
tions will not view technology as a com-
petitive advantage and may decide to
outsource in certain areas.
Digitization has the potential to produce
revenue upside of 4 to 12 percent, en-
hance customer relationship manage-
ment and increase cross-selling. On
the other hand, 6 to 12 percent of the
top 10 banks’ revenues are at risk of
digital disruption.
On the cost side, digitization could deliver
savings of 25 percent on the applicable
cost base (Exhibit 7), which would trans-
late into a P&L impact of 16 percent at a
65 percent CIR.
Technology has the potential to deliver
benefits across the entire value chain.
However, the current focus of bank in-
vestments in digitization initiatives varies
widely based on the “e-maturity” of the
asset class. For example, in highly elec-
tronic asset classes like cash equities
and G10 spot FX, banks are investing in
differentiated client-facing functionality to
drive revenue and share gains (e.g., en-
hancements to dealer platforms, includ-
ing customization, integration with wealth
management and transaction-banking
platforms, crossing against internal flows,
and value-added services). However, in
less electronically mature asset classes
(e.g., credit, securitized products) banks’
35%
-20%
5%
24%
25%
40%
25%
40%
5%
25%
13%
40%
2020 projected costs (normalized)1
14%
58%
8%
100%
10%
10%
Cost savings through digital Low-speed bank
6%
25%
1%
1%
3%
14%
High-speed bank
4%
24%
1%
-3%
3%
21%Frontof�ce
Total
Operations
IT
Other
Risk & �nance
X% % change on applicable base (e.g., 8-15% growth for rates)Low-speed bank High-speed bank
Potential savings from digital innovation (to 2020)– functional viewSavings from digital innovation
Exhibit 7
1 Implicit is an assumed cost to revenue ratio of 65% before savings from digitization
Source: McKinsey analysis
18 Capital Markets and Investment Banking 2016: Time for Tough Choices and Bold Actions
investments in digitization are less fo-
cused on revenue and share gains and
much more heavily geared towards driv-
ing cost efficiencies.
Banks can reduce front-office costs
through electronic onboarding, KYC
and e-CRM tools. They can leverage
e-tools that reduce manual work and
enhance front-line productivity, and
put machine-learning and analytics at
the fingertips of front-line sales and
trading staff.
Another current focus is front-to-back
automation. Many banks are applying
machine-learning and robotics to areas
including product control, operations, mid-
dle-office and risk management. Some are
exploring new technologies to dramatically
lower the cost of transacting; for example
blockchains in securities services.
At the same time, the infrastructure
underlying capital markets is becoming
fundamentally more efficient and scal-
able. Leading banks are utilizing public
cloud infrastructure to a more signifi-
cant degree than ever before, as risk
management policies related to this area
are changing and executives are getting
more familiar and comfortable with this
relatively newer technology. Banks taking
this route have seen dramatic results. In
one example, a CMIB business used the
increased capacity of a cloud service to
reduce the time needed to compute a
derivatives pricing grid from 8 hours to
15 minutes, and the cost to under $10.
Broadly, 30 to 40 percent of workloads
could be migrated to public cloud and
see similar improvements.
Most leading CMIB banks have em-
braced the open source and unstruc-
tured data management environment,
leveraging Hadoop and other platforms
to rapidly derive insights from both
structured and unstructured data. In a
recent example from retail banking, a
UK bank collaborated with Google to use
the internet giant’s Cloud Platform (and
analytics tools such as Google Big Query)
to analyze customer behavior and reap
actionable insights in minutes as op-
posed to days.
Another important technology develop-
ment for CMIB businesses is the shift to
an external, software-as-a-service model
for technology. Where once the norm
was heavily customized installed servi-
ces, banks are moving to an industry util-
ity or “business-process-as-a-service.”
Banks are also digitizing customer
journeys in areas such as sub-fund
onboarding, credit risk management
and derivatives servicing, using agile
development methods.
Technology and digitization are not new
topics for the banking industry. In some
cases, promises of increased revenues
and cost savings have outpaced the re-
ality. Today, however, tech-enablement
has become a true tailwind for the CMIB
industry. Not every digital investment will
deliver a return (particularly in the front
“It will probably not happen because of structural issues, but if someone could create a buy-side to buy-side venue for credit that had real liquidity, I’d be the
first person on it.” Real money investor

19Capital Markets and Investment Banking 2016: Time for Tough Choices and Bold Actions
office), but many of the digital tools and
technologies emerging today will become
the foundational infrastructure for a more
streamlined and cost-effective industry.
FinTechs not as disruptors but as partners to drive improvements
The question of how disruptive FinTech
firms will be for the CMIB industry is a
subject of frequent debate, but there is a
different way to view the rise of FinTechs.
Most FinTech firms are focused not on
disrupting the banking model but on en-
hancing the client experience or enabling
specific elements of the value chain
(Exhibit 8). Many are seeking to partner
with banks and drive revenue upside,
cost reduction or capital optimization.
And a significant percentage of banks are
taking a similar view. Fifty-three percent
of CMIB leaders surveyed by McKinsey in
April reported that their institutions were
partnering to develop and customize
FinTech solutions, and 32 percent of the
firms are minority investors in FinTechs.
In the pre-trade space, big data and
next-generation analytics are giving
banks an enhanced understanding of
client needs and enabling them to offer
predictive “next best” products. One
firm has developed a natural language
market data analytics system capable of
answering complex financial questions
posed in English. Several banks and new
entrants use in-house or FinTech solu-
tions to provide insights for traders based
on social media postings.
Further down the value chain, there are
applications for confirmations and recon-
ciliation, reference data operations, prod-
uct identities, trade cost analysis, and
systems to optimize cash and collateral.
Efforts are also underway in the block-
chain arena to develop “smart securities,”
Description Examples
“Disrupt themodel”
~20% of FinTechs in CIB looking to fundamentally disrupt the business model
Examples: peer-to-peer lending, bond and equity issuance, securities services
~20% of FinTechs in CIB playing an intermediary role, providing enhanced client experience
Examples: FX and payments processing, trade nance
~60% of FinTechs in CIB have �nancial institutions as customers, enabling efciency and effectiveness
Examples: leveraging machine learning, work-�ow, distributed ledger, big data and analytics
secondmarket
crowdcube
LDGER
currency cloud
Ebury
Palantir
DUCO
CloudMargin
WorkFusion
“Own the relationship”
“Enable the value chain”
Three types of FinTech models
Exhibit 8
Source: McKinsey Panorama FinTech
20 Capital Markets and Investment Banking 2016: Time for Tough Choices and Bold Actions
programmable financial contracts aimed
at reducing reconciliation costs and in-
creasing security and transparency.
Other innovations include alternative
distribution models for research, crowd-
sourcing of data, sentiment and opinions,
shared platforms, and “segment of one”
mass customization of client preferences
and behavior.
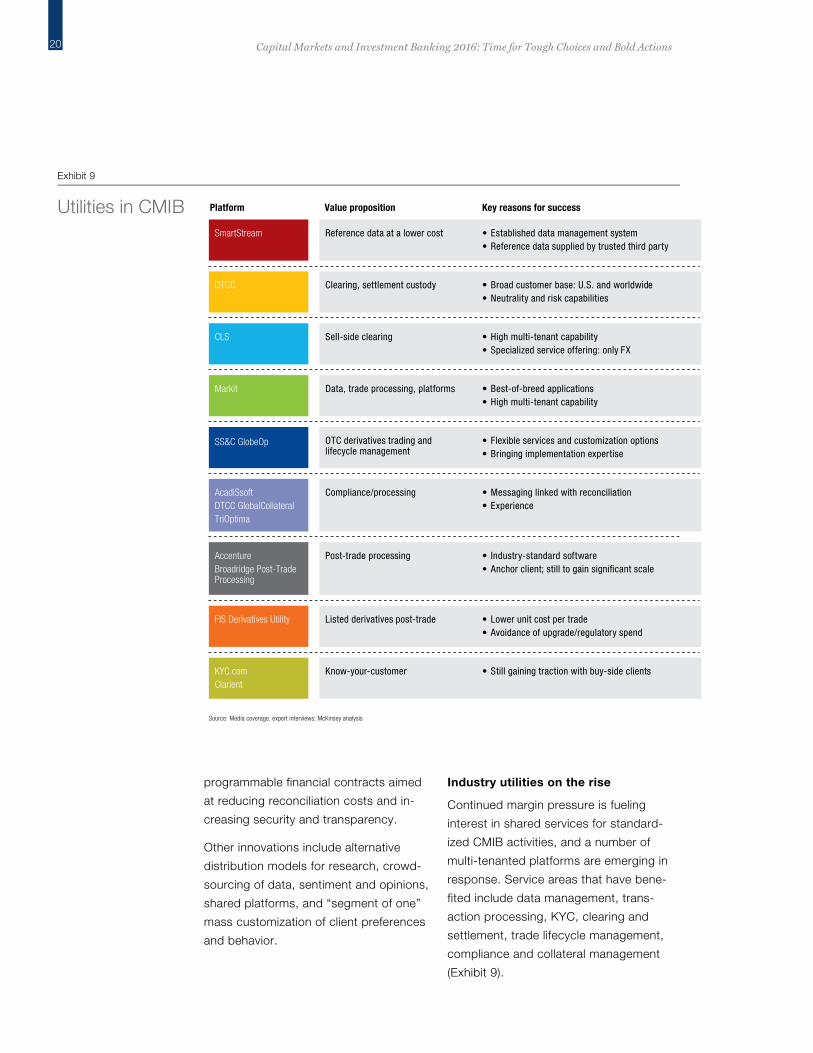
Industry utilities on the rise
Continued margin pressure is fueling
interest in shared services for standard-
ized CMIB activities, and a number of
multi-tenanted platforms are emerging in
response. Service areas that have bene-
fited include data management, trans-
action processing, KYC, clearing and
settlement, trade lifecycle management,
compliance and collateral management
(Exhibit 9).
Value propositionPlatform Key reasons for success
SmartStream Reference data at a lower cost Established data management systemReference data supplied by trusted third party
••
DTCC Clearing, settlement custody
CLS Sell-side clearing
Markit Data, trade processing, platforms
SS&C GlobeOp OTC derivatives trading and lifecycle management
AcadiSsoftDTCC GlobalCollateralTriOptima
Compliance/processing
AccentureBroadridge Post-Trade Processing
Post-trade processing
FIS Derivatives Utility Listed derivatives post-trade
Broad customer base: U.S. and worldwideNeutrality and risk capabilities
High multi-tenant capabilitySpecialized service offering: only FX
Best-of-breed applicationsHigh multi-tenant capability
Flexible services and customization optionsBringing implementation expertise
Messaging linked with reconciliationExperience
Industry-standard softwareAnchor client; still to gain signi�cant scale
Lower unit cost per tradeAvoidance of upgrade/regulatory spend
••
••
••
••
••
••
••
KYC.comClarient
Know-your-customer Still gaining traction with buy-side clients•
Utilities in CMIB
Exhibit 9
Source: Media coverage, expert interviews; McKinsey analysis

21Capital Markets and Investment Banking 2016: Time for Tough Choices and Bold Actions
In addition to delivering cost and effi-
ciency benefits, utilities could help cata-
lyze banks’ technology upgrades and
lead to higher-quality services, fewer
breaks and fails and additional scale. De-
spite those significant potential benefits,
adoption of utilities in CMIB is moving
slowly. Establishing collaboration rules
and governance is a challenge and it is
often difficult to determine which oper-
ator is best.
Key success factors for shared utilities
include focusing first on core com-
petencies and then broadening the
offering; a clear value proposition with
immediate cost benefits (if possible);
neutrality of platform/user owner-
ship; broad customer base to achieve
scale; flexibility in servicing clients; and
implementation expertise.
Legal costs and fines may decline
Fines and litigation costs for banks have
fallen over the past year (Exhibit 10).
Fines as a percentage of revenues
were 5 percent in 2015, compared with
18 percent in 2014. McKinsey expects
fines will continue to abate over the next
few years, contingent on banks continu-
ing to prioritize operational risk manage-
ment and risk culture.
10%
27
2012
5%
13
2015
2%
X%
5
2010
17%
46
2013
18%
51
2014
5%
12
2011
Fines as a % of revenues
Fines incurred1 in 2009-2015US$ billion
Primary sources of nes Total
Mortgages ~$140bn
Anti-money laundering ~$15bn
LIBOR ~$10bn
FX ~$10bn
Non-�nancial risks remain a focus, but �nes decreased in 2015
Exhibit 10
1 Overall banking, not just CMIB business
Source: Media coverage, SAS OpRisk losses, McKinsey analysis

22 Capital Markets and Investment Banking 2016: Time for Tough Choices and Bold Actions
Tough Choices: Four Business Models for the Tough Choices:
Four Business Models For the Future Even in a challenging environment, some CMIB businesses
are performing well, generating ROE above the cost of
equity with sustainable and profitable business models.
National and regional banks are notable outperformers,
despite increasing pressure from difficult trading conditions
recently. Many European and Asian regional and national
banks that performed well in 2015 are experiencing a more
challenging market environment in 2016.
Many of the largest banks, on the other hand, are
struggling, with insufficient ROE and a lack of strategic
coherence. For most of these big banks, the days of being
a global universal player are gone, as evidenced by the
large-scale retrenchment seen over the past two years,
23Capital Markets and Investment Banking 2016: Time for Tough Choices and Bold Actions
Tough Choices: Four Business Models for the
particularly in FICC, where the majority
have reduced headcount and exited
non-core businesses. The sharp reduc-
tion in global universal institutions goes
hand-in-hand with a number of business
model changes that are set to emerge.
McKinsey expects four new models to
take hold:
■ Global full-service players at scale
across products and services (three to
five banks)
■ Focused global players with scale
in select product bundles (eight to
12 banks)
■ National or regional commercial banks
with strong corporate franchises and
CMIB product factories
■ Non-bank competitors starting out in
specific areas and then expanding into
related businesses.
Global full-service banks
Before the financial crisis, there were
10 or more CMIB banks with global
full-service aspirations. Many are now
scaling back their ambitions and re-
structuring, particularly in Europe. Once
this trend plays out, three-to-five global
players will be left serving the end-to-
end needs of the largest multinational
companies, asset managers and hedge
funds, with the ability to generate at least
$15 billion or ideally closer to $20 billion
in annual revenues to cover the cost of
an expensive and complex global oper-
ating model. The natural candidates at
present are U.S.-based banks, given
their stronger starting positions and more
attractive home market.
This select group of global banks will
make a virtue of strong balance sheets,
scale and operational efficiency. They will
dominate in markets where less efficient
rivals can no longer operate profitably
(Exhibit 11, page 24). Outperformance
on the back of balance-sheet size has
already become evident in fixed income
and equities, where the top three players
have gained market share in revenues
at the expense of the next tier. Balance
sheet/RWA commitment drives revenues,
which provide scale; operating leverage
and a cost advantage that can help gen-
erate superior returns in excess of the
cost of capital. Scale also enables these
banks to invest in new technologies that
will drive additional cost advantages.
Focused global banks
Banks that can no longer compete as
full-service global players will need to
narrow their scope to areas where they
can outperform and have leading fran-
chises, based either on scale or intellec-
tual property. This business model does
not exist to date. Many banks are trying
to move to this model, but it will likely
take several years to get a sustainable
business model. Banks that have al-
ready started down this road have done
so primarily from necessity, rather than
strategic intent.
Many banks are in the midst of tran-
sition, having exited some businesses
but remaining in others where they will
“I know banks are dropping clients. I want to make sure I’m not one
of them.”Hedge fund investor
24 Capital Markets and Investment Banking 2016: Time for Tough Choices and Bold Actions
need to retrench. Their fragmented
geographic footprints are often accom-
panied by the ball and chain of stranded
costs and legacy capital exposures. This
in-between stage—with a smorgasbord
of different-sized divisions—is value-de-
stroying and often an unprofitable place
for a bank to be.
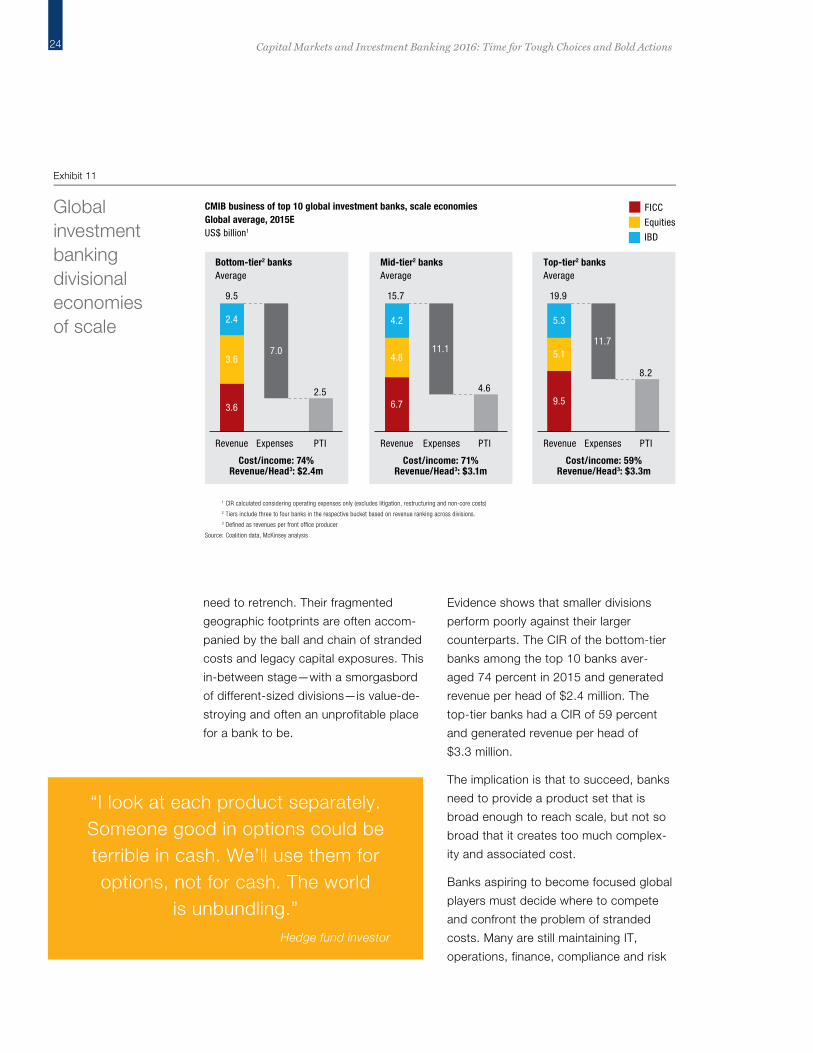
Evidence shows that smaller divisions
perform poorly against their larger
counterparts. The CIR of the bottom-tier
banks among the top 10 banks aver-
aged 74 percent in 2015 and generated
revenue per head of $2.4 million. The
top-tier banks had a CIR of 59 percent
and generated revenue per head of
$3.3 million.
The implication is that to succeed, banks
need to provide a product set that is
broad enough to reach scale, but not so
broad that it creates too much complex-
ity and associated cost.
Banks aspiring to become focused global
players must decide where to compete
and confront the problem of stranded
costs. Many are still maintaining IT,
operations, finance, compliance and risk
Bottom-tier2 banksAverage
Mid-tier2 banksAverage
Top-tier2 banksAverage
Revenue
2.5
Expenses
7.0
9.5
3.6
3.6
2.4
PTI
4.6
11.1
PTI
15.7
6.7
4.8
4.2
ExpensesRevenue
8.2
PTI
11.7
Expenses
19.9
9.5
5.1
5.3
Revenue
Cost/income: 74%Revenue/Head3: $2.4m
Cost/income: 71%Revenue/Head3: $3.1m
Cost/income: 59%Revenue/Head3: $3.3m
IBD
FICC
Equities
CMIB business of top 10 global investment banks, scale economiesGlobal average, 2015EUS$ billion1
Global investment banking divisional economies of scale
Exhibit 11
1 CIR calculated considering operating expenses only (excludes litigation, restructuring and non-core costs)
2 Tiers include three to four banks in the respective bucket based on revenue ranking across divisions.
3 De�ned as revenues per front of�ce producer
Source: Coalition data, McKinsey analysis
“I look at each product separately. Someone good in options could be terrible in cash. We’ll use them for options, not for cash. The world
is unbundling.”Hedge fund investor
25Capital Markets and Investment Banking 2016: Time for Tough Choices and Bold Actions
functions that were built to support busi-
nesses they have exited.
To be effective, focused global banks will
need to identify niches where their scale
and competitive advantage can be prof-
itably leveraged. The biggest challenge is
to develop a compelling client value prop-
osition. The good news is that industry
leaders realize the strategic necessity for
second-tier banks to focus and are will-
ing to trade with smaller players in areas
where they are competitive. In fact, many
would even encourage these second-
tier banks to allocate their scarce capital
and other resources to their strengths,
becoming a source of liquidity in those
areas. These banks must also be rigorous
in shutting down sub-optimal legacy busi-
nesses, and current depressed valuations
(e.g., in FICC) should encourage banks to
find better owners for some of their legacy
positions and assets.
Restructuring may be a short- to medium-
term drag on reported earnings for global
focused banks, but the opportunity for
shareholder value creation is significant,
and the change in focus may uncover
new opportunities. For example, banks
may form alliances to widen distribution or
partner to source liquidity and scale from
leading players or new entrants in mar-
ket-making in select products.
National or regional commercial banks with a CMIB product factory
A number of regional and national banks
have a sustainable CMIB business model
based on serving local clients, including
retail and private franchises, corporations,
pension funds, insurers and asset man-
agers. Their business is often centered on
a solid lending franchise, with sufficient
provision for solutions in fixed income and
FX, focused on local currency and natural
trade flows.
The biggest challenge for these banks is
growth, as they often have limited growth
potential in their home markets, with an
increasing cost of doing business. But ex-
perience shows that regional growth can
be tough. It is crucial for these banks to
be extremely focused on areas of strength
and avoid “me-too” strategies. Otherwise,
they risk expanding beyond their core
competency and creating fixed costs for
years to come, without a sustainable fran-
chise with a clear client value proposition.
McKinsey sees four—not mutually exclu-
sive—potential growth paths for national
or regional commercial banks:
■ Bring domestic products to the
world and follow clients abroad. Na-
tional and regional banks have a natural
growth opportunity in selling their home
market products to international invest-
ors and setting up small sales teams in
large financial centers. They can also
track the geographic expansion of do-
mestic market clients. The most suc-
cessful will build on client insights and
focus on sales efficiency.
“Banks need to review their strategy – they don’t need to be good at
everything. Where do they want to play? Win the battles, not the war; otherwise,
there’s nowhere to go but down.”Asset manager

26 Capital Markets and Investment Banking 2016: Time for Tough Choices and Bold Actions
Bold Actions: Attaining Sus-tainable Profit-■ Build specific sector expertise.
On this path, banks focus on devel-
oping superior client franchises and
sector capabilities.
■ Build a specific product or con-
tent expertise. Focus on becoming a
world-class operator in niche areas that
reflect specific skill sets.
■ Identify a second home market,
potentially through acquisition.
Making inroads in a new home market
can be a quick win, but challenging,
particularly in a large financial center.
Non-bank competitors starting out in specific areas and then expanding into related businesses
Non-bank competitors are gaining mar-
ket share in a range of product areas,
from leveraged loans, where private
equity firms have become more active,
to boutique investment banking ser-
vices. Non-bank market makers are
increasingly active in equities and, more
recently, in Treasuries, FX and interest
rate swaps market-making. In recent
years, these firms have been able to
attract top talent from established play-
ers, as they have built targeted business
models using state-of-the-art technology
unencumbered by legacy systems. Often
these players also benefit initially from
lighter regulatory and capital burdens
(e.g., being excluded from GSIB sur-
charges, SLR constraints, or other
time and resource intensive regulatory
processes like resolution planning and
CCAR or other stress tests outside the
U.S.). Some of these benefits are likely to
diminish over time, as the firms grow and
need to upgrade their support processes
and functions. Their overall governance
will also become more complex as they
build their franchises and staffing levels.
A major question is whether these firms
will be able to find other areas for prof-
itable growth, as they venture outside
their core areas of expertise. There is
clear client demand for additional pro-
viders, but often they face operational
and regulatory challenges; for instance,
when they try to enter into areas with-
out central clearing where they need
to onboard clients with all the related
complexities such as establishing ISDA/
CSA agreements, or where longstanding
credit relationships are key (e.g., attract-
ive FX business with commercial and
corporate clients).
“They [new entrant market makers] created a new paradigm around
pricing in interest rates swaps – we really value that. I would trade any product under the sun with them, if
they help me build out basic algorithmic trading capabilities.”
Asset manager
27Capital Markets and Investment Banking 2016: Time for Tough Choices and Bold Actions
Bold Actions: Attaining Sus-tainable Profit-Bold Actions: Attaining
Sustainable Profitability Nearly 10 years after the financial crisis, CMIB banks
understand the strategic necessity of adapting to a
more expensive, highly regulated and low interest rate
environment. But progress has been slow, and the longer
the situation persists, the less willing capital markets are
likely to be to fund CMIB businesses.
A multi-pronged approach is required across costs,
risk-weighted assets and margins to forge a path to
sustainable ROE above 12 percent (Exhibit 12, page 28).
McKinsey has identified eight key initiatives that bank
leaders need to undertake in order to transition to a
successful operating model, regardless of which of the
four business models they pursue.

28 Capital Markets and Investment Banking 2016: Time for Tough Choices and Bold Actions
■ Defining the long-term business
portfolio; for many players this
means canceling the call option on
revenue growth.
■ Optimizing the balance sheet, lever-
aging integrated tools to address mul-
tiple constraints simultaneously.
■ Developing a clear client value propos-
ition and allocating scarce resources to
clients that are willing to pay for them.
■ Implementing a new cost framework,
fully leveraging digital technology
across the organization.
■ Participating in industry utilities, includ-
ing distributed ledgers (blockchains).
■ Leveraging machine learning, advanced
analytics and robotics.
■ Upgrading management skills and win-
ning the war for talent.
■ Addressing conduct risk, risk culture
and incentives.
Defining the long-term business portfolio; for many, canceling the call option on revenue growth
Too many banks continue to wait for
salvation from revenue growth based on
traditional CMIB business models. After
seven years of underperformance, the
time for waiting is over.
Banks should abandon hope of a cyclical
upturn and focus on structural change.
In doing so, they must unravel the prod-
uct linkages that in some cases have
served as an excuse for maintaining un-
profitable businesses.
An added benefit is that by unbundling
products, they will also be responding
to customer needs, which increasingly
indicate a preference for price advantage
and “cherry picking” services.
3
2
2
2
12
3
7
Repricing3
Post mitigation3
Portfolio restructuring/business exists3
Baseline 2015E
Cost reduction
RWA reduction3
Post regulation (2019)
Illustrative mix of actions
No mitigating efforts
20% cost reduction (~US$ 2.5 billion on average for top 10 bank)
20% RWA reduction (~US$ 60 billion reduction on average for top 10 bank)
15% asset reduction and 25% RWA reduction (~US$ 150 billion reduction on average for top 10 bank)
9% margin increase ex-client attrition (~US$ 1 billion increase on average for top 10 bank)
Post-tax1 return on Tier 1 equity for the CMIB divisions2 of top 10 CMIB banksPercent
Multi-pronged approach to increasing ROE required, with more cost reduction
Exhibit 12
1 Assumes tax rate of 30%
2 Includes both core and non-core (bad banks) CMIB divisions of top 10 banks
3 Impact modelled assumes sequence of mitigation actions
Source: McKinsey analysis

29Capital Markets and Investment Banking 2016: Time for Tough Choices and Bold Actions
A key objective is to generate sufficient
scale in bundles of related solutions. For
example, a strong equities franchise sup-
ports cash, prime brokerage and equity
capital markets.
Optimizing the balance sheet: Leveraging integrated tools to address multiple constraints simultaneously
In response to numerous regulatory
mandates, banks in the U.S. and Europe
have developed robust risk management
and stress-testing capabilities, investing
hundreds of millions of dollars in compli-
ance, oversight and reporting.
As a result, banks are capable of iden-
tifying discrete risks in individual busi-
nesses and can increasingly calibrate
those risks to numerous factors and
scenarios. Advances in modeling have
created efficiencies, and better data mar-
shaling has helped create a more accur-
ate picture across business lines.
The next step is for banks to con-
vert those capabilities into actionable
strategic assets.
Tools currently used for capital manage-
ment, risk and pricing should be re-
purposed for business forecasting; for
example, using CCAR pre-provision net
revenue (PPNR) models to estimate prof-
its in likely business scenarios (versus the
current focus on extremely severe, ad-
verse stress scenarios) and enabling in-
telligent long-term cost/benefit decisions.
Banks must speed up the strategic opti-
mization of their balance sheets to reflect
the new regulatory playing field and
pending rules, such as FRTB.
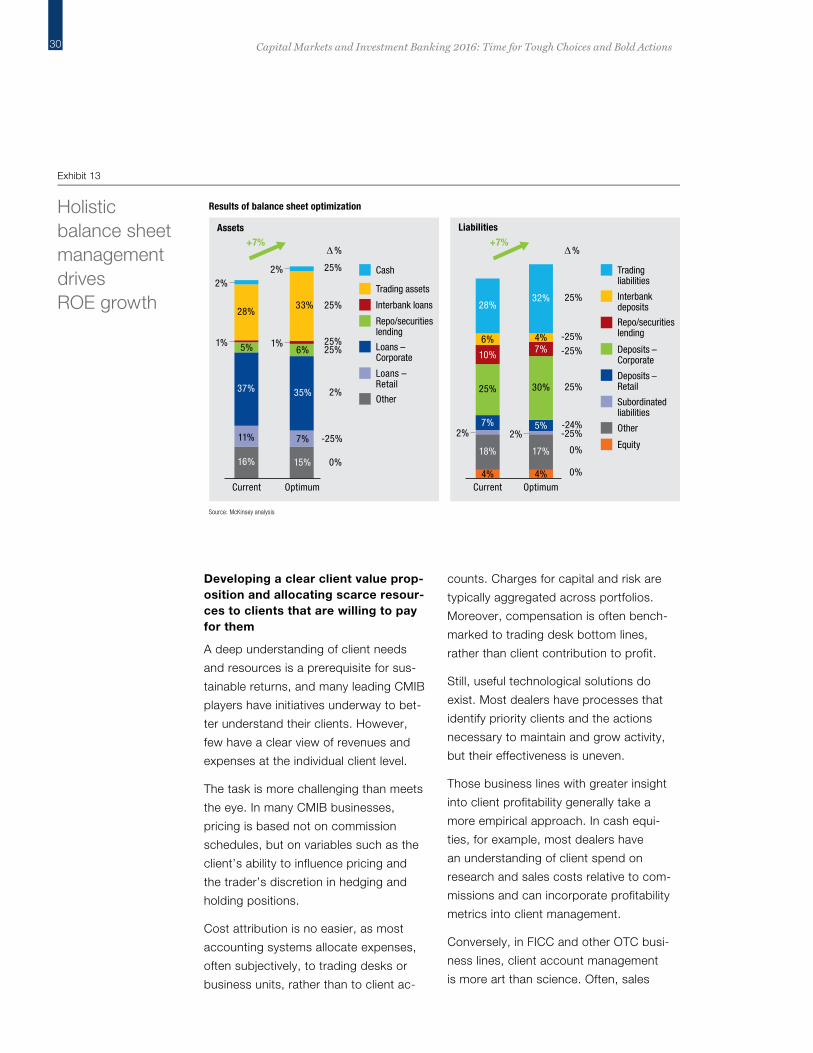
The goal is to integrate capital, liquidity
and revenue frameworks to optimize
leverage and RWA ratios with limited rev-
enue impact (Exhibit 13, page 30). To do
so, banks need to upgrade their overall
balance sheet management and related
tools. It is nearly impossible to keep
track of all constraints simultaneously.
Actions taken in one area of the busi-
ness, such as deposits, cannot be as-
sessed without linking them to actions in
another (e.g., what assets will be funded
with those deposits). Such combinations
of actions need to be assessed along a
number of dimensions. Without a model
of the balance sheet that captures these
connections and constraints, banks are
either flying semi-blind or running ad-hoc
analyses. Having robust balance sheet
management tools is a must for planning
and scenario analysis in today’s world.
Such tools also enable business lead-
ers to see how the balance sheet could
evolve under various scenarios—for in-
stance, different regulatory and business
environments—which is a critical capab-
ility given multiple constraints and other
pending actions, such as FRTB, and
inclusion of GSIB surcharges in CCAR.
Several banks have increased ROE by
1 to 2 percent, using integrated tools.
“Look, I actually want banks to make some money trading with me. I’ve
actually had conversations with them around how we can be more helpful. This isn’t altruism. I need them to be
there to do my job.”Hedge fund investor
30 Capital Markets and Investment Banking 2016: Time for Tough Choices and Bold Actions
Developing a clear client value prop-osition and allocating scarce resour-ces to clients that are willing to pay for them
A deep understanding of client needs
and resources is a prerequisite for sus-
tainable returns, and many leading CMIB
players have initiatives underway to bet-
ter understand their clients. However,
few have a clear view of revenues and
expenses at the individual client level.
The task is more challenging than meets
the eye. In many CMIB businesses,
pricing is based not on commission
schedules, but on variables such as the
client’s ability to influence pricing and
the trader’s discretion in hedging and
holding positions.
Cost attribution is no easier, as most
accounting systems allocate expenses,
often subjectively, to trading desks or
business units, rather than to client ac-
counts. Charges for capital and risk are
typically aggregated across portfolios.
Moreover, compensation is often bench-
marked to trading desk bottom lines,
rather than client contribution to profit.
Still, useful technological solutions do
exist. Most dealers have processes that
identify priority clients and the actions
necessary to maintain and grow activity,
but their effectiveness is uneven.
Those business lines with greater insight
into client profitability generally take a
more empirical approach. In cash equi-
ties, for example, most dealers have
an understanding of client spend on
research and sales costs relative to com-
missions and can incorporate profitability
metrics into client management.
Conversely, in FICC and other OTC busi-
ness lines, client account management
is more art than science. Often, sales
Liabilities Assets
5%
11%
37%
28%
35%
6%
7%
33%
15%
OptimumCurrent
16%4%
5%
25%
Current Optimum
4%
30%
4%
18%
2%
+7%
7%
17%
32%
7%
10%
28%
6%
Tradingliabilities
Other
Deposits – Retail
Deposits – Corporate
Interbankdeposits
Repo/securitieslending
Subordinatedliabilities
Equity
Cash
Other
Loans –Corporate
Repo/securitieslending
Trading assets
Interbank loans
Loans –Retail
25%
25%
25%25%
-25%
2%
25%
-25%
25%
-25%-24%
0%
%%
-25%
0%0%
+7%
1% 1%
2%2%
2%
Results of balance sheet optimizationHolistic balance sheet management drives ROE growth
Exhibit 13
Source: McKinsey analysis

31Capital Markets and Investment Banking 2016: Time for Tough Choices and Bold Actions
and trading are at odds, and resources
are apportioned to clients based on esti-
mated revenues, leading to mismatches
in revenue and service.
When properly designed and imple-
mented, client profitability frameworks
can reveal misallocations and deliver
useful insights. Businesses can also un-
lock significant value by changing their
approach to booking profits, shifting
the focus from products to clients. By
applying data analytics to resource allo-
cation, it should be possible to add 10 to
30 percent to the bottom line.
Implementing a new cost framework, fully leveraging digital technology across the organization
Despite years of cost-cutting and signifi-
cant headcount reductions in the front
office, high costs remain stubbornly in
place in the CMIB industry.
Other industries have adapted better
than CMIB to changing market con-
ditions (Exhibit 14). The automotive
industry faced profitability challenges
as a result of the late 1990s downturn,
embarked on a 20-year transformation,
and achieved sustainable 20 percent
cost reductions. The telecommunica-
tions industry in the late 1990s and
“I track everything. For every sub-product, I’ve ranked the performance
of every bank I trade with on the dimensions that I care about. And
I’m not afraid to let them know where they stand. It’s become a very
rigorous process.”Hedge fund investor
Industry/challenge Actions Impact
Telecommunications /1997 end of monopoly
••••
40% cost30% FTE costs50% throughput time
Semiconductor /2001 collapse
••••
40% cost15% FTE costs
Automotive /late 1990s downturn
••••
Network cooperationReduced product portfolioConsolidation Full cost transparency
Postponed upgradesOptimized equipmentIntroduced target pricingSwitched to reverse auctions
Cost cuts for suppliersIntegrated supply chain planningLean manufacturing Modular toolkit strategy
20% cost15% FTE costs30% throughput time
How other industries have successfully restructured
Exhibit 14
Source: McKinsey analysis

32 Capital Markets and Investment Banking 2016: Time for Tough Choices and Bold Actions
the semiconductor industry in the early
2000s achieved cost reductions of about
40 percent.
In CMIB, most players continue to pur-
sue a variety of tactical cost opportun-
ities, and many are now in their second
or third round of cost cuts. However, a
more fundamental review is required,
with the aim of cutting overall costs by at
least 20 percent ($2.5 billion for the aver-
age top 10 bank). These fundamental
cost-cutting initiatives should be focused
on 10 areas:
1. Take out entire verticals—product lines
and/or geographies—to eliminate fixed
costs. Rigorous vertical, as opposed
to horizontal, full business exits, with
a “back-to-front” focus versus the
current “front-to-back” approach, are
required. A back-to-front approach
starts with the main IT platforms to
understand which ones are shared
across business lines. Business lines to
be closed can be grouped accordingly.
Or the product set can be simplified
based on the targeted IT platform
architecture, that is, if a product does
not fit, it is eliminated.
2. Work on allocated costs—simultan-
eously managing supply and demand.
This entails focusing on three elements:
(1) Transparency: front-office manage-
ment usually has a clear line of sight
into only one third to one half of what
they pay to the functions; they need a
clearer understanding of which teams
within the functions actually work for
them, which services they provide,
and at what unit cost; (2) Demand:
the front office needs to provide their
functional partners with a clear for-
ward-looking view of what they will
need; (3) Supply: the functions need
to provide clarity on the implications
of front-office choices before they are
implemented. One example would be
control functions (e.g., compliance,
risk), which house overlapping, limited
value-added activities. Primary empha-
sis needs to be on an effective first line
of defense that owns and manages the
risk and is focused on the 60 to 70 key
process breakpoints.
3. Tackle front-office costs, for example
by revisiting relationship management
and high-touch sales for some cus-
tomer segments or products.
4. Implement next generation end-to-
end streamlining and automation.
(Exhibit 15).
5. Continue digitization of client journeys
front-to-back at scale. Many banks do
not understand which front-office or
client behaviors drive complexity and
costs in the middle and back offices.
Use front-to-back cost maps with key
metrics as a first step.
6. Reduce IT spend. Adopt new ways
of working and leverage public
cloud infrastructure.
7. Leverage big data analytics, machine
learning and robotics to drive oper-
ational improvement. Drive significant
savings by disrupting data manage-
ment, reconciliation, settlement and
corporate action event processing,
leading to 50 percent savings in
some processes.
8. Use platform utilities and next-gener-
ation outsourcing contracts to elimin-
ate redundant platforms, harmonize
functions and reduce some categories
of operations spend by 70 percent to
80 percent.

33Capital Markets and Investment Banking 2016: Time for Tough Choices and Bold Actions
9. Employ agile/distributed work-
space options for staff, leveraging
lower-cost locations.
10. Review the scope and monetization of
specific data assets (e.g., transaction
or client data).
These proposed actions are not easy to
execute, and experience shows that just
30 percent of transformations succeed in
delivering full potential. However, banks
can increase the chances of success
if they:
■ Set high performance aspirations that
challenge the organization based on
full potential, not a consensus target.
■ See improvement levers and decisions
as an “and,” and do not accept “or.”
■ Address “will” and “skill” issues fast
across all levels, and set examples that
are not business as usual.
■ Align the enablers (e.g., metrics,
incentives, evaluation) with new per-
formance goals.
■ Develop and communicate a compel-
ling change story.
From... ...To
175 handoffs, 20+ teams 10 steps, 2-3 teams
One size �ts all coverage Low-touch sales for e-only clients
100s of EUDAS, >15% admin time <5% admin time through �exible tool
High re-work rates, 260x cost for exceptions
Zero exception tolerance, �rst-time right capture
Siloed, cross-asset At-scale, integrated utility
Siloed, highly manual exception management
Cross-bank automated utility
High-touch, costly service teams for basic activities
App-based, electronic self-servicing
>T+3 RWA calculations Near-real time RWA calculations
>10K manual adjustments Real-time P&L
Dozens of reporting tools; manual recs
Single, integrated F2B reporting
Manual reporting, collateral calculations
Single, integrated reporting and calculation engine x-asset
Sample-based monitoring and controls
Alert-based controls with intelligent routing
Control/
Compliance
Trade Risk
Management
Settelements/
Recs
Cols/Vals
Reporting
P&L
Servicing
Clearing
Trade Capture
Operations
Risk, Reporting& Compliance
ClientOnboarding
Sales
Trading
Potential bene�ts of end-to-end automation
Exhibit 15
Source: McKinsey analysis

34 Capital Markets and Investment Banking 2016: Time for Tough Choices and Bold Actions
■ Create a clear process and organiz-
ational structure to identify, capture
and track impact; focus relentlessly
on financial outcomes, as opposed to
best practice.
■ Invest in a deep bench of talent with
the right capabilities, including tech-
nical skills.
■ Invest early in the business model to
address the next challenge, not just the
historic one.
Taken together these actions are a road-
map to sustainable cost reduction, and
most CMIB businesses, including those
with strong ROEs, are likely to benefit.
The key, as the examples of other indus-
tries that have successfully restructured
their cost basis indicate, is to move be-
yond the tactical to a fundamental over-
haul of cost structure.
Participating in industry utilities, in-cluding distributed ledgers
While it is widely recognized that oper-
ational partnerships and alliances can
drive economies of scale, until recently
CMIB banks have been reluctant to join
utilities, due to concerns about sharing
intellectual property. This mindset is
changing as industry executives realize
they cannot afford to continue replicating
systems and processes.
The post-trade space, where settlement
and reporting processes generate sig-
nificant IT and labor costs, is an area of
particular focus today. KYC and client
onboarding are also ripe for the efficien-
cies that utilities can deliver.
McKinsey calculates that utilities could
provide a potential cost reduction of
more than 70 percent, measured in cost-
per-trade. Frictional costs, integration
and utility margins would reduce this
to 30 to 40 percent, but banks would
also benefit by avoiding the regulatory
and other upgrades they would need to
undertake on their own.
Distributed ledgers,4 or blockchains,
have garnered considerable attention
and interest because of their potential
value in post-trade areas and are likely to
have an impact in execution, settlement,
clearing and regulatory oversight. In the
coming years, blockchain technology
could deliver a broad range of bene-
fits—including faster clearing and settle-
ment, ledger consolidation, consolidated
audit trail, reduction in systemic risk
and operational improvements—to firms
across the capital markets industry, from
clearing houses and exchanges to prime
brokers and banks.
Some of the most promising use cases
for blockchain are in areas such as OTC
derivatives and repo (particularly if com-
bined with central clearing). In each case,
McKinsey expects long-term benefits
in the billions of dollars, although these
benefits may take five years to material-
ize. In OTC derivatives, blockchain could
create $4 billion to $7 billion in value
through lower counterparty risk and oper-
ational costs. Streamlined operations,
instant settlement and better visibility
could reduce counterparty risk capital
costs from $4 billion to $2 billion; better
collateral management could save $500
million to $1 billion; and streamlined client
onboarding, trade processing and settle-
ment in the back and middle office could
deliver $1 billion to $2 billion in savings.
Challenges remain in the use of block-
chain technology in the industry. Dis-
tributed ledgers based on blockchain
currently process relatively low volumes,
4 Distributed ledgers are cryptographic records comprising encrypted logs of transactions shared across a digital network. The best-known application is Bitcoin, which uses peer-to-peer systems to make and record payments without the need for a trusted intermediary.

35Capital Markets and Investment Banking 2016: Time for Tough Choices and Bold Actions
recourse mechanisms are lacking, and
many assets simply do not exist in the
necessary digital format.
McKinsey expects these challenges will be
overcome, but the development of appli-
cations that can function at scale will still
require patience and investment, and the
costs of integrating and decommissioning
existing infrastructure are unknown.
The biggest caveat is that the benefits of
blockchain will only be realized through
cooperation among market participants,
regulators and technologists, and this
may take time (Exhibit 16). However, the
industry is already deriving significant
value from the use of blockchain technol-
ogy in areas like digital cash, KYC/AML
and identity.
Leveraging advanced analytics, ma-chine learning and robotics
Banks hold large volumes of data, but
sometimes this data is like an oil deposit
that is too far underground to be reached
with current drilling methods. Today,
however, tools are emerging to enable
banks to access this rich resource. As
advanced analytics and machine learning
evolve, banks will have the opportunity
to create significant value from data and
serve their customers better.
In the front office, data mining, machine
learning and artificial intelligence can be
used to improve decision making and the
quality and efficiency of insight generation.
Algorithms already send buying signals,
match buyers and sellers, manage liquidity
and analyze documents and transcripts.
Proof-of-concept
Operational – not at scale
Operational – at scale
Authenticity veri�cation
Register of ownership
Cross-borderpayments
ID veri�cation
Register ofownership
Trade settlements Trade �nance (BoL)
Trade settlements
Trade �nance (LoC)
Cross-border payments
2017 2018 2019 2020 2021
Future of blockchain
Collaboration milestones
Life-cycle of use cases
Hype
Regulation of blockchain
Fundamentally new, very high
potential
1st blockchain utility company
Settlement use case in operation with payments association, central bank and major FIs collaboration
Launch of distributed ledger solution at-scale in collaboration with industry players and regulator
Several consortia of banks up and running
“Do no harm” approach
Regulatory involvement in setting the new industry standardsRegulator becoming one of DLT nodes
No regulation
First proofs of concept are successful, time to build consensus
to scale up
Blockchain starts impacting �nancial services
Blockchain becoming a standard for implementation
of some new IT solutions (e.g., settlement)
Based on the current rate of evolution, blockchain solutions could reach their full potential in the next 5 years
Exhibit 16
Source: Blockchain.info, expert interviews

36 Capital Markets and Investment Banking 2016: Time for Tough Choices and Bold Actions
In middle and back offices, advanced
analytics can drive predictive trade cap-
ture and improve reconciliation and root-
cause analysis. Machine learning and
robotics are being tested in middle-of-
fice, product control and operations
functions, in some cases improving effi-
ciency by up to 30 percent.
Advanced analytics and machine learning
can be used to flag financial and oper-
ational risks. For example, banks are
investing heavily in trade surveillance, ana-
lyzing emails and texts and linking them
to trades (linking phone calls to trades is
the next step). The technology for these
processes is cost-efficient. The big chal-
lenges now are finding people with deep
understanding of the businesses and the
required data and modelling capabilities
and keeping abreast of evolving regulatory
requirements in different jurisdictions.
For banks, the value potential in ad-
vanced analytics, machine learning and
robotics is clear. For many, the question
now is where to apply these concepts to
get the biggest bang for the buck. Banks
have run proof-of-concept projects in
specific asset classes and steps of the
value chain, but now they need a clear
understanding of where the value is and
how to sequence and prioritize their ef-
forts. Internal development is not always
the best path, and outsourcing or utilities
should be considered. Where competi-
tive advantage is paramount, investment
in internal teams or start-ups could be
justified. Innovation labs are increasingly
the norm among larger players, and
those that succeed are able to scale their
efforts and capture tangible benefits.
Upgrading management skills and winning the war for talent
The CMIB industry has entered a trans-
formational period with regard to talent.
The “best and the brightest” are less
likely to choose a career in banking
today, a number of experienced senior
executives are finding the industry less
appealing and leaving, and there is a
deficit of talent in the data, technology,
risk and regulatory areas.
Banks face several recruiting challenges,
including:
■ An insufficient supply of skilled em-
ployees (e.g., data scientists, tech-
nology, trading, risk and compliance
professionals).
■ The lack of an institutional approach
to professional development and
talent retention.
■ The need for more robust human
resources capabilities (e.g., systems
and data management) and clearer
roles and responsibilities relative to
business leaders.
Ironically, as banks have become less
attractive places to work, they are com-
peting for digital talent with FinTech start-
ups and innovative technology firms.
McKinsey estimates there will be a short-
age of 190,000 data scientists in the U.S.
by 2018, so competition will be intense.
In 2014, 34 percent of MBA graduates
went into financial services, compared
with 41 percent in 2011. Meanwhile 16
percent went into technology in 2014,
compared with 10 percent in 2011.
Banks must act fast to meet increased
competition for the best talent. They need
to change their value proposition for talent
beyond financial rewards to the oppor-
tunity to have a positive impact on the
economy and society. In addition, they
should use data and analytics to drive
more effective decision making, identifying

37Capital Markets and Investment Banking 2016: Time for Tough Choices and Bold Actions
issues before they arise (e.g., the front of-
fice people most at risk of leaving). Setting
up innovation labs and other new ventures
can attract a new breed of talent, espe-
cially in the digital arena.
CMIB players also need to step up
their game on diversity. The industry
is still male-dominated, and banks are
missing out on a significant portion of the
talent pool.
Addressing conduct risk, risk culture and incentives
Conduct risk and risk culture are a prior-
ity for banks and regulators, given recent
litigation and fines. However, conduct
risk is not well understood, and banks
continue to grapple with implementing
global oversight and monitoring.
Conduct risk broadly encompasses
behaviors, attitudes, motivations, strat-
egies, business models, organizations,
operations, controls or actions that lead
to or allow poor outcomes for custom-
ers, markets or the broader public.
The UK has taken the lead, through its
Firm Systematic Framework, in codifying
standards for conduct risk, and in 2016,
the framework will be expanded to in-
clude individuals as well as firms.
Banks are also addressing conduct risk,
with those in the U.S. and Europe prob-
ably most advanced in defining a second
line framework.
From these efforts, six insights
have emerged:
1. Definition of conduct risk is a moving
target: from rogue trading to mis-selling
and tax evasion, the concept covers
many areas.
2. There is a lack of transparency and
metrics: risk assessment tends
to be backward-looking and rela-
tively generalized.
3. Conduct risk is a rolling train: conduct
risk is a new concept, but some practi-
ces are already in place (e.g., in relation
to travel and trade monitoring).
4. Interfaces are complex: firms find that
relationships with compliance, legal
and strategy are complicated.
5. Culture matters: culture is key but re-
mains neglected.
6. There are too few resources: conduct
typically receives less than a third of
risk and compliance resources.
One challenge for banks is to build a
conduct risk framework that can be ap-
plied across the firm, and while some
have set out key parameters (definition of
conduct risk, taxonomy, policy), few have
achieved full implementation.
Technology and benchmarking tools
can help significantly, but the key
challenge for management is to
identify where to start and the most
beneficial interventions.
“Most banks have more than 100 people covering our portfolio managers, traders and analysts.
I am pretty sure we could manage, if the banks would have only half as
many people.”Real money investor

38 Capital Markets and Investment Banking 2016: Time for Tough Choices and Bold Actions
Six potential immediate actions for banks
to consider include:
1. Introduce mandatory conduct orien-
tation for lateral hires and training for
upper tenure employees as a prerequi-
site for promotion.
2. Establish working groups to monitor
high-level conduct topics.
3. Launch divisionally led conduct com-
mittees to strengthen first line of de-
fense and informal dialogue.
4. In trading, set in stone escalation pro-
cedures for complex trades.
5. Optimize front-office management ap-
proval for more consistency.
6. Increase the impact of risk culture
initiatives and emphasize a new ap-
proach to conduct risk.
■■■
There is no one-size-fits-all prescription
for restoring the health of the global CMIB
industry. While some CMIB banks have
succeeded in adapting to the post-crisis
environment, many are struggling, with
the top 10 global banks facing the biggest
challenges. They carry the most significant
legacy burdens and face the most disrup-
tion from new rules and competitors.
As executives juggle the cost, earn-
ings and capital components of ROE,
tough choices must be made. Costs
should be a particular area of focus,
and technology should play a lead-
ing role in managing, analyzing and
implementing efficiencies.
Efforts to date are steps in the right
direction, but more must be done as
banks identify where they sit in the
competitive landscape and which busi-
ness model is most likely to lead to
attractive profitability.
While the eight key initiatives that bank
leaders need to undertake in order to
transition to a successful operating model
are all relevant for each of the four emer-
ging business models, the prioritization,
resource allocation and intensity of man-
agerial focus across the eight initiatives
varies. McKinsey has identified three
priority initiatives for each of the four busi-
ness models where banking leaders must
achieve best-in-class performance to at-
tain sustainable profitability (Exhibit 17):
■ Global full-service players at scale
across products and services should
focus on: 1) optimizing their balance
sheet, leveraging integrated tools to
drive incremental ROE while managing
the complexity of multiple simultan-
eous constraints across a full suite of
global products; 2) implementing a new
cost framework; and 3) transforming
conduct, culture and incentives to
prudently manage a highly complex
global business.
■ Focused global players with scale
in select product bundles should
focus on: 1) restructuring portfolios
to efficiently identify and exit subscale
business lines and product areas; 2)
developing a clear client value propos-
ition linked to the focused strategy and
relentlessly managing scarce resource
allocation to profitable clients; and 3)
implementing a new cost framework
to drive efficiencies and ensure ration-
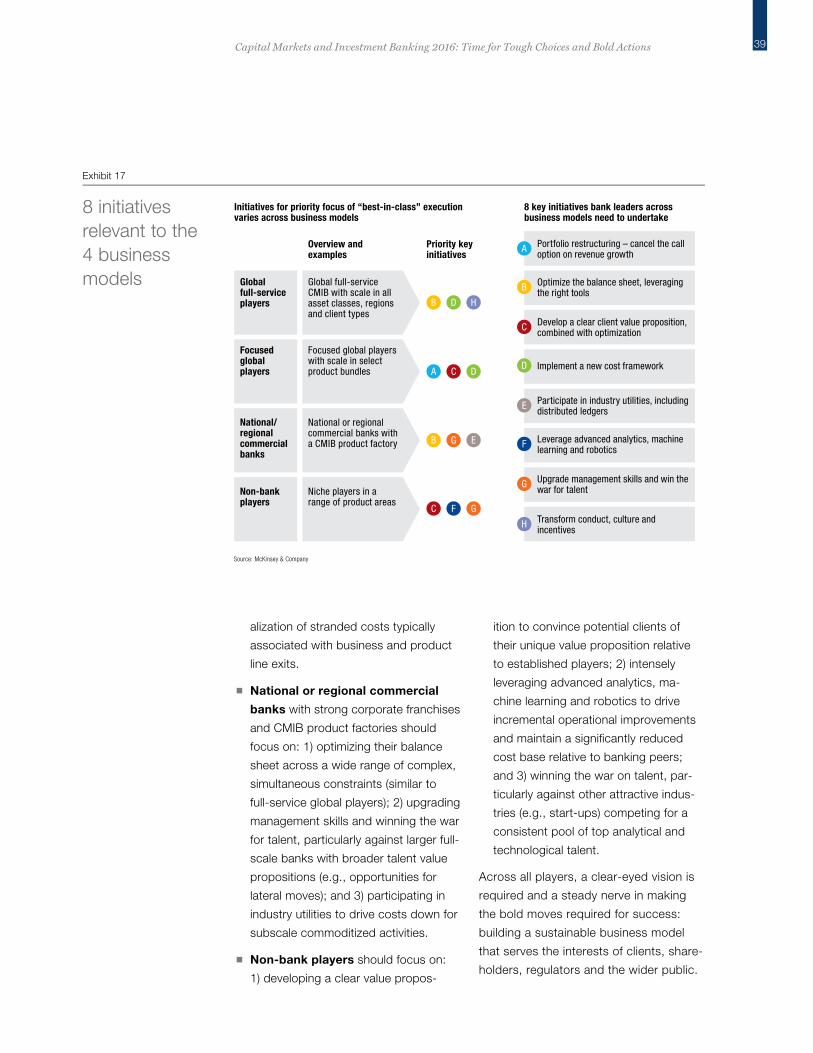
39Capital Markets and Investment Banking 2016: Time for Tough Choices and Bold Actions
alization of stranded costs typically
associated with business and product
line exits.
■ National or regional commercial
banks with strong corporate franchises
and CMIB product factories should
focus on: 1) optimizing their balance
sheet across a wide range of complex,
simultaneous constraints (similar to
full-service global players); 2) upgrading
management skills and winning the war
for talent, particularly against larger full-
scale banks with broader talent value
propositions (e.g., opportunities for
lateral moves); and 3) participating in
industry utilities to drive costs down for
subscale commoditized activities.
■ Non-bank players should focus on:
1) developing a clear value propos-
ition to convince potential clients of
their unique value proposition relative
to established players; 2) intensely
leveraging advanced analytics, ma-
chine learning and robotics to drive
incremental operational improvements
and maintain a significantly reduced
cost base relative to banking peers;
and 3) winning the war on talent, par-
ticularly against other attractive indus-
tries (e.g., start-ups) competing for a
consistent pool of top analytical and
technological talent.
Across all players, a clear-eyed vision is
required and a steady nerve in making
the bold moves required for success:
building a sustainable business model
that serves the interests of clients, share-
holders, regulators and the wider public.
Initiatives for priority focus of “best-in-class” execution varies across business models
8 key initiatives bank leaders across business models need to undertake
National/ regional commercial banks
Global full-service players
Global full-service CMIB with scale in all asset classes, regions and client types
Focused global players
Overview and examples
Priority key initiatives
Non-bank players
National or regional commercial banks with a CMIB product factory
Focused global players with scale in select product bundles
Niche players in a range of product areas
Portfolio restructuring – cancel the call option on revenue growth
A
Optimize the balance sheet, leveraging the right tools
B
B D H
A C D
B G E
C F G
Develop a clear client value proposition, combined with optimization
C
Implement a new cost frameworkD
Participate in industry utilities, including distributed ledgers
E
Leverage advanced analytics, machine learning and robotics
F
Upgrade management skills and win the war for talent
G
Transform conduct, culture and incentives
H
8 initiatives relevant to the 4 business models
Exhibit 17
Source: McKinsey & Company

40
The following exhibits provide a graphic overview of the current trends in capital markets and investment banking and of the challenges facing CMIB institutions around the world. The data are derived from analysis of the financial and regulatory reporting of 212 banks, including the 13 largest CMIB institutions.
Capital Markets and Investment Banking Global Data
Global CMIB revenues1
US$ billion
Growth2014-2015
2%
-2%
-2%
12%
102
119
40
261
2005
53
124
150
326
2006
73
94
114
282
2012
72
81
99
252
2011
80
136
162
377
2009
62
90
99
251
2008
69
134
159
362
2007
EMEA
Americas
APAC
93
82
107
282
2015
83
84
109
276
2014
82
84
107
273
2013
76
95
123
294
2010
Americas and EMEA share of global revenue pools declined 85% to 67% since 2005
1 Pre-writedown; Regional split according to execution location
Source: McKinsey CMIB revenue pools
Global CMIB revenues1
US$ billion
Growth2014-2015
2%
-1%
0%
10%75
120
67
261
2005
98
84
2006
145
326
63
159
59
282
2012
62
132
59
2011
252
80
227
70
377
2009
70
119
62
2008
251
107
160
95
2007
362
FICC2
+9.6% p.a.
IBD
-9.3% p.a.
Equities 75
140
67
282
2015
68
67
2014
276
141
68
144
61
273
2013
67
63
164
294
2010
0.3% p.a.
The global CMIB industry has stabilized with around $280 billion in annual revenues
1 Pre-writedown
2 Fixed Income, Currencies and Commodities
Source: McKinsey CMIB revenue pools

41
2014
149
2013
154
2012
160
2015
144
2015
138
127
20142013
120
2012
121
Top 10 Regionals/locals YoY growth2014/2015
YoY growth2014/2015
18% -18%
-14% 1%
13%
6%
-32%
30%
1%
-19%
10%
2%
4%
16%
-8% 58%
-7%
23%
10%
-5%
M&A
Credit
Equity derivatives& Convertibles
Cash equities
ECM (includingconvertibles)
DCM
Prime Services
FX
Rates
Commodities
-3% p.a. +4% p.a.
CMIB revenue analysis by products for top 101 global investment banks CMIB revenues have declined for the top 10 banks since 2012; reverse is true for non-top 10
1 Top 10 includes: Bank of America/Merrill Lynch, Barclays, BNP Paribas, Citicorp, Credit Suisse, Deutsche Bank, Goldman Sachs, JP Morgan, Morgan Stanley, UBS
Source: McKinsey CMIB revenue pools; Coalition data
IBD FICC Equities
+1% p.a.
DCM ECM M&A
40
45
42
140
6
2015
51
43
39
7
2014
141
32
48
43
10
132
2011
56
55
43
10
164
2010
55
57
39
8
159
2012
46
41
51
144
7
2013
21
22
23
67
2014
24
21
22
67
2015
22
18
18
59
2011
20
20
24
63
2010
20
23
16
59
2012
18
22
21
61
2013
-3% p.a.
Commodities
FX CreditRates
2014
8
30
31
68
2015
9
32
34
75
2013
8
31
30
68
2012
7
28
27
63
2010
8
28
31
67
2011
7
26
29
62
+3% p.a.
Cash equities EQD
Prime Services
Global CMIB revenues by productsUS$ billion
Decline in FICC revenues offset by increases in IBD and equities revenues since 2010
Source: McKinsey CMIB revenue pools
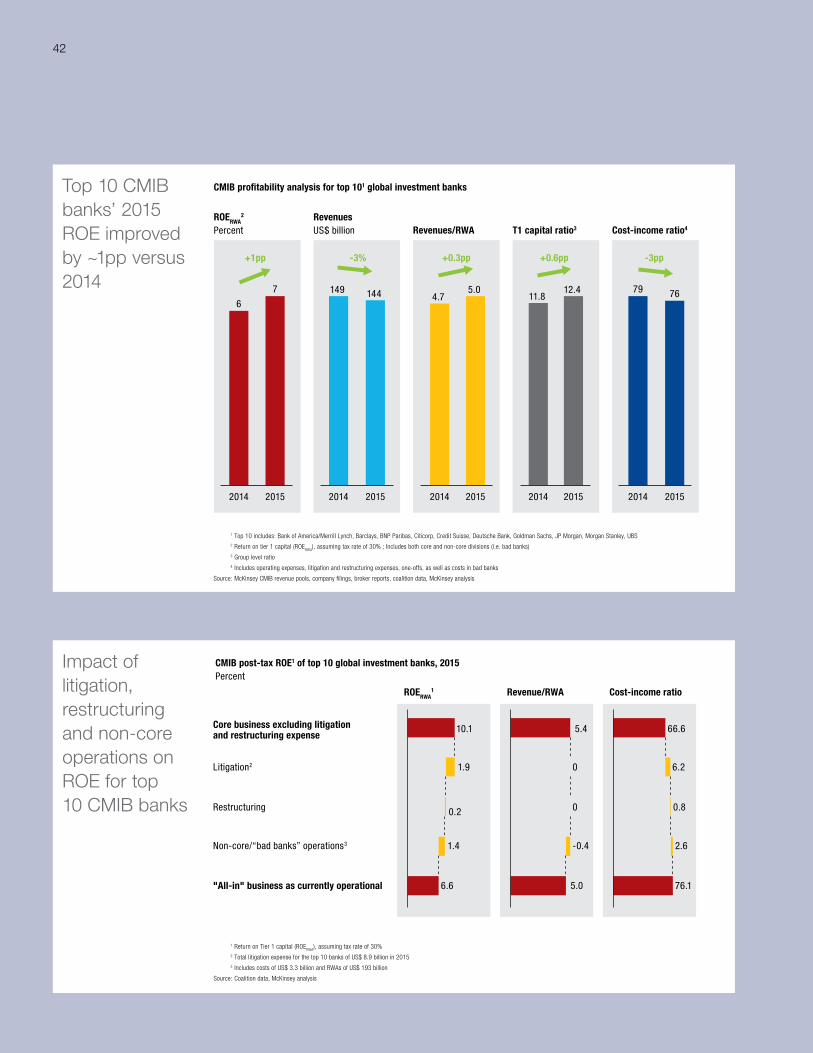
42
ROERWA2
Percent
6
2014
+1pp
7
2015
RevenuesUS$ billion
-3%
2015
144
2014
149
Revenues/RWA
4.7
2014
+0.3pp
2015
5.0
T1 capital ratio3
+0.6pp
12.4
20152014
11.8
Cost-income ratio4
-3pp
79
2014
76
2015
CMIB pro�tability analysis for top 101 global investment banks Top 10 CMIB banks’ 2015 ROE improved by ~1pp versus 2014
1 Top 10 includes: Bank of America/Merrill Lynch, Barclays, BNP Paribas, Citicorp, Credit Suisse, Deutsche Bank, Goldman Sachs, JP Morgan, Morgan Stanley, UBS
2 Return on tier 1 capital (ROERWA
), assuming tax rate of 30% ; Includes both core and non-core divisions (i.e. bad banks)
3 Group level ratio
4 Includes operating expenses, litigation and restructuring expenses, one-offs, as well as costs in bad banks
Source: McKinsey CMIB revenue pools, company �lings, broker reports, coalition data, McKinsey analysis
6.6
10.1
0.2
1.4
1.9
0
0
5.4
5.0
-0.4
0.8
66.6
2.6
76.1
6.2
CMIB post-tax ROE1 of top 10 global investment banks, 2015Percent
Core business excluding litigation and restructuring expense
Litigation2
Restructuring
Non-core/“bad banks” operations3
"All-in" business as currently operational
ROERWA1 Revenue/RWA Cost-income ratio
Impact of litigation, restructuring and non-core operations on ROE for top 10 CMIB banks
1 Return on Tier 1 capital (ROERWA
), assuming tax rate of 30%
2 Total litigation expense for the top 10 banks of US$ 8.9 billion in 2015
3 Includes costs of US$ 3.3 billion and RWAs of US$ 193 billion
Source: Coalition data, McKinsey analysis

43
8.2
8.1
8.2
3.2
8.2
6.6
7.5
7.4
8.6
4.0
7.7
6.5
CMIB post-tax ROE1 of top 10 global investment banks, 2015Percent
U.S. banks
European banks
Total top 10
“All-in” (Core + non-core)
Core division2
“All-in” (Core + non-core)
Core division2
“All-in” (Core + non-core)
Core division2
ROERWA1 ROELE
1
Leverage is the binding constraint, especially in Europe.
1 ROE is calculated post-tax and is based on Coalition’s normalized revenues, costs and equity; RWA is calculated under Basel III; Leverage exposure (LE) is calculated under BCBS, 270; ROE calculations assume a leverage capital ratio of 3 to 5%, Tier 1 capital ratio as per group reported number for 2015, tax-rate of 30%
2 Core division costs include litigation expenses but exclude restructuring and non-core expenses
Source: Coalition data, McKinsey analysis
Product
10128
30
128
25 5
1516
2015
4211
1210
830
128
25 5
16
2014
42
11
15
1110
829
128
25 5
16
2013
46
19
11
1210
28 6
138
25 4
1713
20
2012
50
1111
29 7
138
25 4
1613
19
2011
48
1111
297
148
264
1613
21
2010
50
IBD
Equities
FICC
343633292931
444142343636
66727997
79104
CMIB costs for top 10 global investment banksUS$ billion
Front of�ce compensation costs
Front of�ce direct expenses
Allocated and overhead expenses Revenues
-414
2
-60
-3-3
CAGR’2010-2015Percent
-1
-2231
4
-9
Banks have had particular dif culty cutting FICC costs to compensate for declining revenues
1 Data includes top 10 players - Bank of America/Merrill Lynch, Barclays, BNP Paribas, Citicorp, Credit Suisse, Deutsche Bank, Goldman Sachs, JP Morgan, Morgan Stanley, UBS
Source: Coalition data, McKinsey analysis

Contact
For more information about this report, please contact:
Daniele ChiarellaSenior Partner, [email protected]
Matthieu LemerleSenior Partner, [email protected]
Jared MoonPartner, [email protected]
Roger RudisuliPartner, New [email protected]
Ben MargolisAssociate Partner, New York [email protected]
The authors would like to acknowledge the contributions of the following colleagues to this report: Kevin Buehler, Jeff Penney, Prachi Sharma, Anke Raufuss, Luisa Quetti, Yuri Mushkin, Soumya Gupta, Akshay Agarwal, Paul Feldman, Allison Kellogg and David Wigan.


Global Corporate & Investment Banking Practice September 2016Copyright © McKinsey & Company www.McKinsey.com/clientservice/financial_services