Embed Size (px)
Citation preview

8/8/2019 Capital Manageemnt - Alok
http://slidepdf.com/reader/full/capital-manageemnt-alok 1/83
LOVELY PROFESSIONAL UNIVERSITYDEPARTMENT OF MANAGEMENT
Report on Summer Training
Study of Working Capital Management
of
Gaya Dairy
Submitted to Lovely Professional University
In partial fulfillment of the
Requirements for the award of Degree of
Master of Business Administration
Submitted by: Alok Kumar
Roll No.- RS1901B33
Reg. No.- 10905931
DEPARTMENT OF MANAGEMENT
LOVELY PROFESSIONAL UNIVERSITY
PHAGWARA

8/8/2019 Capital Manageemnt - Alok
http://slidepdf.com/reader/full/capital-manageemnt-alok 2/83
CERTIFICATE
This is to certify that the project work entitled “A Study of Working
Capital Management of Gaya Dairy.”Is a piece of bonafide work done
by Alok Kumar, student of Lovely School Of Management, under my
guidance and supervision for the partial fulfillment of the course MBA,
LSM,Jalandhar.
To the best of my knowledge and belief the thesis embodies the work of
the candidate himself and has been duly completed.
Simultaneously, the thesis fulfills the requirements of the rules and
regulations related to the summer internship of the institute and I am
assured that the project is up- to the standard both in respect to the
contents and language for being referred to the examiner.

8/8/2019 Capital Manageemnt - Alok
http://slidepdf.com/reader/full/capital-manageemnt-alok 3/83
DECLARATION
I hereby declare that the project report entitled “A Study of Working
Capital Management of Gaya Dairy.” Is the produce of my sincere
effort. This Summer Internship Project Report is being submitted by me
alone, at LSM,Jalandhar, for the partial fulfillment of the course MBA,
and the report has not been submitted to any other Educational
institutions or for any other purpose whatsoever.

8/8/2019 Capital Manageemnt - Alok
http://slidepdf.com/reader/full/capital-manageemnt-alok 4/83
ACKNOWLEDGEMENT
No research can blossom from single person’s mind without proper
guidance, assistance and inspiration from various quarters. My project
was given its present shape by assistance of many people whom I am
greatly indebted to. I express my gratitude and indebtedness toward the
people who helped me during my project work.
This project report is a result of endless effort & immense degree of oil by
many great minds. It was pleasure to work in one of the most valuable
F.M.C.G Company like GAYA DAIRY PROJECT (GAYA).
I express my humble gratitude towards Mr. K.K SHARMA Chief executive
of GAYA DAIRY PROJECT Gaya who treated me as a guide depot for
giving me a chance to pursue my summer training in a prestigious
company.
I express my special thanks to Mr. Shatish Chandra Shukla, General
Manager (Marketing), Magadh diary project Gaya Bihar. Who always gives
me the guidelines time to time during my summer training and they help
me for the completion of my project.

8/8/2019 Capital Manageemnt - Alok
http://slidepdf.com/reader/full/capital-manageemnt-alok 5/83
I am also thankful to Mr. Anoop Mohanty (Faculty Guide) for providing me
proper inputs and guidance.
I would like to dedicate this work to my college Lovely school of
management,Jalandhar, where I am getting the shape of future Finance
Manager.
Last but not least, I express my gratitude to my parents who financed this
project and have been a moral support to me during this project.
Alok Kumar
Reg. No. 10905931
Lovely School of Mgmt,
Jalandhar,Punjab.
PREFACE

8/8/2019 Capital Manageemnt - Alok
http://slidepdf.com/reader/full/capital-manageemnt-alok 6/83
The underlying aim of the summer training in Gaya Dairy is a sincere
attempt to analyze its Working Management by making use of different
financial appraisal techniques. The data for the studies were obtained
from the published annual reports of the company.
Among all the problems of financial management, the problems of
working capital management have probably been recognized as the
most crucial one. It is because of the fact that working capital always
helps a business concern to gain vitality and life strength. The objective
of this study is to critically evaluate working capital management as
practiced in Gaya Dairy.
In this study, a sincere attempt has been made to analyze the
working of Gaya Dairy ltd. by making use of different financial appraisal
techniques like ratio analysis, trend analysis, common-size analysis etc.
The data for the studies were obtained form the published annual reports
of the company.
An effort has been made to appraise the overall financial
performance and efficiency of management, but the scope and depth of

8/8/2019 Capital Manageemnt - Alok
http://slidepdf.com/reader/full/capital-manageemnt-alok 7/83
study remained limited due to the limiting factors of time, and resources.
However, it is expected that the study will provide useful information for
better and easier understanding of the financial results of the company.

8/8/2019 Capital Manageemnt - Alok
http://slidepdf.com/reader/full/capital-manageemnt-alok 8/83
TABLE OF CONTENTS
1. INTRODUCTION
1.1 Overview- Gaya Dairy...................................
1.2 Brief History.....................................................
1.3 Objectives.........................................................
1.4 Organization Structure ....................................
2. OBJECTIVE OF THE PROJECT
2.1 Objective of the study
2.2 Review of literature
3. RESEARCH METHODOLOGY
3.1 Research Methodology..................................
3.2Type of Research............................................
3.3 Sample of design ...........................................
4. SIGNIFICANCE OF THE WORKING CAPITAL
4.1 Introduction of Working Capital................
4.2 Concept of Working Capital.......................
4.3 Importance of Working Capital analysis ..
4.4 Operating and cash conversion cycle.........
4.5 Methods and ratios ....................................

8/8/2019 Capital Manageemnt - Alok
http://slidepdf.com/reader/full/capital-manageemnt-alok 9/83
5. ANALYSIS OF WORKING CAPITAL
5.1 Working capital analysis.........................
5.2 Working capital trend analysis...............
5.2 Ratio analysis..........................................
6. CONCLUSION AND RECOMMENDATIONS
6.1 Profitability……………………………
6.2 Working Capital……………………….
REFERENCES
GLOSSARY

8/8/2019 Capital Manageemnt - Alok
http://slidepdf.com/reader/full/capital-manageemnt-alok 10/83
ABSTRACT
The summer internship program is under taken after the completion of the
Second semester of the program and faculty supervised.
The summer internship program will equip the students with practical
application skills relevant to various situations.
The summer internship program is an attempt to bridge the gap between
the professional world and the academic institutions. It is a simulation of
the real work environment and enables students to experience the rigors
of a professional organization.
I have completed my 6th week project in Gaya Dairy. I got different type
of knowledge in Gaya Dairy. And met different type of workers in Gaya
Dairy they gave me lot of knowledge day to day about financial system of
Gaya Dairy reported in Gaya Dairy day to day when I did not go to Gaya
Dairy such condition I reported to my faculty guide he has information
about my day to day performance in Gaya Dairy. Now I am mentioning
report which I learned there till now.
I started my project in Gaya Dairy on 18th June Friday and met Mr.
R.N.Mittal who is a Dy. Manager .He gave me a project title “A Study Of
Working Capital Management” and he gave me annual report. Logistic of

8/8/2019 Capital Manageemnt - Alok
http://slidepdf.com/reader/full/capital-manageemnt-alok 11/83
procuring milk from various rural areas. And I learned about various types
of milk collection centers. And they collect the milk from different societies
in Gaya distt. in base of (1) Taking Sample (2) Testing Fat and (3) SNF
(Solid Note Fat) and they told me that Society members and Gaya Dairy
follow this system. They take two types of milk, Cow and Buffalo. Also got
an opportunity to learn the Tally system and its advantages in accounting
system.
Friday 18th June 2010, Mr. Kailash Khangarot the corporate guide
briefed about some systems of milk collection in Gaya Dairy :-
(1) Reception dock
(2) Lock Sheet
(3)Online programmed
(4) Variety of milk
(5) Plunger of milk
(6) EMT System
There are one Chilling center under Gaya Dairy. Standard SNF is
8.7% . The Gaya Dairy milk rates will be very important.
Internal Audit is an important part of this system. Mr. R.D.Jat
(Designation Cashier ).briefed about the transaction e.g. telephone,
mobiles, medical claim bills, of the employees and staffs. It is not

8/8/2019 Capital Manageemnt - Alok
http://slidepdf.com/reader/full/capital-manageemnt-alok 12/83
more than 20,000 and about deposits, about employee’s salary. How
it is made.
CHAPTER – I
INTRODUCTION

8/8/2019 Capital Manageemnt - Alok
http://slidepdf.com/reader/full/capital-manageemnt-alok 13/83
INTRODUCTION
Getting Acquainted With The Dairy Industry In India
Indian Dairy Scenario:-
Lot of Indian people start day with tea & milk. Milk is an essential factor of
our daily life. Indian milk business is very old business. Dairy business
adopt modern concept in 1970 with the help of national dairy develop
board through operation flood plan. in first section of this plane, ten state
selected.
8/8/2019 Capital Manageemnt - Alok
http://slidepdf.com/reader/full/capital-manageemnt-alok 14/83
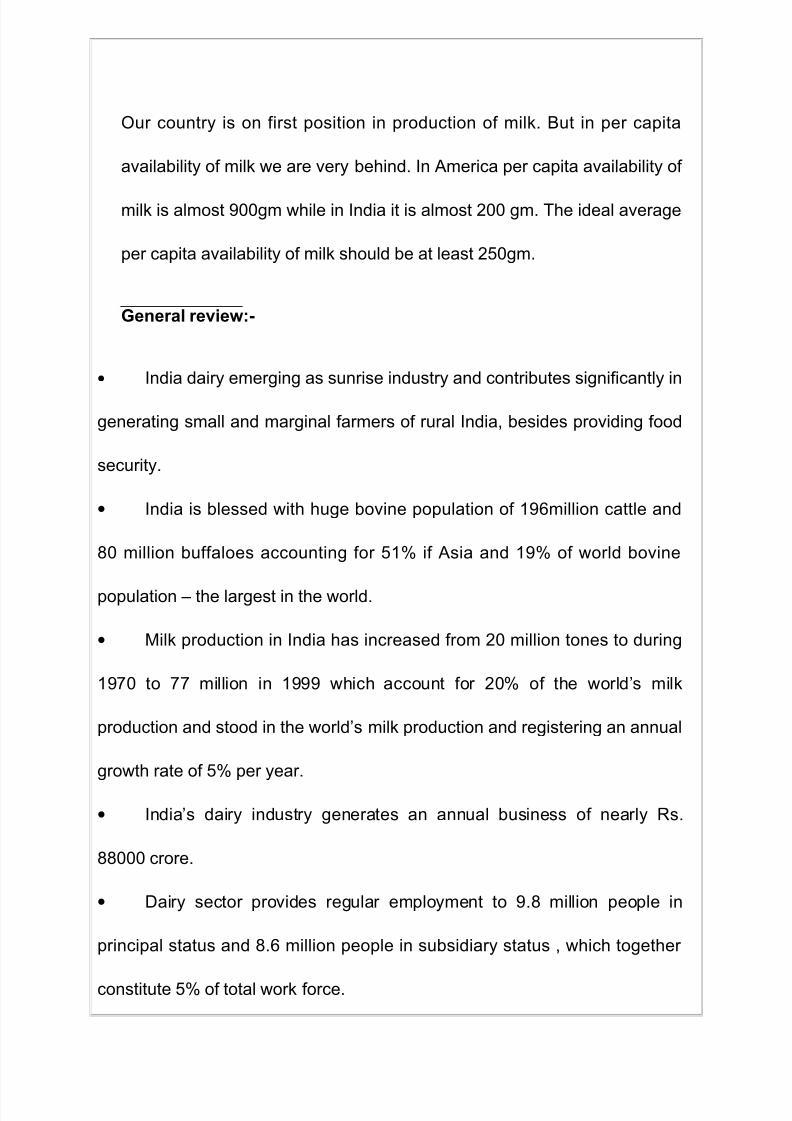
Our country is on first position in production of milk. But in per capita
availability of milk we are very behind. In America per capita availability of
milk is almost 900gm while in India it is almost 200 gm. The ideal average
per capita availability of milk should be at least 250gm.
General review:-
• India dairy emerging as sunrise industry and contributes significantly in
generating small and marginal farmers of rural India, besides providing food
security.
• India is blessed with huge bovine population of 196million cattle and
80 million buffaloes accounting for 51% if Asia and 19% of world bovine
population – the largest in the world.
• Milk production in India has increased from 20 million tones to during
1970 to 77 million in 1999 which account for 20% of the world’s milk
production and stood in the world’s milk production and registering an annual
growth rate of 5% per year.
• India’s dairy industry generates an annual business of nearly Rs.
88000 crore.
• Dairy sector provides regular employment to 9.8 million people in
principal status and 8.6 million people in subsidiary status , which together
constitute 5% of total work force.

8/8/2019 Capital Manageemnt - Alok
http://slidepdf.com/reader/full/capital-manageemnt-alok 15/83
• Dairy development owes much to the an and pattern of cooperative.
• The dairy infrastructure now comprises 26 states federation, 170
district milk unions and around 100000 village cooperative societies, through
which rural milk production and procurement system have been effectively
linked to urban markets consumption centers.
• Of every 100 litres of milk produced, 44 liters were retained by the
rural fold and 56 liters were the marketable surplus for the urban area. Of
which only 10 liters was handled by the organized sector cooperative and
remaining by traditional sector.
• Operation flood brought milk revolution in the country by transforming
dairying into a core economic activity. The main challenges before the
Indian dairy sector to improving quality, developing international
accepted products and stepping up global marketing strategy.
• The future of Indian dairy industry is promising, since its de-licensing in
1992,the interest of multinationals and Indian corporate in the industry
has been growing, and the industry’s growth potential is high as there is
sufficient domestic demand and good scope for exports of milk and milk
products.
• India is emerging as one of the largest and fastest growing consumers
market in the world with high income elasticity of demand of dairy

8/8/2019 Capital Manageemnt - Alok
http://slidepdf.com/reader/full/capital-manageemnt-alok 16/83
product. Indian dairying is energy –efficient, labor intensive and
ecological sound.
• Over 80% of milk sold in urban & semi urban areas is non –pasteurized
from unorganized sector. The overall market for liquid milk is growing
4% per anum.
Similarly in Bihar there is a co-operative federation, known as the Bihar
co-operative dairy federation (BCDF) which provides the milk to whole
Rajasthan with the help of the dairy unions, established in the different
parts of the state.
INTRODUCTION ABOUT COMFED
Dairy development was initiated by the state government in the early
seventies under the auspices of Bihar State Co-Operative Milk Producers
Federation Ltd. (COMFED) registered in 1975. two year later COMFED
assumed responsibility for many of the function of BSDDC. It became the
nodal agency for implementation of operation flood in the state.
Bihar State Co-Operative Milk Producers Federation Ltd. (COMFED) set
up in 1977 as the implementing agency for dairy development programs

8/8/2019 Capital Manageemnt - Alok
http://slidepdf.com/reader/full/capital-manageemnt-alok 17/83
in Bihar is registered as a society under the Rajasthan cooperative
societies 1965.

8/8/2019 Capital Manageemnt - Alok
http://slidepdf.com/reader/full/capital-manageemnt-alok 18/83
HISTORY OF MAGADH DAIRY PROJECT GAYA DAIRY (GAYA)
Sudha: The origin
The mighty Ganges at its origin is but a tiny stream in the Gadgetry ranges
of the Himalayas. Similar is the story of Sudha which inspired 'Operation
Flood' and heralded the 'White Revolution' in India. Father of white
revolution is Dr. vargis kurian (1973) It began with two village co-
operatives and 250 liters of milk per day, nothing but a trickle compared to
the flood it has become today. Today Sudha collects processes and
distributes over a million liters of milk and milk products per day, during the
peak, on behalf of more than a thousand village cooperatives owned by
half a million farmer members. Further, as Ganga-ma carries the
aspirations of generations for Moksha, Sudha became the symbol of the
aspirations of millions of farmers. Creating a pattern of liberation and self-
reliance for every farmer to follow.
The start of a revolution:
The revolution started as awareness among the farmers that grew and
matured into a protest movement and the determination to liberate
themselves. Over four decades ago, the life of a farmer in Kaira District
was very much like that of his counterpart anywhere else in India. Its
8/8/2019 Capital Manageemnt - Alok
http://slidepdf.com/reader/full/capital-manageemnt-alok 19/83
income was derived almost entirely from seasonal crops. The income from
milk buffaloes was undependable.
The marketing and distribution system for the milk was controlled by
private traders and middlemen. As milk is perishable, farmers were
compelled to sell it for whatever they were offered. Often, they had to sell
cream and ghee at throwaway prices. In this situation, the one who gained
was the private trader. Gradually, the realization dawned on the farmers
that the exploitation by the trader could be checked only if marketed their
milk themselves. In order to do that they needed to form some sort of an
organization. This realization is what led to the establishment of the Bihar
state Cooperative Milk Producers' federation Limited (popularly known as
Sudha) which was formally registered on December 14, 1946.
The Kaira Union began pasteurizing milk for the Bombay Milk Scheme in
June 1948. An assured market proved a great incentive to the milk
producers of the district. By the end of 1948, more than 400 farmers joined
in more village societies, and the quantity of milk handled by one Union
increased from 250 to 5,000 liters a day.

8/8/2019 Capital Manageemnt - Alok
http://slidepdf.com/reader/full/capital-manageemnt-alok 20/83
OBJECTIVES OF ORGANIZATION
The primary concern of Sudha Dairy is to provide best quality and safe
products and services. To achieve this quality objective of Sudha Dairy ltd.are
designed to.
• Meet a well defined needs use and purpose of customer.
• Satisfy customer’s satisfaction for good and safe milk and milk products.
• Comply with applicable national and international slandered.
• Make available milk and milk product at competitive price.
• Ensuring implementation of ISO9002 quality management system.
• Application and adherence of HACCP principles for food safety.
• Motivates employees for professional excellence and participation.
QUALITY POLICY
The dairy believes the delighted customer is the only key for overall
development of the organization and their families.
This is achieved by:
• Education milk producers for clean production.

8/8/2019 Capital Manageemnt - Alok
http://slidepdf.com/reader/full/capital-manageemnt-alok 21/83
• Manufacturing and supplying milk and milk products and services of
consistent quality at comparative price.
• Adopting innovative and modern technologies and system.
• Developing committed work force.
• Adoption of safety and environment friendly standards with help of
application of HACCP Principles.
ORGANIZATION STRUCTURE
Sudha Dairy is a registered under Bihar cooperative act and is owned by
thousands of its milk producers members. It works on world famous Amul
pattern. As all other cooperative dairies, Sudha Dairy is a part of three tier
structure i.e. dairy cooperative society at village level which form district level
milk producer union which are further federated in state level federation. All
three entities are autonomous and linked to each other by provisions of their
byelaws.

8/8/2019 Capital Manageemnt - Alok
http://slidepdf.com/reader/full/capital-manageemnt-alok 22/83
The dairy co-operative movement operates on three tier system wherein
farmer members own dairy co-operative societies (DCS) which own district
milk producer's union. The unions collectively own the COMFED.
It is a vertically integrated structure that establishes a direct linkage between
those who produce the milk and
those who consume it.
Federation - Provides service &
support to unions. Marketing
within & outside state, Liaison
with government and NGO
agencies, mobilization of
resources & coordinating & planning programmers / projects.
Union - Develops village milk cooperative network, procures milk from DCS,
processes & markets. Sale of cattle feed and related inputs, promotion of
cross breeding through AI and NS, promotion of fodder development and
general support & supervision to DCS.
DCS - Provides input services (AH, AI) to its members and procurement of
milk.

8/8/2019 Capital Manageemnt - Alok
http://slidepdf.com/reader/full/capital-manageemnt-alok 23/83
The dairy co-operatives depict the following institutional
FORMULATION OF DCCS AND INTERRELATION WITH SUDHA
DAIRY
FORMULATION OF DCCS AND INTERRELATION WITH SUDHA DAIRY
Milk producers of villages
Management committee of COMFED
(9 members, out of which two from weaker section and one for
woman)
Chairman of COMFED
Board of directors of Sudha Dairy
(total 14 member, including 9 elected members amongst chairmen of
DCSS, out of which 6 from general category, two form weaker section
(bpl, sc/ st etc.) And one from women chairpersons. Rest are
nominated)

8/8/2019 Capital Manageemnt - Alok
http://slidepdf.com/reader/full/capital-manageemnt-alok 24/83
CHAPTER – II
OBJECTIVE
OF THE
PROJECT

8/8/2019 Capital Manageemnt - Alok
http://slidepdf.com/reader/full/capital-manageemnt-alok 25/83
2.1 OBJECTIVES OF THE STUDY
The main objective of my project is
(A) to study the working capital policy of Gaya dairy, Gaya and to analyze the
trend in working capital for last three years.
(B) to analyze different ratios so to judge the availability and effective usage of
working capital.
2.2 LITERATURE REVIEW
(A) Vishnani S., Shah B. (2007) “Impact of Working Capital Management Policies on
Corporate Performance—An Empirical Study”
It is felt that there is the need to study the role of working capital management policies on
profitability of a company. Conventionally, it has been seen that if a company desires to take
a greater risk for bigger profits and losses, it reduces the size of its working capital in relation
to its sales. If it is interested in improving its liquidity, it increases the level of its working
capital. However, this policy is likely to result in a reduction of the sales volume, therefore of
profitability. Hence, a company should strike a balance between liquidity and profitability.
8/8/2019 Capital Manageemnt - Alok
http://slidepdf.com/reader/full/capital-manageemnt-alok 26/83
(B) Md. Sayaduzzaman (2007)
Working Capital Management: A Study on British American
Tobacco Bangladesh Company Ltd.
The efficiency of working capital management of British American Tobacco Bangladesh
Company Ltd. is highly satisfactory due to the positive cash inflows, planned approach in
managing the major elements of working capital. Applications of multi-dimensional models
of current assets mix may have positive impact on the continuous growth & development of
this multinational enterprise. This depends on co-operation of the stakeholders and business
environment in the context of globalization.
(C) Samiloglu F. and Demirgunes K. (2008)
The Effect of Working Capital Management on Firm Profitability:
Evidence from Turkey
The aim of this study is to analyze the effect of working capital management on firm
profitability. In accordance with this aim, to consider statistically significant relationships
between firm profitability and the components of cash conversion cycle at length, a sample
consisting of Istanbul Stock Exchange (ISE) listed manufacturing firms for the period of
1998-2007 has been analyzed under a multiple regression model. Empirical findings of the

8/8/2019 Capital Manageemnt - Alok
http://slidepdf.com/reader/full/capital-manageemnt-alok 27/83
study show that accounts receivables period, inventory period and leverage affect firm
profitability negatively; while growth (in sales) affects firm profitability positively.
(D) By Beneda, Nancy, Zhang, Yilei (2008)
Working Capital Management, Growth and Performance of New Public
Companies
The current study contributes to the literature by examining impact of working capital
management on the operating performance and growth of new public companies. The study
also sheds light on the relationship of working capital with debt level, firm risk, and industry.
Using a sample of initial public offerings (IPO's), the study finds a significant positive
association between higher levels of accounts receivable and operating performance. The
study further finds that maintaining control (i.e. lower amounts) over levels of cash and
securities, inventory, fixed assets, and accounts payables appears to be associated with higher
operating performance, as well.
(E) Stuttgart/Munich, June 29, 2009
Study on working capital management
Roland Berger Strategy Consultants study on working capital management: Optimizing
current assets helps tap into cash potential and build buffers against insolvency
• Our study entitled "Working capital – Cash for recovery" looks at 216 European

8/8/2019 Capital Manageemnt - Alok
http://slidepdf.com/reader/full/capital-manageemnt-alok 28/83
companies with total sales of EUR 3,700 billion and total EBIT of EUR 422 billion
• Presently, the insolvency risk is increasing as higher cash requirements coincide with
reduced cash supply and high financing costs
• Internal sources of finance are becoming more interesting: one of the main lever is
tapping into the cash potential in working capital
• The companies surveyed had a combined potential of EUR 353 billion in Q1 2009,
roughly one third more than in 2008
• Relative to tied-up working capital, utilities and engineered products companies have the
greatest cash reserves hidden in their working capital

8/8/2019 Capital Manageemnt - Alok
http://slidepdf.com/reader/full/capital-manageemnt-alok 29/83
CHAPTER – III
RESEARCH
METHODOLOGY

8/8/2019 Capital Manageemnt - Alok
http://slidepdf.com/reader/full/capital-manageemnt-alok 30/83
RESEARCH METHODOLOGY
• Research Methodology is a systematically solve the research problem. It
has many dimensions and research methods constitute a part of the
research methodology.
• Thus when we talk about research methodology, we do not only talk of the
research methods but also consider the logic behind the methods. We use
in context of our research study, so that research results are capable of
being evaluated either by researcher himself or by others.
• To effectively carry out in research, I would use the following research
process, which consists of series of actions or steps.
Research comprises of the following steps:-
1. Formulating the research Problem.
2. Research design & Sample Design.
3. Analysis of data gathered
4. Data analysis comparison
5. Graphics and interpret

8/8/2019 Capital Manageemnt - Alok
http://slidepdf.com/reader/full/capital-manageemnt-alok 31/83
1 FORMULATING THE RESEARCH PROBLEM
This is the first step under which the problem is stated in general way
and then ambiguities i.e. understanding and rephrasing the problem
thoroughly and rephrasing the same into a meaningful terms from an
analysis point of view.
The research problem under the present project was to study data of
various funds. For this research process was to be formulated and the
execution of which would result in the desired data.
2. PREPARING THE RESEARCH DESIGN
The function of research design is to provide for the collection of
relevant evidences with minimal expenditure of efforts, time and money.
Research Design
• Type of research
•Sample design

8/8/2019 Capital Manageemnt - Alok
http://slidepdf.com/reader/full/capital-manageemnt-alok 32/83
TYPE OF RESEARCH
• The type of research under present is an analytical research. In analytical
research; we use tact's or information already available, and analyze these
to make a critical evaluation of the material. Hence the same would be
done.
• In this project I had collected facts, data, and information.
SAMPLE DESIGN
A sample design is a definite plan determined before any data is actually
collected for obtaining a sample. Researcher must select a sample design,
which should be reliable and appropriate for his report.
3. OBSERVATIONAL DESIGN (COLLECTION OF DATA)
Observational design relates to the condition under which the observations are
to be made. Observational design in respect to research. There are several
ways of collecting the appropriate data, which differ considerably in context of
money, time cost and other resources at the disposal of the researcher.

8/8/2019 Capital Manageemnt - Alok
http://slidepdf.com/reader/full/capital-manageemnt-alok 33/83
Data can be obtained from two important sources:
• Primary data
• Secondary Data
Primary data
Primary data are the data that are collected afresh and for the first time. Thus
happens to be in character. Primary data are collected by the following ways:-
a) Observation
b) Interview
c) Schedule
d) Questionnaire
Secondary Data
Secondary data are the data that are already collected and are only
analyzed by different sources these sources are as follows:-
• Corporate magazine
• Manuals of various companies
• Books, journals, newspaper
• Employment exchange
The secondary data would be collected from financial statement,
journal of national repute, books of national and international author as well as
the annual report of the company. In addition to this internet access will make
the study more effective and meaningful.

8/8/2019 Capital Manageemnt - Alok
http://slidepdf.com/reader/full/capital-manageemnt-alok 34/83
CHAPTER – IV
SIGNIFICANCE
OF THE
WORKING CAPITAL

8/8/2019 Capital Manageemnt - Alok
http://slidepdf.com/reader/full/capital-manageemnt-alok 35/83
SIGNIFICANCE OF WORKIG CAPITAL
Introduction:-
The management of current assets is similar to that of fixed
assets in the sense that in both case that a firm analyses their effects on its
return and risk. The management of fixed and current assets, however, differs
in three important ways: first, in managing fixed assets, time is a very
important factor; consequently, discounting and compounding techniques play
a significant role in capital budgeting and a minor one in the management of
current assets. Second, the large holding of current assets, especially cash,
strenghthens the firm’s liquidity position (and reduces riskiness), but also
reduces the overall profitability. Thus a risk-return trade off is involved in
holding current assets. Third, levels of fixed as well as current assets depend
upon expected sales, but it is only current assets which can be adjusted with
sales fluctuations in the short run. Thus, the firm has a greater degree of
flexibility in managing currents.

8/8/2019 Capital Manageemnt - Alok
http://slidepdf.com/reader/full/capital-manageemnt-alok 36/83
CONCEPTS OF WORKING CAPITAL
Gross working capital:-
Gross working capital refers to the firm’s
investment in current assets are the assets which can be converted into
cash within an accounting year and include cash , short-term securities,
debtors,(accounts receivable or book debts) bills receivable and stock
(inventory).
Net Working Capital:-
It’s refers to the difference between current assets and current liabilities.
Current liabilities are those claims of outsiders which are expected to
mature for payments within an accounting year and include creditors
(account payable) , bills payable ,and outstanding expenses . Net Working
Capital can be positive or negative. A positive net working capital will arise
when current assets exceed current liabilities .a negative net working
capital occurs when current liabilities are in excess of current assets.
PERMANENT WORKING CAPITAL:-
We know that the need of current assets arises because of the operating
cycle. The operating cycle is a continuous process and, there for, the need
for current assets is felt constantly. But the magnitude of current assets

8/8/2019 Capital Manageemnt - Alok
http://slidepdf.com/reader/full/capital-manageemnt-alok 37/83
needed is not always the same; it increases and decreases over time.
However there is always a minimum level of current
assets which is continuously required by a firm to carry on its business
operations. Permanent or fixed, working capital is the minimum level of
current assets. it is permanent in the same way as the firm’s fixed assets
are. Depending upon the changes in production and sales, the need for
working capital, over and above permanent working capital, will fluctuate.
For example extra inventory of finished goods will have to be minted to
support the peak period of sale, and investment in debtors (receivable) may
also increase during such periods. On the other hand, investment in raw
material, work in process and finished goods will fall if the market is slack.
Amount of
working
capital (Rs)
Temporary or
Fluctuating
Time

8/8/2019 Capital Manageemnt - Alok
http://slidepdf.com/reader/full/capital-manageemnt-alok 38/83
VARIABLE OR FLUCTUATING WORKING CAPITAL:-
Variable or fluctuating working capital the extra working capital needed
to support the changing production and sales activities of the firm. Both
kinds of working capital –permanent or fluctuating (temporary)-are
necessary-to facilitate production and sales through the operating cycle.
But the firm to meet liquidity requirements that will last only temporary
working capital. In figure illustrates differences between permanent and
temporary working capital. It is shown that permanent working capital is
stable over time, while temporary working capital is fluctuating – some
times increasing and sometimes decreasing. However, the permanent
working capital need not be horizontal if the firm’s requirement for
permanent capital is increasing (or decreasing) over a period
Amount of working
capital (Rs)
Temporary or
Fluctuating
Permanent
Time

8/8/2019 Capital Manageemnt - Alok
http://slidepdf.com/reader/full/capital-manageemnt-alok 39/83
FOCUSING ON MANAGEMENT OF CURRENT ASSETS
The gross working capital concept focuses attention on two aspects of
current assets management:
1. How to optimize investment in current assets?
2. How should current assets be financed?
The consideration of the level of investment in current assets
should avoid two danger points- excessive or inadequate investment in
current assets. Investment in current assets should be just adequate to
the needs of the business firm. Excessive investment in current assets
should be avoided because it impairs the firm’s profitability, as idle
investment earns nothing. On the other hand, inadequate amount of
working capital can threaten solvency of the firms because of its inability
to meet its current obligations. It should be released that the working
capital needs of the firm may be fluctuating with changing business
activity. This may cause excess or shortage of working capital frequently.
The management should be prompt to initiate an action and correct
imbalances.
Another aspect of the gross working capital point to the
need of arranging funds to finance current assets. Whenever a need for
working capital funds arises due to the increasing level of business
activity or for any other reason. Financing arrangement should be made

8/8/2019 Capital Manageemnt - Alok
http://slidepdf.com/reader/full/capital-manageemnt-alok 40/83
quickly. Similarly, if suddenly, some surplus funds arise they should not
be allowed to remain idle, but should be invested in short- term securities.
Thus, the financial manager should have knowledge of the sources of
working capital funds as well as investment avenues where idle funds
may be temporarily invested.
FOCUSING ON LIQUIDITY MANAGEMENT
Net working capital is a qualitative concept. it indicates the liquidity
position of the firm and suggests the extent to which working capital
needs may be financed by permanent sources of funds. Current assets
should be sufficiently in excess of current liabilities to constitute a margin
or buffer for maturing obligations within the ordinary operating cycle of a
business. In order to protect their interests, short term creditors always
like a company to maintain current assets at a higher level than current
liabilities. It is a conventional rule to maintain the level of current assets
twice the level of current liabilities. However, the quality of current assets
should be considered in determining the level of current assets vis – a –
vis current liabilities. A weak liquidity position poses a threat to the
solvency of the company and makes it unsafe and unsound. A negative
working capital means a negative liquidity, and may prove to be harmful
for the company’s reputation excessive liquidity is also bad. it may be due
to mismanagement of current assets. There for, prompt and timely action

8/8/2019 Capital Manageemnt - Alok
http://slidepdf.com/reader/full/capital-manageemnt-alok 41/83
should be taken by management to improve and correct the imbalances
in the liquidity position of the firm.
Networking capital concept also covers the equation of judicious mix of long
term and short term funds for financing current assets. For every firm, there is
a minimum amount of net working capital which is permanent. Therefore, a
portion of the working capital should be financed with the permanent sources
of funds such as equity share capital, debentures, long term debt, performance
share capital or retained earnings. Management must, therefore, decide the
extent to which current assets should be financed with equity capital and/or
borrowed capital.
In summary, it may be emphasized that both gross and net concepts of
working capital are equally important for the efficient management of working
capital. There is no precise way to determine the exact amount of gross or net
working capital for any firm. The data and problems of each company should
be analyzed to determine the amount of working capital. There is no specific
rule as to how current assets should be financed. It is not feasible in practice
to finance current assets by short – term sources only. Keeping in view the
constraints of the individual company, a judicious mix of long and short term
finances should be invested in current assets. Since current assets involve
cost of funds, they should be put to productive use.

8/8/2019 Capital Manageemnt - Alok
http://slidepdf.com/reader/full/capital-manageemnt-alok 42/83
OPERATING AND CASH CONVERSION CYCLE
The need for working capital to run the day-to-day business activities cannot
be overemphasized. We will hardily find a business firm which does not
require any amount of working capital. Indeed, firms differ in their requirement
of the working capital.
We know that a firm should aim at maximizing the wealth of its shareholders.
In its Endeavour to do so, a firm should earn sufficient return from its
operations. Earning a steady amount of profit requires successful sells
activities. The firm has to invest enough funds in current assets for generating
sales. Currents assets are needed because sales do not convert into cash
instantaneously. There is always an operating cycle involved in the conversion
of sales into case.
There is a difference between current and fixed assets in terms of their
liquidity. A firm requires many years to recover the initial investment in fixed
assets such as plant and machinery or land and building. On the contrary,
investment in current assets such as inventories and debtors [account
receivable] is realized during the firm’s operating cycle that is usually less than
a year.

8/8/2019 Capital Manageemnt - Alok
http://slidepdf.com/reader/full/capital-manageemnt-alok 43/83
What is an operating cycle?
Operating cycle is the time duration required to convert sales, after the
conversion of resources into inventories, into cash. The operating cycle of a
manufacturing company involve three phases:
• Acquisition of resources such as raw material, labor, power and
fuel etc.
•
Manufacture of the product which includes conversion of raw
material into work-in-progress into finished goods.
• Sales of the products either for cash or on credit. Credit sales
create account receivable for collection.
These phases affect cash flows, which most of the time, are neither
synchronized because cash outflows usually occur before cash inflows. Cash
inflows are not certain because sales and collections which give rise to cash
inflows are difficult to forecast accurately. Cash outflows, on the other hand,
are relatively certain. The firm is, therefore, required to invest in current assets
for a smooth, uninterrupted functioning. It needs to maintain liquidity to
purchase raw materials and pay expenses such as wages and salaries, other
manufacturing, administrative and selling expenses and taxes are there is
hardly a matching between cash inflows and outflow. Cash is also held to meet
to any future exigencies. Stocks of raw material and work –in- process are
kept to ensure smooth production and to guard against non-availability of raw

8/8/2019 Capital Manageemnt - Alok
http://slidepdf.com/reader/full/capital-manageemnt-alok 44/83
materials of other components. The firms hold stock of finished goods to meet
the demand of customers on continuous basis and sudden demand from some
customers. Debtors (Accounts Receivable) are created because goods are
sold on credit for marketing and competitive reasons.
Purchase Payment Credit Sale
Collection
RMCP+WIPCP+FGCP
Inventory convention period Receivable conversion price
Gross operation cycle
Payable Net operating cycle
Operating Cycle of a manufacturing firm
Thus, a firm makes adequate investment in inventories, and debtors, for
smooth, uninterrupted production and sale.

8/8/2019 Capital Manageemnt - Alok
http://slidepdf.com/reader/full/capital-manageemnt-alok 45/83
How is the length of operating cycle determined?
The length operating cycle of a manufacturing firm is the sum of (i)
inventory conversion period (ICP) and (ii) debtors (Receivable)
conversion period (DCP). The inventory conversion period is the total
time needed for producing and selling the product. Typically, it includes:
(a) raw material conversion period (rmcp) ,(b)work-in-process conversion
period (WIPCP), and (c) finished goods conversion period (FGCP). The
debtors’ conversion period is the time required to collect the outstanding
amount from the customers. The total of inventory conversion period and
debtors conversion period is referred to as gross operating cycle (GOC).
In practice, a firm may acquire resources ( such as raw material) on
credit and temporarily postpone payment of certain expenses. Payables,
which the firm can defer, are spontaneous sources of capital to finance
investment in current assets,. The creditors (Payables) deferral period
(CDP) is the length of time the firm is able to defer payments on various
resource purchases. The difference between (gross) operating cycle and
payables deferral period is net operating cycle (NOC). if depreciation is
excluded from expenses in the computation of operating cycle, the net
operating cycle also represents the cash conversion cycle(CCC).it is net
time interval between cash collections sale of the product and cash
payments fore resources acquired by the firm. It also represents the time

8/8/2019 Capital Manageemnt - Alok
http://slidepdf.com/reader/full/capital-manageemnt-alok 46/83
interval over which additional funds, called working capital, should be
obtained in order to carry out firm’s operations. The firm has to negotiate
working capital from sources such as commercial banks. The negotiated
sources of working capital financing are called non-spontaneous
sources. If net operating cycle of a firm increases, it means further need
for negotiated working capital.
Let us illustrate the computation of the length of operating cycle.
Consider the statement of cost of sales for a firm given in below-
Statement of Cost of Sales ( Rs in lakh)
ITEMACTUAL
20X1
PROJECTE
D 20X2
1 Purchase of raw material X1 X.2 Opening raw material inventory X2 ..3 Closeing raw material inventory X3 ..4 Raw material consumed (1+2-3) X4 X.5 Direct labour X5 X.6 Depriciation X.. X.7 Other mfg. expences X… X.8 Total cost (4+5+6+7) .. X.
9 Opening work-in-processinventory X.. X.
10 Closing work-in-process inventory … X.11 Cost of production (8+9-10) .. X.12 Opening finished goods inventory .. X.13 Closing finished goods inventory .. X.14 Cost of goods sold (11+12-13) .. X.
15Selling administrtive and gen
expences .. X.
16 cost of sales (14+15) .. X.

8/8/2019 Capital Manageemnt - Alok
http://slidepdf.com/reader/full/capital-manageemnt-alok 47/83
The firm's data for sales and debtors and creditors are given
below
Sales and Debtors (Rs
in lakh)
ITEM
ACTUAL
20X1
PROJECTE
D 20X2
Sales (Credit) X YOpening balance of debtors X. Y.Closing balance of debtors .. ..opening balance of creditors .. ..closing balance of creditors X. ..

8/8/2019 Capital Manageemnt - Alok
http://slidepdf.com/reader/full/capital-manageemnt-alok 48/83
CHAPTER – V
ANALYSIS
OF
WORKING CAPITAL

8/8/2019 Capital Manageemnt - Alok
http://slidepdf.com/reader/full/capital-manageemnt-alok 49/83
Gross operating cycle (GOC)
The firm’s gross operating cycle (GOC) can be determined as inventory
conversion period (ICP) plus debtors conversion period (DCP).Thus,
GOC is given as follows:
Gross operating =
Inventory
+
Debtors
Conversion period Conversion period
GOC = ICP + DCP …….. (1)
Inventory conversion period
What determines the inventory conversion period? The inventory conversion
(ICP) is the sum of raw material conversion period (RMCP), work-in-process
conversion period (WIPCP) and finished goods conversion period (FGCP):
ICP = RMCP +WIPCP +FGCP
……(2)

8/8/2019 Capital Manageemnt - Alok
http://slidepdf.com/reader/full/capital-manageemnt-alok 50/83
Raw material conversion period (RMCP):- The raw material conversion
period (RMCP) is the average time period taken to convert material in to work-
in-process. RMCP depends on: (a) raw material consumption per day, and (b)
raw material inventory. Raw material consumption per day is given by the
number of days in the year (say, 360). The raw material conversion period is
obtained when raw material inventory is divided by raw material consumption
per day. Similar calculations can be made for other inventories, debtors and
creditors. The following formula can be used:
Raw material Raw material Inventory
Conversion =
Period [Rawmaterial
consumption]/360
RMC RMC*360
RMCP = RMI ÷ =
……(3)
360 RMC

8/8/2019 Capital Manageemnt - Alok
http://slidepdf.com/reader/full/capital-manageemnt-alok 51/83
• Work-in-process conversion period (WIPCP):- Work-in-process
conversion period (WIPCP) is the average time taken to complete the
semi-finished or work-in-process. It is given by the following formula:
Work-in-process
Work-in-process Inventory
Conversion =
Period [Cost of production]/360
COP WIPI *360
WIPCP = WIPI ÷ =
……..(4)
360 COP

8/8/2019 Capital Manageemnt - Alok
http://slidepdf.com/reader/full/capital-manageemnt-alok 52/83
• Finished goods conversion period (FGCP):-
Finished goods conversion period
(FGCP) is the average time taken to sell the finished goods. FGCP can be
calculated as follows:
Finished goods
Finished goods Inventory
Conversion =
Period [Cost of goods sold]/360
CGI FGI*360
FGCP = FGI ÷ ……..(5)
360 CGS
Debtors (receivable) conversion period (DCP)
Debtors conversion period (DCP) is the average
time taken to convert debtors into cash. DCP represent the average collection
period. It is calculated as follows:
Debtors Debtor Debtors*360
Conversion = = …
(6)
Period (DCP) Creditor sales/360 Creditor sales

8/8/2019 Capital Manageemnt - Alok
http://slidepdf.com/reader/full/capital-manageemnt-alok 53/83
Creditors (payables) deferral period (CDP)
Creditors (payables) deferral period (CDP) is the
average time taken by the firm in paying its suppliers (creditors). CDP is given
as follows:
Creditors Creditors Credit*360
Deferral = = …(7)
Period Credit purchases/360 Credit purchases
Cash Conversion or Net Operating Cycle
Net operating cycle (NOC) is the difference
between gross operating cycle and payables deferral period.
Gross Creditors
Net operating = Operating = deferral
Cycle Cycle period
NOC = GOC - CDP
…… (8)

8/8/2019 Capital Manageemnt - Alok
http://slidepdf.com/reader/full/capital-manageemnt-alok 54/83
Net operating cycle is also referred to as cash conversion cycle. Some people
argue that depreciation and profit should be excluded in the computation of
cash conversion cycle since the firm’s concern is with cash flow associated
with conversion at contrary view is that a firm has to ultimately recover total
costs should include depreciation, and even the profits. Also, in using the
above-mentioned formulae, average figures for the period may be used.
For example, Table shows detained calculations of the components of a
firm’s operating cycle. Table provides the summary of calculations.
During 20X1 the daily raw material consumption was Rs 12.1 lakh and the
company held an ending raw material inventory of Rs827 lakh. If we assume
that this is the average inventory held by the company, the raw material
consumption the projected raw material conversion period is 60 days. This has
happened because both consumption (Rs 16.5 lakh per day) and level of
inventory (Rs 986 lakh) have increased, but the consumption rate has
increased) by 36.4 percent). Thus, the raw material conversion period has
declined by 8 days. Raw materials are the result of daily raw material
consumption and total raw material consumption and total raw material
consumption and total raw material consumption during a period given the
company’s production targets. Thus, raw material inventory is controlled
through control over purchases and production. We can similarly interpret
other calculations in table below

8/8/2019 Capital Manageemnt - Alok
http://slidepdf.com/reader/full/capital-manageemnt-alok 55/83
Table:-Operating Cycle Calculation (Hypothetical Example)
( Rs. In lakh)
Item
Actual
19X1
Projected
19X2
1 Raw Materials Conversion Period
(a) Raw material consumption 4,349 5,932(b) Raw material consumption per
day 12.1 16.5
(c) raw material inventory 827 986(d) Raw material inventory holding
days
68d 60d
2 Work-in-process Conversion Period
(a)cost of production* 5,212 7,051
(b)cost of production per day 14.5 19.6
(c)work-in-process inventory 325 498(d) Work-in-process inventory
holding days
22
d 25d
3 Finished Goods Conversion Period
(a) Cost of goods sold* 5,003 6,582
(b) Cost of goods sold per day 13.9 18.3
(c) Finished goods inventory 526 995

8/8/2019 Capital Manageemnt - Alok
http://slidepdf.com/reader/full/capital-manageemnt-alok 56/83
(d)Finished goods inventory holding
days
3
8d 54d
4 Collection period
(a) Credit sales (at cost)** 6,087 8,006
(b) sales per day 16.9 22.2
(c) debtor 735 1,040
(d) debtors outstanding days
4
3d 47d
5 Creditors Deferral Period
(a) Credit purchases 4,653 6,091
(b) purchase per day 12.9 16.9
(c) creditors 454 642
(d) Creditors outstanding day
3
5d 38d*Depreciation is including.**All sales are assumed on
credit.

8/8/2019 Capital Manageemnt - Alok
http://slidepdf.com/reader/full/capital-manageemnt-alok 57/83
Table :-Summery of Operating Cycle Calculations
(Number of Days)
Actual Projected
GROSS OPERATING CYCLE
1 Inventory Conversion Period
(i ) Raw material 68 60
(ii ) Work- in- process 22 25
(iii ) Finished goods 38
12
8 54
13
9
2 Debtors Conversion Period 43 47
3 Gross operating cycle (1 + 2)
17
1
18
6
4 Payment Deferral period 35 38
NET OPERAING CYCLE (3-4)
13
6
14
8
We note a significant change in the company’s policy for 20X2 with regard
to finished goods inventory. It is expected to increase to 54 days holding from
38 days in the previous year. One reason could be a conscious policy decision
to avoid stock out situations and carry more finished goods inventory to

8/8/2019 Capital Manageemnt - Alok
http://slidepdf.com/reader/full/capital-manageemnt-alok 58/83
8/8/2019 Capital Manageemnt - Alok
http://slidepdf.com/reader/full/capital-manageemnt-alok 59/83
the firm. The process of measurement and analysis of working capital is
performed on the basis of financial statements of the business
enterprise for past few years.
In the present study the analysis of working capital of Gaya Dairy ltd.
Has been made by two techniques vis., trend analysis and ratio
analysis.
WORKING CAPITAL TREND ANALYSIS
The working capital trend analysis represents a picture of variation in
current assets, current liabilities and working capital over a period of time.
Such an analysis enables us to study upward and downward trend in current
liabilities and its effect on the working capital position. The trend analysis is a
tool of financial appraisal where the changes in the factors are compared with
the base year assuming the base year as 100.
In the present study a statement – showing trend of working capital as well
as its structure has been made. It is it scientific and important study
because each component of working capital has got the relationship of
causes and effects.
Following table below shows the structure and trend of working capital of
Gaya Dairy ltd.during the period under review.

8/8/2019 Capital Manageemnt - Alok
http://slidepdf.com/reader/full/capital-manageemnt-alok 60/83
STRUCTURE AND TREND OF WORKING CAPITAL OF GAYA DAIRY
DURING 2007 TO 2010
PERTICULAR 2007-2008 2008-2009 2009-2010
CURRENT ASSETS
CASH 322389.24 855819.51 836439.2
BANK 18632795.88 35936348.16 27218462.16
LOAN AND ADVANCES 71220809.88 84836477.65 77115112.92
yDEBTORS 300805197.7 311027760.6 356580000.4
STOCK 377580243.7 427327384.8 465048573.5
TOTAL (A) 768561436.4 859983790.7 926798588.2
CURRENT LIABILITIES
CURRENT LIABILITIES AND
PROVISIONS
526439722 512950750.7 442009648.8
TOTAL (B) 526439722 512950750.7 442009648.8
NET WORKING CAPITAL (A-
B)
242121714.4 347033040 484788939.4

8/8/2019 Capital Manageemnt - Alok
http://slidepdf.com/reader/full/capital-manageemnt-alok 61/83
Inference
• Current Assets increase to 20.59% in the year of 2009-2010 as
Compare to in the year 2007-2008.
• Current Liabilities in the year 2009-2010 got decreased by
16.04%. As compared to the year 2007-2008.
• In the year 2008-2009 the growth in working capital was
43.33%
As compare to the year 2007-2008 similarly working capital in
the year 2009-2010 has grown to 100.03% as compared to theworking capital in the year 2007-2008
The analysis shows the effective and efficient management of working
capital by the Gaya Dairy.
RATIO ANALYSIS OF WORKING CAPITAL
Trend analysis shows the trend of current assets, current liabilities and
working capital only. It do not interpret the contribution of each item of
working capital in the trend, whereas, it can be done easily by ratio
analysis. The ratio analysis of working capital can be used by
management as a means of checking upon the efficiency in working
capital management of the company. Following ratio haven used to
analysis and interpret working capital of Gaya Dairy ltd.
Current ratio
Quick ratio
Absolute ratio
Stock or inventory ratio
Working capital turnover ratio

8/8/2019 Capital Manageemnt - Alok
http://slidepdf.com/reader/full/capital-manageemnt-alok 62/83
CURRENTRATIO
Current ratio is one of the important ratios used in testing liquidity of a
concern. this is a good measure of the ability of company to maintain
solvency over a short run. This is computed by dividing the total current
assets by the total current liabilities and is expressed as:
The current assets of a firm represent those assets, which can be in the
ordinary course of business, converted into cash within one accounting
year. The current liabilities are defines as obligation maturing within a short
period (usually one accounting year). Excess of current assets over current
liabilities is known as working capital and since these two (current assets
and current liabilities) are used in current ratio therefore, this ratio is also
known as working capital ratio.
With the help of this ratio the analyst can review the extent to which
the company can covert such liabilities with current assets. The current
ratio gives the analyst a general picture of the adequacy of the working
capital of a company and ability of the company to meet its day-to-day
payment obligation. “it likewise measures the margin of safety provided for
paying current debts in the event of a reduction in the values of current
assets.”

8/8/2019 Capital Manageemnt - Alok
http://slidepdf.com/reader/full/capital-manageemnt-alok 63/83
The current ratio is very useful as a measure of short terms debt
prying ability but it is tricky to interpret this ratio. Experts are of the view
that the value of current assets should be at least double the amount if
current liabilities.
Walker and Bough have the same view when they ay “a good current
ratio may mean a good umbrella for creditors against the rainy days.”But to
the management it reflects bad financial planning or presence of idle
assets or over capitalization”
IDLE CURRENT RATIO: 2:1
If this ratio is higher than standards than it is assumed
Very good short –term liquidity/solvency.
Excess stocks, bad debts and idle cash.
Under trading
If this ratio is lower than standards than it is assumed
Unsatisfactory short-term liquidity.
Shortage of stocks, less credit sales, shortage of cash.
Over trading

8/8/2019 Capital Manageemnt - Alok
http://slidepdf.com/reader/full/capital-manageemnt-alok 64/83
CURRENT RATIO OF GAYA DAIRY LTD.DURING 2007 TO 2010
YEAR
CURRENT
ASSETS
CURRENT
LIABILITIES
CURRENT RATIO
(A) (B) (C) (B)/(C)
2007-2008 768561436.4 526439722 1.46
2008-2009 859983790.7 512950750.7 1.68
2009-2010 926798588.2 442009648.8 2.01
INFERENCE:-
This table reveals that current ratio has increased that is
making improvements in its short term solvency. It is because of increase in
current assets as compared to current liabilities. Still this is lower than
standard current assets ratio that shows a little bit unsatisfactory liquidity
position of the company.
The Current Ratio for the year 2009-2010 has taken the Value of 2.01:1, which
is very satisfactory and as per the standard required (2:1).The current ratio of
2.01:1 indicates, that for every Rs 1 of current liability the company Rs 2 of
current assets, which indicates more liquidity and hence more amount of
working capital.

8/8/2019 Capital Manageemnt - Alok
http://slidepdf.com/reader/full/capital-manageemnt-alok 65/83
QUICK RATIO
The solvency of a company is batter indicated by quick
Rato.the fundamental this Ratio is to enable the financial management of a
company to ascertain that would happen
If current creditors press for immediate payment and either not
Possible to push up the sales of closing or it id sold, a heavy loss is likely to be
suffered. This problem arises because closing stock is two steps away from
the cash and their price more or less uncertain according to market demand.
The term quick assets include all current assets except inventories and
prepaid expenses. It shows the relationship of quick assets and current
liabilities. The Ratio is calculated as following:
An indicator of a company's short-term liquidity. The quick ratio measures a
company's ability to meet its short-term obligations with its most liquid assets.
The higher the quick ratio, the better the position of the company.
Also known as the "acid-test ratio" or the "quick assets ratio".
IDLE QUICK RATIO 1:1
8/8/2019 Capital Manageemnt - Alok
http://slidepdf.com/reader/full/capital-manageemnt-alok 66/83
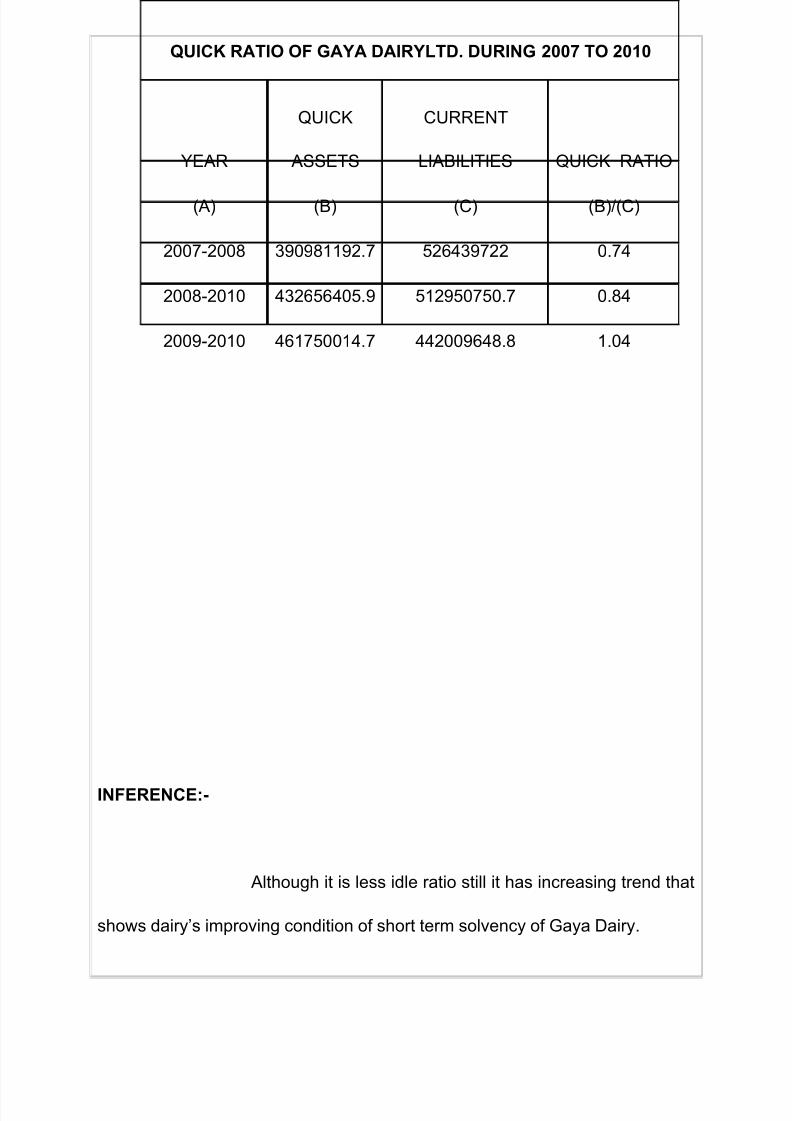
INFERENCE:-
Although it is less idle ratio still it has increasing trend that
shows dairy’s improving condition of short term solvency of Gaya Dairy.
QUICK RATIO OF GAYA DAIRYLTD. DURING 2007 TO 2010
YEAR
QUICK
ASSETS
CURRENT
LIABILITIES QUICK RATIO
(A) (B) (C) (B)/(C)
2007-2008 390981192.7 526439722 0.74
2008-2010 432656405.9 512950750.7 0.84
2009-2010 461750014.7 442009648.8 1.04

8/8/2019 Capital Manageemnt - Alok
http://slidepdf.com/reader/full/capital-manageemnt-alok 67/83
Quick ratio for the year 2009-10 is above the ideal standard. It is 1.04:1, which
indicates that for every Re1 of current liability the company has Rs 1.04 of
current assets, hence the company is in sound position in terms of working
capital position.
ABSOLUTE LIQUDITY RATIO
The absolute liquid ratio between absolute liquid
assets and current liabilities is calculated by dividing the liquid assets and
current liabilities. Expressed in formula, the ratio is:
Cash + Marketable Securities
= Absolute Liquidity Ratio
Current Liabilities

8/8/2019 Capital Manageemnt - Alok
http://slidepdf.com/reader/full/capital-manageemnt-alok 68/83
The term liquid assets include cash bank balance and marketable securities, if
current liabilities are to pay at once, only balance of Cash and marketable
securities will be utilized. Therefore, to measure the absolute liquidity of a
business, this ratio is calculated.
IDLE RATIO: 0.5: 1
The idea behind the norm id that if all creditors for demand for payment, at
least 50% of their claim should be satisfied at once.
The table shown on the next page reflects the absolute liquidity ratio Gaya
Dairy Ltd.
ABSOLUTE LIQUIDITY RATIO OF GAYA DAIRYLTD. DURING 2007 TO
2010
YEAR
ABSOLUTE
LIQUID ASSETS
CURRENT
LIABILITIES
ABSOLUTE
RATIO
(A) (B) (C) (B)/(C)
2007-2008 18955185.12 526439722 0.04
2008-2009 36792167.67 512950750.7 0.07
2009-2010 28054901.36 442009648.8 0.06

8/8/2019 Capital Manageemnt - Alok
http://slidepdf.com/reader/full/capital-manageemnt-alok 69/83
INFERENCE
This ratio is very below from idle ratio. It is making insecure
creditors claim but it is getting increasing trend. It is needed to maintain this
trend.
Ratios for all the above mentioned years right from 2007 up to 2010 are close
to the standard. For year 2009-10, the ratio is well above the standard, which
indicates the healthy picture of the company in terms of availability of working
capital (quick assets) in order to meet current liabilities.
INVENTORY TURNOVER RATIO
Every firm has to maintain a certain level of inventory of finished good so as to
be able to meet the requirements of the business. But the level of inventory
should neither to be high not to be low. It to high inventory means higher
carrying cost and higher risk of stocks becoming obsolete whereas to low
inventory may mean the loss of business opportunities. it is very essential to
keep sufficient stock in business .
it is express in number of time . Stock turnover ratio or inventory turn over
ratio indicates the no. of times the stock has been turned over during the
period and evaluates the efficiency with which a firm a able to manage its
8/8/2019 Capital Manageemnt - Alok
http://slidepdf.com/reader/full/capital-manageemnt-alok 70/83
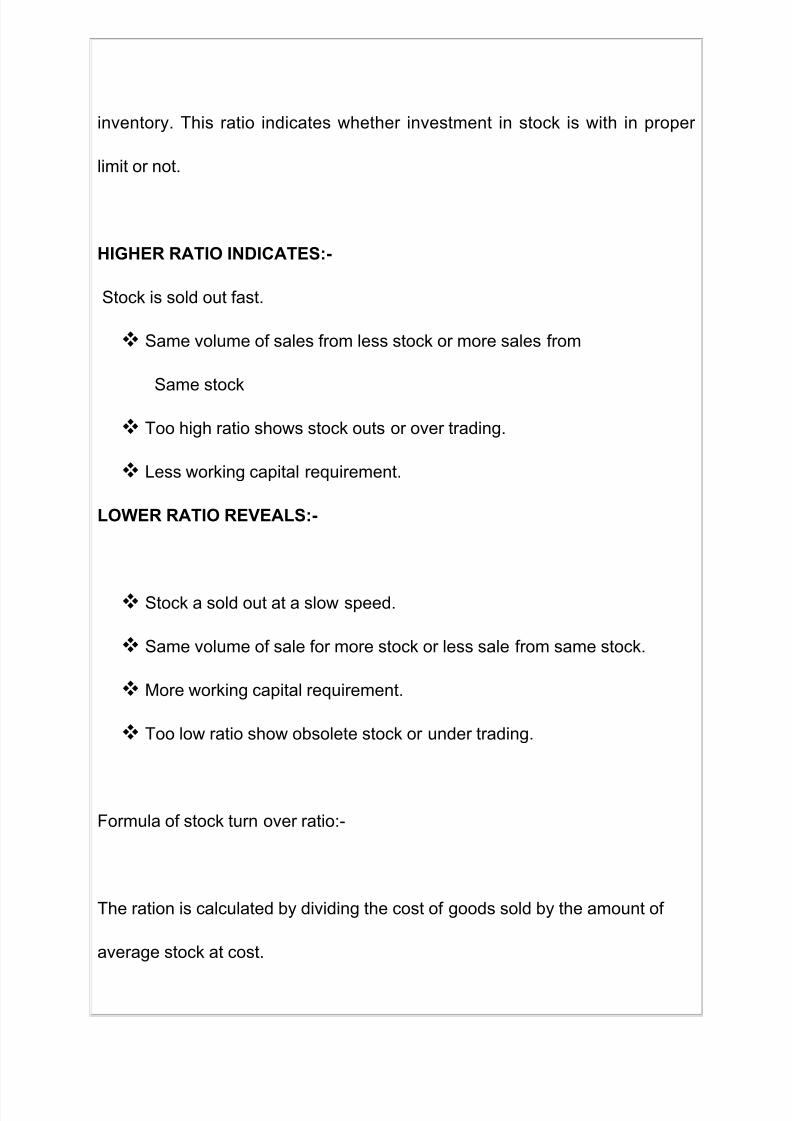
inventory. This ratio indicates whether investment in stock is with in proper
limit or not.
HIGHER RATIO INDICATES:-
Stock is sold out fast.
Same volume of sales from less stock or more sales from
Same stock
Too high ratio shows stock outs or over trading.
Less working capital requirement.
LOWER RATIO REVEALS:-
Stock a sold out at a slow speed.
Same volume of sale for more stock or less sale from same stock.
More working capital requirement.
Too low ratio show obsolete stock or under trading.
Formula of stock turn over ratio:-
The ration is calculated by dividing the cost of goods sold by the amount of
average stock at cost.

8/8/2019 Capital Manageemnt - Alok
http://slidepdf.com/reader/full/capital-manageemnt-alok 71/83
Inventory turnover Ratio =
Inventory turn over ratio measures the velocity of
conversion of stock in to sales. Usually a high inventory turnover / stock
velocity indicates efficient management of inventory because more frequently
the stock are sold, the lesser amount of money is required to finance the
inventory. Low inventory turn over ration indicate inefficient management of
inventory. in low inventory turn over implies over investment in inventories, the
business, poor quality of goods, stock accumulation, accumulation of absolute
and slow moving good and low profit as compared to total investment the
inventory turn over ratio is also an index profitability where a high ratio signifies
more profit ‘a low ratio signifies low profit some time a high inventories.

8/8/2019 Capital Manageemnt - Alok
http://slidepdf.com/reader/full/capital-manageemnt-alok 72/83
INVENTORY TURNOVER RATIO OF GAYA DAIRY LTD.
DURING 2007 TO 2010
YEAR
COST OF
GOOD
SOLD
AVERAGE
INVENTO
RY
INVENTORY
TURNOVER(TIM
ES)
INVENTORY
TURNOVER(DA
YS)
(A) (B) (C)
(D) = (B)/
(C) (E)= 365/D
2007-
2008
295507603
1
377580243
.7 7.83 46.64
2008-
2009
350101435
0
427327384
.8 8.19 44.55
2009-
2010
399510464
1
465048573
.5 8.59 42.49

8/8/2019 Capital Manageemnt - Alok
http://slidepdf.com/reader/full/capital-manageemnt-alok 73/83
INFERENCE:-
As compared to year 2007-2008, in the year 2008-
09, the inventory turnover increased to 8.19 times. Similarly, in the year 2009-
10 it increased to 8.59 times, which indicates that the times taken in converting
raw material into finished product and finally selling it got reduced considerably
and hence indicates quick release of working capital
WORKING CAPITAL TURNOVER
A measurement comparing the depletion of working capital to the generation
of sales over a given period. This provides some useful information as to how
effectively a company is using its working capital to generate sales.
A company uses working capital (current assets - current liabilities) to fund
operations and purchase inventory. These operations and inventory are then
converted into sales revenue for the company. The working capital turnover
ratio is used to analyze the relationship between the money used to fund
operations and the sales generated from these operations. In a general sense,
the higher the working capital turnover, the better because it means that the
company is generating a lot of sales compared to the money it uses to fund
the sales.

8/8/2019 Capital Manageemnt - Alok
http://slidepdf.com/reader/full/capital-manageemnt-alok 74/83
WORKING CAPITAL RATIO OF GAYA DAIRYLTD. DURING 2007
TO 2010
YEAR NET SALES
WORKING
CAPITAL
CURRENT
RATIO
(A) (B) (C) (B)/(C)
2007-2008
320751031
4 242121714.4 13.24
2008-2009
374780503
1 347033040 10.8
2009-2010
426614396
5 484788939.4 8.8
INFERENCE:
In spite of an increase in Net Working Capital, the Working
capital turnover ratio of Gaya Dairy got reduced to 10.8 times in the year 2008-
2009, as compared to the year 2007-08. Similarly, in the year 2009-10, the
working capital turnover ratio further reduced to 8.8 times as compared to
13.24 times in the year 2009-10. The reduction in working capital turnover ratio
is on account of massive growth in net working capital as compared to a slight
growth in the sales of the company.

8/8/2019 Capital Manageemnt - Alok
http://slidepdf.com/reader/full/capital-manageemnt-alok 75/83
CHAPTER – VI
CONCLUSION
AND
RECOMMENDATIONS

8/8/2019 Capital Manageemnt - Alok
http://slidepdf.com/reader/full/capital-manageemnt-alok 76/83
CONCLUSION AND RECOMMENDATION
Financial analysis is analysis of financial statements of and
enterprise. Financial statement reorganized collection of data according to
logical and constituent accounting procedures. How ever financial statements
in their traditional from giving historical data and information are of little us to
these who use them to draw certain conclusion.
Financial appraisal is scientific evaluation of profitability
and financial strength of any business concern. Financial appraisal techniques
include ratio analysis, common size analysis, trend analysis, fund flow analysis
etc. these techniques may be applied in the financial appraisal of any entity
and Gaya Dairy ltd. Is no exception to it.

8/8/2019 Capital Manageemnt - Alok
http://slidepdf.com/reader/full/capital-manageemnt-alok 77/83
PROFITABILITY
The measurement of profitability is a tool of overall measurement of efficiency
an overall study profitability of Gaya Dairy has been Dade in relation to sales
operating assets capital employed and its net worth.
By analysis the working result i.e. Profit and loss account of Gaya Dairy ltd. It
was found that the net profit before interest and tax of the Gaya Dairy is
showing increasing trends. This is very good for Gaya Dairy ltd. The increase
in the profits is nearly 24% more then previous year the reason is good sales
growth between years. For this following suggestion should be considered.
• Proper cost control is required and cost control technique should be
adopted for it.
• Operating expenses, admn. Expenses should be specially considered to
be reduced.
• Inventory is the biggest items of balance sheet that must have
demanded a large amount of maintaining cost. So efficient inventory
management should be done. Inventory should be reduced extent that
would help to recover blocking money in inventory.
• The service staff should be given proper training and better environment
for work.
• Proper advertisement and sales promotion is required.
• Dairy has to pay large fix interest charged. Hence long term borrowing
should be reduced so that the earning are satisfactorily earmarked with
them.

8/8/2019 Capital Manageemnt - Alok
http://slidepdf.com/reader/full/capital-manageemnt-alok 78/83
Working capital
• In the year 2008-2009 the growth in working capital was 43.33% as
compare to the year 2007-2008 similarly working capital in the year
2009-2010 has grown to 100.03% as compared to the working capital in
the year 2007-2008. The management should follow the same trend
in near future too so to have considerable appreciation in working
capital every year.
• The Current Ratio for the year 2009-2010 has taken the Value of 2.01:1,
which is very satisfactory and as per the standard required (2:1).The
current ratio of 2.01:1 indicates, that for every Rs 1 of current liability the
company Rs 2 of current assets, which indicates more liquidity and
hence more amount of working capital. The company need to further
enhance the value of ratio.
• Quick ratio for the year 2009-10 is above the ideal standard (1:1). It is
1.04:1, which indicates that for every Re1 of current liability the
company has Rs 1.04 of current assets, hence the company is in sound
position in terms of working capital position. It would be better for the
company if in near future it could further enhance the value of the
ratio

8/8/2019 Capital Manageemnt - Alok
http://slidepdf.com/reader/full/capital-manageemnt-alok 79/83
• Absolute quick ratio for the years right from 2007 up to 2010 are close
to the standard. For year 2009-10, the ratio is well above the standard
(0.5:1), which indicates the healthy picture of the company in terms of
availability of working capital (quick assets) in order to meet current
liabilities. The same position should be sustained in near future too.
• As compared to year 2007-2008, in the year 2008-09, the inventory
turnover increased to 8.19 times. Similarly, in the year 2009-10 it
increased to 8.59 times, which indicates that the times taken in
converting raw material into finished product and finally selling it got
reduced considerably and hence indicates quick release of working
capital. In near future it would be more profitable for the company, if
the value of ratio gets increased to 11- 14%.
• In spite of an increase in Net Working Capital, the Working capital
turnover ratio of Gaya Dairy got reduced to 10.8 times in the year 2008-
2009, as compared to the year 2007-08. Similarly, in the year 2009-10,
the working capital turnover ratio further reduced to 8.8 times as
compared to 13.24 times in the year 2007-08. The reduction in working
capital turnover ratio is on account of massive growth in net working
capital as compared to a slight growth in the sales of the company. The
value of ratio could be better in near future , if the growth in sales
matches with the growth in net working capital.

8/8/2019 Capital Manageemnt - Alok
http://slidepdf.com/reader/full/capital-manageemnt-alok 80/83
BIBLIOGRAPHY
I.M.Pandey, (1978), financial management, Ninth addition, UBS
Publication New Delhi.
Van Horn,(2002),Financial Management and Policy,12 th edition,
Publisher Dorling Kindersley India ltd.
Horne Wwachonicz, J.R.Bhaduri (2005), Fundamentals and Financial
management, 12 th edition, Pearson publisher.
MY Khan, P.K.Jain (1981), Financial Management,5 th edition, Publisher
Mc graw hill companies.
Financial statement for the year ended 2007-08 as obtained from Gaya
Dairy
Annual-Report 2006-07 of Gaya Dairy.
Financial dailies.
Economic Times
Business Standard
Business Magazines
Business India

8/8/2019 Capital Manageemnt - Alok
http://slidepdf.com/reader/full/capital-manageemnt-alok 81/83
GLOSSARY
1) HACCP: HACCP stands for Hazard Analysis and Critical Control Points.
HACCP is an industry-wide effort approved by the scientific community as
well as regulatory and industry practitioners. This effort is designed to focus
specifically on food safety, including food safety in retail establishments.
HACCP, or the Hazard Analysis Critical Control Point system, is a process
control system that identifies where hazards might occur in the food
production process and puts into place stringent actions to take to prevent
the hazards from occurring. By strictly monitoring and controlling each step
of the process, there is less chance for hazards to occur. HACCP is
important because it prioritizes and controls potential hazards in food
production. By controlling major food risks, such as microbiological,
chemical and physical contaminants, the industry can better assure
consumers that its products are as safe as good science and technology
allows. By reducing food borne hazards, public health protection is
strengthened.
2) ISO : ISO is the International Standard Organization. It is essentially a
federation of national standards bodies from around 150 different countries.
Within ISO there are constantly new standards and upgrades being worked
upon. Established in 1947, ISO is a non-government organization, with a

8/8/2019 Capital Manageemnt - Alok
http://slidepdf.com/reader/full/capital-manageemnt-alok 82/83
mission broadly to promote the development of standardization with the
objective of facilitating international trade. ISO standards are prefixed with
'ISO'. ISO contribute to making life simpler, and to increase the reliability
and effectiveness of the goods and services we use.
3) PASTEURIZATION : Pasteurization is the process of heating liquids for the
purpose of destroying viruses and harmful organisms such as bacteria,
protozoa, molds, and yeasts. The process was named after its inventor,
French scientist Louis Pasteur. The first pasteurization test was completed
by Pasteur and Claude Bernard on April 20, 1862. The food is heated
enough to destroy the most heat-resistant pathogenic or disease-causing
microorganism known to be associated with that food. In this process a
large quantity of milk is held in a heated vat at 63 °C (145 °F) for 30
minutes, followed by quick cooling to about 4 °C (39 °F).

8/8/2019 Capital Manageemnt - Alok
http://slidepdf.com/reader/full/capital-manageemnt-alok 83/83