Embed Size (px)
Citation preview

1
Capital Account Liberalization, Financial Development and
Industry Growth: A Synthetic View
Barry Eichengreen, Rachita Gullapalli and Ugo Panizza*
January 2009
Abstract
This paper synthesizes previous studies analyzing the effects of capital account liberalization on industry growth while controlling for financial crises, domestic financial development and the strength of institutions. We find reasonably strong evidence that financial openness has positive effects on the growth of financially-dependent industries, although these growth-enhancing effects evaporate during financial crises. Further analysis indicates that the positive effects of capital account liberalization are limited to countries with relatively well-developed financial systems, good accounting standards, strong creditor rights and rule of law. It suggests that countries must reach a certain threshold in terms of institutional and economic development before they can expect to benefit from capital account liberalization. Keywords: Capital account liberalization, Financial development, External dependence JEL Codes: F30, F34, F36, G01
* The first two authors are affiliated with the University of California, Berkeley, the third with UNCTAD. E-mail addresses: [email protected]; [email protected] and [email protected].
2
1. Introduction The growth effects of capital account liberalization are an issue that will not go away.
Since the turn of the century additional countries have moved to relax and remove restrictions on
capital flows (Figure 1). The first decade of the new century then saw the fastest global growth
in more than 30 years, an outcome in which many low- and middle-income countries shared.
This coincidence of timing encouraged causal arguments that capital mobility was contributing
to rapid growth. Indeed some explanations made the connection explicit, such as the so-called
Bretton Woods II model which portrays capital mobility as an essential element of high global
growth in recent years.1
The credit crisis of 2007-8 turned these arguments on their head. It is now argued that
an open capital account, combined with high savings in countries like China, fueled the capital
flows that artificially inflated housing markets and asset valuations in the United States and other
advanced economies. Openness to capital flows, it is further argued, allowed current account
deficits to widen unsustainably in Central and Eastern Europe and encouraged the development
of dangerous currency and maturity mismatches everywhere from Hungary to South Korea.2 A
movement to reimpose restrictions on international capital flows may now be getting underway
in response. Recent experience thus highlights the fact that the debate over the growth effects of
capital account liberalization remains fundamentally unresolved.
Since Rodrik (1998), who found no correlation between capital account liberalization
and growth, large amounts of computer time have been spent on efforts to identify or discredit
1 The locus classicus of Bretton Woods II is Dooley, Folkerts-Landau and Garber (2003). 2 The idea that the costs and benefits of capital mobility leave a different impression in crisis and non-crisis periods is hardly novel. Thus, Eichengreen and Leblang (2003) distinguish crisis and noncrisis periods using the standard model of the macroeconomic effects of capital account liberalization.

3
the existence of an effect.3 It is of course possible to find no evidence of an effect when one
exists; this can result from noisy data, omitted variables or other forms of model
misspecification.4 But it is equally possible to find evidence of an effect when none exists owing
to, inter alia, reverse causality running from growth and higher incomes to capital account
liberalization.
These problems are likely to be especially acute in studies using national growth rates as
the dependent variable. Economy-wide growth and capital account liberalization are
simultaneously determined. With growth come higher incomes, and with higher incomes come
the stronger institutions and policies needed to manage capital flows and heighten the likelihood
that the benefits of an open capital account exceed the costs. But those stronger policies and
institutions which influence the decision to open the capital account also affect growth directly.
In other words, they do not satisfy the exclusion restriction for a valid instrument for capital
account liberalization. This renders identification problematic in regressions involving aggregate
growth and a measure of capital account liberalization.
The same endogeneity confounds attempts to identify the impact of financial
development on growth. In response investigators have moved to the analysis of firm and
industry data. In an influential contribution, Rajan and Zingales (1998) asked whether firms and
sectors that depend more on external finance for what are posited to be technological reasons
benefit more from the presence of deep and liquid domestic financial markets. Specifically, they
ask whether the value added of such sectors grows more quickly in countries with better
developed financial markets. They found for the period 1980-90 strong evidence that financial
3 Recent surveys of this literature are Eichengreen (2001), Kose, Prasad, Rogoff and Wei (2006), Henry (2007), and Rodrik and Subramanian (2008). 4 As one economist once put it, the secret of successful research is to define one�s null so that failure to estimate a significant coefficient can be claimed as success.
4
development mattered in this sense.
This approach has two advantages over the earlier literature. It gets around the reverse
causality problem insofar as there is no reason why the growth of a specific industry, defined at
the three- or four-digit level, should affect financial development in the country as a whole. And
it tests a specific mechanism through which financial development matters, namely by relaxing
financing constraints.
Extending this approach to the growth effects of capital account liberalization is
straightforward. In principle firms can tap foreign as well as domestic financial markets. The
question then becomes whether firms that depend more on external finance grow more quickly in
countries with an open capital account. It is whether the answer depends on the strength of
policies and institutions in the country.
We know of five studies posing this question: Galindo, Micco and Ordenez (2002),
Vanassche (2004), Vlachos and Waldenstrom (2006), Prasad, Rajan and Subramanian (2007),
and. Levchenko, Ranciere and Thoenig (2008). But Galindo, Micco and Ordenez, while
considering various measures of financial liberalization, do not at the same time consider
financial development. And unlike recent work focusing on the effects of financial development
they do not distinguish crisis and noncrisis periods, where there is a presumption that the effects
of an open capital account will differ between such periods. Vanassche similarly does not
distinguish crisis and nonncrisis periods, and her findings for whether domestic financial
development or international financial liberalization matters for industry growth are sensitive to
how these variables are measured. Vlachos and Waldenstrom utilize data only through 1990 and
they too do not distinguish crisis and non-crisis periods. Prasad, Rajan and Subramanian (2007)
use more recent data and split their sample across different types of countries but they also do

5
not separate crisis periods from normal times. Finally Levchenko, Ranciere and Thoenig (2008)
consider the effect of liberalization on both output growth and volatility, but they do not
explicitly separate crisis and non-crisis periods. Nor do theycheck whether the growth effect of
capital account liberalization varies across countries.
So what is the message of studies adopting this approach to analyzing the effects of
capital account liberalization? At this point there is none. In other words, there still is no
synthetic analysis that controls for other factors also plausibly influencing industry growth, such
as the development of domestic financial markets and the strength of institutions, and which at
the same time distinguishes crisis and noncrisis periods. It is that synthetic view that we attempt
to provide in this paper.
We find evidence that capital account openness has positive effects on the growth of
financially-dependent industries. But those effects are eliminated by crises. Specifically the
growth of financially-dependent sectors is no faster in financially open than financially closed
economies in decades marked by crises. But neither is the growth of financially-dependent
sectors slower in crisis periods. This suggests that countries that have succeeded in avoiding
crises have benefited from capital account liberalization while countries that have not so
succeeded have neither benefited nor suffered on average.
But these results are driven mainly by the high-income countries. Probing deeper, we
find that the positive effects of capital account openness are limited to countries with well
developed financial systems, good accounting standards, strong creditor rights, and rule of law.
The same is true of the crisis-period offset: just as there is no evidence for low- and middle-
income countries of an additional boost from capital account liberalization in financially-
dependent sectors in normal times, there is no evidence of smaller benefits (or of those benefits

6
disappearing entirely) in crisis periods, whether underdevelopment is measured by low incomes,
shallow financial markets or weak institutions. This provides an explanation for why so many
other earlier studies did not find a consistent effect � namely, they failed to probe for such
threshold effects. It is a reminder of the importance of sequencing capital account liberalization
with other policies associated with this larger process of economic and institutional development.
2. Literature
A substantial literature has now adopted the Rajan-Zingales approach to testing for
effects of financial development and financial structure on industry growth. An early study by
Cetorelli and Gambera (2001) finds that financially dependent sectors grow faster in countries
with well developed banking systems and that young and small firms in such sectors grow faster
when the banking system is highly concentrated. They also find that bank concentration slows
industry growth overall, but not for the subset of firms that are most dependent on external
finance. The Cetorelli-Gambera analysis thus suggests that the Rajan and Zingales methodology
allows precise statements about the relative performance of industries within a country but that it
cannot be used to look at how finance affects overall growth.
Several studies have attempted to distinguish the effects of financial development in
recession and crisis periods as distinct from more normal times and in countries with stronger
and weaker institutions. Braun and Larrain (2005) and Raddatz (2006) for example show that
industries that depend more on external finance contract more in recessions. This effect is larger
in countries where accounting standards and creditor rights are weak and where consequently

7
financial frictions are high.5
Kroszner, Laeven and Klingebiel (2007) postulate that the financial development-growth
link for more financially-dependent sectors should operate in normal but not crisis periods. As
their measure of crises they use the Caprio and Klingebiel (2002) index of systemic banking
crises. (They do not also consider currency crises.) They find that more financially-dependent
sectors experience sharper contractions in crisis periods in countries with well developed
financial systems. Specifically, the standard external dependence/financial development
interaction has a significantly positive coefficient in pre-crisis periods but no effect in crisis
periods.6
Dell�Ariccia, Detragiache and Rajan (2005) similarly find that industries depending
more on external finance are more negatively impacted by banking crises. But when they add a
second interaction to capture the impact of currency crises, there is no analogous impact,
although the negative effect of banking crises remains. The coefficient on the financial
dependence/currency crisis interaction is, in fact, positive, perhaps indicating that industries
relying more on external finance export disproportionately and therefore benefit from the
currency depreciation associated with currency crises.
Dell�Ariccia, Detragiache and Rajan also look indirectly at the relationship between
capital account liberalization and the impact of banking crises. Their conjecture is that when the
capital account is open and financially dependent firms can tap foreign finance even if the
domestic banking system seizes up, financially dependent sectors should suffer less. Their proxy
5 One would also want to see if these effects are larger or smaller in countries with better developed financial markets, but the authors do not pursue this question. 6 Whether the difference between the two periods is significant depends on how financial depth and development are measured: the difference is significant when they use total credit and M2 (as shares of GDP) but not when they use credit to the private sector. When they enter financial dependence in binary form (distinguishing sectors whose degree of financial dependence is above and below the median level), the difference between crisis and non-crisis periods is significant for all three measures of financial depth.

8
for capital account openness is the flow of foreign loans and bonds to the private sector. They
confirm that the impact of banking crises on financially dependent sectors is less when the
capital account is open.
While Dell�Ariccia, Detragiache and Rajan consider capital account liberalization
largely as an afterthought, other authors focus on it directly. Galindo, Micco and Ordenez (2002)
utilize the Kaminsky and Schmukler (2001) measures of financial liberalization which are
available for 28 countries. These indices are designed to measure the presence or absence of
restrictions on both domestic and international financial transactions. Their results suggest that
domestic financial liberalization dominates capital account liberalization: when the two are
interacted with external financial dependence only the measure of domestic financial
liberalization matters.7
Vlachos and Waldenstrom (2005) consider both domestic financial development and
international financial integration. But, following Rajan and Zingales, they look at only the
period 1980-1990. They confirm the Rajan-Zingales result for the Rajan-Zingales period:
industries that depend more on external finance grow more quickly in countries with well
developed domestic financial markets. In contrast, they do not find an impact of capital account
liberalization as measured by the IMF, the Quinn (1997) index, the Bekaert et al. (2005) dates at
which equity markets were opened to foreign investors, or actual cross border capital stocks and
flows. There is more support for an effect of capital account liberalization in relaxing financing
constraints when industry growth is measured by output than by value added and when the
sample is limited to countries at a high level of financial development.
Similarly, Vanassche (2004) finds that industries depending on external finance grow
7 But this result comes from a single regression lacking other controls. The authors also find that domestic financial liberalization (as distinct from financial development) benefits externally dependent industries mainly in countries with strong institutions (as measured by the strength of credit rights, rule of law, or origin of the legal system).

9
more quickly in countries with more internationally integrated financial systems, whether
integration is measured by the IMF de jure index or the Quinn index. This effect is smaller in
countries with more developed domestic financial systems, as if domestic financial development
and international capital flows are alternative ways of satisfying firms� needs for external
finance. When Vanassche looks at all firms, the external dependence/financial depth interaction
continues to matter, but not the external dependence/international financial integration
interaction if she measures financial depth by the sum of private credit and stock market
capitalization; the opposite is true when she uses only stock market capitalization. The effect of
capital account openness is also smaller for high-income countries, which presumably have the
best-developed domestic financial markets.
Prasad, Rajan and Subramanian (2007) consider the growth of sectors more and less
dependent on external finance in countries more and less open to capital flows, where openness
is measured, alternatively, by the stock of inward FDI relative to GDP, the sum of the inward
FDI stock and portfolio capital relative to GDP, the net flow counterparts of these two ratios, the
average current account deficit over the sample period, and the Chinn-Ito measure of capital
account openness. They control for domestic financial development, although they do not also
distinguish crisis and noncrisis periods. The results point to the existence of threshold effects:
they suggest that foreign capital flows stimulate the growth of financially-constrained firms in
countries where domestic financial markets are also relatively well developed but not in
countries with poorly developed domestic financial systems.
Finally, Levchenko, Ranciere and Thoenig (2008) distinguish decades: the 1970s, 1980s
and 1990s.8 They find that financial openness measured by gross capital flows over the ten year
period is positively associated with both output growth and volatility. When they analyze the 8 Stacking data for successive cross sections allows them to introduce country-sector and sector-time fixed effects.

10
channels through which financial openness affect growth, they find no effect on productivity and
a large effect coming from firm entry. They also find that the effect on growth is temporary, but
that the impact on volatility appears to be permanent (or at least very persistent). When they
compare their sector-level results with a more aggregate analysis, they show that, because of
diversification across sectors, aggregate volatility increases less than industry-level volatility.
This selective survey necessarily covers only the tip of a very large research iceberg.9 But it
suffices to create a presumption that this approach can be used to ferret out the impact of capital
account liberalization on growth.
3. Specification
We start by estimating the baseline equation:
9 Still other studies consider other kinds of liberalizations and other dependent variables than the measure of industry growth that is our focus here. Thus, a number of authors consider specific dimensions of capital account liberalization such as opening domestic equity markets to foreign investors and investigate the impact on variables other than the growth of value added. Gupta and Yuan (2005) analyze the impact of stock market liberalizations, while controlling for other economic policies and reforms such as privatization, macroeconomic stability and trade opening. They find that industries depending more on external finance grow faster following liberalizations. Similarly, Manova (2008) shows that equity market liberalizations that enhance the access of foreign investors lead to a larger increase in exports for firms in financially dependent sectors. This effect is largest in countries where the stock market is initially the least liquid, as if foreign equity substitutes for an underdeveloped domestic financial system. Beck (2003) finds that financially-dependent sectors export more and have stronger trade balances in countries with better developed financial markets, as if such markets relax credit constraints, enabling such sectors both to grow and to become more competitive internationally. Alfaro and Charlton (2006) consider the impact of financial openness on firm size, entry, etc.. They proxy financial integration using both the IMF�s de jure measure and de facto measures of cross border capital flows and stocks. They find a significant impact of capital account openness so measured. That impact is larger on industries that depend more on external financing as measured by the Rajan-Zingales index. Harrison, Love and McMillan (2003) look at the impact of international financial liberalization on financing constraints at the firm level. They similarly detect an effect but conclude that the type of liberalization and type of consequent capital flow matter importantly. They find that de facto openness to FDI inflows reduce firm financing constraints. This effect is most pronounced in non-OECD countries with less developed financial markets, although they do not test directly for an interaction effect with country-level financial development. They also find that restrictions on capital account transactions (as measured by the IMF�s AREAER) matters; investment is more sensitive to cash flow in countries with such restrictions in place. With respect to crises, Borensztein and Panizza (2008) use the Rajan-Zingales approach to show that debt crises damages more export-oriented industries.

11
( ) dicdcdcdcdcdi
dicdic
CRLIBLIBFDEFINITSHAREidcdVAGR
,,,,,,,
,,,,
* εδγβα
+++++++=
(1)
Here VAGR is the value added of industry i, in country c, in decade d; cd and id are
country-decade and industry-decade fixed effects; INITSHARE is the share of value added of
industry i on total industrial value added in country c at the beginning of decade d; EF is the
index of external financial dependence of industry i, decade d; FD measures financial
development in country c during decade d; LIB measures capital account liberalization in
country c and decade d; and CR is a dummy variables that takes value one if country c suffered a
crisis in decade d.10 Following prevailing practice, we combine the annual observations into
decade averages in order to filter out short-term noise. Since our data end in 2004, we estimate
the model using two decades (1980-89 and 1990-1999) and a half decade (2000-2004) using
methods appropriate for panel data.11
β and γ are the now standard coefficients measuring the extent to which financial
development and capital account liberalization favor sectors that are depend more on external
finance. Our first innovation is to introduce the interaction between capital account liberalization
and crises. If international financial integration is good for more externally dependent industries
in tranquil period but not during crisis periods is correct, then γ should be positive and δ
negative. This specification and argument run in parallel with those of Kroszner, Laeven and
Klingebiel (2007), who introduce an interaction between banking crises and domestic financial
development and hypothesize that financial development should be good for more externally
10 The model could also include a set of country-industry fixed effects, but the inclusion of these fixed effects generates multicollinearity problems and yields unstable estimates. 11 In the robustness analysis we show that the results do not change substantially when we exclude the 2000-2004 period.
12
dependent industries in tranquil times but it should render them more vulnerable to setbacks in
crisis periods.
4. Data and Sample12
To calculate the growth of value added we draw annual observations from UNIDO�s
Industrial Statistics Data Base. This data base covers manufacturing firms at the three-digit and
four-digit International Standard Industrial Classification (ISIC) level. We calculate the growth
of real value added in the periods 1980-1989, 1990-1999, and 2000-2004 for same the three-digit
and four-digit ISIC sectors used by Rajan and Zingales.13
Rajan and Zingales create their index of external financial dependence (EF) at the ISIC
industry-level for a sample of US firms for the 1980-1990 decade. EF is computed as capital
expenditures minus cash flow from operations, divided by capital expenditures. Rajan and
Zingales compute these variables over a ten-year period to smooth fluctuations. They then use
the median value of this industry-specific variable as the measure of EF. We combined the
original Rajan and Zingales indices for 1980-1990 with new indices for 1990-2000 and 2000-4
generated using Worldscope data.14 The correlation between the 1980-1990 Rajan-Zingales
index and that for 1990-2000 computed using Worldscope is 0.68, while the correlation between
the 1980-1990 Rajan-Zingales index and the 2000-2004 Rajan-Zingales index computed with
Worldscope data is 0.74.15
We measure financial development (FD) as private credit scaled by GDP. The numerator
12 Table A1 in the Appendix lists all the variables used in the empirical analysis with their sources and definitions. 13 To deflate value added we use consumer price index (CPI) data from the International Financial Statistics (IFS) of the International Monetary Fund. 14 For the 1980s, we used the original Rajan and Zingales data because Worldscope has limited coverage for this decade. 15 The correlation between the 1990-2000 index and the 2000-2004 index is 0.96.

13
and denominator are both obtained from International Financial Statistics.16
To capture capital account openness (LIB) we utilize Lane and Milesi-Ferretti�s (2007)
measure of external capital stock as a share of GDP. The authors estimate external assets and
liabilities for 145 industrial and developing countries using the international-investment-position
figures published by national central banks and governments. We set LIB to be equal to one for
all countries for which this index is above the cross-country average in a given decade.17 An
alternative is to use the de jure measure of capital account liberalization or openness as assessed
by the IMF and published in its Annual Report on Exchange Arrangements and Exchange
Restrictions (AREAER). Chinn and Ito (2006) have tabulated these data for 182 countries for
the period 1970-2006 and created a measure of financial openness. Up until 1996 the measure is
based on a set of four proxies for government restrictions on capital mobility viz. (a) openness of
the capital account, (b) openness of the current account, (c) the stringency of requirements for
the repatriation and/or surrender of export proceeds, and (d) the existence of multiple exchange
rates for capital account transactions. These binary variables are set equal to one when
restrictions are non-existent, and zero otherwise. Since 1997 the classification in AREAER for
proxy (a) has been disaggregated, allowing Chinn-Ito use binary variables for each of the sub-
categories as well. For controls on the capital account they use a five-year moving average of
the capital controls (for the current year and four previous years). Yet another KAOPEN
measure is based on the first principal component of the four categories. This KAOPEN index
has a higher value for countries that are more open to cross-border financial transactions. The
index is constructed such that the series has a mean of zero. Country values range from 2.603 to
16 Private credit is the default option in most previous research. However, some studies as noted above use alternative measures of financial development, stock market capitalization for example. We consider some of these alternatives in our sensitivity analysis below. 17 We obtain similar results when we use a continuous measure of capital account liberalization (see below). However, the results are easier to interpret with the discrete version of the index.

14
-1.767.
For banking crises we use the Honohan and Laeven (2005) data base, which updates
Caprio and Klingebiel (1999). This series covers systemic and non-systemic banking crisis
episodes in the period 1974-2002. For 2003 and 2004, we used various publications of the IMF,
World Bank, Moody�s and Fitch Ratings to identify crisis episodes. A binary measure is used
for the annual banking crisis variable (1= banking crisis in a particular year in a country, 0 = no
crisis). The resulting variable takes value one if a country suffered a crisis in a given decade and
zero otherwise.
Currency crisis dates are obtained from the Glick-Hutchison data base.18 Glick and
Hutchison first construct a measure of exchange market pressure as a weighted average of
monthly real exchange rate changes and monthly percentage reserve losses. They identify a
currency crisis when (i) exchange market pressure is more than two standard deviations than the
country-specific mean over the sample period and (ii) the change in pressure is greater than 5 per
cent. The currency crisis variable is also entered in binary form (1 if there was a currency crisis
in a given decade and 0 otherwise).
In order to ensure sufficient representativeness and that results for a country or industry
are not driven by a few influential observations, we dropped countries with fewer than ten
industries in any given decade and all the industries with fewer than 5 observations per country-
decade.19 Since industry-level data tend to be fairly noisy, we also dropped some extreme
outliers. To do this we first estimated a standard Rajan-Zingales regression (i.e., a model that
does not include the interaction between external financial dependence and capital account
liberalization). We then recovered the regression's residuals and computed their standard
18 2006 update of database originally constructed in Glick, Guo and Hutchison (2006). 19 For the 2000-2004 period we dropped all industries that had fewer than 3 observations per country.

15
deviation. Last we dropped all the observations which had residuals with an absolute value
greater that three standard deviations. After cleaning the data using the steps described above, we
were left with a data set that includes 36 industries and up to 49 countries or a total of 3979
observations.20
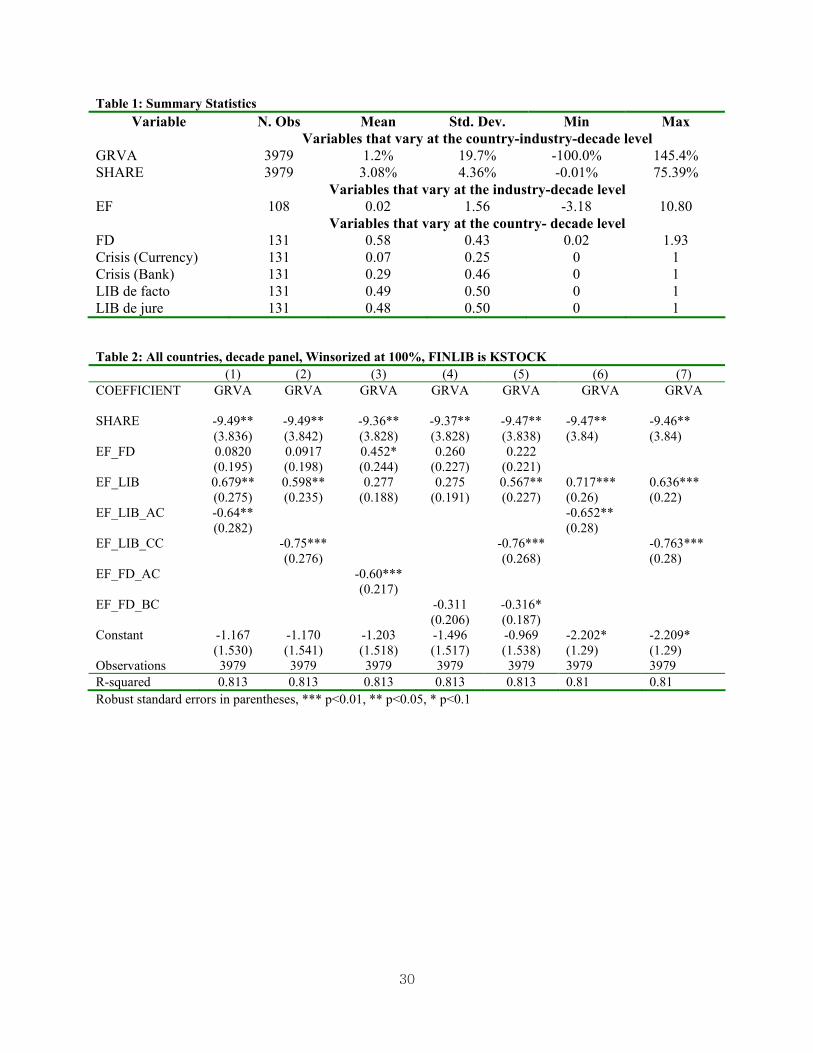
Table 1 reports summary statistics for the main variables. Average real industry value added
growth in the sample is 1.2 per cent and ranges from -100 per cent to 145 per cent. The index of
external financial dependence has an average value of 0.02 and ranges between -3.2 and 10.8.
Financial development has an average value of 58 per cent and ranges between 2 per cent and
190 per cent. About 7 per cent of our observations include a currency crisis, while almost one
third of our observations include a banking crisis.21
5. Results
Table 2 reports the baseline results. It pools the three cross sections and Winsorizes the
dependent variable at 100 per cent. The basic Rajan-Zingales interaction (EF_FD) is always
positive over this period but it is rarely significant at standard confidence levels. Other authors
who have extended Rajan and Zingales� results for the 1980s to a longer period and added
additional controls, such as Levchenko, Rancière, and Thoenig (2008), have found similar
results.
The next coefficient of interest is that on the EF_LIB interaction (γ in Equation 1). γ
captures whether capital account liberalization stimulates faster growth of value added in
20 The dataset is almost balanced across period, we have 1042 observations for the 1989-1989 decade, 1495 observations for the 1990-1999 decade, and 1442 observations for the 2000-2004 period. 21 The fact that almost one third of our observations are associated with a banking crisis should not be interpreted as meaning that the countries were in a banking crisis for one-third of the years covered in our sample because the crisis dummy takes value one if a country had at least one crisis year in a given decade.
16
industries that rely more on external finance. The coefficients on this interaction are uniformly
positive. In four of the six columns of Table 2 they are statistically significant at conventional
confidence levels. The point estimates imply that in countries with an open capital account a one
standard deviation difference in external financial dependence is associated with additional value
added growth of slightly more than 1 per cent per annum (1.56*0.679=1.06). Alternatively, in
countries with an open capital account, the difference between the industry at the 25th percentile
of the distribution of external financial dependence (-0.44) and the industry at the 75 percentile
of external financial dependence (0.26) is associated with a growth differential in real value
added of approximately 0.5 per cent per annum.
The other parameter of interest (δ ) captures the extent to which more externally
dependent industries in countries with an open capital account suffer relatively more at times of
crisis. In column 1 we let the crisis dummy take on a value one for all types of crises (banking
and currency crises alike). δ is negative and statistically significant and of the same order of
magnitude as γ. This indicates that the positive effect of capital account liberalization is
eliminated in crisis periods (γ+δ ≅ 0). That is, while both γ and δ are significantly different from
zero, their sum is not significantly different from zero (if we test the null γ+δ =0 we do not reject
with a p value of 0.86).22 More externally dependent industries, it would appear, grow more
rapidly with liberalization in normal times but they do not grow more slowly in crisis periods.
This is analogous to what Kroszner, Laeven and Klingebiel (2007) find for banking crises and
the effects of domestic financial development. On balance, then, there is no evidence that
countries experiencing crises are worse off on average as a result of either financial development
or capital account liberalization. They just forego the benefits.
22 Note that both the interaction of external financial dependence and capital account liberalization and the further interaction of these variables with a crisis are statistically significant at conventional confidence levels.

17
In column 2 we consider only currency crises. We still find that γ is positive and
statistically significant and that δ is negative and statistically significant. If anything, the crisis
effect is now stronger. That is, the total effect on more externally-finance-dependent industries
in crisis periods is negative (γ+δ=−0.15), although the difference from zero is still not
statistically significant.
In columns 3 and 4 we follow an approach similar to that of Detragiache et al. (2008) and
Kroszner et al. (2007) and interact the crisis dummy with the country-level measure of financial
development. When we consider all crises (column 3) we find that the main effect of financial
development (EF_FD) is positive and statistically significant, the liberalization interaction
(EF_LIB) is positive but not statistically significant, and the crisis triple interaction
(EF_FD_AC) is negative and statistically significant. This parallels the results of Kroszner et al.
But when we focus on banking crises (column 4) as in their study, we find that while all
coefficients have the right sign they are no longer statistically significant (neither individually
nor jointly).
In column 5 we include both the interaction between the banking crisis dummy and
financial development (EF_FD_BC) and the interaction between currency crisis and capital
account liberalization (EF_LIB_CC). The coefficient on the capital account liberalization-
currency crisis interaction remains large and statistically significant at the 1 per cent confidence
level, while the financial development-banking crisis interaction is only marginally significant.
Importantly, the two triple interactions picking up differences between crisis and noncrisis
periods are jointly significant (the p value is 0.009).
Some of the benefits of capital account liberalization could conceivably go through the
creation of a larger domestic financial sector, as argued by inter alia Vanassche (2004). In the

18
last two columns of Table 2 we therefore re-estimate the models of columns 1 and 2 but without
the EF_FD interaction. Any induced impact on FD will now be fully captured by the interaction
terms in AC. The results are basically identical to those of columns 1 and 2. This confirms that
controlling for the level of financial development does not disguise the benefits (or cost) of
capital account liberalization.
The bottom line is that domestic financial development and capital account liberalization
both benefit the growth of financially dependent sectors in countries that are able to avoid the
crisis problem. But when banking and currency crises intervene, those benefits are neutralized.
Still, there is no evidence that countries experiencing crises are worse off on balance as a result
of financial development and capital account liberalization.
6. Sensitivity Analysis
Table 3 estimates the same model using robust regression to check whether the results are
driven by outliers.23 If anything, controlling for outliers makes the results stronger (the only
difference is that the EF_FD_BC interaction which was marginally significant in Table 2 is not
significant in Table 3).
In Table 4 we show that the results do not depend on the Winsorization in Table 2. In
particular we continue to obtain a positive impact on more financially dependent sectors of
external financial liberalization in normal periods that is neutralized in periods of currency crisis.
In Table 5 we augment our model with the interaction between the index of external
finance and the percentage change of the real exchange rate (an increase of the real exchange rate
23 This is important insofar as outliers can be particularly problematic with interacted variables. To check for outliers we use the robust regression routine in STATA. This starts by estimating and OLS regression and dropping observations which have a Cook's distance of greater than 1. Next, it re-estimates the model by weighing observations with the inverse of the absolute value of the residuals. The process then continues until the differences in weights before and after the regression converges to zero.

19
is associated with a currency depreciation). The rationale for including term is that industries
relying more on external finance may be more export oriented than other industries and thus
benefit from a currency depreciation associated with currency crises.24 Consistent with this idea,
we find that the EF_DRER interaction is always positive. However, it is never statistically
significant, and adding it to the model does not change the baseline results.
So far we treated crises as discrete events, with the crisis variable taking value one if a
country suffered a crisis in a given decade and zero otherwise. In Table 6 we use a continuous
definition of the crisis variables. In this case, the crisis variables range from zero to one and
measure the share of years in the relevant subperiod marked by a either a banking or currency
crisis. The results remain qualitatively similar to those of Table 2. The exception, once again, is
that the external finance-financial development-banking crisis triple interaction is never
statistically significant.
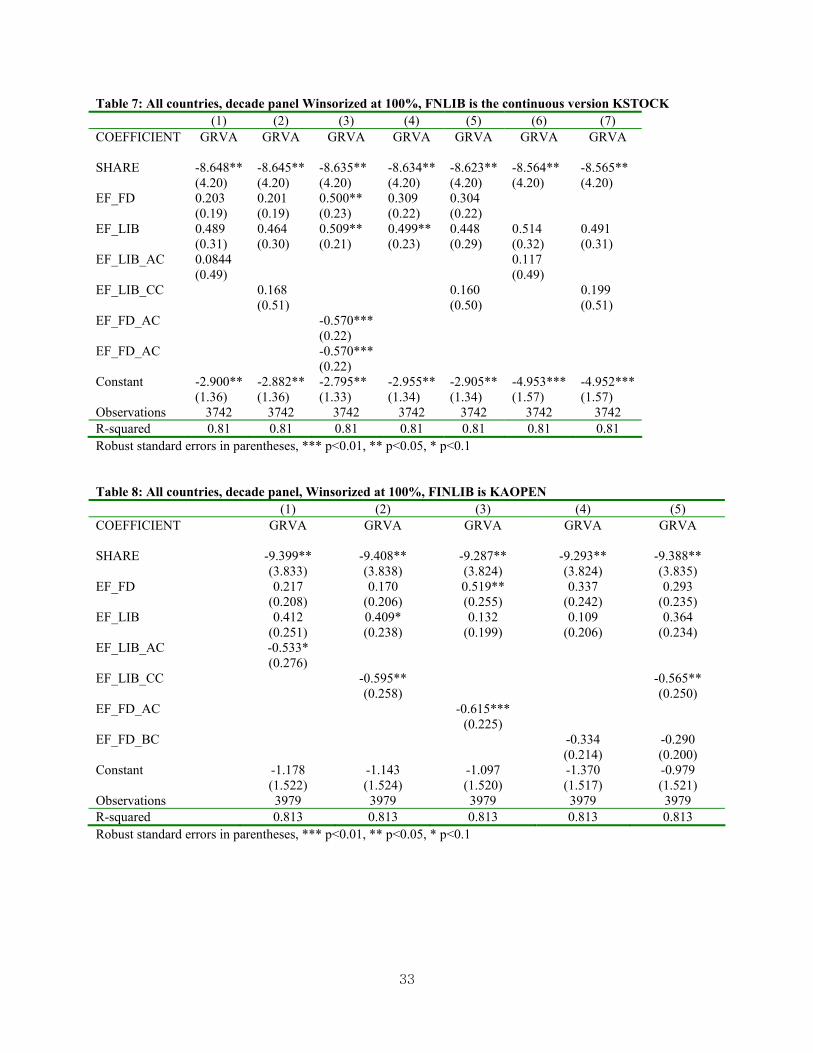
In Table 7, we replace our discrete definition of liberalization with a continuous measure
based on the Lane and Milesi Ferretti (2007) estimates of the external capital stock as a share of
GDP. The results go in the same direction as those in Table 2, although the coefficient estimates
are somewhat less precise.
Table 8 uses de jure capital account liberalization instead of de facto liberalization.
Again we find that the results are slightly weaker. The interaction between external financial
dependence and capital account liberalization remains positive but rarely statistically significant.
The effect of the crisis dummies, however, remains negative and statistically significant.
As a final robustness check, we experiment with alternative measures of financial
development. In Table 9 we substitute credit to the private sector with bank deposits over GDP.
24 This is a possible interpretation of the effect of real depreciation in the Dell�Ariccia, Detragiache and Rajan (2005) study (see above).

20
The results are essentially identical to those of Table 2. In Table 10 we instead measure
financial development with stock market capitalization over GDP. While we lose about 140
observations, we can still reproduce the baseline result of Table 2 that capital account
liberalization promotes the growth of more financially dependent industries in crisis periods and
has no effect in non-crisis periods. However, we now find that the interaction between crisis and
financial development is never statistically significant.
7. Which Countries Benefit from Capital Account Liberalization?
The Rajan-Zingales methodology is rarely used to test whether the effect of financial
development differs across different classes of countries.25 In this section, we reproduce the
analysis of the previous section but allow the effects of financial development and capital
account liberalization to vary across country groupings.
We start by interacting all of our variables of interest with a dummy that takes value one
for developing countries. We thus estimate the following model:
( )( ) dicdcdcdcdcdii
dcdcdcdcdi
dicdic
CRdLIBgLIBbFDEFDEVCRLIBLIBFDEF
INITSHAREidcdVAGR
,,,,,,,
,,,,,
,,,,
***
εδγβ
α
+++++++
+++= (2)
β, γ, and δ now measure the effect of financial development, capital account liberalization, and
crisis in the industrial countries, and β+b, γ+g, and δ+d measure the effect of financial
25 An exception is Prasad, Rajan, and Subramanian (2007) who look at whether the level of financial development affects the way in which capital account liberalization affects the performance of more financially dependent industries.

21
development, capital account liberalization, and crisis in developing countries (b, g, and d
measure the difference between developing and industrial countries).
Table 11 shows that β and b are always positive bur rarely statistically significant. Their
sum is marginally significant (with a p value of 0.9) in only one equation (column 3, see the F
test on EF_FD+EF_FD_DEV at the bottom of the table). In contrast, capital account
liberalization always has a positive and statistically significantly impact in the industrial
countries (this is the γ coefficient), but the coefficient for the developing countries is always
negative (albeit not statistically significant), and γ+g is never close to being statistically
significant (see the EF_LIB+ EF_LIB_DEV F test at the bottom of Table 11). The interaction
between crisis and liberalization is negative and statistically significant in the industrial countries
but never significant in developing countries. Like Kroszner et al. (2007) and Dell'Ariccia et al.
(2008), we find that banking and, in the case of our results, currency crises are particularly costly
for more financially dependent industries. However, this result is mostly driven by the
developing countries (see columns 3-5). The effect, albeit still negative, is smaller (and, in most
cases, not statistically significant) in the industrial countries.
In Table 12 we interact our variables of interest with a dummy variable that takes on a
value of one in countries with a high level of financial development. We classify as having high
levels of financial development all country-decades with a value of FD which is above the
sample median. β, γ, and δ now measure the effect of financial development, capital account
liberalization, and crisis in countries with low levels of financial development, while β+b, γ+g,
and δ+d measure the effect of financial development, capital account liberalization, and crisis in
countries with high levels of financial development (b, g, and d measure the difference between
the two groups of countries).

22
The results suggest that capital account liberalization has no statistically significant effect
in countries with low levels of financial development (consistent with the findings of Prasad,
Rajan, and Subramanian, 2008), but it has a positive effect in countries with high levels of
financial development. Consider, for instance, column 1 of Table 12 which shows that γ=0.11
(not statistically significant) and γ+g =0.77 (and statistically significant, see the
I_EF_LIB+I_EF_LIB_HFD F test in the bottom part of Table 12). We also find that the
negative effect of crisis is statistically significant in countries with high levels of financial
development but not in countries with a poorly developed financial sector.
Probing further, we interact our variables of interest with proxies for the strength of
macroeconomic policies and institutions. First, we compute the country-by-country mean and
standard deviation of inflation and budget deficits for the 1980-1989, 1990-1999, and 2000-2004
periods. (We deal with outliers by capping inflation at 100 per cent and budget deficit at 35 per
cent.) We then obtain an aggregate measure of (poor) macroeconomic policies by extracting the
first principal component of these four measures of macroeconomic policies. Next, we consider
the distribution of our measure of macroeconomic polices within our sample of developed
countries and label as having good macro policies all countries with policies at least as good as
those of the country at bottom 25th percentile of this distribution. Finally, we interact the
resulting dummy variables using the same procedure we used in Table 12.
The results indicate that capital account liberalization has a negative effect in countries
with poor policies. This is the EF_LIB coefficient in Table 13). But it has a positive effect in
countries with good policies. This is the sum of EF_LIB and EF_LIB_GP. However, neither the
individual coefficients nor their sums (see the F tests at the bottom of Table 13) are statistically

23
significant.26
In Table 14 we focus on accounting standards, splitting our sample between countries
with good standards (these are countries with an index of accounting standards which is above
the sample median and are identified by the interaction term GAS) and bad accounting
standards.27 Capital account liberalization has a positive and statistically significant effect in
countries with good accounting standards, but it is not significant in countries with poor
accounting standards.28 We even find that countries with good accounting standards can benefit
from capital account liberalization in time of crisis (column 1 of Table 14 shows that the total
effect, measured by EF_LIB+_EF_LIB_AC+ EF_LIB_GAS+ EF_LIB+EF_LIB_GAS_AC, is
about 0.4 and close to being statistically significant with a p value of 0.16).29
In Tables 15 and 16 we repeat the exercise in Table 14 but substitute rule of law and
creditor rights for accounting standards. The results are similar to those of Table 14: capital
account liberalization mostly befits countries with rule of law and strong creditor rights.
However, we no longer find that good institutions (measured by rule of law or creditor rights)
guarantee benefits from capital account liberalization in crisis periods (EF_LIB+ EF_LIB_AC+
EF_LIB_HROL+ EF_LIB + EF_LIB_HROL_AC and EF_LIB+EF_LIB_AC+ EF_LIB_GCR+
EF_LIB+EF_LIB_GCRL_AC are close to zero and not statistically significant).
26 A possible interpretation is that our measure of policies does not capture well the differential effect of capital account liberalization. Another possible reason explanation is that our measure of polices is highly correlated with the crisis variables (thus, in a sense, it captures very well the probability of a crisis) and that our unstable estimates are due to multicollinearity. 27 We obtain data on accounting standard from Rajan and Zingales (1998). Since they only report data for the mid 1980s and mid 1990s, we use the 1990s data to measure accounting standard in the 2000-2004 period. We do not think that this is a serious issue because accounting standard do not vary much over time. 28 Both the total effect (measured by EF_LIB+EF_LIB_GAS) and the difference between good and bad account standards (measured by EF_LIB_GAS) are statistically significant. 29 This result, however, only holds for the regression of column 1 and it is not robust to the specifications of columns 2-7.

24
8. Conclusion
In this paper we have synthesized previous studies examining the effects of capital
account liberalization on industry growth, controlling for financial crises, domestic financial
development and institutional strength and providing a large number of sensitivity checks. A
large number of sensitivity checks inevitably means that results vary, but the findings
nonetheless paint a coherent picture. There is reasonably strong evidence that capital account
openness has positive effects on the growth of financially-dependent industries. But those
effects are eliminated by crises. That is, in decades punctuated by crises the growth of
financially-dependent sectors is no faster in financially open than financially closed economies.
But neither is their growth slower in crisis periods. This suggests that on average countries that
have succeeded in avoiding crises have benefited from capital account liberalization while
countries that have not so succeeded have neither benefited nor suffered.
Disaggregating country subgroups shows that these results are driven mainly by the high-
income countries. Among low-income developing countries, there is neither further impetus to
growth from financial openness in normal times nor its opposite in times of crisis. Probing
deeper we find that the positive effects of capital account openness are limited to countries with
relatively well developed financial systems, good accounting standards, strong creditor rights
and rule of law � and its disappearance in crisis periods is similarly limited to the high-income
world. This result is consistent with other recent work (e.g. Klein 2005, Prasad, Rajan and
Subramanian 2007) suggesting the existence of threshold effects � that countries must reach a
certain threshold in terms of economic and institutional development before they can expect to
benefit from capital account liberalization. This provides an explanation for why so many other
earlier studies did not find a consistent effect � namely, they failed to probe for such threshold

25
effects. And it is a reminder of the importance of carefully sequencing capital account
liberalization with other policies associated with this larger process of economic and institutional
development.
26
References
Alfaro, Laura and Andrew Charlton (2006), �International Financial Integration and Entrepreneurial Firm Dynamics,� Harvard Business School Working Paper 07-012 (August). Bekaert, Geert, Cambell Harvey and Christian Lundblad (2000), �Emerging Equity Markets and Economic Development,� Journal of Development Economics 66, pp.465-504. Beck, Thorsten (2003), �Financial Dependence and International Trade,� Review of International Economics 11, pp.296-315. Borensztein, Eduardo and Ugo Panizza (2008) �Do Sovereign Defaults Hurt Exporters,� Open Economies Review, forthcoming Braun, Matias and Borja Larrain (2005), �Finance and the Business Cycle: International Inter-Industry Evidence,� Journal of Finance 60, pp.1097-1128. Caprio, Gerald and Daniela Klingebiel (2002), �Episodes of Systemic and Borderline Financial Crises,� in Daniela Klingebiel and Luc Laeven (eds), Managing the Real and Fiscal Effects of Banking Crises, Washington, D.C.: The World Bank. Cetorelli, Nicola and Michele Gambera (2001), �Banking Market Structure, Financial Dependence and Growth: International Evidence from Industry Data,� Journal of Finance 56, pp.617-648. Chinn, Menzie and Hiro Ito (2006), �What Matters for Financial Development? Capital Controls, Institutions, and Interactions,� Journal of Development Economics 81, pp. 163-192. Dell�Ariccia, Giovanni, Enrica Detriagiche and Raghuram Rajan (2005), �The Real Effects of Banking Crises,� IMF Working Paper no. WP 05/63 (March). Dooley, Michael, David Folkerts-Landau and Peter Garber (2003), �An Essay on the Revived Bretton Woods System,� NBER Working Paper no.9971 (September). Dooley, Michael, David Folkerts-Landau and Peter Garber (2007), �The Two Crises of International Economics,� NBER Working Paper no.13197 (June). Eichengreen, Barry (2001), �Capital Account Liberalization: What Do Cross-Country Studies Tell Us?� World Bank Economic Review 15, pp.341-365. Eichengreen, Barry and David Leblang (2003), �Capital Account Liberalization and Growth: Was Mr. Mahathir Right?� International Journal of Finance and Economics 8, pp.20-224. Galindo, Arturo, Alejandro Micco and Guillermo Ordenez (2002), �Financial Liberalization: Does it Pay to Join the Party?� Economia 3, pp.231-261.

27
Glick, Reuven, Xueyan Guo and Michael Hutchison (2006), �Currency Crises, Capital-Account Liberalization and Selection Bias,� Review of Economics and Statistics 84, pp.698-714. Gupta, Nandini and Kathy Yuan (2005), �On the Growth Effects of Liberalizations,� unpublished manuscript, Indiana University (June). Harrison, Ann, Inessa Love and Margaret McMillan (2004), �Global Capital Flows and Financing Constraints,� Journal of Development Economics 75, pp.269-301. Henry, Peter B. (2007), �Capital Account Liberalization: Theory, Evidence, Speculation,� Journal of Economic Literature 45, pp.887-935. Honohan, Patrick and Luc Laeven (2005), Systemic Financial Distress: Containment and Resolution, Cambridge: Cambridge University Press. Kaminsky, Graciela and Sergio Schmukler (2001), �On Booms and Crashes: Financial Liberalization and Stock Market Cycles,� unpublished manuscript, George Washington University and World Bank. Klapper, Leora, Luc Laeven and Raghuram Rajan (2006), �Entry Regulation as a Barrier to Entrepreneurship,� Journal of Financial Economics 82, pp.591-629. Klein, Michael (2005), �Capital Account Liberalization, Institutional Quality and Economic Growth: Theory and Evidence,� NBER Working Paper no.11112 (February). Kose, M. Ayhan, Eswar Prasad, Kenneth Rogoff and Shang-jin Wei (2006), �Financial Globalization: A Reappraisal,� IMF Working Paper no. WP06/189 (August). Kroszner, Randall, Luc Laeven and Daniela Klingebiel (2007), �Banking Crises, Financial Dependence and Growth,� Journal of Financial Economics 84, pp.187-228. Lane, Philip and Gian-Maria Milesi-Ferretti (2007), “The External Wealth of Nations, Mark II: Revised and Extended Estimates of Foreign Assets and Liabilities, 1970-2004,” Journal of International Economics 73, pp.223-250. Levchenko, Andrei, Romain Ranciere and Mathias Thoenig (2008), �Growth and Risk at the Industry Level: The Real Effects of Financial Liberalization,� CEPR Discussion Paper no. 6715 (February). Manova, Kalina (2008), �Credit Constraints, Equity Market Liberalizations and International Trade,� Journal of International Economics 76, pp.33-47. Prasad, Eswar, Raghuram Rajan and Luigi Zingales (2007), �Foreign Capital and Economic Growth,� NBER Working Paper no.13619 (November).

28
Raddatz, Claudio (2006), "Liquidity Needs and Vulnerability to Financial Underdevelopment," Journal of Financial Economics 80, pp. 677-722. Rajan, Raghuram and Luigi Zingales (1998), �Financial Dependence and Growth,� American Economic Review 88, p.559-586. Rodrik, Dani (1998), �Who Needs Capital Account Convertibility?� in Peter Kenen (ed.), Should the IMF Pursue Capital Account Convertibility, Princeton Essays in International Finance no. 207 (May). Rodrik, Dani and Arvind Subramanian (2008), �Why Did Financial Globalization Disappoint?� unpublished manuscript, Harvard University and Peterson Institute of International Economics. Vanassche, Ellen (2004), “The Impact of International Financial Integration on Industry Growth,” unpublished manuscript, Catholic University of Leuven (November). Vlachos, Jonas and Daniel Waldenstrom (2005), �International Financial Liberalization and Industry Growth,� International Journal of Finance and Economics 10, pp.263-284.

29
Figure 1: The Evolution of Capital Account Liberalization
-1
-0.5
0
0.5
1
1.5
2
2.5
1981
1982
1983
1984
1985
1986
1987
1988
1989
1990
1991
1992
1993
1994
1995
1996
1997
1998
1999
2000
2001
2002
2003
2004
Chi
nn a
nd It
o In
dex
(cro
ss-c
ount
ry a
vera
ge)
Developed countries
Developing countries
The solid lines are cross-country averages for the countries used in the empirical analysis of this paper. The dotted lines are cross-country averages for all the countries included in the Chinn and Ito (2006) dataset.
30
Table 1: Summary Statistics Variable N. Obs Mean Std. Dev. Min Max
Variables that vary at the country-industry-decade level GRVA 3979 1.2% 19.7% -100.0% 145.4% SHARE 3979 3.08% 4.36% -0.01% 75.39% Variables that vary at the industry-decade level EF 108 0.02 1.56 -3.18 10.80 Variables that vary at the country- decade level FD 131 0.58 0.43 0.02 1.93 Crisis (Currency) 131 0.07 0.25 0 1 Crisis (Bank) 131 0.29 0.46 0 1 LIB de facto 131 0.49 0.50 0 1 LIB de jure 131 0.48 0.50 0 1 Table 2: All countries, decade panel, Winsorized at 100%, FINLIB is KSTOCK (1) (2) (3) (4) (5) (6) (7) COEFFICIENT GRVA GRVA GRVA GRVA GRVA GRVA GRVA SHARE -9.49** -9.49** -9.36** -9.37** -9.47** -9.47** -9.46** (3.836) (3.842) (3.828) (3.828) (3.838) (3.84) (3.84) EF_FD 0.0820 0.0917 0.452* 0.260 0.222 (0.195) (0.198) (0.244) (0.227) (0.221) EF_LIB 0.679** 0.598** 0.277 0.275 0.567** 0.717*** 0.636*** (0.275) (0.235) (0.188) (0.191) (0.227) (0.26) (0.22) EF_LIB_AC -0.64** -0.652** (0.282) (0.28) EF_LIB_CC -0.75*** -0.76*** -0.763*** (0.276) (0.268) (0.28) EF_FD_AC -0.60*** (0.217) EF_FD_BC -0.311 -0.316* (0.206) (0.187) Constant -1.167 -1.170 -1.203 -1.496 -0.969 -2.202* -2.209* (1.530) (1.541) (1.518) (1.517) (1.538) (1.29) (1.29) Observations 3979 3979 3979 3979 3979 3979 3979 R-squared 0.813 0.813 0.813 0.813 0.813 0.81 0.81 Robust standard errors in parentheses, *** p<0.01, ** p<0.05, * p<0.1

31
Table 3: All countries, decade panel Winsorized at 100%, FNLIB is KSTOCK, Robust regressions (1) (2) (3) (4) (5) COEFFICIENT GRVA GRVA GRVA GRVA GRVA SHARE -8.314*** -8.353*** -8.186*** -8.200*** -8.332*** (3.144) (3.143) (3.144) (3.147) (3.145) EF_FD -0.00915 -0.0220 0.322* 0.137 0.102 (0.163) (0.163) (0.191) (0.181) (0.181) EF_LIB 0.610*** 0.524*** 0.213 0.197 0.528*** (0.202) (0.178) (0.156) (0.157) (0.179) EF_LIB_AC -0.564** (0.222) EF_LIB_CC -0.639*** -0.683*** (0.225) (0.225) EF_FD_AC -0.455** (0.188) EF_FD_BC -0.183 -0.257 (0.191) (0.191) Constant -0.313 -0.275 -0.407 -0.452 -0.246 (2.517) (2.516) (2.517) (2.519) (2.518) Observations 3979 3979 3979 3979 3979 R-squared 0.877 0.877 0.877 0.877 0.877 Standard errors in parentheses, *** p<0.01, ** p<0.05, * p<0.1 Table 4: All countries, decade panel, No Winsorization, FINLIB is KSTOCK (1) (2) (3) (4) (5) COEFFICIENT GRVA GRVA GRVA GRVA GRVA SHARE -9.552** -9.545** -9.416** -9.425** -9.524** (3.850) (3.855) (3.842) (3.842) (3.852) EF_FD 0.0818 0.0915 0.452* 0.260 0.222 (0.195) (0.198) (0.244) (0.227) (0.221) EF_LIB 0.678** 0.597** 0.276 0.274 0.567** (0.275) (0.235) (0.188) (0.191) (0.227) EF_LIB_AC -0.641** (0.282) EF_LIB_CC -0.755*** -0.758*** (0.276) (0.268) EF_FD_AC -0.600*** (0.218) EF_FD_BC -0.311 -0.316* (0.206) (0.187) Constant -1.270 -1.273 -1.306 -1.599 -1.072 (1.528) (1.538) (1.516) (1.514) (1.536) Observations 3979 3979 3979 3979 3979 R-squared 0.828 0.828 0.828 0.828 0.828 Robust standard errors in parentheses, *** p<0.01, ** p<0.05, * p<0.1

32
Table 5: All countries, decade panel, controlling for real depreciation, FINLIB is KSTOCK (1) (2) (3) (4) (5) (6) (7) COEFFICIENT GRVA GRVA GRVA GRVA GRVA GRVA GRVA SHARE -9.922** -9.916** -9.773** -9.784** -9.893** -9.902** -9.894** (4.01) (4.02) (4.00) (4.00) (4.01) (4.01) (4.02) EF_FD 0.0608 0.0652 0.444* 0.251 0.206 (0.20) (0.20) (0.24) (0.23) (0.22) EF_DRER 1.961 2.378 1.993 1.823 2.591 2.009 2.431 (1.72) (1.74) (1.75) (1.78) (1.69) (1.72) (1.74) EF_LIB 0.673** 0.596** 0.255 0.254 0.562** 0.701*** 0.623*** (0.27) (0.24) (0.19) (0.19) (0.23) (0.25) (0.21) EF_LIB_AC -0.667** -0.676** (0.28) (0.28) EF_LIB_CC -0.814*** -0.823*** -0.821*** (0.29) (0.28) (0.29) EF_FD_AC -0.621*** (0.22) EF_FD_BC -0.332 -0.347* (0.21) (0.19) Constant -1.095 -1.068 -1.134 -1.437 -0.838 -1.962 -1.914 (1.53) (1.55) (1.52) (1.52) (1.55) (1.31) (1.32) Observations 3964 3964 3964 3964 3964 3964 3964 R-squared 0.81 0.81 0.81 0.81 0.81 0.81 0.81 Robust standard errors in parentheses, *** p<0.01, ** p<0.05, * p<0.1 Table 6: All countries, decade panel, average number of crisis years in the decade, FINLIB is KSTOCK (1) (2) (3) (4) (5) (6) (7) COEFFICIENT GRVA GRVA GRVA GRVA GRVA GRVA GRVA SHARE -9.434** -9.425** -9.372** -9.376** -9.413** -9.395** -9.404** (3.83) (3.83) (3.83) (3.83) (3.83) (3.83) (3.83) EF_FD 0.115 0.0662 0.287 0.234 0.163 (0.19) (0.20) (0.23) (0.22) (0.22) EF_LIB 0.489** 0.478** 0.296 0.299 0.466** 0.536** 0.508** (0.22) (0.23) (0.19) (0.19) (0.22) (0.21) (0.20) EF_LIB_AC_m -0.720** -0.730** (0.30) (0.31) EF_LIB_CC_m -1.981* -1.920* -2.048* (1.11) (1.10) (1.10) EF_FD_AC_m -0.495** (0.25) EF_FD_BC_m -0.369 -0.342 (0.23) (0.22) Constant -1.550 -1.381 -1.673 -1.703 -1.402 -3.162** -3.230** (1.52) (1.53) (1.52) (1.52) (1.53) (1.38) (1.38) Observations 3979 3979 3979 3979 3979 3979 3979 R-squared 0.81 0.81 0.81 0.81 0.81 0.81 0.81 Robust standard errors in parentheses, *** p<0.01, ** p<0.05, * p<0.1
33
Table 7: All countries, decade panel Winsorized at 100%, FNLIB is the continuous version KSTOCK (1) (2) (3) (4) (5) (6) (7) COEFFICIENT GRVA GRVA GRVA GRVA GRVA GRVA GRVA SHARE -8.648** -8.645** -8.635** -8.634** -8.623** -8.564** -8.565** (4.20) (4.20) (4.20) (4.20) (4.20) (4.20) (4.20) EF_FD 0.203 0.201 0.500** 0.309 0.304 (0.19) (0.19) (0.23) (0.22) (0.22) EF_LIB 0.489 0.464 0.509** 0.499** 0.448 0.514 0.491 (0.31) (0.30) (0.21) (0.23) (0.29) (0.32) (0.31) EF_LIB_AC 0.0844 0.117 (0.49) (0.49) EF_LIB_CC 0.168 0.160 0.199 (0.51) (0.50) (0.51) EF_FD_AC -0.570*** (0.22) EF_FD_AC -0.570*** (0.22) Constant -2.900** -2.882** -2.795** -2.955** -2.905** -4.953*** -4.952*** (1.36) (1.36) (1.33) (1.34) (1.34) (1.57) (1.57) Observations 3742 3742 3742 3742 3742 3742 3742 R-squared 0.81 0.81 0.81 0.81 0.81 0.81 0.81 Robust standard errors in parentheses, *** p<0.01, ** p<0.05, * p<0.1 Table 8: All countries, decade panel, Winsorized at 100%, FINLIB is KAOPEN (1) (2) (3) (4) (5) COEFFICIENT GRVA GRVA GRVA GRVA GRVA SHARE -9.399** -9.408** -9.287** -9.293** -9.388** (3.833) (3.838) (3.824) (3.824) (3.835) EF_FD 0.217 0.170 0.519** 0.337 0.293 (0.208) (0.206) (0.255) (0.242) (0.235) EF_LIB 0.412 0.409* 0.132 0.109 0.364 (0.251) (0.238) (0.199) (0.206) (0.234) EF_LIB_AC -0.533* (0.276) EF_LIB_CC -0.595** -0.565** (0.258) (0.250) EF_FD_AC -0.615*** (0.225) EF_FD_BC -0.334 -0.290 (0.214) (0.200) Constant -1.178 -1.143 -1.097 -1.370 -0.979 (1.522) (1.524) (1.520) (1.517) (1.521) Observations 3979 3979 3979 3979 3979 R-squared 0.813 0.813 0.813 0.813 0.813 Robust standard errors in parentheses, *** p<0.01, ** p<0.05, * p<0.1

34
Table 9: All countries, decade panel, Winsorized at 100%, FINLIB is KSTOCK and FD is bank deposits over GDP (1) (2) (3) (4) (5) COEFFICIENT GRVA GRVA GRVA GRVA GRVA SHARE -9.491** -9.468** -9.365** -9.374** -9.461** (3.837) (3.842) (3.831) (3.829) (3.839) EF_FD 0.0724 0.0371 0.407 0.263 0.182 (0.220) (0.228) (0.259) (0.266) (0.258) EF_LIB 0.686** 0.621*** 0.279 0.290 0.595** (0.271) (0.237) (0.187) (0.190) (0.231) EF_LIB_AC -0.644** (0.280) EF_LIB_CC -0.756*** -0.756*** (0.279) (0.270) EF_FD_AC -0.541** (0.225) EF_FD_BC -0.321 -0.319 (0.230) (0.212) Constant -1.123 -1.080 -1.206 -1.438 -0.895 (1.520) (1.536) (1.508) (1.508) (1.527) Observations 3979 3979 3979 3979 3979 R-squared 0.813 0.813 0.813 0.813 0.813 Robust standard errors in parentheses, *** p<0.01, ** p<0.05, * p<0.1 Table 10: All countries, decade panel, Winsorized at 100%, FINLIB is KSTOCK and FD is stock market capitalization over GDP (1) (2) (3) (4) (5) COEFFICIENT GRVA GRVA GRVA GRVA GRVA SHARE -10.51** -10.50** -10.38** -10.38** -10.48** (4.484) (4.491) (4.476) (4.475) (4.487) EF_FD 0.0111 0.0203 0.173 0.104 0.0591 (0.173) (0.173) (0.176) (0.181) (0.175) EF_LIB 0.681** 0.600** 0.288 0.299 0.593** (0.281) (0.236) (0.188) (0.191) (0.232) EF_LIB_AC -0.627** (0.290) EF_LIB_CC -0.734*** -0.748*** (0.282) (0.283) EF_FD_AC -0.302 (0.199) EF_FD_BC -0.150 -0.196 (0.237) (0.222) Constant -0.350 -0.351 -0.577 -1.658 -0.187 (1.509) (1.517) (1.503) (1.366) (1.531) Observations 3641 3641 3641 3641 3641 R-squared 0.808 0.808 0.808 0.808 0.808 Robust standard errors in parentheses, *** p<0.01, ** p<0.05, * p<0.1

35
Table 11: All countries, decade panel, developing versus industrial countries, Winsorized at 100%, FINLIB is KSTOCK (1) (2) (3) (4) (5) (6) (7) COEFFICIENT GRVA GRVA GRVA GRVA GRVA GRVA GRVA SHARE -9.523** -9.558** -9.399** -9.395** -9.517** -9.505** -9.537** (3.84) (3.84) (3.83) (3.83) (3.83) (3.84) (3.84) EF_FD 0.0114 -0.0479 0.251 0.0796 0.0281 (0.20) (0.20) (0.24) (0.24) (0.23) EF_LIB 0.793*** 0.848*** 0.579** 0.521** 0.921*** 0.760*** 0.750*** (0.30) (0.28) (0.26) (0.27) (0.28) (0.25) (0.21) EF_LIB_AC -0.648** -0.648** (0.28) (0.28) EF_FD_DEV 0.108 0.191 1.075* 0.753 0.901 (0.45) (0.47) (0.64) (0.62) (0.59) EF_LIB_DEV -0.319 -0.547 -0.494 -0.376 -0.674 -0.269 -0.439 (0.86) (0.51) (0.35) (0.35) (0.45) (0.87) (0.51) EF_LIB_AC_DEV 0.161 0.140 (0.90) (0.92) EF_LIB_CC -0.890*** -0.983*** -0.884*** (0.29) (0.30) (0.30) EF_LIB_CC_DEV 0.436 0.684 0.431 (0.62) (0.54) (0.63) EF_FD_AC -0.514** (0.22) EF_FD_BC -0.141 -0.145 (0.21) (0.19) EF_FD_BC_DEV -0.876 -1.027* (0.58) (0.55) EF_FD_AC_DEV -0.926 (0.60) Constant -3.661*** -3.527*** -3.723*** -3.953*** -3.251** -2.213* -2.196* (1.29) (1.32) (1.26) (1.25) (1.29) (1.29) (1.29) Observations 3979 3979 3979 3979 3979 3979 3979 R-squared 0.81 0.81 0.81 0.81 0.81 0.81 0.81 EF_FD+EF_FD_DEV=0 0.06 0.08 4.04 1.64 2.22 Prob>F 0.80 0.78 0.09 0.20 0.54 EF_LIB+EF_LIB_DEV=0 0.32 0.40 0.05 0.24 0.38 0.33 0.40 Prob>F 0.57 0.42 0.76 0.62 0.52 0.57 0.43 EF_LIB_CR+EF_LIB_CR_DEV=0 0.32 0.64 0.32 0.63 Prob>F 0.57 0.53 0.57 0.53 EF_FD_CR+EF_FD_CR_DEV=0 6.06 3.20 4.71 Prob>F 0.01 0.07 0.14 Robust standard errors in parentheses, *** p<0.01, ** p<0.05, * p<0.1

36
Table 12: All countries, decade panel, high versus low financial development, Winsorized at 100%, FINLIB is KSTOCK (1) (2) (3) (4) (5) (6) (7) COEFFICIENT GRVA GRVA GRVA GRVA GRVA GRVA GRVA SHARE -9.485** -9.525** -9.348** -9.372** -9.523** -9.484** -9.538** (3.84) (3.84) (3.83) (3.83) (3.83) (3.84) (3.84) EF_FD -0.164 -0.297 0.726 0.303 0.225 (0.97) (0.98) (1.19) (1.02) (1.00) EF_LIB 0.113 0.216 0.225 0.250 0.229 0.0893 0.203 (0.62) (0.41) (0.31) (0.32) (0.40) (0.59) (0.39) EF_LIB_AC -0.161 0.160 (0.66) (0.65) EF_FD_HFD 0.195 0.267 -0.308 -0.0734 -0.133 (0.88) (0.88) (1.10) (0.92) (0.91) EF_LIB_ HFD 0.667 0.517 0.0833 0.0391 0.476 0.738 0.552 (0.68) (0.49) (0.39) (0.40) (0.47) (0.62) (0.41) EF_LIB_AC_ HFD -0.984 -0.985 (0.69) (0.69) EF_LIB_CC -0.0168 -0.0442 -0.0242 (0.50) (0.49) (0.50) EF_LIB_CC_ HFD -0.956* -0.945* -0.943* (0.54) (0.52) (0.54) EF_FD_AC -1.121 (1.08) EF_FD_BC -0.595 -1.022 (1.04) (1.03) EF_FD_BC_ HFD 0.296 0.760 (1.04) (1.04) EF_FD_AC_ HFD 0.527 (1.08) Constant -3.562*** -3.400** -3.555*** -3.915*** -3.165** -2.225* -2.228* (1.29) (1.33) (1.27) (1.27) (1.32) (1.29) (1.30) Observations 3979 3979 3979 3979 3979 3979 3979 R-squared 0.81 0.81 0.81 0.81 0.81 0.81 0.81 EF_FD+EF_FD_ HFD =0 0.02 0.02 2.36 0.75 0.14 Prob>F 0.89 0.83 0.13 0.39 0.71 EF_LIB+EF_LIB_ HFD V=0 7.16 7.37 1.81 1.53 7.33 9.87 10.84 Prob>F 0.00 0.00 0.18 0.22 0.00 0.00 0.00 EF_LIB_CR+EF_LIB_CR_HFD=0 7.78 10.4 11.2 7.68 10.37 Prob>F 0.00 0.00 0.00 0.00 0.00 EF_FD_CR+EF_FD_CR_HFD=0 7.48 2.047 2.01 Prob>F 0.00 0.153 0.16 Robust standard errors in parentheses, *** p<0.01, ** p<0.05, * p<0.1

37
Table 13: All countries, decade panel, Good versus bad policies, Winsorized at 100%, FINLIB is KSTOCK (1) (2) (3) (4) (5) (6) (7) COEFFICIENT GRVA GRVA GRVA GRVA GRVA GRVA GRVA SHARE -20.64*** -20.77*** -20.48*** -20.48*** -20.79*** -20.76*** -20.85*** (6.789) (6.790) (6.763) (6.764) (6.806) (6.782) (6.782) EF_FD 0.883 0.672 0.745 0.740 0.722 (0.654) (0.643) (0.640) (0.635) (0.652) EF_LIB 2.236 -2.104 -1.034* -1.123* -2.066 -1.905 -1.863 (5.734) (5.732) (0.595) (0.676) (5.744) (5.727) (5.725) EF_LIB_AC -3.490 -2.859 (5.768) (5.759) EF_FD_GP -0.338 -0.303 -0.309 -0.395 -0.426 (0.615) (0.598) (0.757) (0.776) (0.770) EF_LIB_GP 3.136 2.365 +0.889 +0.883 2.386 2.294 2.421 (5.757) (5.752) (0.860) (0.954) (5.780) (5.738) (5.733) EF_LIB_AC_GP -2.921 -2.681 (5.802) (5.805) EF_LIB_CC 3.176 3.259 2.729 (5.766) (5.772) (5.756) EF_LIB_CC_GP -3.634 -3.577 -3.574 (5.807) (5.820) (5.803) EF_FD_AC 0.300 (1.376) EF_FD_AC_GP -0.165 (1.309) EF_FD_BC 0.399 0.291 (1.332) (1.422) EF_FD_BC_GP -0.105 -0.0148 (1.334) (1.384) Constant 0.0120 -0.0136 -1.236 -1.241 -0.0241 1.772 -3.225** (2.276) (2.273) (2.296) (2.297) (2.279) (1.932) (1.305) Observations 975 975 975 975 975 975 975 R-squared 0.678 0.677 0.677 0.677 0.678 0.677 0.677 EF_FD+EF_FD_GP=0 1.28 0.59 0.58 0.311 0.219 Prob>F 0.26 0.44 0.79 0.579 0.618 EF_LIB+EF_LIB_GP=0 0.02 0.20 0.07 0.171 0.249 0.762 2.125 Prob>F 0.88 0.66 0.45 0.577 0.640 0.383 0.145 EF_LIB_CR+EF_LIB_CR_GP=0 0.51 0.27 0.105 0.044 1.08 Prob>F 0.48 0.60 0.747 0.835 0.298 EF_FD_CR+EF_FD_CR_GP=0 0.06 0.309 0.263 Prob>F 0.81 0.679 0.608 Robust standard errors in parentheses, *** p<0.01, ** p<0.05, * p<0.1

38
Tab 14: All countries, decade panel, Good versus bad accounting standards, Winsorized at 100%, FINLIB is KSTOCK (1) (2) (3) (4) (5) (6) (7) COEFFICIENT GRVA GRVA GRVA GRVA GRVA GRVA GRVA SHARE -15.17* -15.32** -15.27** -14.84* -15.67** -15.34** -15.49** (7.739) (7.743) (7.743) (7.764) (7.740) (7.748) (7.752) EF_FD -0.0858 -0.0428 0.0780 -0.111 -0.0198 (0.252) (0.254) (0.263) (0.261) (0.257) EF_LIB 0.284 0.326 0.0346 -0.0904 0.424 0.391 0.506 (0.341) (0.317) (0.280) (0.270) (0.313) (0.342) (0.334) EF_LIB_AC -0.400 -0.408 (0.323) (0.310) EF_FD_GAS -0.220 -0.361 0.857 -0.139 0.261 (0.316) (0.292) (0.699) (0.471) (0.496) EF_LIB_GAS 0.858* 0.863** 0.414 0.712* 0.600 0.747** 0.535* (0.439) (0.380) (0.385) (0.372) (0.393) (0.324) (0.293) EF_LIB_AC_GAS -0.349 -0.508 (0.477) (0.408) EF_LIB_CC -0.764* -0.918** -0.836* (0.425) (0.429) (0.437) EF_LIB_CC_GAS -0.0408 -0.0609 -0.0481 (0.456) (0.449) (0.468) EF_FD_AC -0.127 (0.291) EF_FD_AC_GAS -1.137** (0.579) EF_FD_BC 0.396 0.326 (0.300) (0.305) EF_FD_BC_GAS -0.630 -0.917** (0.442) (0.464) Constant 0.709 1.165 1.887 1.353 1.427 0.0292 1.040 (1.886) (1.527) (2.165) (1.858) (2.245) (1.773) (1.853) Observations 2020 2020 2020 2020 2020 2020 2020 R-squared 0.705 0.705 0.705 0.704 0.705 0.704 0.704 EF_FD+EF_FD_GAS=0 1.49 3.66 1.82 0.40 0.25 Prob>F 0.22 0.06 0.18 0.53 0.62 EF_LIB+EF_LIB_GAS=0 7.50 9.07 1.59 2.92 7.10 9.45 8.83 Prob>F 0.00 0.00 0.21 0.09 0.00 0.00 0.00 EF_LIB_CR+EF_LIB_CR_GAS=0 3.85 5.45 7.52 8.28 6.36 Prob>F 0.05 0.02 0.01 0.00 0.00 EF_FD_CR+EF_FD_CR_GAS=0 5.13 0.47 2.58 Prob>F 0.02 0.53 0.11 Robust standard errors in parentheses, *** p<0.01, ** p<0.05, * p<0.1

39
Tab 15: All countries, decade panel, high versus low rule of law, Winsorized at 100%, FINLIB is KSTOCK (1) (2) (3) (4) (5) (6) (7) COEFFICIENT GRVA GRVA GRVA GRVA GRVA GRVA GRVA SHARE -12.72*** -12.6*** -12.62*** -12.56*** -12.63*** -12.8*** -12.6*** (4.170) (4.174) (4.166) (4.162) (4.177) (4.177) (4.180) EF_FD -0.485 -0.366 -3.187 -1.399 -1.335 (0.441) (0.446) (3.142) (1.434) (1.445) I_EF_LIB 2.306 0.600 0.145 0.076 0.602 2.338 0.582 (2.329) (1.078) (0.464) (0.482) (1.045) (2.323) (1.077) I_EF_LIB_AC -2.343 -2.265 (2.355) (2.353) EF_FD_HRL 0.509 0.419 3.494 1.521 1.481 (0.422) (0.427) (3.114) (1.408) (1.418) EF_LIB_HRL 3.011 -0.0408 0.476 0.403 -0.0564 3.131 0.0635 (2.344) (1.108) (0.498) (0.517) (1.074) (2.332) (1.094) EF_LIB_AC_HRL -3.022 -2.949 (2.370) (2.368) EF_LIB_CC -0.946 -0.937 -1.039 (1.131) (1.110) (1.131) EF_LIB_CC_HRL 0.305 0.265 0.396 (1.186) (1.169) (1.186) EF_FD_AC 2.822 (3.106) EF_FD_AC_HRL -3.401 (3.102) EF_FD_BC 1.020 1.039 (1.407) (1.417) EF_FD_BC_HRL -1.263 -1.325 (1.420) (1.430) Constant -0.754 -0.899 -0.747 -1.000 -0.666 -2.284* -2.274* (1.605) (1.601) (1.581) (1.586) (1.609) (1.322) (1.314) Observations 3886 3886 3886 3886 3886 3886 3886 R-squared 0.818 0.818 0.818 0.818 0.818 0.818 0.818 EF_FD+EF_FD_HRL=0 0.01 0.06 1.48 0.27 0.37 Prob>F 0.91 0.80 0.22 0.61 0.54 EF_LIB+EF_LIB_HRL=0 6.05 4.89 2.42 2.35 4.76 9.22 8.30 Prob>F 0.01 0.03 0.12 0.13 0.02 0.00 0.00 EF_LIB_CR+EF_LIB_CR_HRL=0 5.90 4.86 5.24 5.96 4.87 Prob>F 0.02 0.03 0.02 0.01 0.03 EF_FD_CR+EF_FD_CR_HRL=0 7.12 1.39 2.13 Prob>F 0.01 0.24 0.14 Robust standard errors in parentheses, *** p<0.01, ** p<0.05, * p<0.1

40
Tab 16: All countries, decade panel, high versus low creditor rights, Winsorized at 100%, FINLIB is KSTOCK (1) (2) (3) (4) (5) (6) (7) COEFFICIENT GRVA GRVA GRVA GRVA GRVA GRVA GRVA SHARE -14.4*** -14.3*** -14.3*** -14.3*** -14.3*** -14.4*** -14.3*** (4.652) (4.661) (4.646) (4.642) (4.664) (4.657) (4.664) EF_FD -0.132 -0.128 0.0311 -0.240 -0.228 (0.236) (0.233) (0.316) (0.284) (0.279) EF_LIB 0.420 0.425 0.324 0.342 0.432 0.393 0.378 (0.312) (0.270) (0.216) (0.220) (0.273) (0.300) (0.245) EF_LIB_AC -0.194 -0.199 (0.346) (0.341) EF_FD_GCR 0.001 0.093 0.643 0.718* 0.538 (0.309) (0.316) (0.429) (0.394) (0.382) EF_LIB_GCR 0.757 0.454 -0.226 -0.323 0.210 0.680 0.508 (0.562) (0.496) (0.390) (0.407) (0.483) (0.436) (0.343) EF_LIB_AC_GCR -1.032* -0.983* (0.528) (0.520) EF_LIB_CC -0.291 -0.307 -0.284 (0.342) (0.355) (0.342) EF_LIB_CC_GCR -0.970** -0.824* -0.973** (0.482) (0.467) (0.479) EF_FD_AC -0.218 (0.297) EF_FD_AC_GCR -0.637 (0.417) EF_FD_BC 0.298 0.233 (0.279) (0.278) EF_FD_BC_GCR -0.974** -0.768** (0.411) (0.380) Constant -0.869 -0.947 -0.943 -1.144 -0.817 -2.547** -2.558** (1.595) (1.613) (1.590) (1.579) (1.612) (1.277) (1.278) Observations 3605 3605 3605 3605 3605 3605 3605 R-squared 0.826 0.826 0.826 0.825 0.826 0.826 0.826 EF_FD+EF_FD_GCR=0 0.25 0.01 3.10 1.81 0.86 Prob>F 0.63 0.90 0.77 0.18 0.36 EF_LIB+EF_LIB_GCR=0 5.74 4.14 0.08 0.00 2.43 7.71 8.08 Prob>F 0.02 0.04 0.08 0.96 0.12 0.00 0.00 EF_LIB_CR+EF_LIB_CR_GCR=0 7.47 9.94 9.75 7.38 10.3 Prob>F 0.01 0.00 0.00 0.01 0.00 EF_FD_CR+EF_FD_CR_GCR=0 6.37 4.32 3.69 0.01 0.04 0.05 Robust standard errors in parentheses, *** p<0.01, ** p<0.05, * p<0.1

41
Table A1: Variables sources and definitions Variable Description Source GRVA Real value added growth in industry i, country, c, decade
d. Real value added is computed by deflating value added data by the CPI index
UNIDO Industrial Statistics Database, 2006 (INDSTAT 2006); CPI data from International Finance Statistics, IMF
INITSHARE Share of sector�s value added in total manufacturing value-added of the country in the start year of sample
INDSTAT 2006
EFD External Finance Dependence Rajan-Zingales (1998); Worldscope Database
FD Financial Development measured as ratio of private credit to GDP
International Finance Statistics, IMF
LIB de facto Capital Stock Lane and Miles-Feretti database LIB de jure Capital Account Openness Chinn-Ito Database CC Currency Crisis dummy Glick-Hutchison database BC Banking Crisis dummy Laeven-Honohan database AC All Crisis dummy From currency and banking crises
database