Embed Size (px)
Citation preview

Occasional Paper No. 11March 1999
Economics DepartmentMonetary Authority of Singapore
Capital Account and Exchange RateManagement in a Surplus Economy:
The Case of Singapore


CAPITAL ACCOUNT AND EXCHANGE RATEMANAGEMENT IN A SURPLUS ECONOMY:
THE CASE OF SINGAPORE
BY
FINANCIAL & SPECIAL STUDIES DIVISION*ECONOMICS DEPARTMENT
MONETARY AUTHORITY OF SINGAPORE
MARCH 1999
Paper prepared for the Thirteenth Pacific Basin Central Bank Conference in LosCabos, Mexico, 7-11 November 1998
* THE VIEWS IN THIS PAPER ARE SOLELY THOSE OF THE STAFF OF THEFINANCIAL & SPECIAL STUDIES DIVISION, AND SHOULD NOT BEATTRIBUTED TO THE MONETARY AUTHORITY OF SINGAPORE
THE MONETARY AUTHORITY OF SINGAPORE
JEL CLASSIFICATION NUMBER: E42, E52, F32, G18

CAPITAL ACCOUNT AND EXCHANGE RATEMANAGEMENT IN A SURPLUS ECONOMY:
THE CASE OF SINGAPORE
Page
EXECUTIVE SUMMARY i-iii
I. INTRODUCTION 1
II. OPENNESS OF THE SINGAPORE ECONOMY 2
III. STRUCTURE OF CAPITAL ACCOUNT AND PERSISTENCE OFCAPITAL FLOWS
6
IV. SURPLUS SAVING, CAPITAL OUTFLOWS AND THE "INTERESTRATE ISLAND" PHENOMENON
13
V. CAPITAL FLOWS AND MONETARY AUTONOMY 23
VI. SUMMARY AND CONCLUSION 27
Figure 1 : Deviations from Covered Interest Parity, Dec 88 - Sep 98 4Figure 2 : Autocorrelations of Net Capital Flows, 1986Q1 - 1998Q4 10Figure 3 : Nominal Singapore and US Interest Rates (1-month) 13Figure 4 : Nominal Effective Exchange Rate of the Singapore Dollar 17Figure 5 : Public Sector Budget Balance and Private Sector
Savings-Investment Balance, 1980-199717
Figure 6 : Changes in Monetary Base and its Components 19
Table 1 : Selected Components of the Balance of Payments, 1988-1997 (Millions of S$)
6
Table 2 : Summary Statistics on Components of Capital and Financial Account Balance, 1986Q1 - 1998Q2
8
Table 3 : Variance Ratios of Quarterly Capital Flows 11Table 4 : Balances of the Central Provident Fund (Millions of S$) 18Table 5 : Decomposition of the Variance of the Nominal Interest
Rate Differential21
Table 6 : Estimates of Capital Flow Equation 25
Appendix: A Portfolio Balance Model Of Capital Flows 28
References 31

MAS Occasional Paper No. 11, Mar 99
Economics Department, Monetary Authority of Singapore
i
EXECUTIVE SUMMARY
1 In contrast to countries which import capital to finance their
current account deficits, Singapore has had a growing current account
surplus, and has been exporting capital abroad. As a result, the domestic
interest rate has been generally lower than international interest rates. This
paper analyses the relationship between the openness of Singapore’s
financial markets, its position as a net capital exporter, and the structure of
its capital account, and draws implications for the conduct of exchange rate
policy and the exercise of monetary autonomy.
2 Underpinned by the absence of formal trade barriers and
exchange controls, Singapore is highly open to trade and investment, and is
also an international financial centre. In the absence of exchange
restrictions, covered interest arbitrage eliminates risk-free differences
between the returns on Singapore Dollar and foreign currency assets.
Indeed, if we allow for transaction costs, covered interest parity is found to
hold on average during the period from December 1988 to September 1998.
3 To determine the structure of Singapore’s capital account, we
examine each of its components, and categorise them into ‘hot’ (volatile and
easily reversible) or ‘cold’ flows. In the fifth edition of the IMF’s Balance of
Payments Manual, the overall capital account is labelled the capital and
financial account balance. Under this are the capital and financial accounts.
The capital account balance is the net sum of capital transfers and the
acquisition and disposal of non-produced and non-financial assets, while the
financial account balance is the net sum of net foreign direct investment, net
portfolio investment and net other investment flows.
4 To categorise capital flows into ‘hot’ or ‘cold’, we examine their
persistence and reversability characteristics by calculating autocorrelations
for quarterly flows between 1986Q1 and 1998Q2. Large and positive
autocorrelations for several quarterly lags indicate that capital account and
net portfolio flows show signs of persistence. One reason for the

MAS Occasional Paper No. 11, Mar 99
Economics Department, Monetary Authority of Singapore
ii
persistence of portfolio flows is that a substantial proportion of these flows
represent long-term investments by both public and private entities abroad.
The autocorrelations for net foreign direct investment flows suggest a
transitory series, contradicting the notion that direct investment is not easily
reversible. However, in Singapore, where the volume of outward direct
investment is also large, the timing of the outward flows may tend to offset
the relatively stable inward flows such that, on a net basis, the overall series
appears to lack persistence. Alternating autocorrelations for other
investment flows point to the quick reversal of fund flows in and out of the
banking system.
5 The coexistence of excess domestic saving over investment,
net capital outflow and lower domestic interest rates relative to international
rates in Singapore contrasts with the situation in the majority of East Asian
and Latin American countries in the first half of the 1990s. The gap between
the domestic interbank rate and the US$ SIBOR rate widened substantially
since 1994 until the onset of the Asian currency crisis in July 1997. This
coincided with the acceleration in efforts to increase portfolio and direct
investments abroad since 1993.
6 The differential between the domestic interbank rate and the
US$ SIBOR rate may be thought of as due to two factors – an exchange rate
risk premium and expected appreciation of the Singapore Dollar. Through
formal testing, we find that the data suggests the presence of a time-varying
risk premium on foreign currency-denominated assets. This implies that the
expected returns on foreign currency-denominated assets must be higher
than those on Singapore Dollar-denominated assets in order to encourage
residents to channel their savings into an increasing stock of net foreign
assets.
7 The other source of the relatively low domestic interest rates is
the expected appreciation of the Singapore Dollar. The trend appreciation of
the currency stems from the high savings by both the public and private
sectors. Much of the public sector surplus is held by the MAS, while a

MAS Occasional Paper No. 11, Mar 99
Economics Department, Monetary Authority of Singapore
iii
substantial proportion of private sector savings is held in the form of CPF
contributions, over 90% of which is typically placed as advanced deposits
with the MAS for the purchase of future issues of government bonds. This
causes a contraction in the monetary base, thus providing a basis for the
appreciation of the Singapore Dollar. The MAS offsets the contractionary
effect of the public sector deposit placement by intervening in the foreign
exchange market to sell the Singapore Dollar for the US Dollar. The extent
to which this is done is determined by the targeted level of the trade-
weighted nominal effective exchange rate.
8 The expected appreciation of the Singapore dollar dominates
the exchange rate risk premium in explaining the interest rate differential
between nominal Singapore and US Dollar interbank offer rates. We find
that, on average, the mean and variance of the expected change in the spot
exchange rate were larger than the mean and variance of the exchange rate
risk premium.
9 Finally, we analyse the extent to which the MAS can influence
domestic liquidity conditions without compromising its exchange rate target.
This is thought to be virtually impossible. We find that capital flows move to
entirely offset any changes in net domestic assets of the MAS within one
quarter. This is consistent with earlier findings of perfect capital mobility and
a relatively small risk premium underlying the interest rate differential. A
relatively small risk premium implies that domestic and foreign currency
assets are fairly close substitutes.

MAS Occasional Paper No. 11, Mar 99
Economics Department, Monetary Authority of Singapore
1
1 INTRODUCTION
1.1 The Mexican Peso crisis of 1994-95, as well as the recent East
Asian financial crises, have highlighted the vulnerability of the recipient
countries to the volatility and sharp reversal of international portfolio flows.
Most of the capital-importing countries have used the capital inflows to
finance their current account deficit. The inflows of these portfolio capital
flows have also complicated the management of monetary policy in these
countries.
1.2 The case of Singapore is somewhat different. The Singapore
economy has experienced a growing current account surplus, and has been
exporting capital abroad; and the domestic interest rate is generally lower
than international interest rates. In this paper, we analyse the relationship
between the openness of the Singapore financial market, its position as a
net capital exporter, and the structure of the capital account of the balance of
payments. The implications of these features of the economy on the
conduct of exchange rate policy and the exercise of monetary autonomy are
also evaluated.

MAS Occasional Paper No. 11, Mar 99
Economics Department, Monetary Authority of Singapore
2
II OPENNESS OF THE SINGAPORE ECONOMY
2.1 Singapore has an economy that is highly open to trade and
investment. The total value of international trade, exports plus imports, is
almost three times the size of the nominal GDP. Investment in the
manufacturing sector, which constitutes around 27% of the economic value-
added, is dominated by foreign investors. Foreign investment commitment
accounts for about 75% of the total investment commitment in the sector.
2.2 Singapore is also an international financial centre which has an
active offshore Asian Dollar Market and an Asian Dollar Bond Market. In the
former, financial institutions are engaged in non-Singapore Dollar
intermediation of deposits and loans, mainly at the shorter end of the
maturity structure. The Asian Dollar Bond Market is centred around the
raising of medium- to long-term non-Singapore Dollar funds.
2.3 Underpinning the openness to international trade and
investment is the absence of formal trade barriers and exchange controls.
With the exception of a few items, no import duties are levied; and there is
no import licensing. Similarly, export licences are required only for a handful
of items, and there are no restrictions on the utilisation of export proceeds.
2.4 Residents are allowed to borrow, lend and invest freely in
foreign currencies. Banks in Singapore that are licensed to deal in Asian
Currency Units can freely accept deposits in foreign currencies. Residents
may deal freely in spot and forward foreign exchange transactions. Non-
residents are freely allowed to make direct and portfolio investments in the
country.
2.5 There are, however, restrictions placed on banks in providing
Singapore Dollar credit facilities to non-residents for purposes of financing
economic activities outside of Singapore. The Monetary Authority of
Singapore (MAS), however, would consider an application if the credit facility
is for the purpose of funding overseas projects where there is substantive

MAS Occasional Paper No. 11, Mar 99
Economics Department, Monetary Authority of Singapore
3
Singapore equity interest or where there is management control by
Singaporeans. There is no restriction on the provision of credit facilities up
to S$5 million to non-residents for the purposes of acquiring financial assets
and investing in Singapore. For residents, there is no restriction in securing
Singapore Dollar credit facilities for the purposes of financing economic
activities within or outside Singapore.
2.6 The absence of exchange controls has enabled the onshore
financial market to be fully integrated with the international market. Free
movement of financial capital, through covered interest arbitrage, has
eliminated any risk-free differences between the expected returns on
Singapore Dollar-denominated assets and nominal foreign currency assets.
2.7 Covered interest parity (CIP) holds when the nominal domestic
interest rate equals the foreign interest rate on an asset of similar default risk
and identical maturity structure plus the forward discount:
it = it* + fdt (1)
where i and i* are the domestic and foreign nominal interest rate
respectively. fdt is the forward discount, expressed as a percentage of the
spot rate, i.e. t
tt
e
ef −, where e is the spot exchange rate, defined as the
number of units of local currency per unit of foreign currency, and f is the
forward exchange rate.
2.8 We define the deviation from CIP as:
ηt = it - it* - fdt (2)
Figure 1 shows the plot of the monthly deviations from CIP, which is
calculated from the one-month Singapore Dollar domestic interbank rate and
the US Dollar SIBOR rate. The observations are end-of-month quotations.
The sample begins at December 1988 and ends at September 1998.

MAS Occasional Paper No. 11, Mar 99
Economics Department, Monetary Authority of Singapore
4
2.9 Figure 1 indicates that the deviations from CIP are generally
negative, with a mean monthly deviation of -0.1010 of a percent. We
therefore reject the null hypothesis of a zero mean at the marginal
significance level of 0.00. As later analysis will show, this deviation from CIP
is attributed mainly to the fact that we have not taken into consideration the
presence of transaction costs. It should be noted that the deviations
narrowed over time from the early 1990s until the onset of the East Asian
currency crises in July 1997. The greater volatility of the exchange rate
following the East Asian currency crises has given rise to wider bid-ask
spreads, consequently causing larger deviations from CIP. It has also been
widely observed in the past that periods of turbulence in the currency
markets, by raising the transaction costs of arbitraging, had given rise to
larger deviations [Frenkel and Levich (1977); Taylor (1988)].
Figure1Deviations from Covered Interest Parity, Dec 88 – Sep 98
-0.8
-0.6
-0.4
-0.2
0.0
0.2
0.4
0.6
0.8
1.0
1.2
D M J S D M J S D M J S D M J S D M J S D M J S D M J S D M J S D M J S D M J S
1 9 8 8 1 9 8 9 1 9 9 0 1 9 9 1 1 9 9 2 1 9 9 3 1 9 9 4 1 9 9 5 1 9 9 81 9 9 71 9 9 6

MAS Occasional Paper No. 11, Mar 99
Economics Department, Monetary Authority of Singapore
5
2.10 We formally tested the hypothesis that, subject to the cost of
arbitraging, CIP holds on average, by estimating the equation:
fdt = α + β (it - it*) + ut (3)
and testing that β = 1. Equation (3) is estimated by OLS using the Newey-
West (1987) procedure to obtain consistent estimates of the standard error
in the presence of serial correlation in the residuals:
fdt = 0.1290 + 1.1720 (it - it*)
(5.111) (10.214)
R 2 = 0.279, LM (2) = 6.032
The significance of the constant term indicates the presence of transaction
costs. The test of the null hypothesis that the coefficient of the interest rate
differential is not significantly different from one can be rejected at the
marginal significance level of 0.1338.
2.11 Our analysis therefore suggests that the existing regulatory
framework with regard to capital movements has allowed arbitrage activities
to take place to the extent that CIP holds, after allowing for transaction costs.

MAS Occasional Paper No. 11, Mar 99
Economics Department, Monetary Authority of Singapore
6
III STRUCTURE OF CAPITAL ACCOUNT AND PERSISTENCEOF CAPITAL FLOWS
3.1 In an economy with a persistent current account surplus, net
capital outflows reflect the acquisition of foreign currency-denominated
assets abroad by residents. In line with the position of the country as a net
exporter of capital, the capital account of Singapore (including errors and
omissions between 1988 and 1992) has largely been in deficit since 1988.
Underpinning the export of capital was the growing current account surplus,
which rose from an average of 9% of nominal GDP during 1988-93 to an
average of 16% of nominal GDP for the period 1994-97 (see Table 1).
Table 1Selected Components of the Balance of Payments, 1988-1997
(Millions of S$)
CurrentAccountBalance
CapitalAccount
(net)
DirectInvestment
(net)
PortfolioInvestment
(net)
OtherInvestment
(net)
Changein NetOfficial
Reserves
1988 3,898.8 -110.6 7,118.5 -589.6 -4,541.3 -3,343.6
1989 5,779.9 -79.7 3,909.1 -147.4 -1,323.2 -5,334.2
1990 5,652.5 -39.6 6,418.1 -1,880.4 2,617.1 -9,892.5
1991 8,495.5 -58.5 7,534.3 -1,566.9 -1,915.5 -7,262.8
1992 9,704.8 -61.8 1,445.5 4,055.8 -2,580.4 -9,959.0
1993 6,902.8 -115.3 4,095.1 -8,023.9 1,970.5 -12,153.7
1994 17,493.2 -128.5 6,659.3 -15,269.4 -9,245.5 -7,301.7
1995 20,335.2 -101.0 4,179.2 -11,630.9 6,525.4 -12,173.9
1996 20,760.2 -195.6 4,650.9 -12,144.8 4,056.3 -10,406.6
1997 21,979.5 -257.1 6,921.0 -16,138.9 2,483.1 -11,855.7
Source: Department of Statistics, “Implementation of IMF Balance of Payments Manual, FifthEdition in Singapore Balance of Payments” (April 1998)
3.2 In the official Balance of Payments recording, the overall
capital account is labelled as “Capital and Financial Account Balance”
(CFAB), which consists of the Capital Account Balance (CAB) and the
Financial Account Balance (FAB). The CAB consists of capital transfers
(which include migrants’ transfers, debt forgiveness, etc.) and the acquisition

MAS Occasional Paper No. 11, Mar 99
Economics Department, Monetary Authority of Singapore
7
and disposal of non-produced and non-financial assets (e.g. patents and
copyrights). Under the FAB are the net direct foreign investment (FDI), net
portfolio investment (PI), as well as net other investment (OTHI), which
represents financial flows intermediated through the banking system (e.g.
trade credit, loans and advances, currency and deposits).
3.3 CAB has consistently registered a negative balance, and its
contribution to the overall capital account is rather small, averaging around
4.2% of the transactions in the period 1986Q1 to 1998Q2. The deficit in the
overall CFAB has been mainly attributed to the large outflows of net portfolio
investment. Portfolio investment has consistently registered a net outflow
(with the exception of 1992), with the size of the outflows rising substantially
since 1993. The dominant form of portfolio outflows was net purchases by
residents, including the government, of overseas equities and to a smaller
extent, debt securities. FDI, on the other hand, has continued to remain
positive despite the surge in outward direct investment by Singapore-based
companies since 1993. Between 1988-97, the inflow of FDI rose from S$7.4
billion to S$12.8 billion, while outward direct investment increased from
S$0.2 billion to S$5.9 billion.1
3.4 OTHI balances, while much more volatile, have since 1995
recorded a net inflow. The net inflow of funds into the domestic banking
sector can be attributed to the onshore banks borrowing from the Asian
Dollar Market to fund their lending activities. In addition, foreign banks
operating in the domestic banking sector have been bringing in funds to
meet the enhanced net head office capital requirement.
3.5 As a first step in determining how far each of these capital
flows can be considered ‘hot’ or ‘cold’ on the basis of its time series
properties, we present in Table 2 the summary statistics of the quarterly
capital account flows. From the computed coefficient of variation, CAB and
1 Department of Statistics, “Implementation of IMF Balance of Payments Manual, Fifth
Edition in Singapore’s Balance of Payments” (April 1988)

MAS Occasional Paper No. 11, Mar 99
Economics Department, Monetary Authority of Singapore
8
FDI flows are less volatile than PI and OTHI flows. This observation is
consistent with the expectation that capital transfers and direct foreign
investment flows show a more stable pattern than transactions in the capital
market and banking system.
Table 2Summary Statistics on Components of
Capital and Financial Account Balance, 1986Q1 - 1998Q2
Mean(millionsof S$)
StandardDeviation(millionsof S$)
Coefficientof Variation
(%)
Average Sharein Capital and
FinancialAccount (%)
Capital and FinancialAccount (net)
-752.0 3861.7 513 100.0
Capital Account -31.3 21.6 69 4.2
Direct Foreign Investment 1283.1 598.8 47 -170.6
Portfolio Investment -1394.3 1719.3 123 185.4
Other Investment -609.6 3317.2 544 81.1
3.6 However, a closer characterisation of capital flows into ‘hot’ or
‘cold’ would require an examination of the persistence and reversability
characteristics of the flow [Claessens, Dooley and Warner (1995)]. For this
purpose, we calculated the autocorrelations for each type of capital account
transaction. A ‘cold’ capital flow would be characterised by a series of large
and positive autocorrelations. On the other hand, a ‘hot’ money flow is one
that is subject to quick reversability, and therefore, its autocorrelations would
show alternating signs.
3.7 Figure 2 displays the quarterly autocorrelations for each type of
capital flows calculated over the entire sample 1986Q1 to 1998Q2. The
autocorrelations for the overall capital and financial account balance (CFAB)
indicate that quarterly flows have a high transitory and mean-reverting
component, where significant positive autocorrelations are followed by
negative autocorrelations. The autocorrelations of the individual
components indicate that CAB and PI flows show signs of persistence. In

MAS Occasional Paper No. 11, Mar 99
Economics Department, Monetary Authority of Singapore
9
each of these flows, the initial large positive autocorrelation is followed by
subsequent positive autocorrelations for several quarterly lags. In fact, the
Augmented Dickey-Fuller test indicates the presence of unit roots in these
series. The persistence in the autocorrelations for the portfolio investment
series seems to contradict the general notion that portfolio capital flows are
essentially ‘hot’ money. One reason for the persistence of portfolio capital
outflows is that a substantial amount of these flows actually represent long-
term investment by private as well as government entities in companies
abroad. Under the Fifth Edition of the Balance of Payments Manual, any
acquisition of equity interest in overseas companies that is less than 10% of
the share capital is regarded as foreign portfolio investment.
3.8 The autocorrelations of the net FDI flows, on the other hand,
suggest a transitory series. The lack of persistence in the series appears to
contradict the notion that direct investment is not easily reversible. However,
in the context of the Singapore economy, where the volume of outward direct
investment is also large, the timing of the outward flows may tend to offset
the relatively stable inward direct investment flows such that, on a net basis,
the overall series appears to lack persistence. The alternating sign of the
autocorrelations of the OTHI flows indicate the quick reversal of fund flows in
and out of the banking system. As will be shown in Section V, this form of
financial flows are sensitive to changes in interest rates and exchange rate
expectations.

MAS Occasional Paper No. 11, Mar 99
Economics Department, Monetary Authority of Singapore
10
Figure 2Autocorrelations of Net Capital Flows, 1986Q1 - 1998Q4
Capital and Financial Account Capital Account(net)
autocorrelation autocorrelation
-0.2
-0.1
0.0
0.1
0.2
0.3
0.4
1 3 5 7 9 11 13 15 17 19 21 23
-0.4
-0.2
0.0
0.2
0.4
0.6
0.8
1 3 5 7 9 11 13 15 17 19 21 23
lag (quarters) lag (quarters)
Direct Foreign Investment Portfolio Investmentautocorrelation autocorrelation
-0.5
-0.4
-0.3
-0.2
-0.1
0.0
0.1
0.2
0.3
0.4
0.5
1 3 5 7 9 11 13 15 17 19 21 23
-0.4
-0.2
0.0
0.2
0.4
0.6
0.8
1.0
1 3 5 7 9 11 13 15 17 19 21 23
lag (quarters) lag (quarters)
Other Investmentautocorrelation
-0.4
-0.3
-0.2
-0.1
0.0
0.1
0.2
0.3
1 3 5 7 9 11 13 15 17 19 21 23
lag (quarters)

MAS Occasional Paper No. 11, Mar 99
Economics Department, Monetary Authority of Singapore
11
3.9 We employ the variance ratio test [Cochrane (1988); Campbell
and Mankiw (1989)] to provide a summary measure on the degree of
persistence as well as to estimate the contribution of the permanent (random
walk) component to the variance of the changes in each of the capital flows
series. The variance ratio is written as:
Vk = 1 + 2 ∑=
k
j 1
)1
1(+
−k
j ρj (4)
where ρj is the j-th autocorrelation of the change in the variable. For a
random walk series, Vk is unity for all k, while for a stationary series, the ratio
approaches zero for large k. In our estimates of the variance ratios
presented in Table 3, k is set to 24.
Table 3Variance Ratios of Quarterly Capital Flows
Vk S.E.(Vk)
Capital and Financial Account Balance (net) 0.119 0.098
Capital Account 0.694 0.572
Direct Foreign Investment 0.067 0.055
Portfolio Investment 0.119 0.098
Other Investment 0.107 0.088
Note: S.E.(Vk) is the asymptotic standard error of the ratio, computed as V k/ )1/((4
3+kT .
3.10 The variance ratios presented in Table 3 indicate that the CAB
shows the most persistence characteristics, with the random walk
component accounting for around 70% of the variance of the series,
although the large estimated asymptotic error makes it not possible to
estimate the permanent component precisely. For the rest of the capital
flows series, the permanent component is quite small. This is despite the
fact that the PI series was found to have a unit root. However, the random
walk component in the series may taper off after several lags and is likely to

MAS Occasional Paper No. 11, Mar 99
Economics Department, Monetary Authority of Singapore
12
be offset by the stationary component.2 Our findings on the lack of
persistence, on the basis of the variance ratio statistics for both the ‘hot’ and
‘cold’ net capital flows, is consistent with the findings of Claessens, Dooley
and Warner (1995) on the persistence characteristics of capital flows of
several countries. They determined the degree of persistence on the basis
of the half-lives of the estimated impulse response functions.3
2 The Dickey-Fuller unit root test has been found to have low power against the local
alternatives (near unit roots), and as such it may not be able to distinguish between asmall and a large random walk component. As Ardeni and Lubian (1989) haveshown, when the first-order autocorrelation coefficient is 0.8, the power of the Dickey-Fuller and the Augmented Dickey-Fuller tests are 59.2% and 30.9% respectively. Onthe other hand, the variance ratio test rejects the unit root hypothesis 73.4% of thetime.
3 Campbell and Mankiw (1989) discussed the relationship between the impulseresponse function measure of persistence with that of the variance ratio.

MAS Occasional Paper No. 11, Mar 99
Economics Department, Monetary Authority of Singapore
13
IV SURPLUS SAVING, CAPITAL OUTFLOWS ANDTHE "INTEREST RATE ISLAND" PHENOMENON
4.1 In the previous section, we have seen that since 1988, there
has been a net capital outflow from Singapore, representing efforts by
resident entities to acquire foreign currency-denominated assets in the face
of rising domestic savings surpluses. At the same time, as shown in Figure
3, the domestic interbank rate in Singapore remained largely below the US
Dollar SIBOR rate until the onset of the East Asian currency crises in July
1997.
Figure 3Nominal Singapore and US Interest Rates (1-month)
0
2
4
6
8
10
12
1988Jan
1989Jan
1990Jan
1991Jan
1992Jan
1993Jan
1994Jan
1995Jan
1996Jan
1997Jan
1998Jan
annu
alis
ed p
erce
ntag
es
US$ SIBOR S ingapore Interbank
4.2 The coexistence of excess domestic saving over investment,
net capital outflow, and the lower domestic interest rate relative to
international interest rates contrasts with the situation in the majority of the
countries in East Asia and Latin America during the first-half of the 1990s
[Glick (1998); Calvo, Leiderman, and Reinhart (1995)]. These countries
experienced massive capital inflows which were used to finance the rising
current account deficit. The excess capital inflows were channeled into the
accumulation of foreign exchange reserves as monetary authorities in these
countries tried to moderate the upward pressure on their currencies. In
order to limit the monetary consequences of their exchange market
MAS Occasional Paper No. 11, Mar 99
Economics Department, Monetary Authority of Singapore
14
intervention, the central banks resorted to considerable sterilisation
operations [Frankel and Okongwu (1995); Kletzer and Spiegal (1998)]. As a
result of the sterilisation efforts and rising currency risk premiums on the
local currencies, the interest rates in some of these countries rose well
above the international interest rate [Frankel and Okongwu (1995)].4
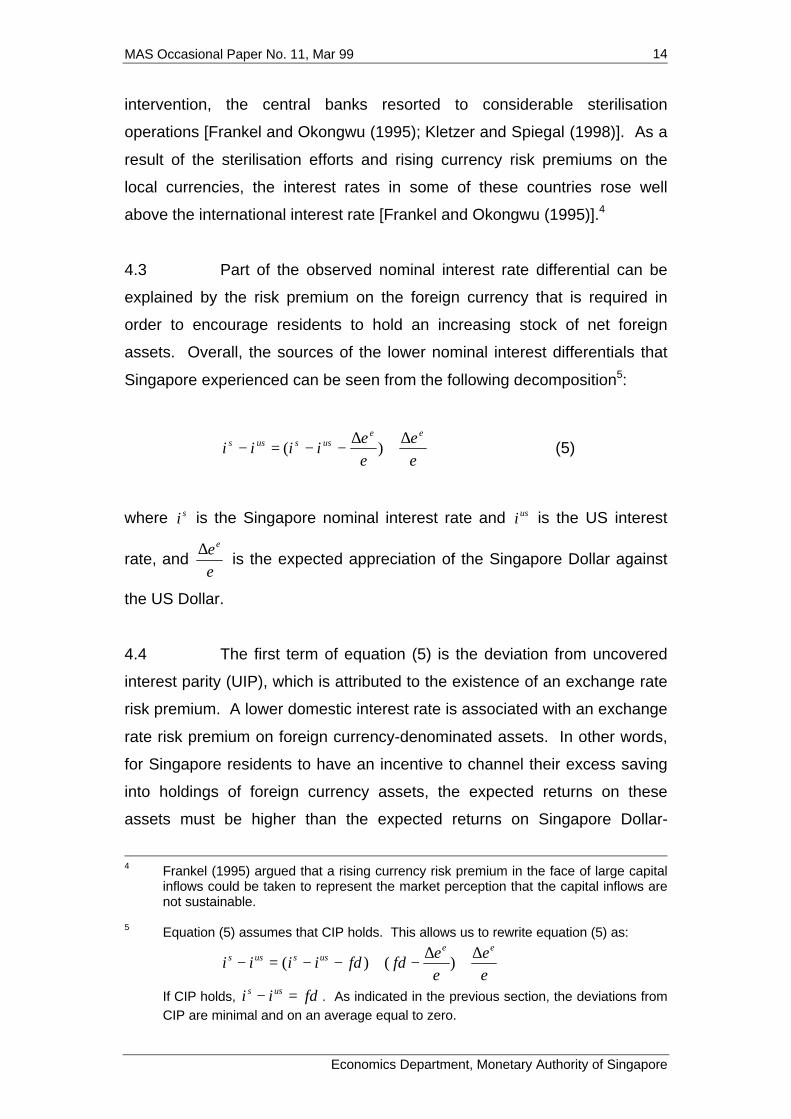
4.3 Part of the observed nominal interest rate differential can be
explained by the risk premium on the foreign currency that is required in
order to encourage residents to hold an increasing stock of net foreign
assets. Overall, the sources of the lower nominal interest differentials that
Singapore experienced can be seen from the following decomposition5:
e
e
e
eiiii
eeussuss ∆
+∆
−−=− )( (5)
where si is the Singapore nominal interest rate and usi is the US interest
rate, and e
ee∆ is the expected appreciation of the Singapore Dollar against
the US Dollar.
4.4 The first term of equation (5) is the deviation from uncovered
interest parity (UIP), which is attributed to the existence of an exchange rate
risk premium. A lower domestic interest rate is associated with an exchange
rate risk premium on foreign currency-denominated assets. In other words,
for Singapore residents to have an incentive to channel their excess saving
into holdings of foreign currency assets, the expected returns on these
assets must be higher than the expected returns on Singapore Dollar-
4 Frankel (1995) argued that a rising currency risk premium in the face of large capital
inflows could be taken to represent the market perception that the capital inflows arenot sustainable.
5 Equation (5) assumes that CIP holds. This allows us to rewrite equation (5) as:
e
e
e
efdfdiiii
eeussuss ∆
+∆
−+−−=− )()(
If CIP holds, fdii uss =− . As indicated in the previous section, the deviations fromCIP are minimal and on an average equal to zero.

MAS Occasional Paper No. 11, Mar 99
Economics Department, Monetary Authority of Singapore
15
denominated assets as implied by the UIP. Since the deviation from the UIP
reflects exchange rate risk, it cannot be arbitraged away unless the risk-
return preferences change. Figure 3 shows that the gap between the US
interest rate and the local rate widened substantially since 1994 until the
onset of the Asian currency crises in July 1997. Since 1993, there was an
accelerated effort to increase portfolio as well as direct investments abroad,
resulting in the net outflow of capital.
4.5 We next evaluate formally the presence of a currency risk
premium using the orthogonality test methodology employed by Hansen and
Hodrick (1980), Hodrick and Srivastava (1984), Cumby (1988) and others.6
Under the conditions that the preference of investors is risk averse and the
costs of transacting are zero, the ex post deviation from UIP, Πt, will be
equal to the exchange rate risk premium and the forecast error:
tttt e
eii )(* ∆
−−=Π = Rt + εt (6)
where te
e)(
∆ is the actual change in the nominal exchange rate over the
holding period, Rt is the risk premium, and εt is the exchange rate forecast
error. Under the joint null hypotheses that UIP holds and that the market
makes rational forecasts, Πt should be orthogonal with any elements of the
known information set. Under rational expectations, εt would have zero
mean, be serially uncorrelated, and uncorrelated with known information.
We test the null hypotheses by estimating:
Πt = Xt β + µt (7)
where Xt is an n-dimension row vector consisting of variables in the
information set at time t and β is the n-dimension column vector of
parameters. The null hypotheses are evaluated by testing the restriction
β = 0.
6 An alternative procedure of extracting the risk premium is to use data from currency
forecast surveys. However, such survey data on a continuous basis was notavailable to us.

MAS Occasional Paper No. 11, Mar 99
Economics Department, Monetary Authority of Singapore
16
4.6 We employed monthly data from April 1988 to September 1998
to estimate the equation. The F-test of the null hypothesis that all the
coefficients except the constant are zero is rejected at the marginal
significance level of 0.032.7 Hence the test result suggests the presence of
a significant time-varying risk premium.
4.7 The second source of the low interest rate is the expectation of
appreciation of the Singapore Dollar exchange rate. Figure 4 shows that the
Singapore Dollar nominal effective exchange rate was appreciating since
1988. The underlying factor which provides the basis for the trend
appreciation of the currency can again be found in the high savings by both
the private and public sector, and the manner in which the savings resources
are intermediated to acquire foreign currency assets. Between 1990 to
1997, the public sector budget surplus averaged 6.2% of nominal GDP (see
Figure 5). A high level of private sector saving ensured a positive private
sector saving-investment balance despite the high level of private
investment. By 1997, the private sector savings rate had risen to 40% of
GDP, from 14% in 1980.
7 The variables we selected to be included in Xt are the three lagged ex post deviations
from UIP, lagged changes in the exchange rate, and lagged nominal interest ratedifferentials. The estimated equation is:
942.5)2(318.19)12(128.2142.0
)176.1()132.1()376.1()177.1(
)(26501)(30797)(3345326510
)132.1()376.1()177.1()132.1()376.1()999.0(
3080833456265113080833456307.0
2
3*
2*
1*
3
21321
====
−−−−−+−−∆+
−−∆−∆+Π+Π−Π+−=Π
−−−−
−−−−−
LMQFR
iiiiiie
ee
tttt
tttttt
The equation was estimated by OLS with its standard error corrected forheteroscedasticity and serial correlation using the Newey-West procedure. Thefigures in parentheses are t-statistics.

MAS Occasional Paper No. 11, Mar 99
Economics Department, Monetary Authority of Singapore
17
Figure 4Nominal Effective Exchange Rate of the Singapore Dollar
70
80
90
100
110
120
130
140
79Q1 80Q1 81Q1 82Q1 83Q1 84Q1 85Q1 86Q1 87Q1 88Q1 89Q1 90Q1 91Q1 92Q1 93Q1 94Q1 95Q1 96Q1 97Q1 98Q1
Inde
x 19
90=
100
Source: IMF, International Financial Statistics
Figure 5Public Sector Budget Balance and
Private Sector Savings-Investment Balance, 1980-1997
-25
-20
-15
-10
-5
0
5
10
15
20
80 81 82 83 84 85 86 87 88 89 90 91 92 93 94 95 96 97
% o
f GD
P
Private Savings-Investment Balance
Public Sector Budget Balance
Current Account Balance

MAS Occasional Paper No. 11, Mar 99
Economics Department, Monetary Authority of Singapore
18
4.8 Most of the public sector surplus is placed directly with the
MAS. A substantial portion of the private sector saving is held in the form of
Central Provident Fund (CPF) contributions, which is managed by the MAS
as a fiscal agent for the government. The CPF is a compulsory savings
scheme which aims at providing old-age security for public and private
sector employees. Employees make monthly contributions, at a certain
percentage of their wage income, to the CPF. In addition, employers must
also match the employees' monthly contributions. Currently the employees'
and employers' contribution stand at 20% each of the employees' monthly
salary, subject to a maximum contribution of S$1200 by both parties.
Employees are allowed to withdraw from the Fund upon reaching the age of
55. However, limited withdrawals are allowed for specific purposes before
the age of 55. Table 4 shows that the contributions, net of withdrawals,
continued to increase over time. Typically, over 90% of CPF assets are held
in government securities and in the form of advanced deposits to the MAS.
The advanced deposits placed with the MAS are for the purchase of future
issues of government bonds.
Table 4Balances of the Central Provident Fund (Millions of S$)
Members’Contributions
Withdrawals NetContributions
AdvancedDeposits
With MAS
Holdings ofGovernment
Bonds
1981 3,007.2 1,068.0 1,939.2 2,885.5 8,992.31982 3,901.1 1,241.3 2,659.8 5,394.8 9,852.11983 4,491.0 1,718.4 2,772.6 4,199.3 14,877.41984 5,385.2 3,510.7 1,874.5 7,459.5 14,455.31985 5,993.4 3,359.9 2,633.5 11,959.2 13,638.51986 4,777.8 3,824.3 953.5 13,455.8 13,638.51987 4,446.8 4,297.5 149.3 1,188.2 28,620.01988 4,985.1 4,010.5 974.6 2,244.0 30,120.01989 6,107.5 3,663.5 2,444.0 3,721.9 32,120.01990 7,174.2 4,003.5 3,170.7 8,226.8 32,120.01991 8,101.4 4,664.9 3,436.5 13,733.7 32,120.01992 9,028.2 5,418.3 3,609.9 5,829.3 45,620.01993 10,427.0 10,949.2 -522.2 7,737.1 44,620.01994 11,278.5 7,300.9 3,977.6 13,837.8 43,620.01995 13,536.1 7,266.1 6,270.0 20,537.2 45,120.01996 14,623.0 10,544.7 4,078.3 20,857.0 51,620.01997 15,873.8 11,475.5 4,398.3 22,101.5 57,120.0
Source: Central Provident Fund Board annual reports

MAS Occasional Paper No. 11, Mar 99
Economics Department, Monetary Authority of Singapore
19
4.9 The effect of the public sector placement of deposits with the
MAS is to cause a contraction in the monetary base and money supply. As
Figure 6 indicates, net deposits placed with the MAS constitutes a large
contractionary influence on the monetary base, which in turn provides the
basis for the appreciation of the Singapore Dollar. The MAS offsets the
contractionary effect of the public sector deposit placement by undertaking
foreign exchange market intervention, whereby it sells the Singapore Dollar
for the US Dollar. Figure 6 shows the impact of the accumulation of foreign
exchange on the monetary base. The extent of the foreign exchange market
intervention is determined by the targeted level of the trade-weighted
nominal effective exchange rate, which is bounded within an undisclosed
band. The path of the appreciation of the effective exchange rate was
determined by the need to contain the domestic inflationary pressure as the
economy approached full employment by the 1980s [Teh and
Shanmugaratnam (1992)].
Figure 6Changes in Monetary Base and its Components
-6
-4
-2
0
2
4
6
85
Q1
86
Q1
87
Q1
88
Q1
89
Q1
90
Q1
91
Q1
92
Q1
93
Q1
94
Q1
95
Q1
96
Q1
97
Q1
98
Q1
Qtr
-on-
Qtr
Cha
nges
(S
$ bi
llion
)
Foreign Assets
Reserve Money
Central Government Deposits & Other Items (Net)
Source: IMF, International Financial Statistics
4.10 Finally, we assess the relative contribution of the mean and the
variance of the exchange rate risk premium and the expected change in the
spot rate to the first two moments of the nominal interest rate differential.

MAS Occasional Paper No. 11, Mar 99
Economics Department, Monetary Authority of Singapore
20
Since both the exchange rate risk premium and the expected change in the
exchange rate are not observable, one of these variables would have to be
estimated in order to determine the contribution of these variables to the
mean of the nominal interest differential. We generate the risk premium from
the estimated equation reported in footnote 7, which relates the ex-post
deviations from UIP to the variables in the current information set. Under the
assumption that expectations are rational, the predicted values from the
regression would provide an estimate of the time-varying risk premium. The
series of the expected change in the exchange rate can then be obtained by
subtracting the nominal interest rate differential from the estimated risk
premium. The mean of the nominal Singapore-US one-month interest rate
differential, was -0.16% on a monthly basis for the period from January 1988
to September 1998. Among its components, the mean of the estimated
exchange rate risk premium was only -0.04%, compared to the mean of
-0.12% for the expected rate of appreciation of the Singapore Dollar.
4.11 Finally, to determine the relative contribution of the variance of
the risk premium and the variance of the expected change in the spot rate to
the overall variance of the nominal interest rate differential – which under
CIP is equal to the forward discount – we employed the decomposition
procedure attributed to Fama (1984). The procedure involves estimating the
following pair of regressions:
log ft - log et+1 = α1 + β1 (log ft - log et) + u1t (8)
log et+1 - log et = α2 + β2 (log ft - log et) + u2t (9)
Under the assumption that the market forms its forecast rationally, Fama has
shown that the difference between the two estimated coefficients β1 and β2 is
given by:
)var(
)]evar()[var(21
discountforward
ratespotinchangexpectedpremiumrisk −=− ββ (10)

MAS Occasional Paper No. 11, Mar 99
Economics Department, Monetary Authority of Singapore
21
A positive value for (β1 - β2) indicates that the variance of the risk premium is
greater than the variance of the exchange rate expectation.
4.12 The results of the estimation are presented in Table 5. The
sample is the same monthly data from January 1989 to September 1998.
First, we note that the coefficient β2 is positive and thus differs from the
estimates obtained by Fama (1984), Marston (1995) and others who
obtained mostly negative values for the coefficient. A positive β2 implies that
the covariance between the expected change in the exchange rate and the
risk premium is positive. In other words, the estimates indicate that periods
when the Singapore Dollar was expected to appreciate against the US Dollar
coincided with periods when the required risk premium for holding US Dollar
assets increased. As we have indicated earlier, the underlying factor driving
these two variables was the growing surplus of saving over investment. The
difference (β1 - β2) is -0.157, indicating that, on average, the variance of the
expected change in the exchange rate is larger than the variance of the risk
premium.
Table 5Decomposition of the Variance of the Nominal Interest Rate Differential
Equation (8) Equation (9)
α1 0.0009(0.5414)
α2 -0.0009(-0.5414)
β1 0.4215(1.1220)
β2 0.5784(1.5396)
DW 1.6005 1.6005
R2 0.0049 0.0091
Note: The figures in parentheses are t-values which are computed from standard errors correctedaccording to the Newey-West procedure.

MAS Occasional Paper No. 11, Mar 99
Economics Department, Monetary Authority of Singapore
22
4.13 In summary, the high domestic saving has provided the
impetus for substantial capital outflow and trend appreciation of the
Singapore Dollar. The expectation of the appreciation of the Singapore
Dollar and the foreign currency risk premium have resulted in generally lower
local interest rates relative to international interest rates. Our analysis
indicates that the exchange rate expectation factor tends to dominate the
risk premium factor, on average, in explaining the mean and variance of the
interest rate differential.

MAS Occasional Paper No. 11, Mar 99
Economics Department, Monetary Authority of Singapore
23
V CAPITAL FLOWS AND MONETARY AUTONOMY
5.1 Given that the MAS manages the exchange rate within a band,
and that the mobility of financial capital is sufficiently high, the next issue that
we would like to analyse is the extent to which the monetary authority can
influence the domestic liquidity condition without compromising its exchange
rate target. The consensus that has developed is that under the conditions
of perfect capital mobility and perfect substitutability of domestic and foreign
currency assets in the investor’s portfolio (i.e. investors do not demand an
additional currency risk premium for holding foreign currency-denominated
assets), it is not possible to insulate the domestic money supply from the
exchange market intervention without affecting the level of nominal
exchange rates [Obstfeld (1990)].
5.2 We evaluate this proposition by estimating the offset coefficient
from a reduced-form capital flow equation, which is derived from a portfolio
balance model of a small open economy (see Appendix). When domestic
and foreign securities are perfectly substitutable and where no capital
controls exist to restrict the movement of funds, any changes in the
monetary authority’s net domestic assets can be completely offset by capital
flows. In such a situation, the monetary authority cannot rely on sterilisation
measures to limit the impact of changes in international reserves on
domestic money supply.
5.3 The reduced-form capital flow equation that is used to estimate
the offset equation is:
KAPt = α0 + β1 ∆Yt + β2 ∆NDAt + β3 [ CAt + EOt
+ FDIt + PIt ] + β4 (i* +
e
ee∆)t + ξt (11)
where KAP is the interest-sensitive component of capital flows (which we
take to be net other investments, OTHI), Y is the nominal GDP, NDA is the
monetary authority’s net domestic assets, CA is the current account balance,

MAS Occasional Paper No. 11, Mar 99
Economics Department, Monetary Authority of Singapore
24
FDI is the net direct foreign investments, PI is net portfolio investments, EO
is the errors and omissions, *i is the 3-month US Dollar SIBOR rate, and e
is the Singapore Dollar-US Dollar nominal exchange rate, defined as the
number of Singapore Dollars per US Dollar. ee∆ is the expected change in
the exchange rate over the three-month holding period. β2 is the offset
coefficient and equals -1 when the offset is complete. The sample consists
of quarterly observations from 1986Q2 to 1998Q1.
5.4 Two econometric issues arise from equation (11). First is the
potential simultaneous equation bias in the offset coefficient β2, which arises
from the endogeneity of ∆NDA when the monetary authority systematically
sterilises the impact of reserve flows. As Kouri and Porter (1974), Obstfeld
(1982) and others have observed, systematic sterilisation results in β2 being
biased towards minus unity.
5.5 Second is the choice of the empirical proxy for the
unobservable expected change in the exchange rate. In the analysis that
follows, we employ, alternatively, the rational expectations and adaptive
expectations schemes:
ttet ee δ+∆=∆ (rational expectations)
1−∆=∆ tet ee (adaptive expectations)
where δt is the serially uncorrelated exchange rate forecast error with zero
mean and constant variance, and is orthogonal to the elements of the
information set. We employ the McCallum (1976) instrumental variable
procedure to obtain a consistent estimate of β4 under rational expectations.8
5.6 Table 6 presents the results of our estimates of equation (11)
under alternative exchange rate expectation schemes. We first employ the
8 The instruments are lagged changes in the monetary authority’s net domestic assets,
real GDP, CPI inflation, and the domestic interbank rate, as well as lagged levels ofthe exchange rate, the current account balance and net other investment flows.

MAS Occasional Paper No. 11, Mar 99
Economics Department, Monetary Authority of Singapore
25
Hausman (1978) specification test to test for the existence of a simultaneous
equation bias in the coefficient β2. The results of the specification test are
reported in equations (1a) and (2a) of Table 6, which indicate that the null
hypothesis of no sterilisation bias cannot be rejected, as the coefficient of the
predicted NDA is not statistically different from zero.
Table 6Estimates of Capital Flow Equation
Rational Expectations Adaptive ExpectationsIndependent
Variables (1a) (1b) (2a) (2b)
∆Y 0.046 0.051 0.046 0.055(0.992) (1.082) (1.013) (1.202)
∆NDA -0.991 -1.020 -0.993 -1.017(-17.269) (-33.602) (-18.557) (-33.819)
(P ∆NDA) -0.046 -0.048(-0.620) (-0.655)
(CA + FDI + PI + EO) -0.934 -0.929 -0.936 -0.928(-37.899) (-49.336) (-37.988) (-49.265)
)( *
e
ei
e∆+∆ -48.147 -53.450 -31.367 -37.209
(-1.658) (-2.236) (-1.192) (-1.801)
R 2 0.987 0.988 0.987 0.987
Note: P∆NDA is the predicted value of ∆NDA which is entered into the regression to implement theHausman test. The hypothesis of no sterilisation bias is equivalent to testing the hypothesisthat the coefficient of P∆NDA is zero. Figures in parentheses are t-statistics.
5.7 Preliminary analysis of the residuals of the estimated equations
indicates that they are heteroscedastic and serially correlated. Subsequently
we employ the Newey-West (1987) procedure to obtain consistent estimates
of the covariance matrices of the equations.
5.8 Equations (1b) and (2b) in Table 6 estimate the coefficient β2 to
be -1, indicating that capital flow moves in the direction to offset any changes
in the net domestic assets of the monetary authority within a quarter. The
estimate is consistent with the earlier findings of perfect capital mobility and

MAS Occasional Paper No. 11, Mar 99
Economics Department, Monetary Authority of Singapore
26
the relatively small risk premium underlying the interest rate differential. The
latter would imply that domestic and foreign currency assets are fairly close
substitutes.
5.9 The estimates also indicate that the capital flows are sensitive
to changes in the interest rate and the expectation of exchange rate
changes. An increase in the US interest rate and/or an expectation of a
depreciation of the local currency leads to a capital outflow. Further, an
increase in the current account surplus or an increase in the inflow of FDI,
holding other variables constant, gives rise to an outflow of capital. An
increase in the current account surplus or FDI increases the supply of
reserve money in excess of its demand, thereby lowering the domestic
interest rate relative to the expected return on holding foreign assets. The
resultant portfolio substitution leads to capital outflow. The coefficient of the
change in nominal income, while positive, is not statistically significant. A
positive coefficient would indicate that any increase in demand for reserve
money resulting from rising income would be partially fulfilled by capital
inflows. Overall, the estimated model explained the capital flow well, with a
reasonably high R 2.

MAS Occasional Paper No. 11, Mar 99
Economics Department, Monetary Authority of Singapore
27
VI SUMMARY AND CONCLUSION
6.1 This paper set out to analyse the structure of the capital
account and the persistence characteristics of the individual capital flow
components in an economy which has a highly open financial market and
which exports capital abroad. Our time series analysis indicates that the
individual net capital flows, including FDI, show little evidence of persistence.
One reason for the small permanent component in net FDI flow is the large
outward direct investment, which tends to offset the steady inward
investment.
6.2 The risk premium on foreign currency-denominated assets,
together with the expectation of appreciation of the local currency have
resulted in the domestic rate being generally lower than international interest
rates. We have shown that the proximate cause of the interest rate
differential is the excess of domestic saving over investment. In the face of
perfect capital mobility and the relatively small currency risk premium, it is
almost impossible for the monetary authority to pursue a monetary policy
stance that is independent of its exchange rate objective.

MAS Occasional Paper No. 11, Mar 99
Economics Department, Monetary Authority of Singapore
28
Appendix
A Portfolio Balance Model of Capital Flows
In this Appendix, we develop a simple open-economy portfolio balance
model, from which we derived the capital flow equation. The model is in the
spirit of the well-known Kouri-Porter (1974) paper. In the model, investors
can hold three types of financial assets, namely base money (M), domestic
currency-denominated interest-bearing assets (B), and foreign currency-
denominated interest-bearing assets (F). Portfolio allocation decisions
among these assets depends upon domestic and foreign interest rates,
exchange rates and income, subject to the wealth constraint.
The demand for domestic reserve money is determined by the level of the
nominal domestic interest rate and the level of income:
dtM = α + β1it + β2Yt (1)
where it is the nominal domestic interest rate and Yt is the income. We have
left out the wealth variable as an argument in the demand function as no
satisfactory empirical proxy for the variable is available.
The supply of base money is given as:
stM = NDAt + NFAt (2)
where NDAt and NFAt refer to the monetary authority’s net domestic assets
and net foreign assets respectively.
Taking the first difference in (1) and (2), equating the change in demand for
base money with the change in supply, and solving for the domestic interest
rate gives:

MAS Occasional Paper No. 11, Mar 99
Economics Department, Monetary Authority of Singapore
29
∆it = 1
1
β (∆NDA + ∆NFA)t -
1
2
ββ
∆Yt (3)
The interest-sensitive capital flow (KAP, which we take to be OTHI) is the
change in the foreign demand for domestic assets less the change in the
domestic demand for foreign assets:
KAPt = γ1 + γ2 ∆[i - i* - e
ee∆]t + γ3 ∆Yt (4)
where i* is the foreign interest rate and e
ee∆ is the expected change in the
exchange rate. Here, we drop the wealth and foreign income variables.
Substituting (3) into (4):
KAPt = γ1 + 1
2
βγ
(∆NDA + ∆NFA)t + 1
2231
βγβγβ −
∆Yt
- γ2 (i* +
e
ee∆)t (5)
using the balance of payments identity:
∆NFA ≡ CA + KAP + FDI + PI + EO (6)
where CA is the current account balance, FDI is the flow of foreign direct
investment, and EO is the errors and omissions term.
Substituting (6) into (5) and rearranging:
KAPt = λ0 + λ1 ∆Yt + λ2 ∆NDAt + λ3 CAt + λ4 EOt
+ λ5 FDIt + λ6 PIt + λ7 (i* +
e
ee∆)t (7)

MAS Occasional Paper No. 11, Mar 99
Economics Department, Monetary Authority of Singapore
30
where λ0 = 21
11
γββγ−
, λ1 = 21
2231
γβγβγβ
−−
,
λ2 = λ3 = λ4 = λ5 = λ6 = 21
2
γβγ−
, λ7 = -21
12
γββγ
−.

MAS Occasional Paper No. 11, Mar 99
Economics Department, Monetary Authority of Singapore
31
References
Adreni, P.G. and D. Lubian. 1989. “Purchasing Power During the 1920s”,Economic Letters, 30:357-362.
Calvo, G.A., L. Liederman and C.M. Reinhart. 1995. “Capital Inflows toLatin America with Reference to the Asian Experience”, ed., CapitalControls, Exchange Rates and Monetary Policy in the World Economy.Cambridge: Cambridge University Press.
Campbell, J.Y. and N.G. Mankiw. 1987. “Are Output FluctuationsTransitory?”, Quarterly Journal of Economics, 102:857-880.
Campbell, J.Y. and N.G. Mankiw. 1989. “International Evidence of thePersistence of Economic Fluctuations”, Journal of Monetary Economics,23:319-333.
Claessens, S., M.P. Dooley and A. Warner. 1995. “Portfolio Capital Flows”Hot or Cold?”, The World Bank Economic Review, 9:153-174.
Cochrane, J.H.. 1988. “How Big is the Random Walk in GNP?”, Journal ofPolitical Economy, 96:893-920.
Cumby, R.E.. 1988. “Is It Risk? Explaining Deviations from UncoveredInterest Parity”, Journal of Monetary Economics, 22:279-299.
Fama, E.F.. 1984. “Forward and Spot Exchange Rates”, Journal ofMonetary Economics, 14:319-338.
Frankel, J.A.. 1994. “Sterilization of Money Flows: Difficult (Calvo) or Easy(Reisen)?”, IMF Working Paper 94/159.
Frankel, J.A. and C. Okongwu. 1995. “Liberalized Portfolio Capital Inflowsin Emerging Markets: Sterilization, Expectations and the Incompleteness ofInterest Rate Convergence”, NBER Working Paper No. 5156.
Frankel, J.C. and R.M. Levich. 1977. “Transaction Costs and InterestArbitrage: Tranquil Versus Turbulent Periods”, Journal of Political Economy,85:1209-1226.
Glick, R.. 1998. Overview, in R. Glick, ed., Managing Capital Flows andExchange Rates. Cambridge: Cambridge University Press.
Hansen, L.P. and R.J. Hodrick. 1980. “Forward Exchange Rates as OptimalPredictors of Future Spot Rates: An Econometric Analysis”, Journal ofPolitical Economy, 88:829-853.
Hausman, J.. 1978. “Specification Tests in Econometrics”, Econometrica,46:1251-1271.

MAS Occasional Paper No. 11, Mar 99
Economics Department, Monetary Authority of Singapore
32
Hodrick, R.J. and S. Srivastava. 1984. “An Investigation of Risk and Returnin Forward Foreign Exchange”, Journal of International Money and Finance,3:5-29.
Kletzer, K. and M.M. Spiegal. 1998. “Speculative Capital Inflows andExchange Rate Targetting in the Pacific Basin: Theory and Evidence”, in R.Glick, ed., Managing Capital Flows and Exchange Rates. Chicago:University of Chicago Press.
Kouri, P.J. and M.G. Porter. 1974. “International Capital Flows and PortfolioEquilibrium”, Journal of Political Economy, 82:443-467.
Lee, Y.. 1987. “The Government in Macroeconomic Management, in L.B.Krause, A.T. Koh and Y. Lee, The Singapore Economy Reconsidered.Singapore: Institute of Southeast Asian Studies.
Marston, R.C.. 1993. “Interest Differential Under Bretton Woods and thePost-Bretton Wood Float: The Effects of Capital Controls and ExchangeRisk”, in M.D. Bordo and B. Eichengreen, eds., A Retrospective on theBretton Woods System. Chicago: University of Chicago Press.
Marston, R.C.. 1995. International Financial Integration. Cambridge:Cambridge University Press.
McCallum, B.T.. 1976. “Rational Expectations and the Natural RateHypothesis: Some Consistent Estimates”, Econometrica, 44:43-52.
Newey, W. and K. West. 1987. “A Simple Positive Semi-Definite,Heteroscedasticity and Autocorrelation Consistent Covariance Matrix”,Econometrica, 55:703-708.
Obstfeld, M.. 1982. “Can We Sterilize? Theory and Evidence”, AmericanEconomic Review, 72:45-49.
Obstfeld, M.. 1990. “The Effectiveness of Foreign Exchange Intervention:Recent Experience, 1985-1988”, in W.H. Branson, ed., International PolicyCoordination and Exchange Rate Fluctuations. Chicago: University ofChicago Press.
Taylor, M.P.. 1988. “Covered Interest Arbitrage and Market Turbulence”,Economic Journal, 99:376-391.
Teh, K.P. and T. Shanmugaratnam. 1992. “Exchange Rate Policy:Philosophy and Conduct over the Past Decade”, in L. Low and M.H. Toh,eds., Public Policies in Singapore: Changes in the 1980s and FutureSignposts. Singapore: Times Academic Press.
White, H.. 1980. “A Heteroscedasticity-Consistent Covariance MatrixEstimator and a Direct Test for Heteroscedasticity”, Econometrica, 48:817-838.

* All MAS Occasional Papers in Adobe Acrobat (PDF) format can be downloaded at the MASWebsite at http://www.mas.gov.sg.
MAS OCCASIONAL PAPER SERIES*
Number Title Date
1 Current Account Deficits in the ASEAN-3: Is There Cause for Concern?
May 1997
2 Quality of Employment Growth in Singapore: 1983-96
Oct 1997
3 Whither the Renminbi? Dec 1997
4 Growth in Singapore's Export Markets, 1991-96: A Shift-Share Analysis
Feb 1998
5 Singapore’s Services Sector in Perspective: Trends and Outlook
May 1998
6 What lies behind Singapore’s Real Exchange Rate? An Empirical Analysis of the Purchasing Power Parity Hypothesis
May 1998
7 Singapore’s Trade Linkages, 1992-96: Trends and Implications
Aug 1998
8 Impact of the Asian Crisis on China: An Assessment
Oct 1998
9 Export Competition Among Asian NIEs, 1991-96: An Assessment
Oct 1998
10 Measures of Core Inflation for Singapore Dec 1998

* All MAS Occasional Papers in Adobe Acrobat (PDF) format can be downloaded at the MASWebsite at http://www.mas.gov.sg.
Number Title Date
11 Capital Account and Exchange Rate Management in a Surplus Economy: The Case of Singapore
Mar 1999