Embed Size (px)
Citation preview

Capacity Planning

How much long-range capacity is needed
When more capacity is neededWhere facilities should be located
(location)How facilities should be arranged
(layout)
Facility planning answers:
Facility Planning

ForecastDemand
ComputeNeededCapacity
ComputeRated
Capacity
EvaluateCapacity
Plans
ImplementBest Plan
QualitativeFactors
(e.g., Skills)
Select BestCapacity
Plan
DevelopAlternative
Plans
QuantitativeFactors
(e.g., Cost)
Capacity Planning Process

Types of Planning & Time Horizons
Add FacilitiesAdd long lead time equipment
Schedule Jobs Schedule Personnel Allocate Machinery
Sub-ContractAdd EquipmentAdd Shifts
Add PersonnelBuild or Use Inventory
Long Range Planning
Intermediate Range Planning
Short Range Planning Modify
CapacityUse Capacity
*
*
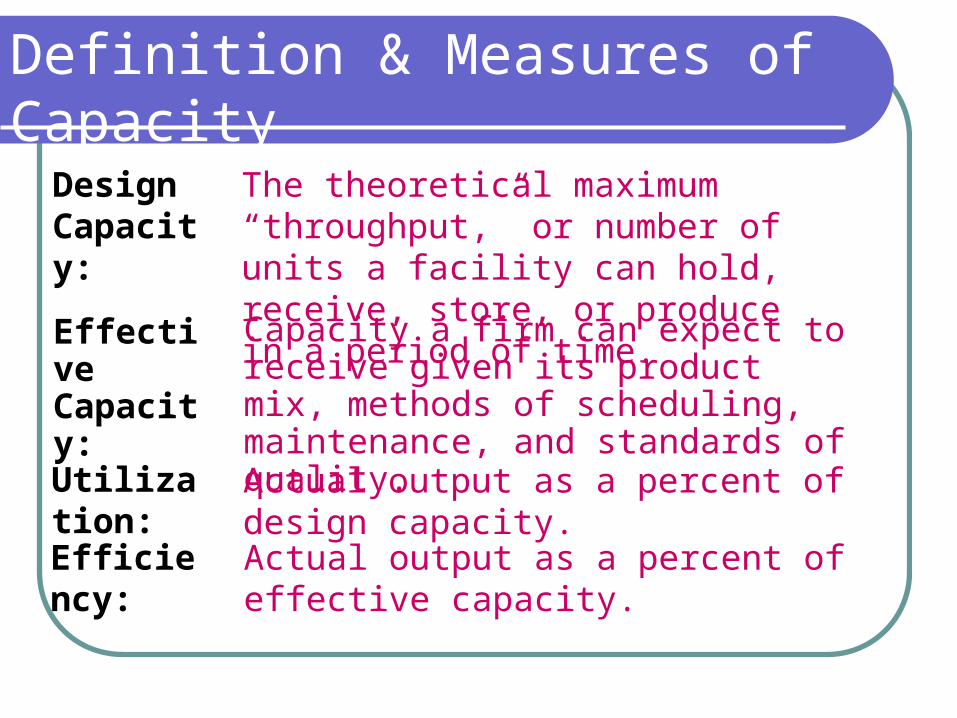
Definition & Measures of Capacity
DesignCapacity:
The theoretical maximum “throughput,” or number of units a facility can hold, receive, store, or produce in a period of time.
Utilization: Actual output as a percent of design capacity.
Effective Capacity:
Capacity a firm can expect to receive given its product mix, methods of scheduling, maintenance, and standards of quality.
Efficiency: Actual output as a percent of effective capacity.
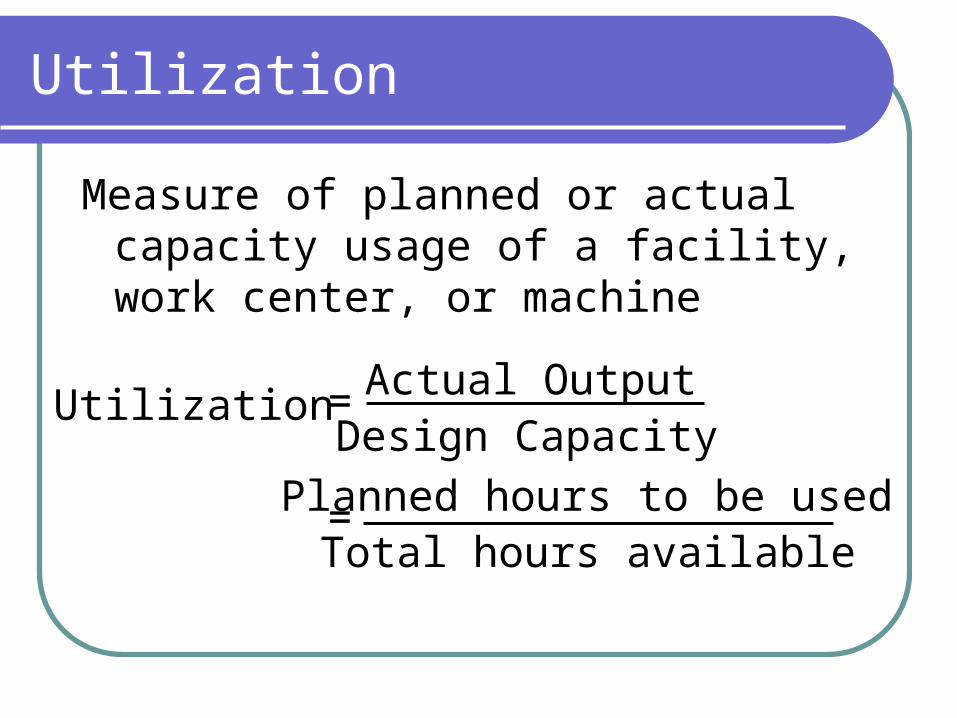
Measure of planned or actual capacity usage of a facility, work center, or machine
Utilization Actual OutputDesign Capacity
Planned hours to be usedTotal hours available
=
=
Utilization
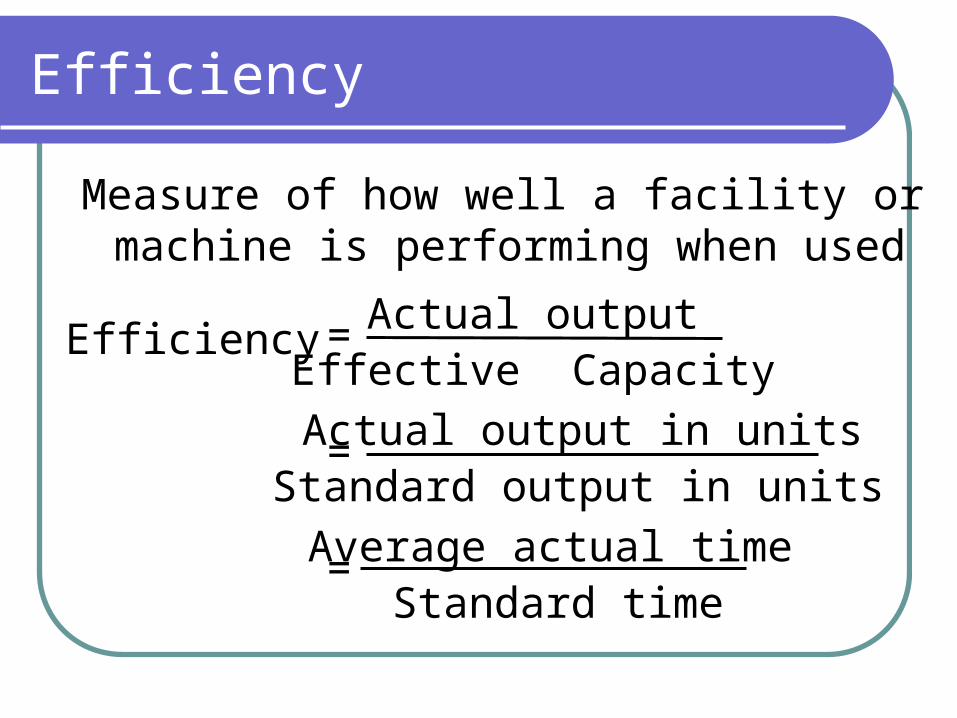
Measure of how well a facility or machine is performing when used
Efficiency Actual outputEffective Capacity
Actual output in unitsStandard output in unitsAverage actual time
Standard time
=
=
=
Efficiency
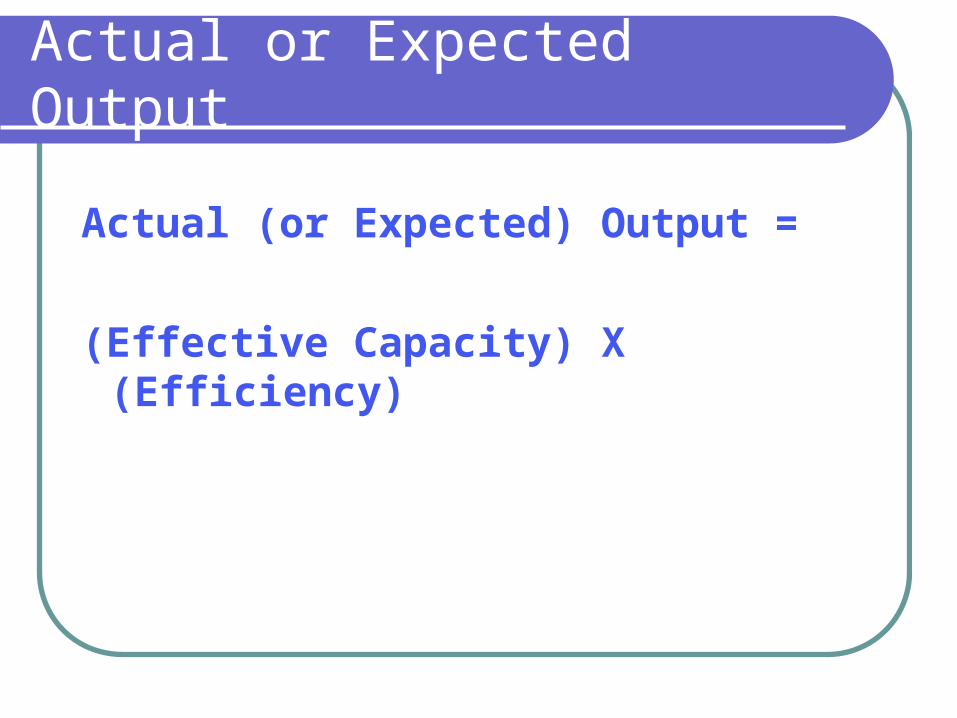
Actual or Expected Output
Actual (or Expected) Output =
(Effective Capacity) X (Efficiency)
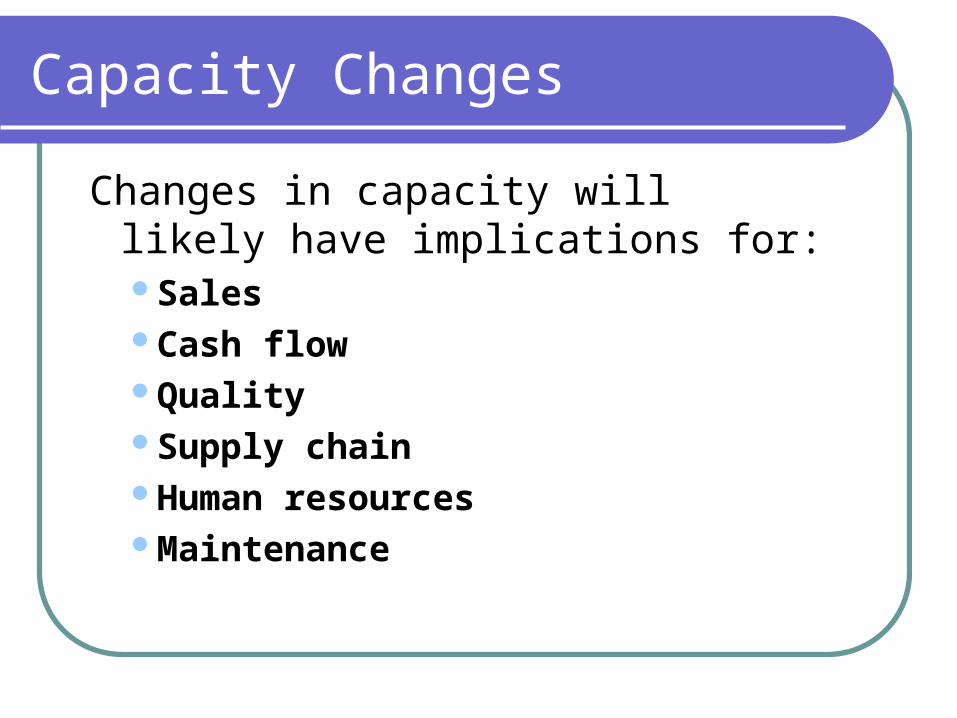
Capacity Changes
Changes in capacity will likely have implications for:SalesCash flowQualitySupply chainHuman resourcesMaintenance

Make Good Capacity Decisions:
Forecast demand accuratelyUnderstand the technology and
capacity incrementsFind the optimal operating level
(volume)Build for change
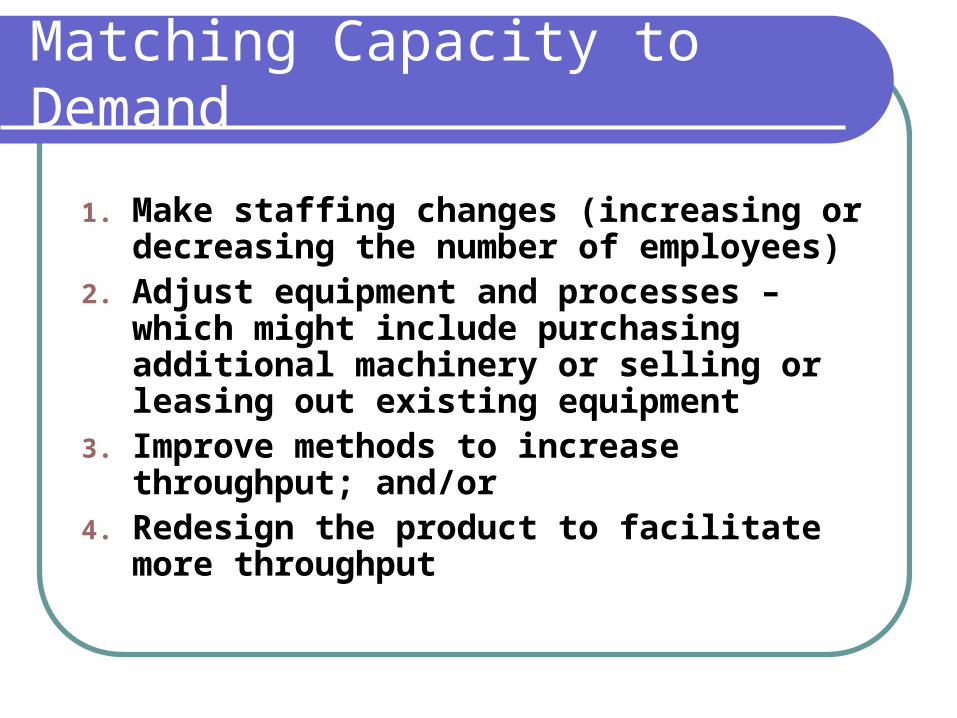
Matching Capacity to Demand
1. Make staffing changes (increasing or decreasing the number of employees)
2. Adjust equipment and processes – which might include purchasing additional machinery or selling or leasing out existing equipment
3. Improve methods to increase throughput; and/or
4. Redesign the product to facilitate more throughput

Matching Capacity to Demand
Demand management Vary prices Change lead times Encourage or discourage business Offer complementary products
Capacity management Adjust staffing Adjust equipment and processes Change methods to facilitate production Redesign the product to facilitate production

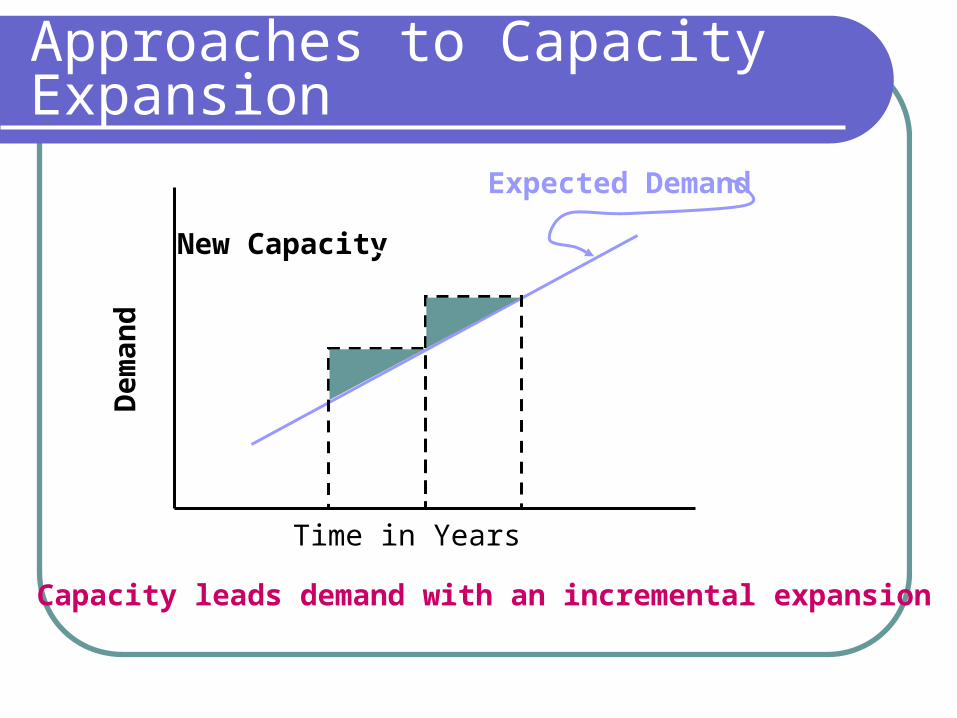
Approaches to Capacity Expansion
Expected Demand Expected Demand
Expected Demand Expected Demand
Time in Years Time in Years
Time in YearsTime in Years
Dem
and
Dem
and
Dem
and
Dem
and
New Capacity
New Capacity New Capacity
New Capacity
Capacity leads demand with an incremental expansion Capacity leads demand with a one-step expansion
Capacity lags demand with an incremental expansionAttempts to have an average capacity, with an
incremental expansion
Approaches to Capacity Expansion
Expected Demand
Time in Years
Dem
and
New Capacity
Capacity leads demand with an incremental expansion
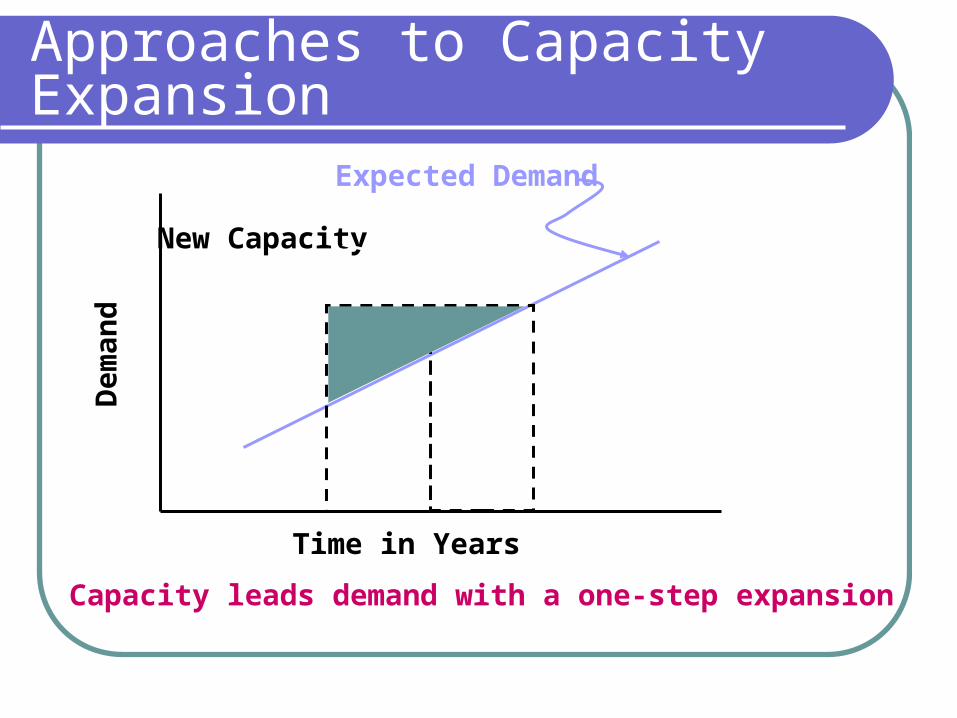
Approaches to Capacity Expansion
Expected Demand
Time in Years
Dem
and
New Capacity
Capacity leads demand with a one-step expansion

Approaches to Capacity Expansion
Expected Demand
Time in Years
Dem
and
New Capacity
Capacity lags demand with an incremental expansion
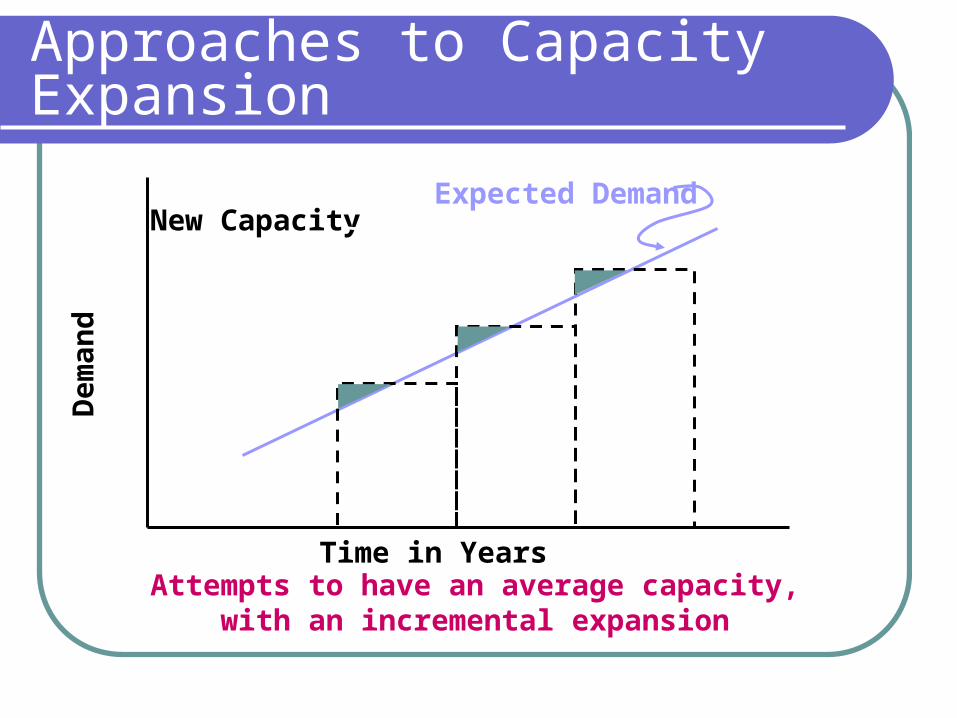
Approaches to Capacity Expansion
Expected Demand
Time in Years
Dem
and
New Capacity
Attempts to have an average capacity, with an incremental expansion
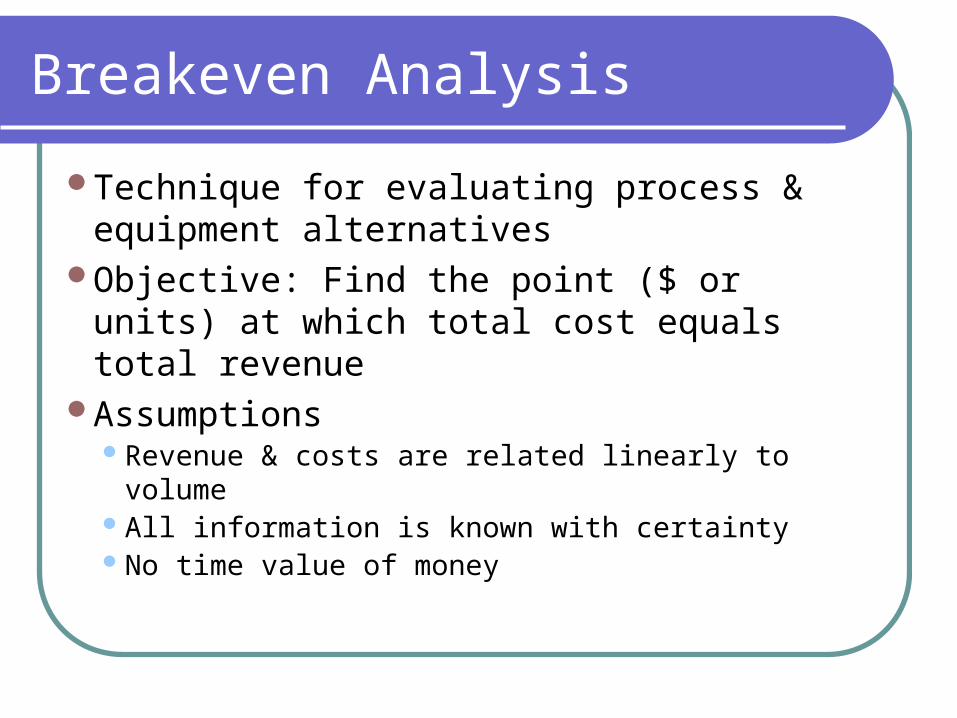
Breakeven Analysis
Technique for evaluating process & equipment alternatives
Objective: Find the point ($ or units) at which total cost equals total revenue
AssumptionsRevenue & costs are related linearly to volumeAll information is known with certaintyNo time value of money
Break-Even Analysis
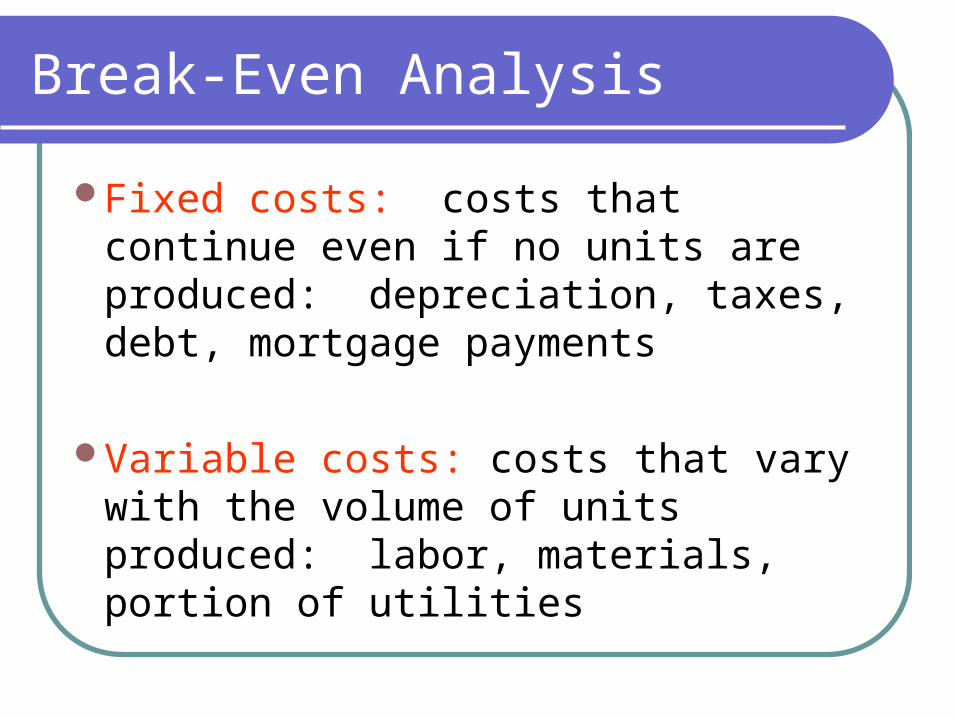
Fixed costs: costs that continue even if no units are produced: depreciation, taxes, debt, mortgage payments
Variable costs: costs that vary with the volume of units produced: labor, materials, portion of utilities

Breakeven Chart
Fixed cost
Variable cost
Total cost line
Total revenue line
ProfitBreakeven pointTotal cost = Total revenue
Volume (units/period)
Cost
in D
olla
rs
Loss
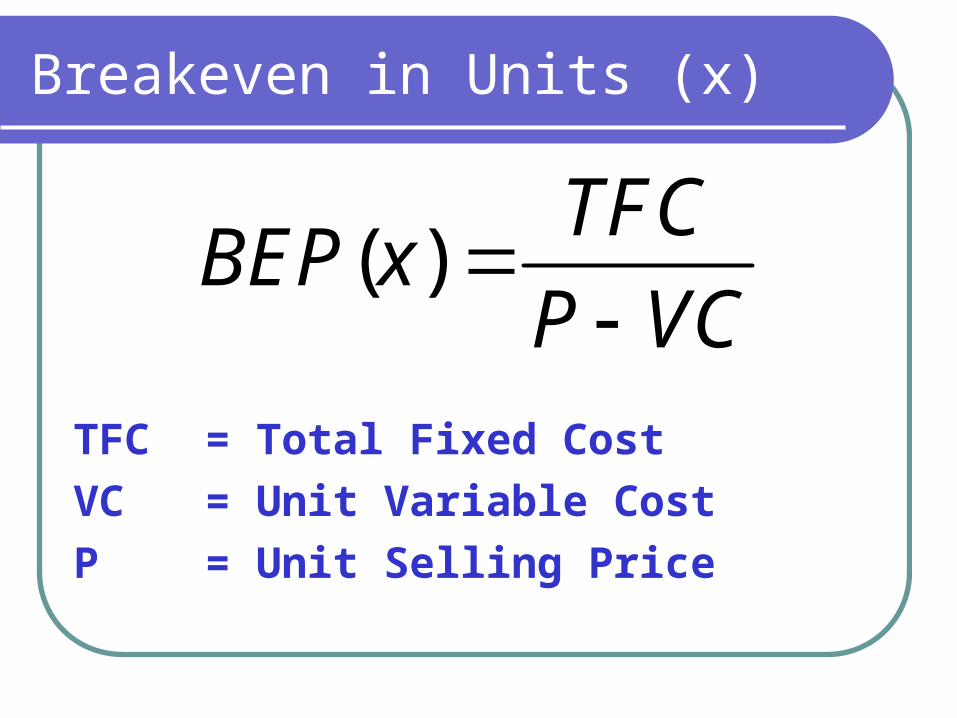
Breakeven in Units (x)
TFC = Total Fixed Cost
VC = Unit Variable Cost
P = Unit Selling Price
( )TFC
BEP xP VC
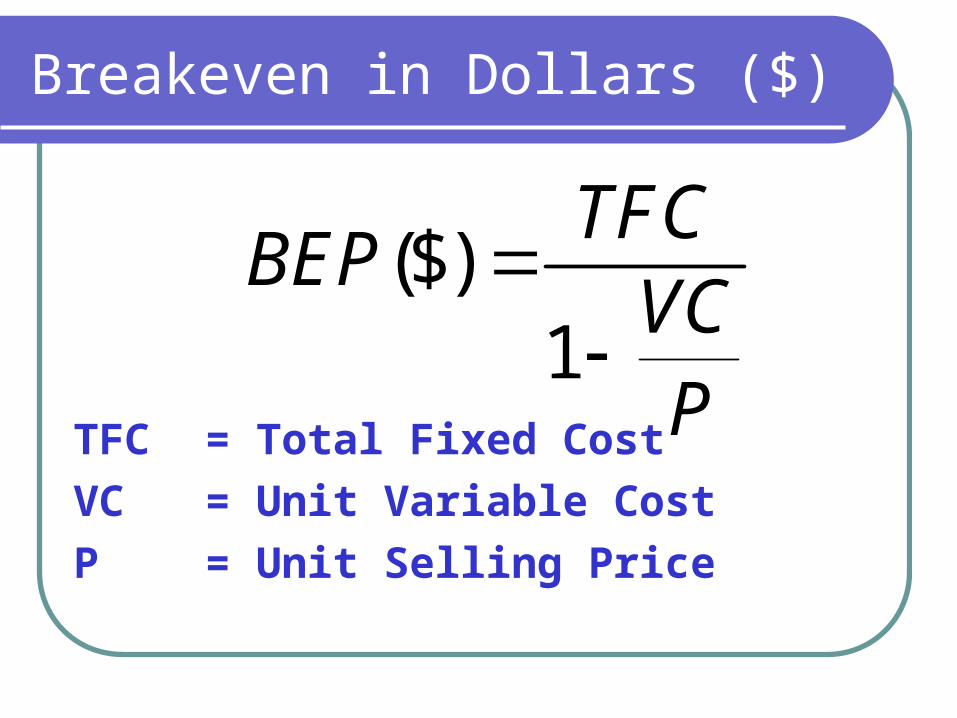
Breakeven in Dollars ($)
($)1
TFCBEP
VCP
TFC = Total Fixed Cost
VC = Unit Variable Cost
P = Unit Selling Price

Breakeven Example
A new process costs $10,000 to set upThe revenue earned is $25,000 per
1,000 units soldThe variable cost is $22.50 per unit
What is the BEP(x)?What is the BEP($)?
4,000
$100,000
Strategy Driven Investment
Select investments as part of a coordinated strategic plan
Choose investments yielding competitive advantage
Consider product life cycles Include a variety of operating factors in the
financial return analysisTest investments in light of several revenue
projections
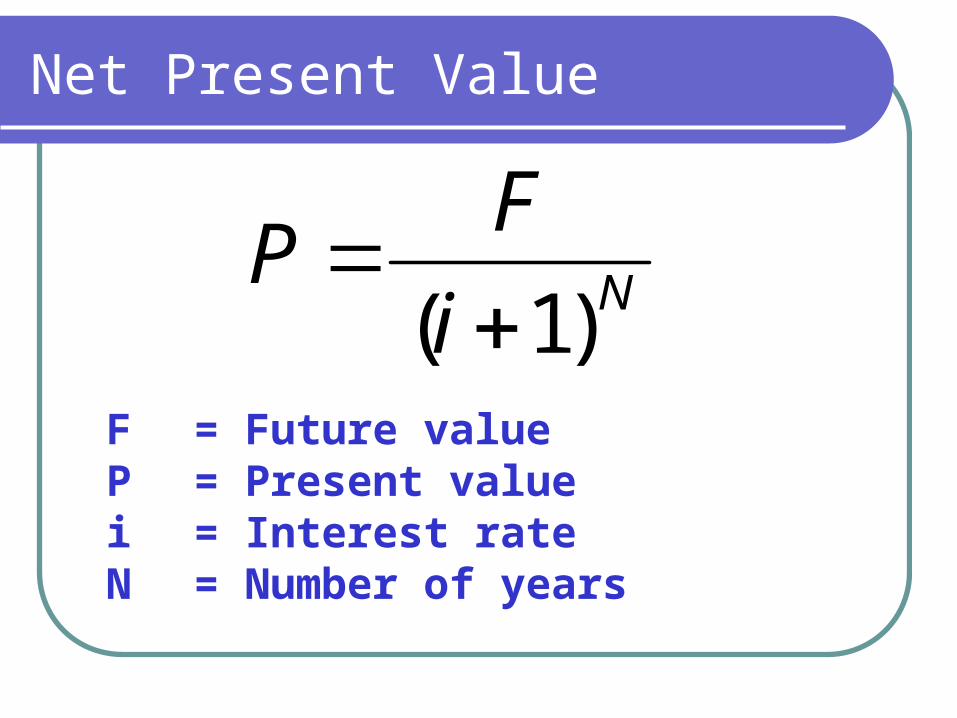
Net Present Value
Ni
FP
)1(
F = Future valueP = Present valuei = Interest rateN = Number of years

Net Present Value Example #1
A new machine costs $5,000 Over the 3 years of useful life of the machine it
produces revenues of $2,000 per year, paid at the end of each year
At the end of the 3rd year the machine is sold to a competitor for $1,000
What is the NPV of the investment if the company has a cost of capital of 10%?

NPV Solution #1
0 1 2 3 3
5,000 2,000 2,000 2,000 1,000
(1.1) (1.1) (1.1) (1.1) (1.1)NPV
NPV = $725.02

Net Present Value Example #2
Machine A Price = $15,000 Maintenance costs =
$5,000 at the end of each of 3 years
Salvage value = $2,000 at the end of year 3
Discount rate = 10%
Machine B Price = $20,000 Maintenance costs =
$4,000 at the end of each of 3 years
Salvage value = $7,000 at the end of year 3
Discount rate = 10%

NPV Solution #2
Which machine should the production manager buy?
0 1 2 3 3
15,000 5,000 5,000 5,000 2,000
(1.1) (1.1) (1.1) (1.1) (1.1)ANPV
0 1 2 3 3
20,000 4,000 4,000 4,000 7,000
(1.1) (1.1) (1.1) (1.1) (1.1)BNPV
NPVA = -25,931.63
NPVB = -24,688.20
Machine B

Limitations of Net Present Value
Investments with the same present value may have significantly different project lives and different salvage values
Investments with the same net present values may have different cash flows
We assume that we know future interest rates - which we do not
We assume that payments are always made at the end of the period - which is not always the case