Embed Size (px)
Citation preview

Attachment 8.3
Capacity Management Plan
2016/17 to 2020/21 Access Arrangement Information

ATTACHMENT 8.3: CAPACITY MANAGEMENT PLAN
AUSTRALIAN GAS NETWORKS SA ACCESS ARRANGEMENT INFORMATION JULY 2015 I

SOUTH AUSTRALIA NETWORKS
CAPACITY MANAGEMENT PLAN
ACCESS ARRANGEMENT INFORMATION
ATTACHMENT 8.3
June 2015
Prepared By
National Manager, Asset Strategy & Planning
Approved By: General Manager, South Australian Networks Manager Operations & Engineering, AGN

Page 2 of 33
Distribution List
Title Group Manager Networks
General Manager, SA Networks
Manager Planning & Engineering
Manager, SA Networks Operations
Manager, Capital Works
National Manager, Asset Strategy & Planning
National Manager, Mains Replacement Program
Manager Operations & Engineering - AGN
Reference Documents
Date Title June 2014 SA Distribution System Performance Review (DSPR) - 2014
Page 3 of 33
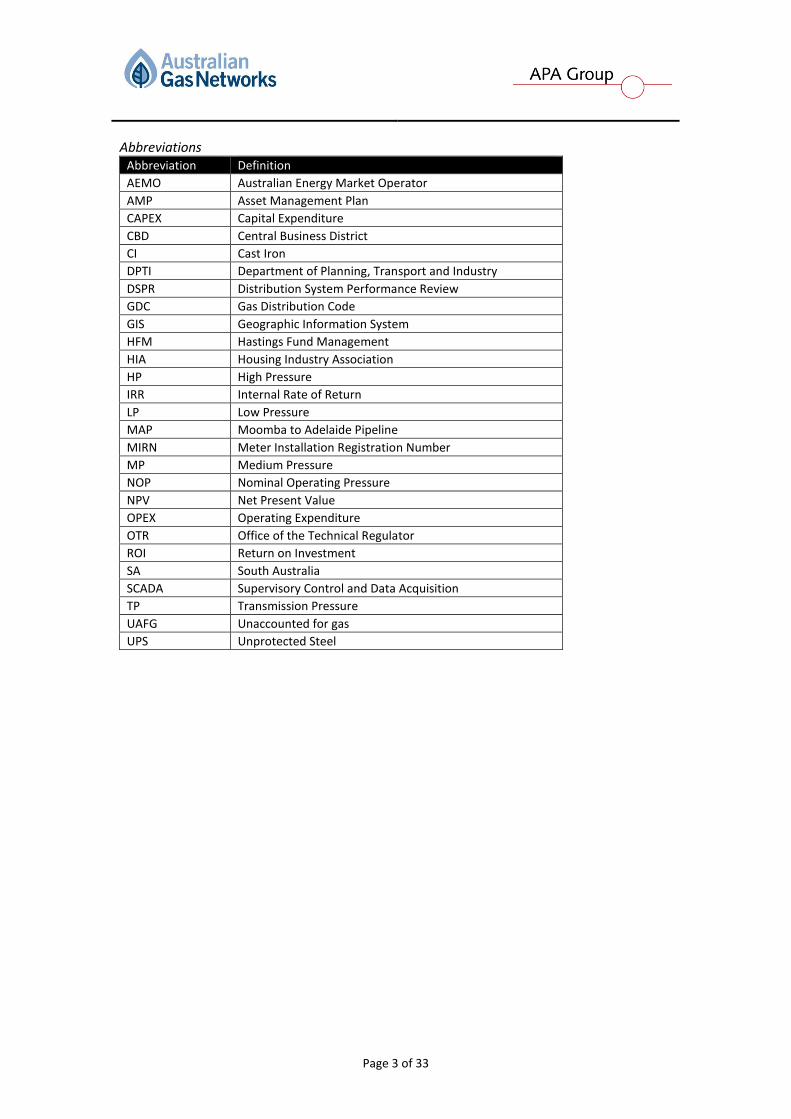
Abbreviations Abbreviation Definition
AEMO Australian Energy Market Operator
AMP Asset Management Plan
CAPEX Capital Expenditure
CBD Central Business District
CI Cast Iron
DPTI Department of Planning, Transport and Industry
DSPR Distribution System Performance Review
GDC Gas Distribution Code
GIS Geographic Information System
HFM Hastings Fund Management
HIA Housing Industry Association
HP High Pressure
IRR Internal Rate of Return
LP Low Pressure
MAP Moomba to Adelaide Pipeline
MIRN Meter Installation Registration Number
MP Medium Pressure
NOP Nominal Operating Pressure
NPV Net Present Value
OPEX Operating Expenditure
OTR Office of the Technical Regulator
ROI Return on Investment
SA South Australia
SCADA Supervisory Control and Data Acquisition
TP Transmission Pressure
UAFG Unaccounted for gas
UPS Unprotected Steel

Page 4 of 33
PREFACE The objective of this Capacity Management Plan (CMP) is to document:
The current capacity performance of AGN’s SA Distribution Networks;
The basis for maintaining capacity within AGN’s South Australian Distribution Networks;
Projected load growth and other drivers for network augmentation; and
The scope, timing and budget estimates of augmentation projects required to cost effectively sustain network growth and maintain a safe and reliable supply of gas to consumers.
The body of the CMP is structured into 3 Sections:
Section 1 – General – This section contains an overview of the South Australia networks and associated assets covered by this plan, and the processes associated with network capacity management
Section 2 – Network Supply and Demand – This section sets out the demand forecasts, network performance and augmentation requirements.
Section 3 – Appendices – This section contains more detailed information on the SA metro network and the location of gate states.

Page 5 of 33
Update and review cycle The development of this plan is part of the overall asset management planning year-round process with two parallel streams of work:
Stream 1: Ongoing monitoring of asset performance and the ongoing monitoring of implementation of the previous year’s Asset Management Plan (AMP) projects.
Stream 2: Review of asset performance, risk assessment, development of technical solutions, development of budgets and securing approvals for future projects.
Revision and Update of the Plan The Manager, Asset Strategy & Planning, is responsible for revising and updating this plan.
Bu
sin
ess
Drive
rs
Ass
et P
erf
orm
an
ce
Ta
rge
ts
Systematic and Ad-hoc Issue Management
De
velo
p S
cen
ario
s
Pre
sen
t B
udg
ets
Ongoing Planning Activities
Nov - Feb Mar - Apr May - Jun Jul - Oct
Collate the Draft
AMP with All
Scenarios
Management / Client
Endorsement
Obtained for AMP
Present Budgets for
Management/ Client
approved
Review the status of
programs from the
previous year’s AMP
Submit and Discuss
Draft AMP with
Management / Client
AMP Finalised
(includes all
scenarios)
Initiate the
development of the
next AMP
Ongoing Monitoring of AMP Implementation
Op
tion
s co
ste
d
Re
vie
w
Ass
ets
De
velo
p O
ptio
ns
Asset Management Plan development and Planning Activities cycle. Time-line based on
standard July – June Financial Year, it can be adjusted to contract requirements.
Bu
sin
ess
Drive
rsB
usi
ness
Drive
rs
Ass
et P
erf
orm
an
ce
Ta
rge
ts
Systematic and Ad-hoc Issue Management
De
velo
p S
cen
ario
s
Pre
sen
t B
udg
ets
Ongoing Planning Activities
Nov - Feb Mar - Apr May - Jun Jul - Oct
Collate the Draft
AMP with All
Scenarios
Management / Client
Endorsement
Obtained for AMP
Present Budgets for
Management/ Client
approved
Review the status of
programs from the
previous year’s AMP
Submit and Discuss
Draft AMP with
Management / Client
AMP Finalised
(includes all
scenarios)
Initiate the
development of the
next AMP
Ongoing Monitoring of AMP Implementation
Op
tion
s co
ste
d
Re
vie
w
Ass
ets
De
velo
p O
ptio
ns
Op
tion
s co
ste
d
Re
vie
w
Ass
ets
De
velo
p O
ptio
ns
Asset Management Plan development and Planning Activities cycle. Time-line based on
standard July – June Financial Year, it can be adjusted to contract requirements.

Page 6 of 33
SECTION 1 - GENERAL ....................................................................... 8
NETWORK OVERVIEW ............................................................................................ 8 1.1 SOURCES OF SUPPLY.............................................................................................. 8 1.2 NETWORK CONFIGURATION .................................................................................... 9 1.3
Network Pressure Tiers ....................................................................................................... 9 1.3.1 Pipe Material and Length ................................................................................................. 10 1.3.2
CAPACITY MANAGEMENT ..................................................................................... 11 1.4 Capacity Management Approach ..................................................................................... 11 1.4.1 Capacity Management Process ........................................................................................ 13 1.4.2 Economic Regulation ........................................................................................................ 15 1.4.3 Capacity Assessment Criteria ............................................................................................ 15 1.4.4 Security of Supply .............................................................................................................. 16 1.4.5 Network Risk Assessment ................................................................................................. 16 1.4.6
SECTION 2 - NETWORK SUPPLY AND DEMAND ................................ 17
HISTORIC PEAK HOUR DEMAND ............................................................................ 17 2.1 Adelaide Network ............................................................................................................. 17 2.1.1 Regional Networks ............................................................................................................ 18 2.1.2
ANNUAL DEMAND .............................................................................................. 19 2.2 Adelaide Network ............................................................................................................. 19 2.2.1 Regional Networks ............................................................................................................ 21 2.2.2
CUSTOMER CONNECTIONS ................................................................................... 23 2.3 Tariff V (<10 TJ) MIRN Count ............................................................................................ 23 2.3.1 Tariff D (>10 TJ) MIRN Count ............................................................................................ 24 2.3.2 Forecast Connections ........................................................................................................ 24 2.3.3 Step Out Developments .................................................................................................... 25 2.3.4
DEMAND .......................................................................................................... 25 2.4 Adelaide TP Network Tariff D Peak Hour Demand............................................................ 25 2.4.1 Adelaide TP Network Tariff V Peak Hour Demand ............................................................ 26 2.4.2 Adelaide TP Network Peak Hour Demand Forecast .......................................................... 27 2.4.3
NETWORK PERFORMANCE .................................................................................... 28 2.5 NETWORK AUGMENTATION SUMMARY ................................................................... 30 2.6
SECTION 3 - APPENDICES ................................................................ 31
APPENDIX 1 – SA METRO NETWORK ................................................................................ 32
APPENDIX 2 – GATE STATION LOCATIONS .......................................................................... 33
Page 7 of 33
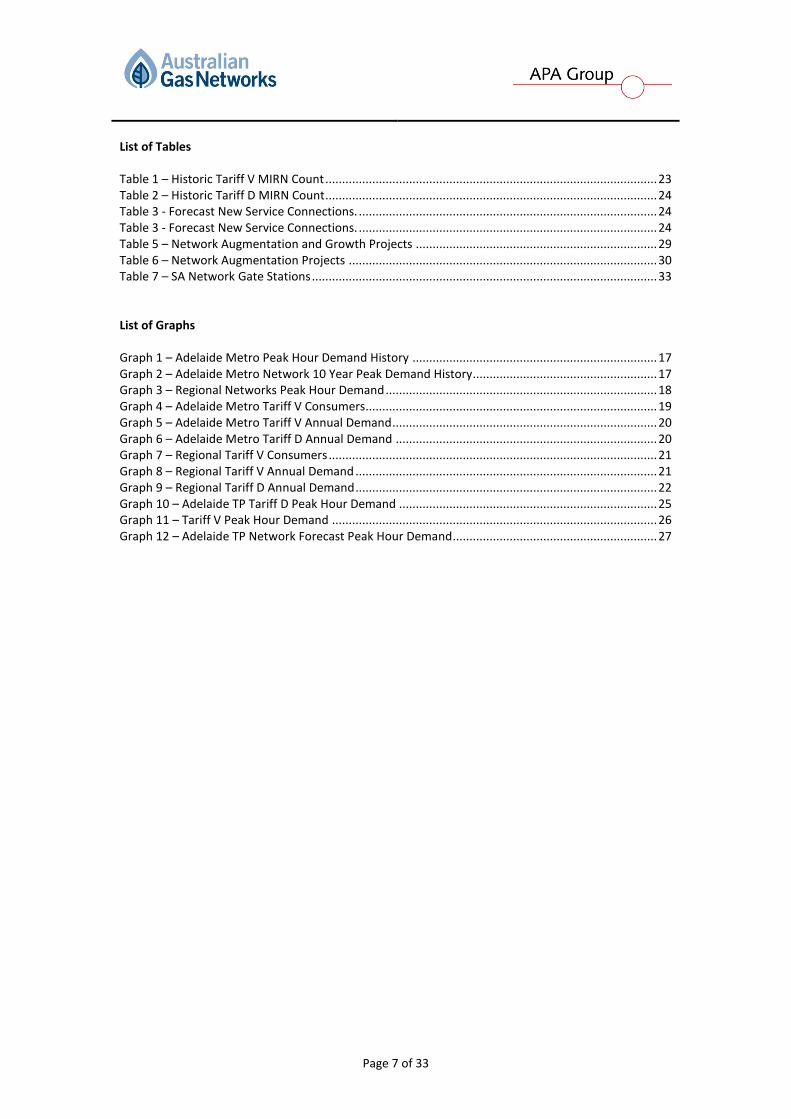
List of Tables Table 1 – Historic Tariff V MIRN Count ................................................................................................... 23 Table 2 – Historic Tariff D MIRN Count ................................................................................................... 24 Table 3 - Forecast New Service Connections. ......................................................................................... 24 Table 3 - Forecast New Service Connections. ......................................................................................... 24 Table 5 – Network Augmentation and Growth Projects ........................................................................ 29 Table 6 – Network Augmentation Projects ............................................................................................ 30 Table 7 – SA Network Gate Stations ....................................................................................................... 33 List of Graphs Graph 1 – Adelaide Metro Peak Hour Demand History ......................................................................... 17 Graph 2 – Adelaide Metro Network 10 Year Peak Demand History....................................................... 17 Graph 3 – Regional Networks Peak Hour Demand ................................................................................. 18 Graph 4 – Adelaide Metro Tariff V Consumers....................................................................................... 19 Graph 5 – Adelaide Metro Tariff V Annual Demand ............................................................................... 20 Graph 6 – Adelaide Metro Tariff D Annual Demand .............................................................................. 20 Graph 7 – Regional Tariff V Consumers .................................................................................................. 21 Graph 8 – Regional Tariff V Annual Demand .......................................................................................... 21 Graph 9 – Regional Tariff D Annual Demand .......................................................................................... 22 Graph 10 – Adelaide TP Tariff D Peak Hour Demand ............................................................................. 25 Graph 11 – Tariff V Peak Hour Demand ................................................................................................. 26 Graph 12 – Adelaide TP Network Forecast Peak Hour Demand............................................................. 27

Page 8 of 33
SECTION 1 - GENERAL
Network Overview 1.1
This section documents AGN’s principal gas distribution networks managed from South Australia, and the associated assets within those networks. Refer to Appendix 1 for map details.
Sources of Supply 1.2
AGN’s SA managed networks (apart from Mt Gambier) are supplied with natural gas from:
The Moomba to Adelaide Pipeline (MAP) - An 800 km 520 mm diameter pipeline delivering gas to all of AGN’s South Australian networks except Mt Gambier. This pipeline is owned and operated by EPIC Energy (Epic).
The SEAGas Pipeline (Port Campbell (Victoria) to Adelaide) - A 680 km 455mm diameter pipeline delivering gas to AGN’s Adelaide and Mt Gambier networks. This pipeline is owned and operated by SEAGas Ltd.
Gas is delivered into AGN’s networks via gate or custody transfer stations owned by Epic or SEAGas Ltd. These stations consist of facilities that control the delivery pressures and measure the quantity and quality of gas delivered into AGN’s networks. AGN has access to metering facilities data through interface agreements. The table below summarises AGN’s principal networks (excluding Riverland, see below) along with their respective (EPIC and/or SEAGas) supply points. Refer to Appendix 2 for details.
Network Gate/Custody Station Location
Adelaide Metro - ADL
Elizabeth Gate Station
Taperoo Gate Station
Dry Creek Gate Station
SEAGas Dry Creek
Nuriootpa - NURI Nuriootpa Gate Station (Tanunda Road)
Freeling - FRL Stockwell Road
Angaston - ANG Gawler Road
Whyalla - WHY Lincoln Highway Gate Station
Port Pirie - PTPR Warnertown Road - Solomontown
Mount Gambier - MTG Nick Lyons Road
Peterborough - PTB Cotton Road
Waterloo - WTL Tozer Road
Virginia - VRG Park Road
AGN owns and operates gate stations in its Riverland network which are used to deliver gas to several sub networks. Although connected to AGN’s transmission system main rather than directly from the MAP or SEAGas Pipeline, they are deemed gate station supply points under the SA Retail Market Procedures. The table below summarises the supply points to the discrete sub networks within the Riverland gas network.

Page 9 of 33
Network Gate/Custody Station Location
Riverland - RVLD Upstream of Angaston Compressor Station
Murray Bridge Eleanor Terrace, Murray Bridge
Berri Winkie Rd, Berri
Mildura 20th Ave, Mildura
Network Configuration 1.3
The following diagram provides an overview of a gas distribution network’s key components. Connections between pipelines at different pressures are achieved through district regulator stations (DRSs).
Gate Station
(Custody Transfer)
Transmission
Pressure
(TP) Pipeline
High Pressure
(HP) Pipeline
Medium
Pressure
(MP) Pipeline
Low
Pressure
(LP) Pipeline
Network
Service Pipe
Meter (MIRN)
= Pressure Reducer eg regulator
MAP SEAGAS
HP MP LPTP
SCADA
SCADA
SCADA
SCADA
Network Pressure Tiers 1.3.1 The network operates with four pressure tiers as defined in the following table.
Pressure Regime Definition
Transmission Pressure (TP) MAOP exceeds 1050 kPa
High Pressure (HP) MAOP between 210 kPa and 1050 kPa
Medium Pressure (MP) MAOP between 7 kPa and 210 kPa
Low Pressure (LP) MAOP up to 7 kPa
AGN’s networks are operated at pressures within the nominated maximum and minimum allowable operating pressures. Emergency over pressure control is provided on all networks to ensure the nominated MAOP is not exceeded.

Page 10 of 33
Each network has its own defined operating range depending on the network configuration and capacity requirements. Operating pressures may vary seasonally, depending on the annual load profile. AGN’s networks nominal operating pressure ranges are summarised in the following table. Actual operating pressures may vary around these nominal values but in all cases pressures are maintained below the specific MAOP of the network.
SA Networks Nominal Operating Ranges - kPa
Network TP1 TP2 High Medium Low
ADELAIDE 800-1750 70-350 35-100 1.2-1.7
ANGASTON 2800-7000 70-350
BERRI 2800-7000 70-350 35-100
FREELING 70-350
MILDURA 2800-7000 70-350
600-800
MT GAMBIER 250-475 35-200 1.2-1.7
MURRAY BRIDGE 2800-7000 700-1650 70-350
NURIOOTPA 2800-7000 70-350
PT BONYTHON 70-350
PT PIRIE 70-350
VIRGINIA 70-350
WASLEYS 70-350
WATERLOO CORNER 70-350
WHYALLA 35-100
TP1 – Transmission pressure pipelines to regional networks TP2 – Transmission pressure pipelines within distribution networks
Minimum pressures have been nominated based on the following considerations:
Maintaining sufficient capacity to ensure variation in demand, caused by weather and/or consumer diversity, does not result in loss of supply;
Meeting minimum inlet design pressures to ensure effective pressure control by district regulators feeding lower tier networks is maintained;
Maintaining a minimum of 1.0 kPa at the outlet of domestic meters; and
Meeting designated supply pressures for I&C meters.
Pipe Material and Length 1.3.2
The following tables set out the inventory of all mains within AGN’s Adelaide and Regional (excluding Riverland and Berri Mildura) transmission and distribution networks as of 30 June 2014.
Adelaide Metro Distribution Network Installed Mains (30 June 2014) - km
Network PE CI UPS PS Total
LP 428 763 75 37 1,303
MP 1,918 68 11 388 2,385
HP 2,422 0 0 1,091 3,513
TP 0 0 0 190 190
TOTAL 4,768 830 86 1,706 7,390

Page 11 of 33
Regional Distribution Networks
Installed Mains (30 June 2014) - km
Network PE CI UPS PS Total
LP 19 3 14 2 38
MP 164 0 5 101 270
HP 191 0 0 38 229
TP 0 0 0 18 18
TOTAL 374 3 19 159 556
Length of Mains (30 June 2014) - km
Network Distribution
Mains
TP
Mains Total
Adelaide Metropolitan 7,200 190 7,390
Mount Gambier 213 0 213
Murray Bridge 30 1.9 32
Angaston 13 0 13
Nuriootpa 30 0.4 30.4
Berri 9 10.3 19.3
Freeling 8 0 8
Port Pirie 125 5.6 130.6
Whyalla 103 0 103
Peterborough 5 0 5
Snuggery 0 0.8 0.8
Grand Total 7,736 209 7,945
Capacity Management 1.4
This section details the philosophy, process and criteria that underpin supply and demand management within AGN’s SA networks.
Capacity Management Approach 1.4.1 Network capacity is managed by:
Monitoring network performance;
Assessing forecast demand;
Assessing threats to supply; and

Page 12 of 33
Addressing the above according to the risk they present, balancing the costs of doing so against the benefits of expending limited resources elsewhere in the network.
Network capacity is managed to avoid:
Potentially hazardous conditions for consumers should momentary loss of supply occur as result of insufficient pressure;
Disruption to the community; and
Breaching regulatory obligations. Network capacity is augmented when:
The minimum pressure in a network falls, or is forecast to fall, below the recommended minimum end of main pressure during design load conditions. Design load conditions take into account seasonality, consumer type, load profile and other factors that contribute to peaks in demand.
There is insufficient redundancy within the network, which adversely affects the security of supply to a large number of consumers.

Page 13 of 33
Capacity Management Process 1.4.2 The capacity management process is summarised in the following schematic.
Network Model Validation
TelemeterPressures
Chart Recorder
Pressures
Demand Sites
Metered
Consumption
Gate Station
Metered Flow
Network Pressures & Flows
Load Growth File
Creation
Planning Development Forecasts
HIAHousing Forecast
Network MarketingForecasts
Load Forecast
Normalise1:n Winter
Weather Data
Balanced Networkto Field Conditions
Network ScenarioModelling
NormalisedBase Network Models
ForecastHourly
Demand & Location
NetworkDesign & Review
ReinforcementRequirements
Alternative Options
Mains ReplacementPlanning
Project Definition&
Costing
Asset Performance Data
Strategic Replacement Mains
Risk Assessment
Island Networks
NetworksLimited PRS Redundancy
NetworksCritical Supply Mains
Risk Areas
RecommendedAugmentation
Projects
Consequence of Interest Projects
Network Augmentation
Plan
Project Briefs
NETWORK AUGMENTATION PROCESS
NormalisedBaselineLoad File
Severe Winter Model
Demand SiteHourly Consumption
Data
Non CoincidentWinter Peak
Demand Consumption
Mains
Replacement
Programme
Block Piecemeal
GIS
Network Configuration
Figure 1 – Capacity management Process
Capacity Management involves the following key activities:
1. Maintaining Baseline Capacity Models - Meter to main connectivity configuration is maintained within the GIS. Network configurations are exported across into capacity modelling software (Synergee) where network models are validated against actual field conditions using gate station inputs, actual large volume customer hourly demand, actual system pressures and derived Tariff R and Tariff C loads based on billing history maintained with the Billing System.
Computer models are iteratively balanced so that modelled pressures match those from the field.
2. Design Load Assessment - Tariff R and C design loads are derived from the validated baseline
network load, corrected to allow for additional consumption consistent with a 1 in 25 year winter’s day. This is based on +/- 95% confidence levels of the network 20-year peak hour supply trend line. This approach also normalises for variation in Tariff R and C consumer usage patterns not related to cold weather.

Page 14 of 33
Tariff D customer load is normalised on the basis of variation in consumption during the daily peak hour period throughout winter.
3. Forecasting Load Growth - Department of Planning Transport and Industry
1 (DPTI) and HIA
statistics as well as internal marketing trend analysis and expert projections where available are used to forecast the number and location of new residential connections.
Internal market trend analysis is used to determine the rate of new connections for I&C and Demand market sectors.
The additional connections are converted to an expected hourly demand at specific locations within the network. The output of this process is an annual load growth file that is superimposed on the network model to identify future capacity constraints.
4. Network Scenario Modelling - A computer based network modelling application (Synergee) is
used to evaluate various load scenarios and augmentation options. Capacity shortfalls are identified and solutions modelled to confirm augmentation requirements.
5. Mains Replacement Planning- The identification of mains for replacement involves assessing key operating data (leaks, supply pressures, gas outages, risk analysis). Priority areas are identified from which detailed replacement strategies are formulated. In some instances “redundant” mains may be abandoned and in others additional supply mains may be required to facilitate replacement. The output of this process is combined with capacity and security of supply issues to optimise the location and size of principal supply mains within the network.
6. Project Initiation - The various capacity, replacement and security of supply issues are
reviewed and options considered. A recommended solution is defined and submitted for inclusion into a 5-year augmentation plan. The plan is reviewed annually to confirm the timing and scope of proposed projects.
7. Project Business Cases – A business case is prepared for projects identified for
implementation within the budget year and approved in line with the appropriate Delegation of Authority.
Each project’s business case addresses:
Scope, cost and timing
Background to the project
The options considered
The recommended option, and its justification
An economic analysis
A risk assessment
Compliance with regulatory “Conforming Expenditure” requirements (see below)
Cost Breakdown
1 Previously referred to as Planning SA

Page 15 of 33
Economic Regulation 1.4.3
Augmentation expenditure must conform to the National Gas Rules 79 (1) and (2).
The processes employed by AGN ensure that augmentation expenditure meets the requirements of the National Gas Rules.
Capacity Assessment Criteria 1.4.4 Tariff R and C design loads are based on peak hour loads expected during a 1 in 25 year event. Typically, an additional 10 - 15% to the actual peak day/peak hour demand is applied to cater for the effects of cold weather and variability in consumer usage patterns. Tariff D loads are not considered temperature sensitive. Tariff D design loads are based on observed peak hour actual during the peak evening period during winter. Detailed connection and load growth data is provided in section 2 of this document.
National Gas Rules Capital Expenditure Criteria Rule 79 (1) Conforming capital expenditure is capital expenditure that conforms with the following criteria:
The capital expenditure must be such as would be incurred by a prudent service provider acting efficiently, in accordance with accepted good industry practice, to achieve the lowest sustainable cost of providing services;
The capital expenditure must be justifiable on a ground stated in sub rule (2). (2) Capital expenditure is justifiable if:
a) The overall economic value of the expenditure is positive; or b) The present value of the expected incremental revenue to be generated as a
result of the expenditure exceeds the present value of the capital expenditure; or c) The capital expenditure is necessary:
i. to maintain and improve the safety of services; or
ii. to maintain the integrity of services; or iii. to comply with a regulatory obligation or requirement; or iv. to maintain the service provider’s capacity to meet levels of demand for
services existing at the time the capital expenditure is incurred (as distinct from projected demand that is dependent on an expansion of pipeline capacity).
d) The capital expenditure is an aggregate amount divisible into 2 parts, one
referable to incremental services and the other referable to a purpose referred to in paragraph (c), and the former is justifiable under paragraph (b) and the latter under paragraph (c).

Page 16 of 33
Security of Supply 1.4.5 Gas is regarded by the community as an essential service, with an accompanying expectation that it will be uninterruptible under all but the most extreme (force majeure) events. Historically, risks to supply arising from network failure have been considered relatively low probability events, with the network configuration typically providing intrinsic capacity to cater for such events.
Scenarios where a single point of failure could result in significant number of consumers losing supply are evaluated based on cost and risk with additional mains, regulators, surveillance equipment specified where appropriate.
Network Risk Assessment 1.4.6
All Network augmentation projects are assessed using an established risk matrix and prioritisation criteria to provide a relative risk rating as part of prioritisation of stay in business Capex projects. Further details on the risk assessment framework can be found in Section 3.3 of the Asset Management Plan.

Page 17 of 33
SECTION 2 - NETWORK SUPPLY AND DEMAND
This section provides an overview of network supply and demand issues. Details of network performance (peak day analysis) are detailed in the 2014 South Australian networks Distribution System Performance Review (DSPR)
Historic Peak Hour Demand 2.1
Adelaide Network 2.1.1
Graph 1 – Adelaide Metro Peak Hour Demand History
Graph 2 – Adelaide Metro Network 10 Year Peak Demand History
0
20,000
40,000
60,000
80,000
100,000
120,000
140,000
160,000
180,000
200,000
Flo
w (
m3/h
r)
Adelaide Metro Network - 40 Yr Peak Hr Demand
2004 2005 2006 2007 2008 2009 2010 2011 2012 2013 2014
Total 182,500 189,935 194,866 188,948 185,487 175,683 186,672 169,639 174,425 159,955 175,756
Tariff D 47,616 61,834 60,146 58,157 51,049 49,759 44,819 52,332 45,775 41,715 41,404
Tariff V 134,884 128,101 134,720 130,791 134,438 125,924 141,853 117,307 128,650 118,240 134,352
25,000
75,000
125,000
175,000
225,000
Flo
w (
m3
/hr)
Adelaide Metro Network - 10 Yr Peak Hour Demand

Page 18 of 33
The following key points to note from the trends relating to the trend in peak consumption in the Adelaide Network area are as follows:.
The Adelaide transmission network has been assessed as having sufficient capacity to cater for a 1:25 year demand event. The 1:25 criterion was associated with a 95% upper confidence level around the long term (20 year) peak hour trend line. The trend in peak hour consumption has been at the lower bound of expectations and over the last 5 years, below the 1:25 year lower confidence level. A combination of more energy efficient house designs, a declining manufacturing sector and reduced gas heating loads (due to reverse cycle air conditioning) are contributing to changes in peak hour network demand. This has been offset to some extent by use of high instantaneous demand gas hot water services. As a result of the decrease in peak hour demand, the 1:25 network demand design criterion has been revised downwards. This has effectively reduced the design “margin” to a less conservative level, extending the capacity life of the network, and deferring augmentation that otherwise may have been required.
The impending closure of the Elizabeth GMH plant in 2017 is expected to free up capacity in the northern region of the Adelaide metropolitan area.
Shippers faced significant ‘imbalance’ costs during the 2013 winter due to a physical constraint of delivering gas from the SEAGAs Pipeline into the northern areas of the Adelaide network. To assist market operation, a key valve in the network (previously closed to facilitate flows within the network) was opened in July 2014 to enable more gas from western Victoria to flow into the northern region of the Adelaide network.
Regional Networks 2.1.2
Graph 3 – Regional Networks Peak Hour Demand
2006 2007 2008 2009 2010 2011 2012 2013 2014
PORT PIRIE 6,203 5,217 5,180 4,921 5,233 5,372 5,531 5,689 5,282
MT GAMBIER 4,453 4,974 4,439 4,340 5,326 5,148 4,563 5,188 4,891
MURRAY BRIDGE 2,332 2,578 2,522 2,443 2,423 2,396 2,521 2,428 2,572
BERRI 1,618 1,293 1,313 1,236 1,054 771 778 971 1,386
VIRGINIA 1,264 1,597 935 1,072 1,246 1,384 1,187 1,134 1,271
WHYALLA 967 858 1,585 847 928 862 850 873 886
ANGASTON 523 501 511 461 479 450 490 441 389
NURIOOTPA 3,249 2,764 3,096 2,779 2,835 2,812 2,352 2,511 2,320
PETERBOROUGH 299 284 317 334 302 254 299 278 356
FREELING 422 422 420 369 290 340 322 340 287
0
1,000
2,000
3,000
4,000
5,000
6,000
7,000
Peak H
ou
r F
low
- m
³/h
r
Regional Networks - Peak Hour Demand

Page 19 of 33
The key points to note from the trends in peak consumption in the regional networks are as follows:
Demand across regional networks has been relatively flat over the last few years with no substantial increase forecast over the next regulatory period.
The demand through the Mount Gambier and Port Pirie gate stations is at about 80% of capacity. The capacity of the gate stations will be monitored carefully over the next few years.
Demand at the Murray Bridge Township is approaching the capacity of the supply main between the Murray Bridge gate station and the township regulator. Augmentation of this main is planned during the next regulatory period.
Annual Demand 2.2
Adelaide Network 2.2.1
Graph 4 – Adelaide Metro Tariff V Consumers
2003 2004 2005 2006 2007 2008 2009 2010 2011 2012 2013 2014
Residential 321,128 327,094 332,530 339,870 347,906 355,689 362,068 368,380 375,805 382,415 388,587 394,231
I&C 8337 8389 8976 9062 8850 9015 9155 9292 9422 9574 9618 9756
-
50,000
100,000
150,000
200,000
250,000
300,000
350,000
400,000
450,000
Co
nsu
me
r N
os
Adelaide Metro Network Tariff V Consumers

Page 20 of 33
Graph 5 – Adelaide Metro Tariff V Annual Demand
Graph 6 – Adelaide Metro Tariff D Annual Demand
The following key points to note from the trends in annual demand in the Adelaide network are set out below.
Tariff V customer growth has been very consistent over the last 10 years with an annual growth rate of about 1.9%.
Tariff V annual demand has fallen by 10% over the last 10 years despite a 20% increase in consumer numbers over that period. The falling consumption is due to declining average consumption due to a combination of more efficient housing designs, reduction of gas heating loads (with consumers choosing reverse cycle air conditioning) and a downturn in manufacturing.
2003 2004 2005 2006 2007 2008 2009 2010 2011 2012 2013 2014
Residential 7,302 7,724 7,351 7,502 7,335 7,095 7,427 7,132 7,886 7,094 7,217 6,649
I&C 2,584 2,742 2,643 2,704 2,651 2,732 2,768 2,757 2,945 2,805 2,831 2,795
-
1,000
2,000
3,000
4,000
5,000
6,000
7,000
8,000
9,000
TJs
Adelaide Metro Network Tariff V Annual Demand
2005 2006 2007 2008 2009 2010 2011 2012 2013 2014
Total TJ 15,138 14,579 14,439 13,700 12,894 12,675 12,542 12,414 11,294 11,294
0
2,000
4,000
6,000
8,000
10,000
12,000
14,000
16,000
TJ
Adelaide Metro Network Tariff D (>10TJ) Annual Demand

Page 21 of 33
Regional Networks 2.2.2
Graph 7 – Regional Tariff V Consumers
Graph 8 – Regional Tariff V Annual Demand
2003 2004 2005 2006 2007 2008 2009 2010 2011 2012 2013 2014
Residential 14,224 14,556 14,901 15,240 15,684 16,273 16,828 17,457 18,026 18,397 18,781 19,133
I&C 652 663 687 687 683 702 727 732 737 744 756 740
-
5,000
10,000
15,000
20,000
25,000
Co
nsu
me
r N
os
SA Regional Networks Tariff V Consumers
2003 2004 2005 2006 2007 2008 2009 2010 2011 2012 2013 2014
Residential 308 320 311 323 329 329 352 339 383 344 353 346
I&C 211 219 213 214 236 263 265 254 248 225 229 211
-
50
100
150
200
250
300
350
400
450
TJ
SA Regional Networks Tariff V Annual Demand

Page 22 of 33
Graph 9 – Regional Tariff D Annual Demand
The key points to note from the trends in annual demand in the regional networks are set out below.
While regional Tariff V consumer numbers have increased by 30% over the last 10 years, there has been only a 3% increase in total annual demand over the same period.
Tariff D annual demand in regional networks has fluctuated in accordance with industry and economic factors, and this variable trend is likely to continue in the foreseeable future.
2005 2006 2007 2008 2009 2010 2011 2012 2013 2014
Total 219 187 150 201 206 212 247 202 184 228
0
50
100
150
200
250
300
TJ
SA Regional Networks Tariff D Annual Demand
Page 23 of 33
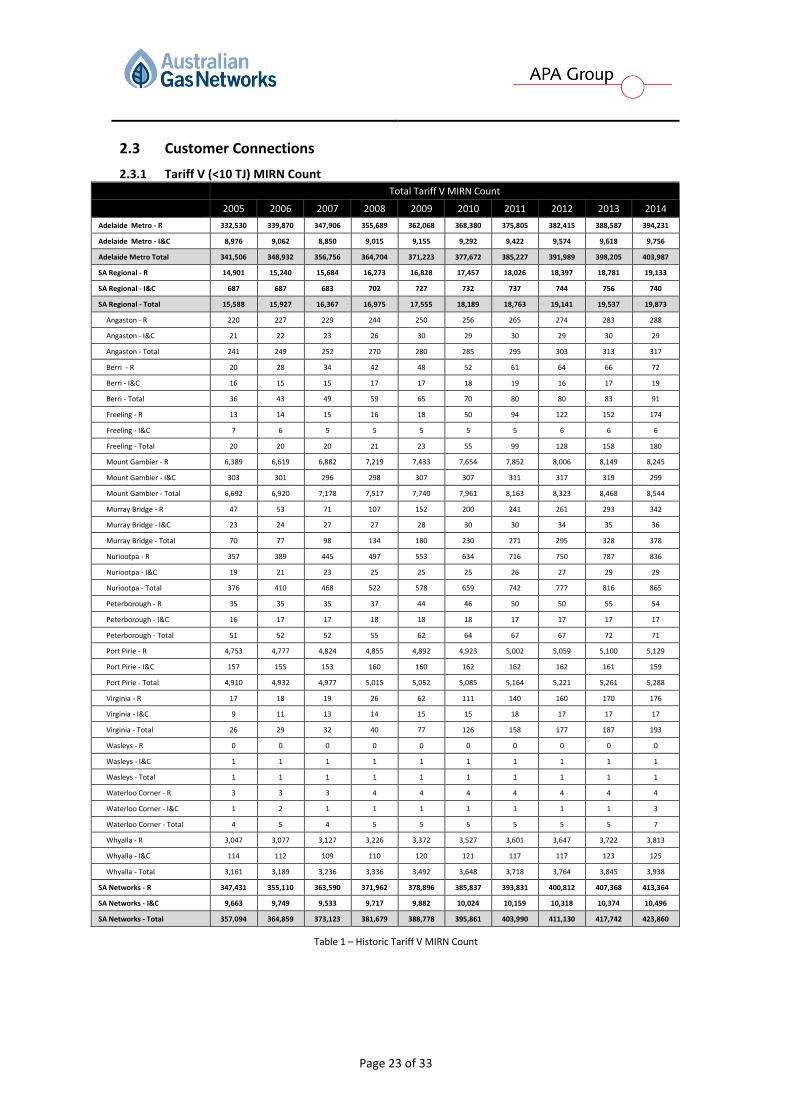
Customer Connections 2.3
Tariff V (<10 TJ) MIRN Count 2.3.1 Total Tariff V MIRN Count
2005 2006 2007 2008 2009 2010 2011 2012 2013 2014
Adelaide Metro - R 332,530 339,870 347,906 355,689 362,068 368,380 375,805 382,415 388,587 394,231
Adelaide Metro - I&C 8,976 9,062 8,850 9,015 9,155 9,292 9,422 9,574 9,618 9,756
Adelaide Metro Total 341,506 348,932 356,756 364,704 371,223 377,672 385,227 391,989 398,205 403,987
SA Regional - R 14,901 15,240 15,684 16,273 16,828 17,457 18,026 18,397 18,781 19,133
SA Regional - I&C 687 687 683 702 727 732 737 744 756 740
SA Regional - Total 15,588 15,927 16,367 16,975 17,555 18,189 18,763 19,141 19,537 19,873
Angaston - R 220 227 229 244 250 256 265 274 283 288
Angaston - I&C 21 22 23 26 30 29 30 29 30 29
Angaston - Total 241 249 252 270 280 285 295 303 313 317
Berri - R 20 28 34 42 48 52 61 64 66 72
Berri - I&C 16 15 15 17 17 18 19 16 17 19
Berri - Total 36 43 49 59 65 70 80 80 83 91
Freeling - R 13 14 15 16 18 50 94 122 152 174
Freeling - I&C 7 6 5 5 5 5 5 6 6 6
Freeling - Total 20 20 20 21 23 55 99 128 158 180
Mount Gambier - R 6,389 6,619 6,882 7,219 7,433 7,654 7,852 8,006 8,149 8,245
Mount Gambier - I&C 303 301 296 298 307 307 311 317 319 299
Mount Gambier - Total 6,692 6,920 7,178 7,517 7,740 7,961 8,163 8,323 8,468 8,544
Murray Bridge - R 47 53 71 107 152 200 241 261 293 342
Murray Bridge - I&C 23 24 27 27 28 30 30 34 35 36
Murray Bridge - Total 70 77 98 134 180 230 271 295 328 378
Nuriootpa - R 357 389 445 497 553 634 716 750 787 836
Nuriootpa - I&C 19 21 23 25 25 25 26 27 29 29
Nuriootpa - Total 376 410 468 522 578 659 742 777 816 865
Peterborough - R 35 35 35 37 44 46 50 50 55 54
Peterborough - I&C 16 17 17 18 18 18 17 17 17 17
Peterborough - Total 51 52 52 55 62 64 67 67 72 71
Port Pirie - R 4,753 4,777 4,824 4,855 4,892 4,923 5,002 5,059 5,100 5,129
Port Pirie - I&C 157 155 153 160 160 162 162 162 161 159
Port Pirie - Total 4,910 4,932 4,977 5,015 5,052 5,085 5,164 5,221 5,261 5,288
Virginia - R 17 18 19 26 62 111 140 160 170 176
Virginia - I&C 9 11 13 14 15 15 18 17 17 17
Virginia - Total 26 29 32 40 77 126 158 177 187 193
Wasleys - R 0 0 0 0 0 0 0 0 0 0
Wasleys - I&C 1 1 1 1 1 1 1 1 1 1
Wasleys - Total 1 1 1 1 1 1 1 1 1 1
Waterloo Corner - R 3 3 3 4 4 4 4 4 4 4
Waterloo Corner - I&C 1 2 1 1 1 1 1 1 1 3
Waterloo Corner - Total 4 5 4 5 5 5 5 5 5 7
Whyalla - R 3,047 3,077 3,127 3,226 3,372 3,527 3,601 3,647 3,722 3,813
Whyalla - I&C 114 112 109 110 120 121 117 117 123 125
Whyalla - Total 3,161 3,189 3,236 3,336 3,492 3,648 3,718 3,764 3,845 3,938
SA Networks - R 347,431 355,110 363,590 371,962 378,896 385,837 393,831 400,812 407,368 413,364
SA Networks - I&C 9,663 9,749 9,533 9,717 9,882 10,024 10,159 10,318 10,374 10,496
SA Networks - Total 357,094 364,859 373,123 381,679 388,778 395,861 403,990 411,130 417,742 423,860
Table 1 – Historic Tariff V MIRN Count

Page 24 of 33
Tariff D (>10 TJ) MIRN Count 2.3.2
Tariff D MIRN Count
2005 2006 2007 2008 2009 2010 2011 2012 2013 2014
Adelaide Metro 144 141 142 139 138 135 132 130 122 122
SA Regional 10 10 9 9 9 8 8 8 8 8
Total 154 151 151 148 147 143 140 138 130 130
Table 2 – Historic Tariff D MIRN Count
Forecast Connections 2.3.3For
The following table sets out the forecast new service connections (gross connections) as developed by the Commercial group. These are offset to some extent by about 1,500 annual disconnections which have not been taken into account in the table below.
Forecast New Service Connections
FY
15/16 FY
16/17 FY
17/18 FY
18/19 FY
19/20 FY
20/21 Total AA
New Home Connections 5,282 4,886 4,592 4,781 5,093 5,306 24,658
Existing Home Connections 1,435 1,435 1,435 1,435 1,435 1,435 7,175
Multi User Connections 579 498 464 463 547 544 2,516
Total Domestic connections 7,296 6,819 6,491 6,679 7,075 7,285 34,349
I&C <10TJ connections 220 259 229 272 277 281 1,318
I&C >10TJ connections 0 1 0 0 0 0 1
Total I&C Connections 220 260 229 272 277 281 1,319
Total Connections 7,516 7,079 6,720 6,951 7,352 7,566 35,668
Table 3 - Forecast New Service Connections.
Based on historic trends about 95% of connections will be within the Adelaide metropolitan area and of these about 50% will be within the central region, 30% in the northern region and 20% in the southern region. The following table summarises the top 20 growth suburbs based on the average residential MIRN count over the 2012 and 2013 calendar years.
Suburb MIRN Count Growth
2 Year Average Dec 2013
ANDREWS FARM 215
NORTHGATE 212
MAWSON LAKES 178
SEAFORD MEADOWS 165
MUNNO PARA 156
BLAKEVIEW 150
MUNNO PARA WEST 146
GOLDEN GROVE 110
MORPHETT VALE 108
ST CLAIR 102
MANSFIELD PARK 80
PARAFIELD GARDENS 67
BROMPTON 64
ALDINGA BEACH 58
FINDON 57
REYNELLA 57
SMITHFIELD PLAINS 56
MAGILL 55
EVANSTON GARDENS 54
SEATON 54
Total 2144
Total Adelaide Metro 6217
Table 4 - Forecast New Service Connections.
Page 25 of 33
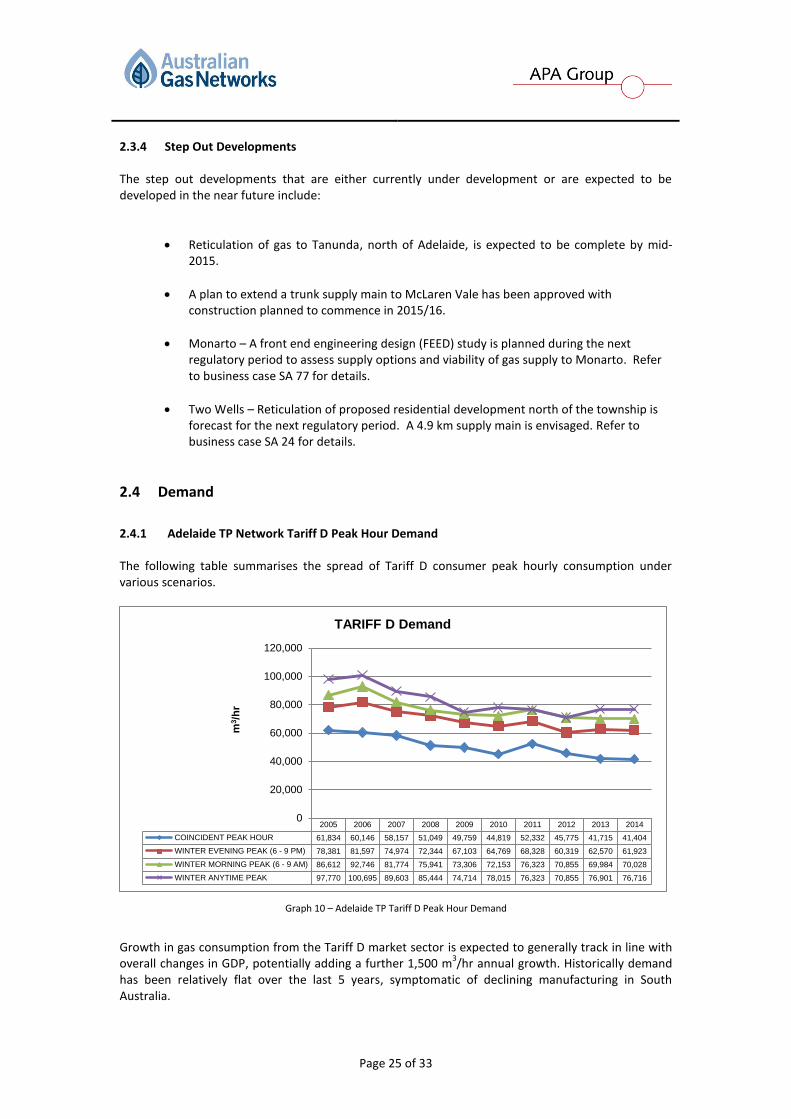
Step Out Developments 2.3.4 The step out developments that are either currently under development or are expected to be developed in the near future include:
Reticulation of gas to Tanunda, north of Adelaide, is expected to be complete by mid-2015.
A plan to extend a trunk supply main to McLaren Vale has been approved with construction planned to commence in 2015/16.
Monarto – A front end engineering design (FEED) study is planned during the next regulatory period to assess supply options and viability of gas supply to Monarto. Refer to business case SA 77 for details.
Two Wells – Reticulation of proposed residential development north of the township is forecast for the next regulatory period. A 4.9 km supply main is envisaged. Refer to business case SA 24 for details.
Demand 2.4
Adelaide TP Network Tariff D Peak Hour Demand 2.4.1 The following table summarises the spread of Tariff D consumer peak hourly consumption under various scenarios.
Graph 10 – Adelaide TP Tariff D Peak Hour Demand
Growth in gas consumption from the Tariff D market sector is expected to generally track in line with overall changes in GDP, potentially adding a further 1,500 m
3/hr annual growth. Historically demand
has been relatively flat over the last 5 years, symptomatic of declining manufacturing in South Australia.
2005 2006 2007 2008 2009 2010 2011 2012 2013 2014
COINCIDENT PEAK HOUR 61,834 60,146 58,157 51,049 49,759 44,819 52,332 45,775 41,715 41,404
WINTER EVENING PEAK (6 - 9 PM) 78,381 81,597 74,974 72,344 67,103 64,769 68,328 60,319 62,570 61,923
WINTER MORNING PEAK (6 - 9 AM) 86,612 92,746 81,774 75,941 73,306 72,153 76,323 70,855 69,984 70,028
WINTER ANYTIME PEAK 97,770 100,695 89,603 85,444 74,714 78,015 76,323 70,855 76,901 76,716
0
20,000
40,000
60,000
80,000
100,000
120,000
m3/h
r
TARIFF D Demand

Page 26 of 33
Due to the uncertainty of the location and timing of new Tariff D consumers, no allowance has been made for new Tariff D consumers. Should these emerge then the scope, cost and timing of network reinforcement will be evaluated on a case by case basis. For network capacity modelling purposes the 2014 Tariff D actual maximum winter evening peak has been assumed for the next 5 years.
Adelaide TP Network Tariff V Peak Hour Demand 2.4.2 A net increase in Tariff V (residential and I&C) connections of about 5,500 connections per year is forecast. Based on the current system-wide average peak day and peak hour consumption, an annual increase of about 2,000 m
3/hr/year is expected. However the Tariff V peak hour demand has been
reducing as shown in the following graph.
Graph 11 – Tariff V Peak Hour Demand
At some point this reducing trend is expected to be reversed, as a baseline load is reached, and thereafter an increase is expected in line with the increase in number of connections. For design purposes the 95% UCL (corresponding to a 1:20 year event) has been used as a base line load for the next 5 years, then increasing in line with the annual increase of about 1.9% or about 2,500 m3/hr (commensurate with the long term trend in Tariff V connections).
2004 2005 2006 2007 2008 2009 2010 2011 2012 2013 2014
Tariff V Peak Hour 134,884 128,101 134,720 130,791 134,438 125,924 141,853 117,307 128,650 118,240 134,352
95% UCL 148,243 147,444 146,649 145,860 145,075 144,295 143,520 142,749 141,983 141,222 140,465
95% LCL 118,878 118,079 117,285 116,495 115,711 114,931 114,155 113,384 112,618 111,857 111,100
-
20,000
40,000
60,000
80,000
100,000
120,000
140,000
160,000
m3/h
r
Tariff V Peak Hr Demand
Page 27 of 33
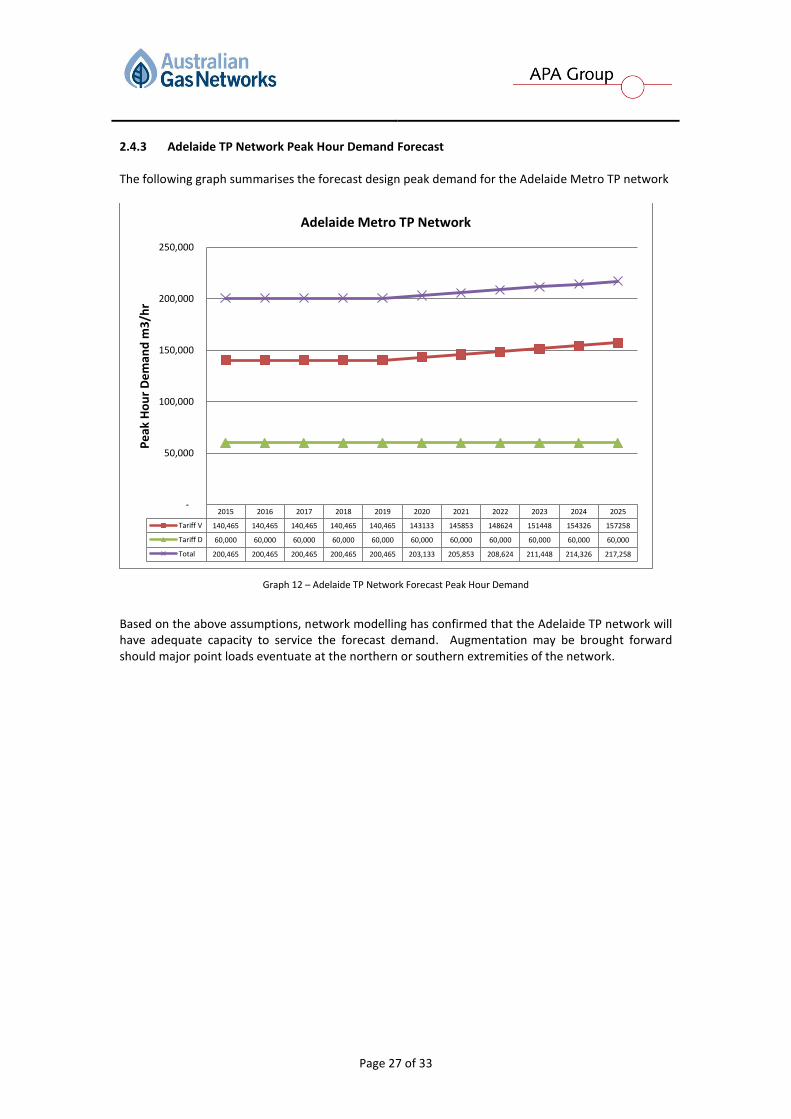
Adelaide TP Network Peak Hour Demand Forecast 2.4.3 The following graph summarises the forecast design peak demand for the Adelaide Metro TP network
Graph 12 – Adelaide TP Network Forecast Peak Hour Demand
Based on the above assumptions, network modelling has confirmed that the Adelaide TP network will have adequate capacity to service the forecast demand. Augmentation may be brought forward should major point loads eventuate at the northern or southern extremities of the network.
2015 2016 2017 2018 2019 2020 2021 2022 2023 2024 2025
Tariff V 140,465 140,465 140,465 140,465 140,465 143133 145853 148624 151448 154326 157258
Tariff D 60,000 60,000 60,000 60,000 60,000 60,000 60,000 60,000 60,000 60,000 60,000
Total 200,465 200,465 200,465 200,465 200,465 203,133 205,853 208,624 211,448 214,326 217,258
-
50,000
100,000
150,000
200,000
250,000
Pe
ak H
ou
r D
em
and
m3
/hr
Adelaide Metro TP Network

Page 28 of 33
Network Performance 2.5 Based on the information presented in the previous sections, the following table summarises the key network performance and capacity issues. The 2014 peak day network capacity analysis has been detailed in the South Australian Networks 2014 DSPR.
Network Location Priority Comments
TP Adelaide South & Central 2
The 1:25 year capacity design criterion for the Adelaide Metro network has been revised down. The net effect has been for a lower margin applied for a cold winter and coincident customer demand.
Extension of the River Road TP main is planned for 2015/16 to address capacity issues at the southern extremity of the HP network (Seaford-Aldinga). No further augmentation of the TP network is envisaged over the next regulatory period.
Extension of the TP main in West Terrace completed in 2015 has provided additional capacity to feed the new RAH + major city developments expected in the north west corner of the CBD.
Supply to the southern extremities of the network could be impacted by major failures of the Flagstaff Hill and River Road TP mains. An impact assessment will be undertaken in H2 of 2015 to identify options to mitigate the risk.
TP Adelaide Northern(Elizabeth) 3
Closure of GMH at Elizabeth is expected to free up spare capacity from 2017. A major residential development has been considered for the Roseworthy precinct with over 4,000 homes over the next 25 years. The current outlook is for housing construction to commence around 2017-2018. It is expected that the Roseworthy development will extend from the northern extremity of the current Gawler HP network in the vicinity of main North Road and Sturt Highway. There is capacity to meet demand for several years beyond which major augmentation will be required. This may involve extending the TP main from Kudla to Willaston (approx. 11 km) or a new gate station and supply main off either the MAP or SEAGas Pipeline. The latter could be used to provide future security of supply to AGN’s TP pipeline feeding the northern region. Customer growth will be monitored over the next few years. Supply to the northern extremity of the network is vulnerable to a major failure of the TP main supplying Gawler. Options for mitigating risks will be assessed during H2 of 2015 Supply to networks fed from the Yatala Vale TP main could be vulnerable in event of a major failure. Options for mitigating risks will be assessed during H2 of 2015
TP Adelaide West (LeFevre Peninsula) N/A Adequate capacity for at least the next 5 -10 years

Page 29 of 33
Network Location Priority Comments
TP/HP Virginia Gate station 3
Planned augmentation for this regulatory period (project S34) has been deferred pending the upgrade of the Virginia gate station. This is now expected to proceed during the next regulatory period. The upgrade of the Virginia Gate station will provided additional capacity to meet expected growth in the hydroponic market in this area. Based on forecast growth, augmentation of the HP network will be required circa 2018/19. Duplication of the main ex the gate station is planned. Refer to project business case SA 17 for details.
HP Gawler 3 Further augmentation is not expected to be required until post the next regulatory period.
HP Murray Bridge 3
Supply to the Murray Bridge town regulator is by 2km of DN50mm steel main which is approaching its maximum capacity. Augmentation of this pipeline is forecast to be required by the 2019 winter. Refer to business case SA 71 for details.
HP Seaford Aldinga 3
Ongoing growth in the southern suburbs has required staged augmentation. Stage 4 (SA25) of the current regulatory period augmentation is planned for completion prior to the 2016 winter. Further augmentation is forecast during the next regulatory period. Refer to business case SA 15 for details.
HP/MP Mt Gambier N/A
Network augmentation proposed for this regulatory period (project S36) has been cancelled. Mains renewal has improved capacity. New residential developments are opening up towards the north eastern corner of the network, closer to the existing district regulator and trunk infrastructure than had been expected. No further augmentation is expected over the next regulatory period.
MP Salisbury 3 Augmentation planned for this regulatory period (project S35) has been cancelled as capacity issues have been resolved through the mains replacement program.
MP Whyalla N/A
Analysis has shown growth has not materialised as previously expected. The proposed augmentation for this regulatory period (project S30) has been deferred indefinitely - network to be assessed annually.
LP Adelaide Metro 3
Mains replacement has significantly reduced capacity related issues with this network. No major augmentation required. A nominal amount of reactive augmentation may be required over the next regulatory pending completion of the mains replacement program. Refer to business case SA 14 for details
HP McLaren Vale N/A Supply main extension to township is planned for 2015/16. Supply mains to connect to the Seaford Aldinga network
Mount Barker N/A
Plans for residential development within the area for 7,000 additional homes, will increase the population in the area to 35,000 over the next 20 years. Options to supply this township include:
Extending the TP main from Greenhill Rd Tusmore
New supply main from Murray Bridge
CNG/LNG FEED study in 2016
Table 5 – Network Augmentation and Growth Projects

Page 30 of 33
Network Augmentation Summary 2.6 Where network augmentation is required business cases have been developed detailing the scope, drivers, options, risks and costs. These have been referenced in the following table. Augmentation timing for individual projects has been based on the best available forecast. There will always be a degree of uncertainty associated with the number and location of consumer connections, changes to existing consumer load profiles, and the addition or loss of major I&C consumer loads. To this end the timing and scope of all projects are reviewed annually. Planned network augmentation projects for the next financial year and next regulatory period have been summarised in the following table.
$’000 (Real 2014/15)
Ref No Activity/Project Description Priority Rating
FY 15/16
FY 16/17
FY 17/18
FY 18/19
FY 19/20
FY 20/21
Total AA
SA71 326 TP Murray Bridge Augmentation 3 494 2,517 0 0 3,011
SA14 Reactive Augmentation 3 170 120 75 50 0 415
SA15, 305 HP Seaford Aldinga Augmentation 3 0 0 0 1,336 0 1,336
SA 25 305 HP Seaford Aldinga Augmentation 5,600 0
SA17 325 HP Virginia Augmentation 3 0 0 809 0 0 809
Total 5,600 170 614 3,401 1,386 0 5,571
Table 6 – Network Augmentation Projects

Page 31 of 33
SECTION 3 - APPENDICES

Page 32 of 33
Appendix 1 – South Australia Networks
Figure 2 – South Australian Network Location Map

Page 33 of 33
Appendix 2 – Gate Station Locations
No. Pipeline Pipeline Owner
Gate Station Location
Gate Station Address Gate Station
Owner Distribution Network
1 Moomba to Adelaide Epic Elizabeth Corner Mill and Greyhound Rd, Waterloo Corner Epic Adelaide Metro
2 Moomba to Adelaide Epic Taperoo Mersey Rd, Taperoo Epic Adelaide Metro
3 Moomba to Adelaide Epic Gepps Cross Magazine Rd, Dry Creek Epic Adelaide Metro
4 SEAGas SEAGas Cavan Un-named road (formerly Magazine Rd, north of Salisbury Highway – delivery point at Valve 1491)
SEA Gas Adelaide Metro
5 Moomba to Adelaide (Angaston Lateral)
Epic Nuriootpa Barossa Valley Highway, Nuriootpa – delivery point at Valve 1497)
Epic Nuriootpa Township
6 Moomba to Adelaide (Angaston Lateral)
Epic Freeling Gawler Rd, Freeling (south of Nurse Rd) Epic Freeling Township
7 Moomba to Adelaide (Angaston Lateral)
Epic Angaston Stockwell Rd, Angaston Epic Angaston Township
8 Moomba to Adelaide Epic Pinkerton Plains Pinkerton Rd, Pinkerton Plains Epic Ridley Agriproducts, Wasleys Piggery Management and Wasleys Piggery Sow Shed Heating
9 Moomba to Adelaide Epic Waterloo Corner Corner Tozer Rd and Symes Rd, Waterloo Corner Epic Various I&C customers
10 Moomba to Adelaide Epic Virginia Corner Supple Rd and Park Rd, Virginia Epic Virginia Township
11 South East Pipeline System Epic Mount Gambier Nick Lyons Rd, Mount Gambier Epic Mount Gambier Township
12 Riverland Pipeline (Murray Bridge Lateral)
AGN Murray Bridge Lagoon Rd, Murray Bridge AGN TR Meat, National Foods and Murray Bridge Township
13 Moomba to Adelaide Epic Peterborough Cotton Rd, Peterborough Epic Peterborough Township
14 Moomba to Adelaide (Port Pirie/Whyalla Lateral)
Epic Port Pirie Warnertown Rd, Solomontown Epic Port Pirie Township
15 Moomba to Adelaide (Port Pirie/Whyalla Lateral)
Epic Whyalla Lincoln Highway, Whyalla Epic Whyalla Township
16 Riverland Pipeline AGN Berri Winkie Rd, Glossop AGN Berri Township and Various I&C customers
Table 7 – SA Network Gate Stations