Embed Size (px)
Citation preview

Estimated versus measured capacity of CFA piles for Seaford Road bridges, MelbourneCillian Mc Colgan
Associate Geotechnical Engineer, WSP – Melbourne, Australia
9th Australian Small Bridges Conference 2019Queensland, Australia

Overview
1. Background
2. Geotechnical model & design parameters
3. Axial capacity and pile design
4. Construction validation
5. Analysis of pile test results
6. Conclusions

Project Overview
Southern Program Alliance
• Removal of 4 level crossings in Melbourne’s South East for Initial Works Package
• Part of the Victorian Government’s AU$8.3 billion project
• Improve traffic flow
• Improve walkability within community
• Create safer communities
Melbourne CBD
Approx. 37 km
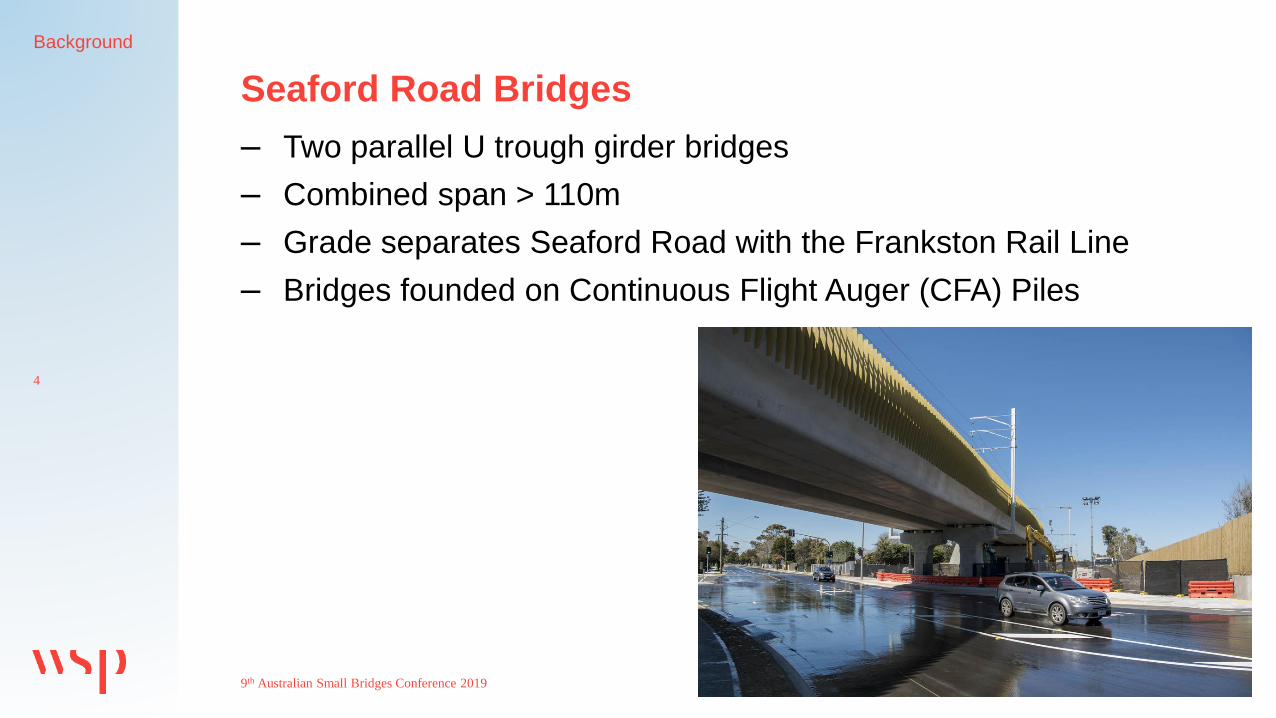
– Two parallel U trough girder bridges
– Combined span > 110m
– Grade separates Seaford Road with the Frankston Rail Line
– Bridges founded on Continuous Flight Auger (CFA) Piles
Seaford Road Bridges
9th Australian Small Bridges Conference 2019
Background
4

Seaford Road Bridges
9th Australian Small Bridges Conference 2019
Background
5

Seaford Road Bridges
9th Australian Small Bridges Conference 2019
Background
6

Geological Unit and ID Material Description Consistency Depth to top
(m bgl)
Unit 1 Fill Shallow fill associated
with rail formation
N/A 0.0
Unit 2 2A Quaternary Sands Dune Sands Medium
Dense
0.0 – 1.0
2B Swamp deposits Sands with
occasional layers of
compressible back
swamp materials
Loose 2.9 – 6.5
Unit 3 3A Brighton Group
(Sandringham
Sandstone)
Sandy Clay Stiff to Hard 4.1 – 8.0
3B Clayey Sand,
occasionally
cemented
Medium
Dense to
Very Dense
10.0 – 16.5
Unit 4 Gellibrand Marl Stiff to Very Stiff Stiff to Very
Stiff
19.0 – 22.6
Geotechnical Model
9th Australian Small Bridges Conference 2019
– Ten geotechnical boreholes (maximum depth of 46.85m below existing ground level)
– Thirteen Cone Penetration Tests (CPT)
Geotechnical
Model and
Design
Parameters
7
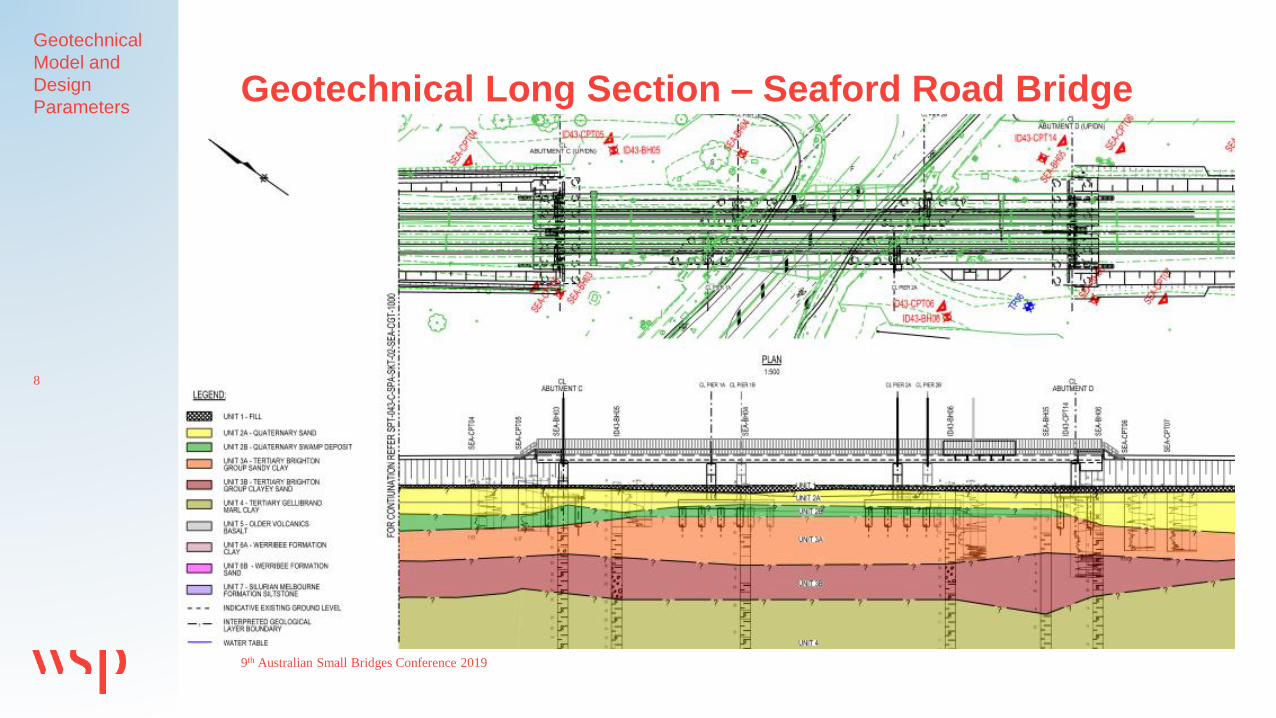
Geotechnical Long Section – Seaford Road Bridge
9th Australian Small Bridges Conference 2019
Geotechnical
Model and
Design
Parameters
8

Geotechnical Long Section – Pedestrian Underpass
9th Australian Small Bridges Conference 2019
Geotechnical
Model and
Design
Parameters
9

In-situ Test Results
9th Australian Small Bridges Conference 2019
Geotechnical
Model and
Design
Parameters
10
-22
-20
-18
-16
-14
-12
-10
-8
-6
-4
-2
0
0 10 20 30 40 50 60
RL
(m
AH
D)
SPT N1,60
Unit 2A Unit 2C Unit 3A Unit 3B Unit 4
Geological Unit and ID
Unit 2 2A Quaternary Sands
2B Swamp deposits
Unit 3 3A Brighton Group
(Sandringham
Sandstone)3B
Unit 4 Gellibrand Marl
Unit 2B
Geological Unit and ID Undrained Shear
Strength, Su (kPa)
Effective Cohesion,
c’ (kPa)
Effective
Friction
Angle, ’
(Degrees)
Ultimate
skin
Friction, fs
(kPa)
Ultimate
End
Bearing, fb
(kPa)
Unit 2 2AN/A 0
29° – 32° 15 - 24 N/A
2B
N/A 0
28° – 33° 4 - 32 N/A
Unit 3 3A 40 - 200 - - 16 - 65 1100 - 3600
3B
N/A 0 30° – 36° 16 - 65
1100 - 3600
Unit 4125 - 175 0
28° – 33° 39 - 43 700 – 1200
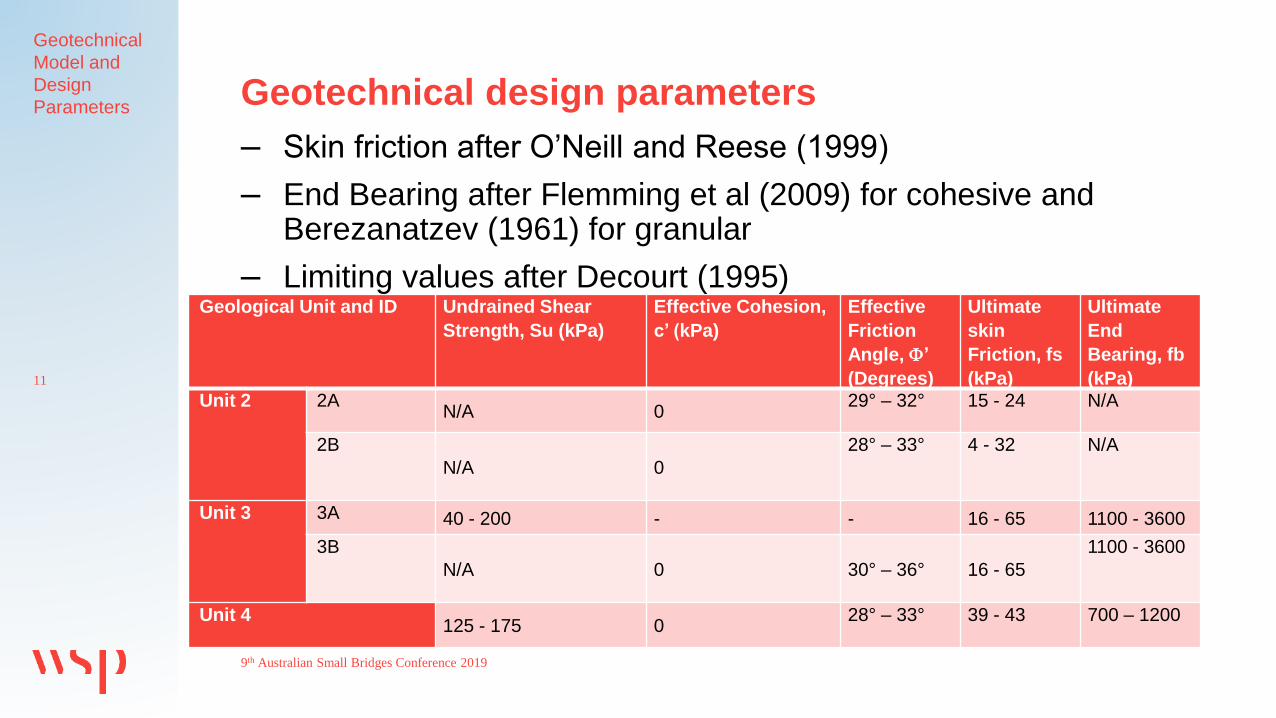
Geotechnical design parameters
9th Australian Small Bridges Conference 2019
– Skin friction after O’Neill and Reese (1999)
– End Bearing after Flemming et al (2009) for cohesive and Berezanatzev (1961) for granular
– Limiting values after Decourt (1995)
Geotechnical
Model and
Design
Parameters
11
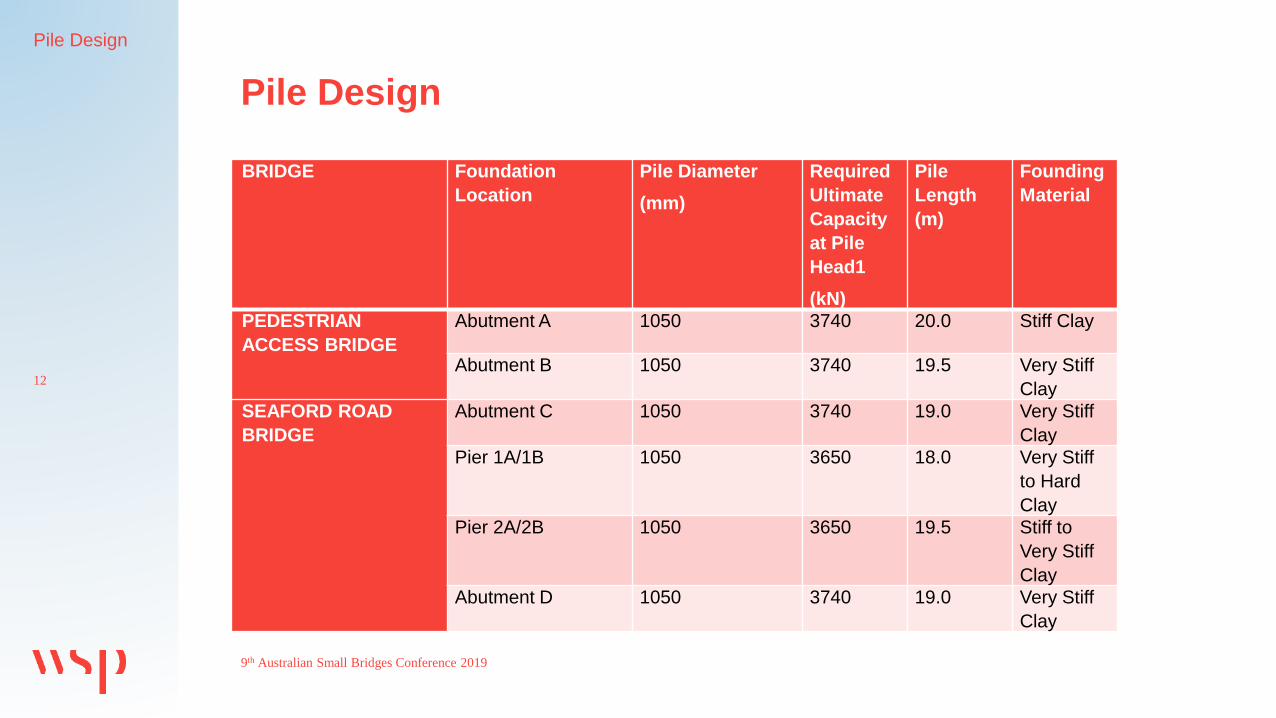
BRIDGE Foundation
Location
Pile Diameter
(mm)
Required
Ultimate
Capacity
at Pile
Head1
(kN)
Pile
Length
(m)
Founding
Material
PEDESTRIAN
ACCESS BRIDGE
Abutment A 1050 3740 20.0 Stiff Clay
Abutment B 1050 3740 19.5 Very Stiff
Clay
SEAFORD ROAD
BRIDGE
Abutment C 1050 3740 19.0 Very Stiff
Clay
Pier 1A/1B 1050 3650 18.0 Very Stiff
to Hard
Clay
Pier 2A/2B 1050 3650 19.5 Stiff to
Very Stiff
Clay
Abutment D 1050 3740 19.0 Very Stiff
Clay
Pile Design
9th Australian Small Bridges Conference 2019
Pile Design
12
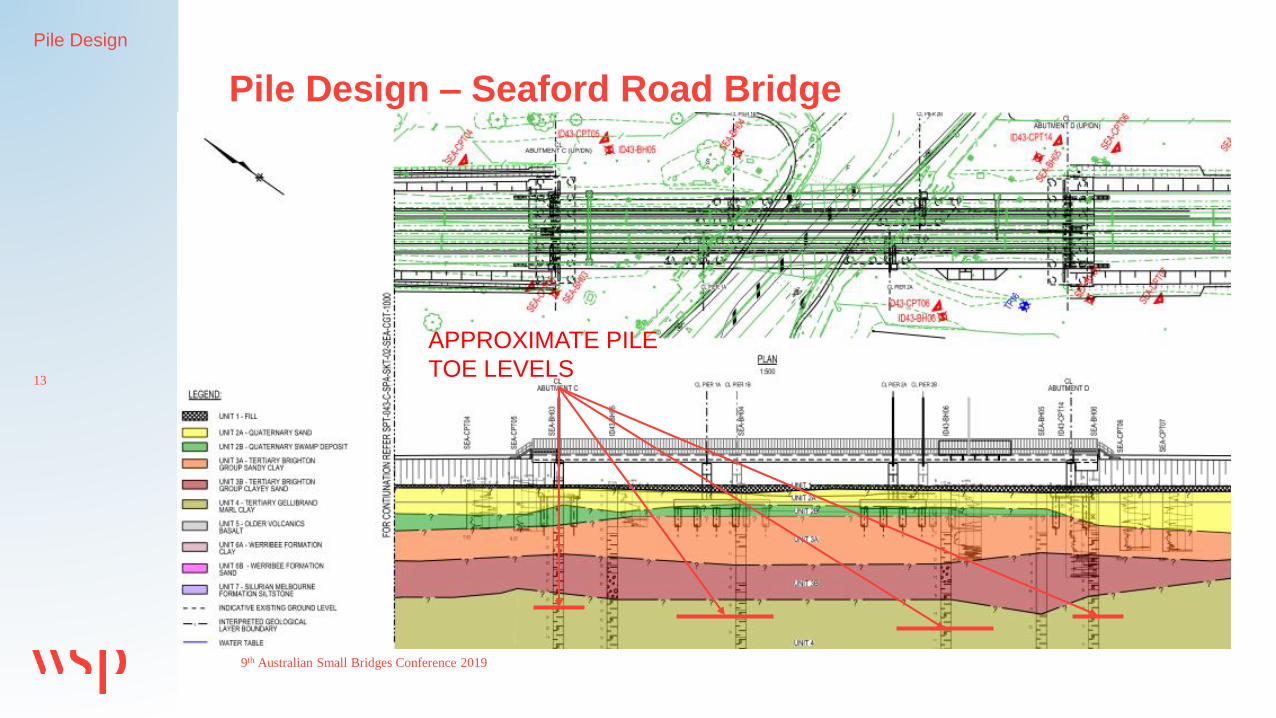
Pile Design – Seaford Road Bridge
9th Australian Small Bridges Conference 2019
Pile Design
13
APPROXIMATE PILE
TOE LEVELS
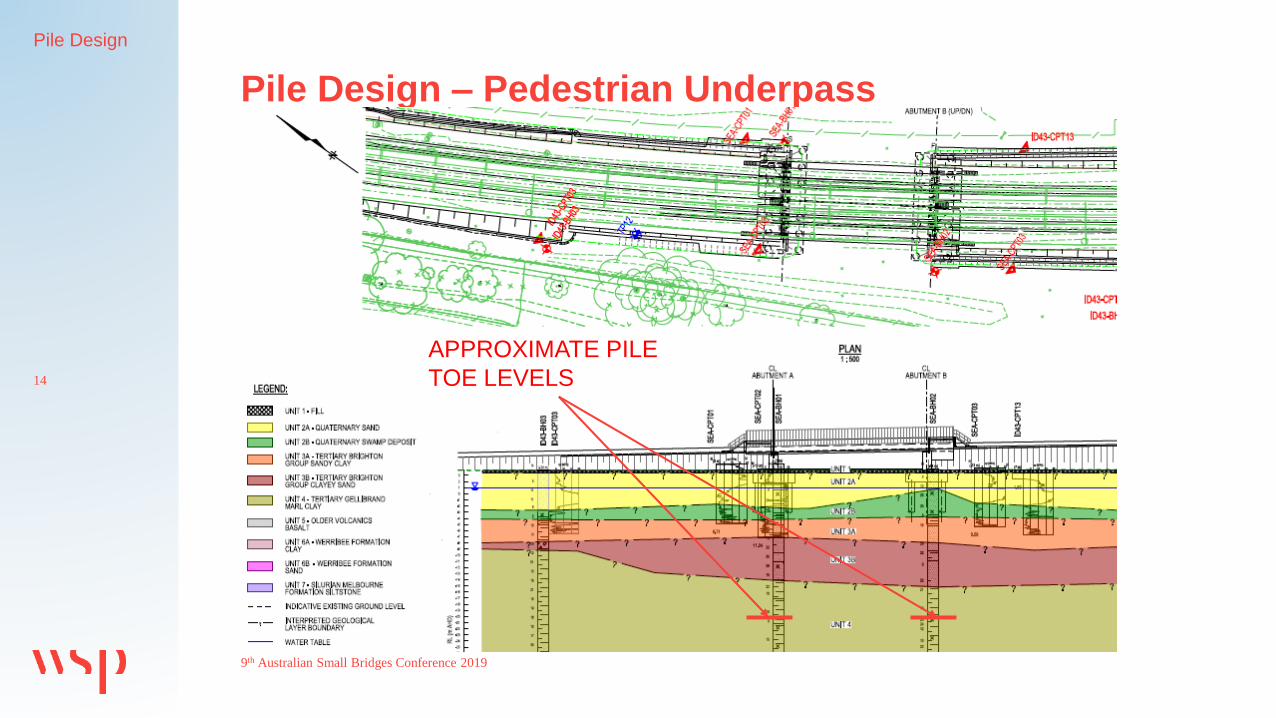
Pile Design – Pedestrian Underpass
9th Australian Small Bridges Conference 2019
Pile Design
14
APPROXIMATE PILE
TOE LEVELS

Pile Installation Records
9th Australian Small Bridges Conference 2019
Construction
Validation
15
– LB28 Rig with Jean Lutz Software
– Unreliable
– No clear correlation
– No clear evidence of weak layers
– General increase in resistance versus depth
– Larger as built pile diameter

Inspecting Pile Cuttings
9th Australian Small Bridges Conference 2019
Construction
Validation
16
– Soil mixing during drilling
– Soil disturbance during drilling
– Toe validated after pile poured
– Reliance on validation of CFA piles is both impractical and unreliable for floating piles
– Rely on boreholes and design appropriately considering variability
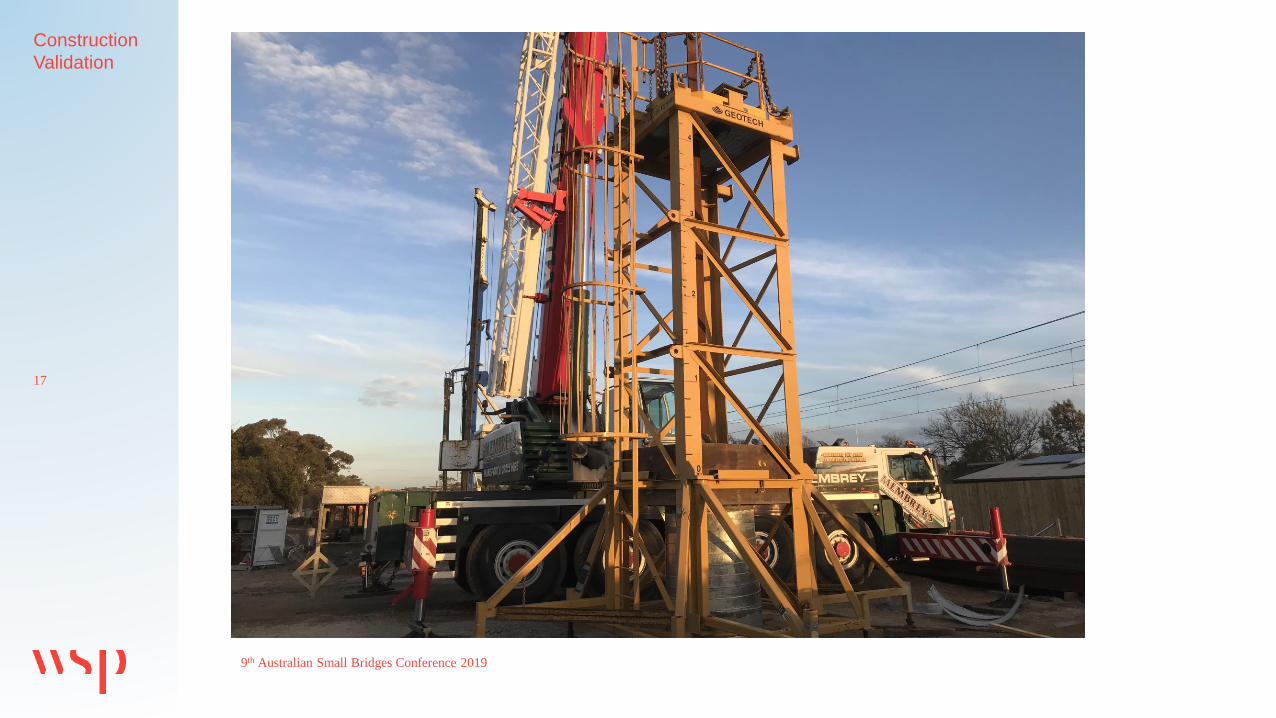
Dynamic Pile Testing
9th Australian Small Bridges Conference 2019
Construction
Validation
17
– 1 Pile per pile group tested in accordance with VicRoads Specification 607
– Geotech’s custom built rig with 12T drop hammer
– Minimum 6 days of set up
– Piles tested at modest energy, that is, energy that was determined by the testing contractor to be sufficient to achieve the nominated test loads

Dynamic Pile Testing Results
9th Australian Small Bridges Conference 2019
Construction
Validation
18
Bridge Foundation
Location
Estimated
Pile
Capacity
(kN)
Measured
Pile
Capacity
(kN)
Estimated
Shaft
Force
(kN)
Measure
d Shaft
Force
(kN)
Estimated End
Bearing Force
(kN)
Measured End
Bearing Force
(kN)
Abutment A - P09 3746 9575 3221 6112 925 3463
Abutment B - P04 3751 6487 2934 5188 1195 1299
Abutment C - P03 3741 9303 2764 6273 1360 3030
Pier 1A - P01 3651 8869 2653 7138 1359 1731
Pier 1B - P01 3651 7746 2653 6231 1359 1515
Pier 2A - P02 3641 7513 3206 5781 820 1731
Pier 2B - PP08 3641 7336 3206 5605 820 1731
Abutment D – P04 3745 7323 1927 5592 2098 1731

Other DynamicTesting – Approach Embankments
9th Australian Small Bridges Conference 2019
Construction
Validation
19
Bridge approach embankment rigid inclusions to address potential differential settlement where no preload time was available

Other DynamicTesting – Utility Protection Slab
9th Australian Small Bridges Conference 2019
Construction
Validation
20

Other Dynamic Test Results
9th Australian Small Bridges Conference 2019
Construction
Validation
21
Rigid Inclusions Location Measured Pile
Capacity (kN)
Diameter (mm) Length
(m)
Measured
Shaft Force
(kN)
Measured End
Bearing Force
(kN)
AD87 2427 500 8.6 1691 736
AB32 1592 500 8.6 840 742
AA06 1989 500 10.6 1351 638
PN59 1200 500 8.4 660 540
PN70 4879 600 17.0 3041 1838
PN61 4520 600 17.0 3177 1343
PN55 5641 600 17.0 3945 1696
Test Pile Abutment A 1050 3472 9 1740 1732
Test Pile Abutment C 1050 9040 14 3412 5628
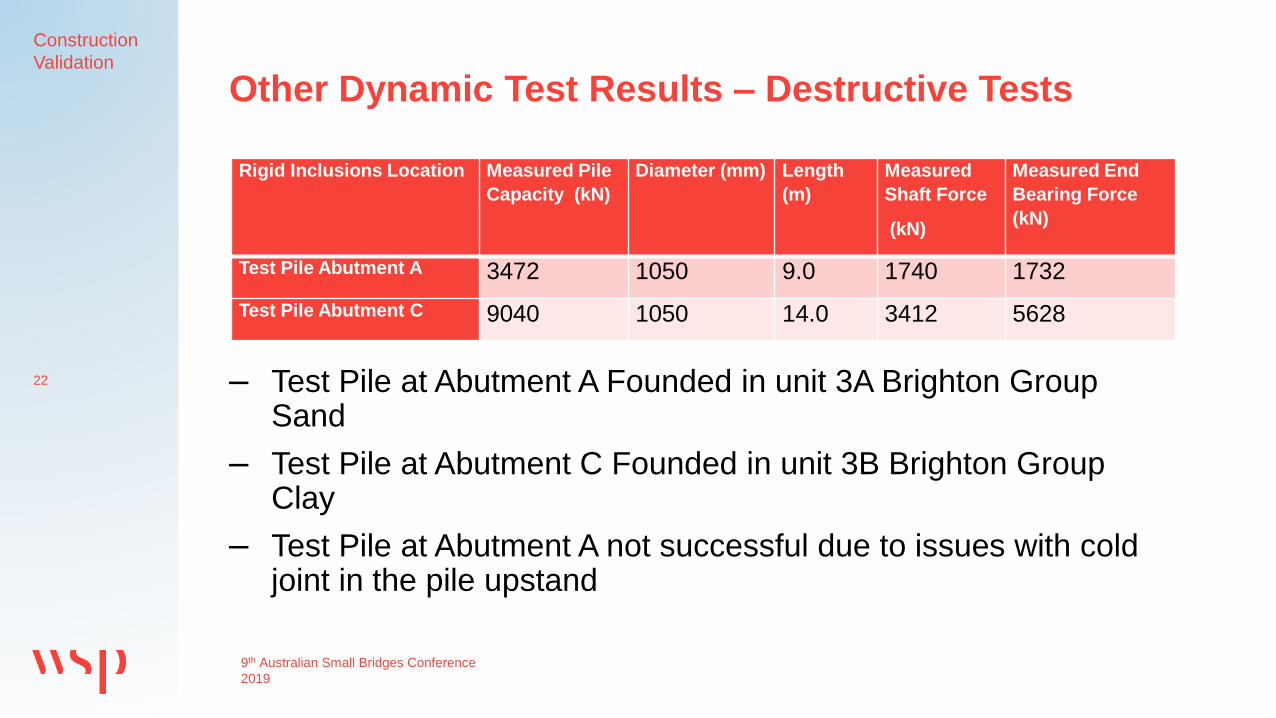
Other Dynamic Test Results – Destructive Tests
9th Australian Small Bridges Conference
2019
Construction
Validation
22
Rigid Inclusions Location Measured Pile
Capacity (kN)
Diameter (mm) Length
(m)
Measured
Shaft Force
(kN)
Measured End
Bearing Force
(kN)
Test Pile Abutment A 3472 1050 9.0 1740 1732
Test Pile Abutment C 9040 1050 14.0 3412 5628
– Test Pile at Abutment A Founded in unit 3A Brighton Group Sand
– Test Pile at Abutment C Founded in unit 3B Brighton Group Clay
– Test Pile at Abutment A not successful due to issues with cold joint in the pile upstand
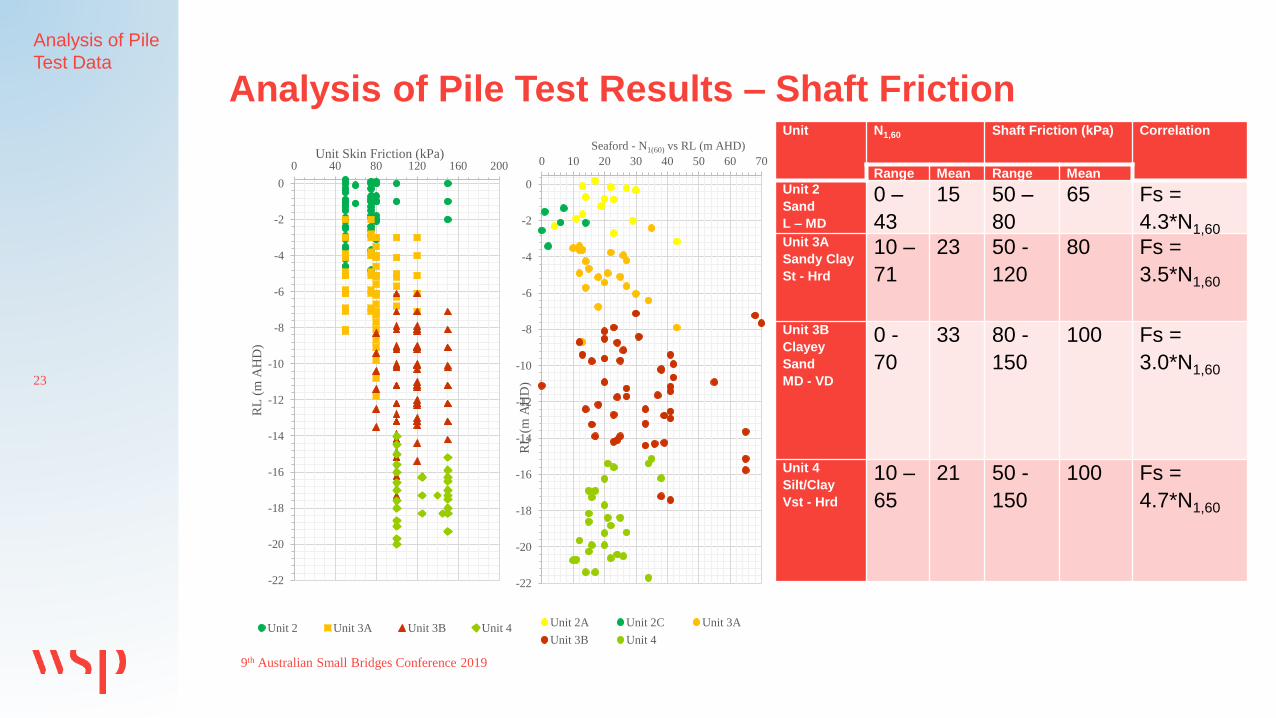
Analysis of Pile Test Results – Shaft Friction
9th Australian Small Bridges Conference 2019
Analysis of Pile
Test Data
23
-22
-20
-18
-16
-14
-12
-10
-8
-6
-4
-2
0
0 40 80 120 160 200
RL
(m
AH
D)
Unit Skin Friction (kPa)
Unit 2 Unit 3A Unit 3B Unit 4
Unit N1,60 Shaft Friction (kPa) Correlation
Range Mean Range Mean
Unit 2
Sand
L – MD
0 –
43
15 50 –
80
65 Fs =
4.3*N1,60Unit 3A
Sandy Clay
St - Hrd
10 –
71
23 50 -
120
80 Fs =
3.5*N1,60
Unit 3B
Clayey
Sand
MD - VD
0 -
70
33 80 -
150
100 Fs =
3.0*N1,60
Unit 4
Silt/Clay
Vst - Hrd
10 –
65
21 50 -
150
100 Fs =
4.7*N1,60
-22
-20
-18
-16
-14
-12
-10
-8
-6
-4
-2
0
0 10 20 30 40 50 60 70
RL
(m
AH
D)
Seaford - N1(60) vs RL (m AHD)
Unit 2A Unit 2C Unit 3A
Unit 3B Unit 4
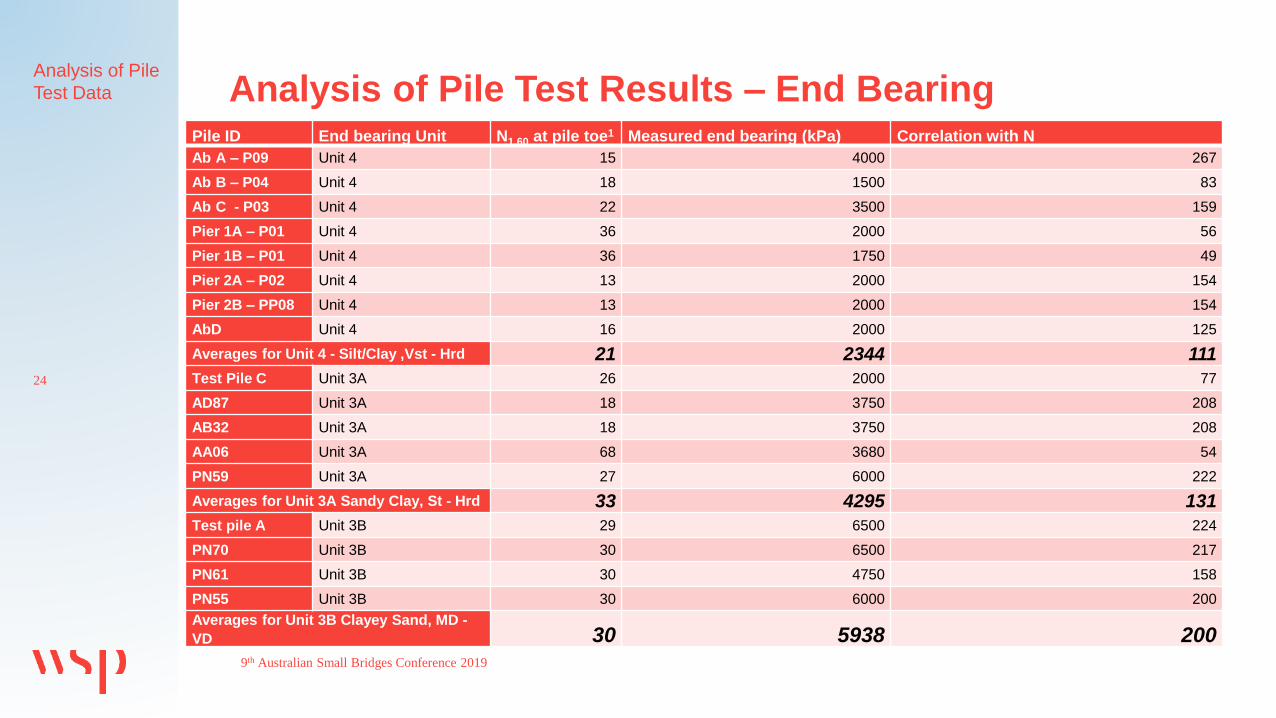
Analysis of Pile Test Results – End Bearing
9th Australian Small Bridges Conference 2019
24
Pile ID End bearing Unit N1,60 at pile toe1 Measured end bearing (kPa) Correlation with N
Ab A – P09 Unit 4 15 4000 267
Ab B – P04 Unit 4 18 1500 83
Ab C - P03 Unit 4 22 3500 159
Pier 1A – P01 Unit 4 36 2000 56
Pier 1B – P01 Unit 4 36 1750 49
Pier 2A – P02 Unit 4 13 2000 154
Pier 2B – PP08 Unit 4 13 2000 154
AbD Unit 4 16 2000 125
Averages for Unit 4 - Silt/Clay ,Vst - Hrd 21 2344 111
Test Pile C Unit 3A 26 2000 77
AD87 Unit 3A 18 3750 208
AB32 Unit 3A 18 3750 208
AA06 Unit 3A 68 3680 54
PN59 Unit 3A 27 6000 222
Averages for Unit 3A Sandy Clay, St - Hrd 33 4295 131
Test pile A Unit 3B 29 6500 224
PN70 Unit 3B 30 6500 217
PN61 Unit 3B 30 4750 158
PN55 Unit 3B 30 6000 200
Averages for Unit 3B Clayey Sand, MD -
VD 30 5938 200
Analysis of Pile
Test Data
20
30
40
50
60
70
80
90
100
110
120
130
140
150
160
170
180
190
200
0 50 100 150 200 250 300 350 400
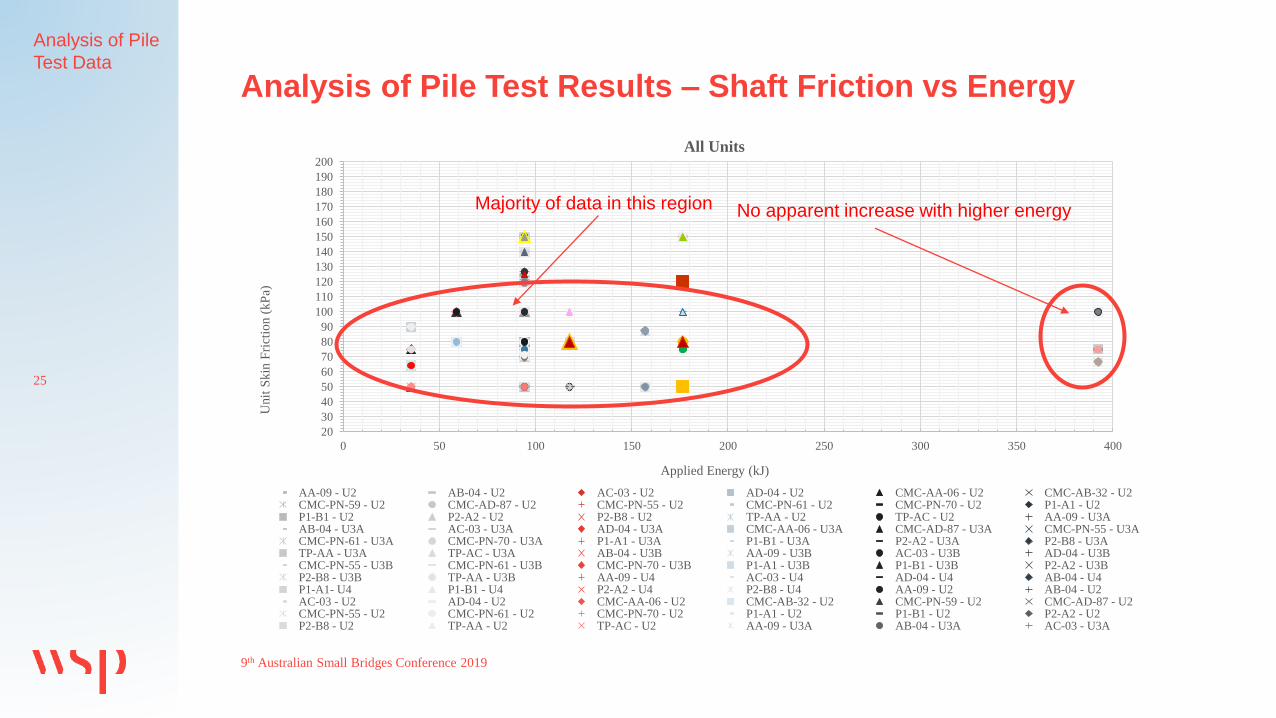
Unit
Skin
Fri
ctio
n (
kP
a)
Applied Energy (kJ)
All Units
AA-09 - U2 AB-04 - U2 AC-03 - U2 AD-04 - U2 CMC-AA-06 - U2 CMC-AB-32 - U2CMC-PN-59 - U2 CMC-AD-87 - U2 CMC-PN-55 - U2 CMC-PN-61 - U2 CMC-PN-70 - U2 P1-A1 - U2P1-B1 - U2 P2-A2 - U2 P2-B8 - U2 TP-AA - U2 TP-AC - U2 AA-09 - U3AAB-04 - U3A AC-03 - U3A AD-04 - U3A CMC-AA-06 - U3A CMC-AD-87 - U3A CMC-PN-55 - U3ACMC-PN-61 - U3A CMC-PN-70 - U3A P1-A1 - U3A P1-B1 - U3A P2-A2 - U3A P2-B8 - U3ATP-AA - U3A TP-AC - U3A AB-04 - U3B AA-09 - U3B AC-03 - U3B AD-04 - U3BCMC-PN-55 - U3B CMC-PN-61 - U3B CMC-PN-70 - U3B P1-A1 - U3B P1-B1 - U3B P2-A2 - U3BP2-B8 - U3B TP-AA - U3B AA-09 - U4 AC-03 - U4 AD-04 - U4 AB-04 - U4P1-A1- U4 P1-B1 - U4 P2-A2 - U4 P2-B8 - U4 AA-09 - U2 AB-04 - U2AC-03 - U2 AD-04 - U2 CMC-AA-06 - U2 CMC-AB-32 - U2 CMC-PN-59 - U2 CMC-AD-87 - U2CMC-PN-55 - U2 CMC-PN-61 - U2 CMC-PN-70 - U2 P1-A1 - U2 P1-B1 - U2 P2-A2 - U2P2-B8 - U2 TP-AA - U2 TP-AC - U2 AA-09 - U3A AB-04 - U3A AC-03 - U3A
25
Analysis of Pile Test Results – Shaft Friction vs Energy
9th Australian Small Bridges Conference 2019
Analysis of Pile
Test Data
No apparent increase with higher energyMajority of data in this region

0
500
1000
1500
2000
2500
3000
3500
4000
4500
5000
5500
6000
6500
7000
0 50 100 150 200 250 300 350 400
Unit
End
Bea
ring(k
Pa)
Applied Energy (kJ)
All Units
AA-09 - U4 AB-04 - U4 AC-03 - U4 AD-04 - U4 P1-A1- U4 P1-B1 - U4 P2-A2 - U4 P2-B8 - U4
TP-AA - U3B TP-AC - U3A CMC-AA-06 - U3A CMC-AD-87 - U3A CMC-PN-55 - U3B CMC-PN-61 - U3B CMC-PN-70 - U3B
26
Analysis of Pile Test Results – End Bearing vs Energy
Rigid inclusions capable of
mobilising more end bearing at
lower energy
Destructive test
demonstrates higher end
bearing for 1050 pile
9th Australian Small Bridges Conference 2019
Analysis of Pile Test
Data
27
Conclusions
9th Australian Small Bridges Conference 2019
Conclusions
– Conventional design methods can be overly conservative for pile design in the Brighton Group and Gellibrand Marl Units
– The Brighton Group and Gellibrand Marl Units both displayed skin friction far greater than conventional design would suggest
– The Brighton Group units showed a similar trend for end bearing though the data to support this is not as comprehensive as that for shaft friction and it is limited to smaller diameter piles
– There is likely more end bearing capacity available in the Gellibrand Marl than was encountered at Seaford bridge
– Potential to prove greater capacities with destructive testing

28
Caution
9th Australian Small Bridges Conference 2019
Conclusions
– When selecting pile test data as a design basis this must be taken in the context of the consequence of a pile test failing. Where consequence is high conventional approaches while conservative, may be appropriate as they provide confidence that tests will pass
– Where consequence of a test failing can be managed a less conservative design approach could be adopted provided risks are understood by contractor and contingencies are in place
– Contingencies can include
– Mobilise larger hammer
– More piles at shallow depth leaving the option to deepen
– Make an increased allowance for pile set up i.e. > 7 days
– If you have paid to mobilise a test rig – hit the piles hard and contribute to a database of testing that the infrastructure industry needs
29
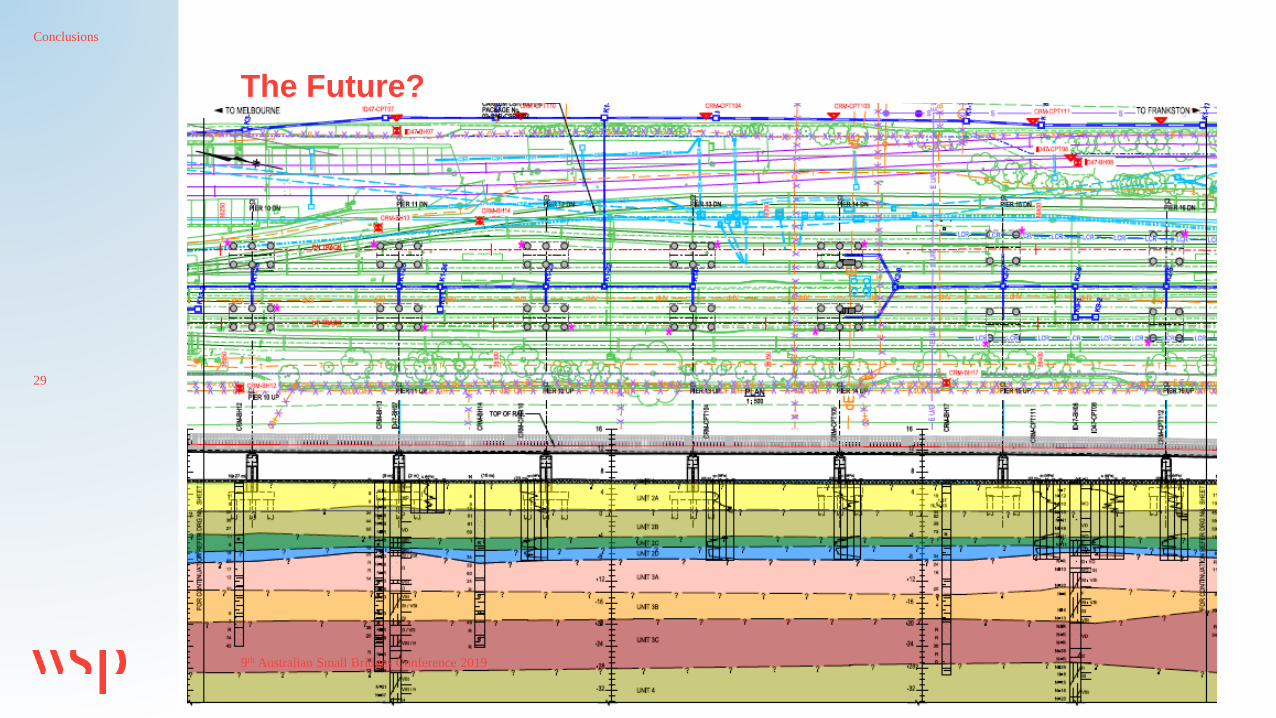
The Future?
9th Australian Small Bridges Conference 2019
Conclusions
30
Acknowledgements
9th Australian Small Bridges Conference 2019
Conclusions
The authors would like to thank the Level Crossing Removal Project and the
Southern Program Alliance for permission to present this work.