Embed Size (px)
Citation preview
W&M ScholarWorks W&M ScholarWorks
VIMS Books and Book Chapters Virginia Institute of Marine Science
2003
Capacity And Offshore Fisheries Development: The Malaysian Capacity And Offshore Fisheries Development: The Malaysian
Purse Seine Fishery Purse Seine Fishery
James E. Kirkley Virginia Institute of Marine Science
Dale Squires
Mohammad Ferdous Alam
Ishak Haji Omar
Follow this and additional works at: https://scholarworks.wm.edu/vimsbooks
Part of the Aquaculture and Fisheries Commons
Recommended Citation Recommended Citation Kirkley, James E.; Squires, Dale; Alam, Mohammad Ferdous; and Omar, Ishak Haji, "Capacity And Offshore Fisheries Development: The Malaysian Purse Seine Fishery" (2003). VIMS Books and Book Chapters. 64. https://scholarworks.wm.edu/vimsbooks/64
This Book Chapter is brought to you for free and open access by the Virginia Institute of Marine Science at W&M ScholarWorks. It has been accepted for inclusion in VIMS Books and Book Chapters by an authorized administrator of W&M ScholarWorks. For more information, please contact [email protected].

Extracted from : Pascoe, S.; Gréboval, D. (eds.) Measuring capacity in fisheries. FAO Fisheries Technical Paper. No. 445. Rome, FAO. 2003. 314p. http://www.fao.org/3/Y4849E/y4849e00.htm http://www.fao.org/3/Y4849E/y4849e0e.htm#bm16
CAPACITY AND OFFSHORE FISHERIES DEVELOPMENT: THE MALAYSIAN PURSE SEINE FISHERY –
James E. Kirkley[110], Dale Squires[111], Mohammad Ferdous Alam[112], Ishak Haji Omar[113]
Abstract: Many developing countries pursue offshore fisheries development strategies to increase protein supply, expand employment, earn foreign exchange, and militate the conflict between large- and small-scale fisheries over the inshore resource stocks. This study evaluates the economic success of Peninsular Malaysia's offshore fisheries development policy for the west coast purse seine fleet, finding it has largely succeeded on economic grounds.
1. INTRODUCTION One of the key issues facing sustainable development of fisheries in Southeast and South Asia, Africa, and many other developing countries is how best to expand fishing capacity in offshore waters to satisfy a combination of objectives. These objectives include generating employment, expanding production of high quality protein, earning foreign exchange or reducing imports, and more fully utilizing underexploited resource stocks[114]. The factor providing the most immediate impetus, however, is to tackle the excess capacity and overfishing in inshore fishing grounds and the accompanying conflicts between large- and small-scale fisheries.[115]
Both large-scale, industrial fisheries, using trawl or purse seine gear and with a clear commercial orientation, and small-scale (artisanal) fisheries, using traditional gear and with more of a subsistence orientation, built up a large portion of their fishing capacity to harvest the same resource stocks. In tropical waters, these resource stocks tend to be concentrated in the shallow, nutrient- rich, readily accessible inshore waters[116], and include rich beds of commercially valuable prawns, which are harvested largely for export. The large numbers of small-scale fishers are generally confined to inshore operations by their small vessels, low engine power, and traditional fishing gear[117]. In contrast, the more limited number of large-scale fishers, with their larger vessels, are often free to fish both inshore and offshore waters.
Extracted from : Pascoe, S.; Gréboval, D. (eds.) Measuring capacity in fisheries. FAO Fisheries Technical Paper. No. 445. Rome, FAO. 2003. 314p. http://www.fao.org/3/Y4849E/y4849e00.htm http://www.fao.org/3/Y4849E/y4849e0e.htm#bm16
The excess fishing capacity that has built up in the inshore waters exacerbates the poverty of the traditional, small-scale sector. Fish stocks become overexploited or even depleted, catch rates decline, small-scale fishers are crowded out and their gear overrun, and prawn beds depleted[118]. The open-access property right exacerbates this problem, because it allows virtually free access to the inshore resource stocks by all interested groups (Meyneu, 1989)[119]. The large number of species in tropical waters, each occurring in small numbers and with complex interactions, also contributes to resource competition between different gear and vessel types, even if they do not target the same fish species (Panayotou 1982).
In Malaysia, a high level of poverty in the traditional sector, and differences in ethnic composition between the traditional small-scale and large-scale sectors, make fisheries the natural resource sector that most clearly exhibits the development issues that were a central concern of the New Economic Policy (Jahara, 1988; Vincent, Rozali, and Jahara, 1997), and subsequently in 1991, the New Development Plan. Similar concerns hold for Indonesia (Bailey, Dwiponggo and Marahudin, 1987), Thailand (Panayotou and Jetanavanich, 1987), and India and Sri Lanka (Kurien, 1996; Meyen, 1989).
One of the primary public policy responses to the excess capacity and overfishing in inshore fishing grounds, and subsequent conflicts between large- and small-scale fishers, has been to promote further development of the offshore fisheries by the large-scale sector (Ishak et al., 1991; Vincent et al., 1997; Bailey et al., 1897; Majid, 1985). Malaysia promoted offshore fishing under the belief that offshore fish resources were underexploited (Ishak et al., 1991; Ooi, 1990; Vincent et al., 1997). The objective was to develop the fishery through modernization and increased efficiency (Mohamed, 1991). Licences for deep-sea vessels were subject to fewer restrictions than licences for smaller vessels. The government promoted offshore joint ventures with foreign (primarily Thai) companies (Vincent et al., 1997). Indonesia similarly encouraged the expansion of the offshore purse seine fleet by providing loans for conversion of trawlers and the construction of new purse seine vessels (Bailey et al., 1987), although the Java sea fishery may be overexploited (McElroy, 1991). In both Malaysia and Indonesia, purse seine vessels are most capable of catching the types of fish species found offshore. Thailand faced the opposite problem, that of contracting its offshore fleet when the establishment of Extended Economic Zones dramatically reduced its offshore fishing grounds (Panayotou and Jetanavanich, 1987).
A second primary public policy response to the excess capacity and conflicts in inshore waters has been to close off access to inshore grounds by large-scale vessels. Indonesia, by Presidential Decree 39 in 1980, outright banned all trawlers from waters off Java and Sumatra. In 1983, Indonesia extended the trawl ban throughout the country, except for some parts of eastern Indonesia and the Indian Ocean (Bailey, 1997). Malaysia similarly banned trawlers from the inshore waters fished by traditional, small-scale vessels. These bans not only substantively reduced conflicts with artisanal fishers, but also reserved the lion's share of the highly lucrative prawn resources for artisanal fishers.
Extracted from : Pascoe, S.; Gréboval, D. (eds.) Measuring capacity in fisheries. FAO Fisheries Technical Paper. No. 445. Rome, FAO. 2003. 314p. http://www.fao.org/3/Y4849E/y4849e00.htm http://www.fao.org/3/Y4849E/y4849e0e.htm#bm16
In short, Malaysia and Indonesia both introduced an area licensing scheme to spatially allocate fishing capacity by gear type, vessel size, and type of ownership (Bailey et al., 1987; Jahara, 1988; Ooi, 1990; Ishak, 1994)[120]. Both Malaysia and Indonesia specified four zones, with the innermost belt reserved for artisanal fishing (Ooi, 1990; Saharuddin, 1995). Malaysia's programme distributes vessels by size class, with the larger vessels distributed in zones farther offshore.
This spatial allocation of fishing capacity was motivated in part to ensure sustainable resource exploitation, but even more so for social and political reasons. Use of inshore waters in both Indonesia and Malaysia was intended to achieve the social objective of employing traditional fishers, and use of offshore waters was intended to achieve the economic objective of producing fish (Bailey et al., 1987; Ooi, 1990). In Malaysia, this policy was not based solely on resource stock conservation, but major consideration was given to economic, social and political aspects (Majid, 1985). Majid (1985: p. 321), states, "The main criteria was to control excess capacity, taking into account socio-economic and political considerations." Jahara (1988) further observed for Malaysia that the objective of allocating fishing grounds represented a strong emphasis on equity, and that the issue was as much politics as equitable allocation of fishery resources between highly efficient trawlers and less efficient small-scale fishers.
The purpose of this paper is to evaluate the strategy of focusing large-scale commercial fishing on offshore waters through a case study of Peninsular Malaysia's purse seine fleet. We focus on the purse seine fleet since it is well-suited to offshore fishing. The encouragement of fishing capacity to offshore waters might lead to either excess or under capacity, depending on the fleet's response. Shifting capacity offshore might also lead to technical inefficiency if vessels do not make efficient adaptations. Variable inputs might also not be optimally utilized. To address these questions, the paper evaluates the success of this strategy, asking whether or not the strategy has led to excess capacity and whether or not the offshore fleet is technically efficient. In particular, the paper asks how much of the current zonal fishing capacity, labour, and days-at-sea are utilized during monsoon and non-monsoon seasons, with an eye to suggesting improvements in technical efficiency and the utilization of capacity and variable inputs. The definition of fishing capacity and its approach to measurement draw upon the recent FAO Technical Working Group on the Management of Fishing Capacity, La Jolla, United States, 15-18 April 1998 (FAO 1998) and accompanying background paper of Kirkley and Squires (1999).
The analysis does not assess the optimal long-run, steady-state equilibrium level of fishing capacity and vessels by zone, which would require information on the resource stocks and their population dynamics which are simply unavailable[121]. The analysis also does not assess the achievement of social objectives.
The paper is organized as follows. Section 2 provides a background to the Peninsular Malaysian purse seine fishery. Section 3 discusses fishing capacity, technical efficiency, and variable input
Extracted from : Pascoe, S.; Gréboval, D. (eds.) Measuring capacity in fisheries. FAO Fisheries Technical Paper. No. 445. Rome, FAO. 2003. 314p. http://www.fao.org/3/Y4849E/y4849e00.htm http://www.fao.org/3/Y4849E/y4849e0e.htm#bm16
utilization; presents the empirical model used for measurement; and discusses the data. Section 4 reports the empirical results and discusses the implications for policy. Section 5 provides concluding remarks.
2. PENINSULAR MALAYSIAN PURSE SEINE FISHERY The Peninsular Malaysian fishing industry provides a significant source of animal protein, employment, and to a lesser extent, foreign exchange (Ishak, 1994). Historically, it has been among the top ten or 15 in the world (Vincent et al., 1997). Demersal fish (bottom dwelling) account for over 70 percent of the total fish harvested and some 80 percent are caught in inshore areas. Demersal fish comprise most landings on the west coast, whereas demersal and pelagic fish (surface or sometimes mid-water dwelling) are equally important on the east coast. Purse seine gear primarily harvest pelagic fish, such as mackerels, tunas, and sardines, whereas trawl gear primarily harvest prawns and demersal fish, such as pomfret, grouper, and snapper.
Inshore fishing grounds contain both demersal fish and pelagic fish, but the demersal stocks are the focus of most inshore fishing effort. Both pelagic and demersal fish inhabit offshore waters, and are generally thought to be underexploited. Offshore demersal resources are likely to remain beyond the reach of many trawlers in the foreseeable future due to technical and economic difficulties affecting trawl fishing in deep water, where the trawl net must be released and retrieved over a lengthy time and towed at considerable depth on or near the sea floor by vessels with powerful winches and engines. In contrast, offshore pelagic fish species are more readily accessible since they are usually surface dwelling and often form schools, which allows them to be readily harvested by purse seine gear, which can encircle the schools. For these reasons, the offshore fishery has historically targeted pelagic species using purse seine gear. Many pelagic species are migratory and scattered, which combined with the lengthy running time required to reach the farthest reaches of offshore grounds, requires vessels with refrigerated fish holds or the capacity to carry adequate stores of ice, fuel, and food to support more extended fishing trips.
The west coast fishing grounds lie largely in Malaysia's Extended Economic Zone in the Straights of Malacca (bounded by Sumatra) and the Southern Indian Ocean. The west coast's greater stocks of prawns and demersal fish provide the chief attraction for commercial vessels, and west coast issues have been the principal driving force for Peninsular Malaysian fishing policy during the last thirty years (Vincent et al., 1997). Fishing operations on the west coast are more highly capitalized compared to the east coast. Landings and vessel numbers are much greater on the west coast than the east coast, largely due to the greater fish resource abundance on the west coast and the absence of large prawn resources on the east coast, which sustain the trawl fishery of the west coast (Ooi, 1990). The west coast fishing grounds are generally shallow with muddy bottoms.

Extracted from : Pascoe, S.; Gréboval, D. (eds.) Measuring capacity in fisheries. FAO Fisheries Technical Paper. No. 445. Rome, FAO. 2003. 314p. http://www.fao.org/3/Y4849E/y4849e00.htm http://www.fao.org/3/Y4849E/y4849e0e.htm#bm16
The concentration of fishing in inshore waters led to overfishing off the west coast, beginning in the late 1960s and early 1970s, fuelled by the introduction of trawling to harvest prawns for lucrative export markets[122]. Landings are increasingly comprised of lower-valued species, especially 'trash fish', which are often discarded at sea with high mortality.[123] Most of the untapped fishery resources are pelagic.
The deep-sea fishery is regarded as a new frontier, and the Sixth Malaysia Plan (Government of Malaysia, 1991) emphasized raising deep-sea production (Vincent et al., 1997). The Sixth Malaysia Plan mentioned credit facilities for building offshore vessels and public investment in infrastructure for large vessels, such as harbour improvements, docks, and access roads. The Sixth Malaysia Plan (quoted in Vincent et al., 1997: p.111) stated that, "Due to the depletion of inshore resources, the future development of the fisheries sector will stress on [sic] deep-sea fishing and aquaculture in fresh and brackish water."
The area licence limitation programme spatially distributes fishing capacity through four main zones (Majid, 1985): (1) Zone 1, within five miles from shore, is reserved for owner-operator traditional fishing gear; (2) Zone 2, 5-12 miles from shore, is reserved for owner-operator trawlers and purse seiners < 40 GRT; (3) Zone 3, 12-30 miles, is reserved for owner-operator trawlers and purse seiners > 40 GRT; (4) Zone 4, beyond 30 miles to the outer limit of the Exclusive Economic Zone, is reserved for foreign or partially-Malaysian owned vessels ³ 70 GRT.
This area licensing system, in principle, spatially allocates vessels by size, with larger vessels farther offshore. The Department of Fisheries determines the number of licence granted for different gear although the actual allocation is determined at the state level (Vincent et al., 1997). Because the zoning system restricts types of vessels and gear but not numbers, the Department of Fisheries imposed a moratorium on new licences for all west coast vessels except those of 40 GRT and above in the hope of a gradual reduction in fishing effort. Monitoring and enforcement are difficult, the zones - especially prawn-rich inshore zones - are intruded upon, and there are many illegal, unlicensed vessels.
Purse seine gear (pukat jerut, pukat tarik, pukat kilat, encircling nets)[124] is designed with fine mesh to catch anchovy, and with a larger, coarser mesh, one or more species of high- and/or low-valued pelagic fish such as Spanish and Indian mackerel, herring, and sprats (Firth, 1975; Bailey, 1983; Ishak, 1994). The net is made of nylon and furnished with floats at the top and a row of heavy brass rings at the bottom through which a rope is reeved (Firth, 1975). The purse seine net, which provides employment to about 25 percent of all fishers, was introduced in the 1890s by Chinese fishers from South China who had settled in Thailand and latter migrated to Kedah and Pangkor Island. Purse seine vessels use inboard diesel-fuelled motors.

Extracted from : Pascoe, S.; Gréboval, D. (eds.) Measuring capacity in fisheries. FAO Fisheries Technical Paper. No. 445. Rome, FAO. 2003. 314p. http://www.fao.org/3/Y4849E/y4849e00.htm http://www.fao.org/3/Y4849E/y4849e0e.htm#bm16
After locating a shoal (school) of pelagic fish, fishers encircle this shoal by a net. Traditionally, purse seine vessels operate on darker phases of the moon, although there is also an active day fishery[125]. A fish aggregating device, such as a buoy or bamboo raft with flag pole and trailing coconut leaves or palm fronds, is left in the water in a known fishing area (Firth, McElroy, Munro and Loy, 1978). Lamps are generally used at night to attract fish. The vessel stands by, with engine off, until a reasonably sized school accumulates below the aggregating device. The process may be repeated at several sites. Some vessels actively search for schools of fish, using sonar, but other vessels still rely on the manual hearing of fish experts. Once the fish are located, the net is anchored to one end to the main vessel while a smaller and swifter vessel carries it around the shoal of fish. Alternatively, a powered vessel may tow a second vessel, which may be an older vessel without an engine and which carries the net (Bailey 1983). The net is drawn back to the main vessel, either by hand or by a powered winch, while the net bottom is drawn together, much like a purse, to prevent fish from sounding and escaping through the bottom of the net. The net is then lifted onboard and its contents dumped onto the deck, where the fish are sorted by species and stored below deck in ice, an ice-saturated brine, or an ice-meltwater mix as frozen fish (McElroy,1991).
Purse seining requires a good number of hands, with specialized crewmembers to perform technical assignments. There may be one to two captains (Taikong), fishing experts (Juruselam), one to two net men (Jurupukat), an engine person (Juruenjin), gasoline operator, and a set of ordinary deck workers, depending on the requirements of the vessel and net. The Juruselam, when employed, determines the existence of a shoal by manual hearing upon which shooting of the net occurs. The Taikong is in charge of the vessel, is responsible for the security and maintenance of all gear and equipment, gives commands as to when nets are dropped, and is the most knowledgeable and experienced person. In the absence of a Juruselam, the Taikong determines the existence of fish. Some vessels are more mechanized than others, equipped with fish detecting devices that can discriminate between targeted and non-targeted fish species, which is considerably more difficult for a Juruselam.
Fishing and fish abundance are affected by monsoons. Monsoons on the west coast, while not of the severity of the east coast, can still be accompanied by heavy seas and high winds. The more severe inclement weather makes fishing both more difficult and more dangerous. During the monsoon, stormy seas can combine with the increased run-off from rivers to produce a nutrient- rich environment in which plankton thrive, which in turn supports a wide variety of marine life (Bailey, 1983). At some point after the monsoon, catch rates can decline in step with the decline in organic content in the sea and hence marine life. During and immediately following monsoon periods, some species of fish may concentrate closer to the shoreline. During periods of calm, which coincides with reduced river discharge, nutrient levels drop and the fish may disperse over a wider area to forage for food.
Extracted from : Pascoe, S.; Gréboval, D. (eds.) Measuring capacity in fisheries. FAO Fisheries Technical Paper. No. 445. Rome, FAO. 2003. 314p. http://www.fao.org/3/Y4849E/y4849e00.htm http://www.fao.org/3/Y4849E/y4849e0e.htm#bm16
3. EMPIRICAL ANALYSIS[126]
3.1 Fishing capacity
Capacity can be defined and measured following either a technological-engineering approach or explicitly predicated on economic optimization from microeconomic theory (Morrison, 1985). Kirkley and Squires (1999) and the FAO Technical Working Group (TWG) on the Management of Fishing Capacity held in La Jolla, California in April, 1998 (FAO 1998) focused on the former because the general paucity of cost data in most fisheries world-wide militates against estimation of cost or profit functions to derive economic measures of capacity and capacity utilization (hereafter CU) (see Morrison (1995) for a survey of all approaches). The technological- economic approach is also the way that governments around the world define and measure capacity in all industries. In this paper, we focus on the technological-economic approach to measuring capacity and CU.
Capacity is a short-run concept, where firms and industry face short-run constraints, such as the stock of capital and existing regulations, and is conditional upon the existing state of technology (Morrison, 1995). Johansen (1968: p.52) defined capacity for the technological-economic approach as, "...the maximum amount that can be produced per unit of time with existing plant and equipment, provided the availability of variable factors of production is not restricted." The concept of capacity generally conforms to that of a full-input point on a production function, with the qualification that capacity represents a realistically sustainable maximum level of output rather than some higher unsustainable short-term maximum (Klein and Long, 1973).
In fisheries and other natural resource industries, capacity can also be defined conditional upon the size and composition (e.g. age structure, species, and density) of the resource stock[127]. When capacity is defined conditional upon the size and composition of the resource stock, it is a measure of the maximum potential output that could be produced at given resource stock levels. In this case, it does not provide a measure of the potential output that could be produced in the absence of resource constraints.
Excess capacity can be defined as the situation when capacity output exceeds a desired or target level of output, such as the Total Allowable Catch (an aggregate annual quota for the industry or fishery typically set by population biologists) (FAO, 1998; Kirkley and Squires, 1999). The target level of output was defined by the TWG as (FAO, 1998) as, "[t]arget fishing capacity is the maximum amount of fish over a period of time (year, season) that can be produced by a fishing fleet if fully utilized while satisfying fishery management objectives designed to ensure sustainable fisheries..."[128] The TWG observed that current and target capacity need to be evaluated and compared relative to the same resource stock size (FAO, 1998).
Extracted from : Pascoe, S.; Gréboval, D. (eds.) Measuring capacity in fisheries. FAO Fisheries Technical Paper. No. 445. Rome, FAO. 2003. 314p. http://www.fao.org/3/Y4849E/y4849e00.htm http://www.fao.org/3/Y4849E/y4849e0e.htm#bm16
3.2 Technical efficiency
Technical efficiency reflects the ability of a firm to obtain the maximum possible output from a given set of inputs and production technology[129]. Technical efficiency is a relative concept, since each firm's production performance is compared to a best-practice input-output relationship or production frontier. The most efficient firms establish the production frontier. Technical inefficiency is then measured as the deviation of an individual firm from this best-practice frontier.
3.3 Capacity utilization
Capacity utilization represents the proportion of available capacity that is utilized. In the technological-economic approach that was adopted by FAO, full CU represents full capacity and CU cannot exceed one. A CU value less than one indicates that firms have the potential for greater production without having to incur major expenditures for new capital or equipment (Klein and Summers, 1960).
CU can be measured in two different ways in the technological-economic approach. CU can be measured as the ratio of observed output to capacity output, which is the standard approach (cf. Morrison, 1985). CU can also be measured as the ratio of technically efficient output to capacity output (Färe et al., 1994). The latter definition corrects for any bias that could otherwise arise from technical inefficiency. That is, the technological-economic measure of capacity is predicated upon with full technical efficiency, so that the ratio of technically efficient output to capacity is consistent in that both numerator and denominator are technically efficient output levels. In contrast, the ratio of observed output to capacity output contains a numerator that may be technically inefficient and a denominator that is technically efficient. In turn, this may provide a CU measure that combines both deviations from full technical efficiency and full capacity.
3.4 Variable input utilization rate
The variable input utilization rate measures the ratio of optimal variable input usage to actual variable input usage, where the optimum variable input usage is that variable input level which gives full technical efficiency at the full capacity output level (Färe et al., 1994). If the ratio of the optimum variable input level to the observed variable input level exceeds 1.0 in value, there is a shortage of the ith variable input currently employed and the firm should expand use of that input. If the ratio is less than 1.0 in value, there is a surplus of the ith variable input currently employed and the firm should reduce use of that input. If the ratio equals 1.0, the actual usage of the ith variable input equals the optimal usage of the ith variable input.

Extracted from : Pascoe, S.; Gréboval, D. (eds.) Measuring capacity in fisheries. FAO Fisheries Technical Paper. No. 445. Rome, FAO. 2003. 314p. http://www.fao.org/3/Y4849E/y4849e00.htm http://www.fao.org/3/Y4849E/y4849e0e.htm#bm16
3.5 Measurement
Data envelopment analysis (DEA) can be used to estimate capacity, technical efficiency, and the variable input utilization rate (Färe et al., 1989, 1994). DEA is a nonparametric or mathematical programming technique to determine optimal solutions given a set of constraints. The maximum possible output given full utilization of the variable inputs, prices, the resource stocks, regulations, and state of technology corresponds to the frontier output under these conditions, and the ratio of observed to capacity output gives a measure of CU, which is also the measure of output-oriented technical efficiency when variable inputs are fully utilized. Returns to scale are allowed to vary. Full utilization of the variable inputs means they are unconstrained, i.e. there are not any bounds on their use. All multiple outputs vary in fixed proportions (a radial expansion). The fixed inputs are bound by their observed values for each observation but do not have to be fully utilized.
The difference between observed and capacity output gives the excess capacity for that resource stock. In many fisheries, observed output is the Total Allowable Catch.
The heterogeneous capital stock forms quasi-fixed or fixed factors, and can be captured by different proxy variables, each of which measures one of the capital components. These proxy variables can include those that resource managers denote as most important at capturing production and which are most easily regulated, such as vessel length or gross registered tonnage and main engine horsepower. By specifying a heterogeneous capital stock, the specification does not necessarily a priori denote any individual piece of capital as binding or fully utilized, and in fact, not all fixed factors necessarily will bind. Instead, the data can determine the individual component of the heterogeneous capital stock that binds on a firm-by-firm basis. For instance, the vessel length might bind for one firm while engine horsepower might bind for another firm.
When there is a heterogeneous capital stock, so that there are multiple fixed or quasi-fixed factors, it may not be possible to determine the capacity output (Berndt and Fuss, 1989)[130]. However, in two different ways, the DEA approach effectively converts the heterogeneous capital stock (multiple fixed factors) into a single measure of the capital stock (composite fixed factor) to solve this indeterminancy problem. First, because the DEA measure of capacity is output oriented, i.e. the maximum output given fixed inputs, the fixed inputs or heterogeneous capital stock are held constant at observed levels, and as discussed above, that individual component of the heterogeneous capital stock that is fully utilized (binding) is the individual capital stock that determines capacity. Second, and more importantly, the DEA measure of capacity entails a radial expansion of both outputs and inputs, that is, outputs are in fixed proportions for any output levels and inputs are in fixed proportions for any input levels. When fixed inputs are in fixed proportions, an aggregate fixed input or capital stock can be formed (called Leontief separability). This effectively converts the multiple fixed factors into a composite measure.

Extracted from : Pascoe, S.; Gréboval, D. (eds.) Measuring capacity in fisheries. FAO Fisheries Technical Paper. No. 445. Rome, FAO. 2003. 314p. http://www.fao.org/3/Y4849E/y4849e00.htm http://www.fao.org/3/Y4849E/y4849e0e.htm#bm16
When there are multiple outputs, a similar problem arises because a scalar measure of output does not generally exist (Segerson and Squires, 1990)[131]. However, the DEA approach to capacity measurement effectively converts the multiple products into a single composite output because there is a radial expansion of outputs (outputs are in fixed proportions for different input levels), which gives a ray measure of capacity, and CU and implicitly imposes Leontief separability among the outputs.
We consider the output-oriented DEA model of capacity of Färe et al. (1989):
(1)
The variables are as follows: (1) ujm is the mth monthly output of the jth observation, and there are nine outputs (J = 9); (2) xjn is the nth input used in a month, and there are four fixed factors and two variable factors. The four fixed factors are gross registered tonnage (GRT), length of hull in meters, engine horsepower, and length of net in meters. The two variable factors are days at sea per month and total number of crew per month[132]. We allow for variable returns to scale.
The problem for assessing only technical efficiency of production is solved by simply deleting the equality constraint on the variable inputs and including the variable inputs in the inequality constraint. The ratio of technical efficiency calculated from the output-oriented model, with the inequality constraints on the variable and fixed factors, to technical efficiency calculated from the output-oriented model with equality constraints on the variable inputs, gives an unbiased measure of CU (Färe et al., 1989).
Extracted from : Pascoe, S.; Gréboval, D. (eds.) Measuring capacity in fisheries. FAO Fisheries Technical Paper. No. 445. Rome, FAO. 2003. 314p. http://www.fao.org/3/Y4849E/y4849e00.htm http://www.fao.org/3/Y4849E/y4849e0e.htm#bm16
Our analysis excludes stock size because we do not have fishery-independent measures of stock abundance; our measures of stock abundance are the catch (CPUE) or landings (LPUE) per unit of fishing effort. The two measures, CPUE and LPUE, are well known to have numerous problems relative to being adequate indicators of resource abundance (Richards and Schnute, 1986).
3.6 Data
Data were obtained in a multistage sampling procedure. The first and second stages involved first the selection of States and then the fisheries districts within the States where most of the relevant gear operates. This was based on the Annual Fisheries Statistics of the Department of Fisheries, Malaysia, which provides statistics on landing of marine fish, number of licensed fishing vessels and gears, number of fishers, and other related information by fisheries districts, states, and fishing gears. Based on the criteria of gear concentration and their contribution to fisheries production and revenue the states selected were Johor, Perak, Kedah, and Perlis from the west coast of Peninsular Malaysia. The selected fishing districts were Mersing from Johor, Manjung from Perak, Kuala Kedah from Kedah, and Kuala Perlis from Perlis. Lists of licensed vessels with the owner's name and addresses were obtained from the Department of Fisheries. A second list was collected from the offices of the fisher cooperative association and the Department of Fisheries within the selected districts to determine the actual number of vessels operating in the fishery. The sample was randomly selected from this list.
The vessel owner was interviewed by administering a pre-tested questionnaire. The number of west coast purse seine vessels in the sample was 55. The number of fishers interviewed by State was: Perak (15), Kedah (14), and Perlis (26). The questionnaires were administered from August to October, 1988. Respondents were requested to provide information on one month's catch each of the non-monsoon season (April to October) and the immediate past monsoon season (November to March)[133].
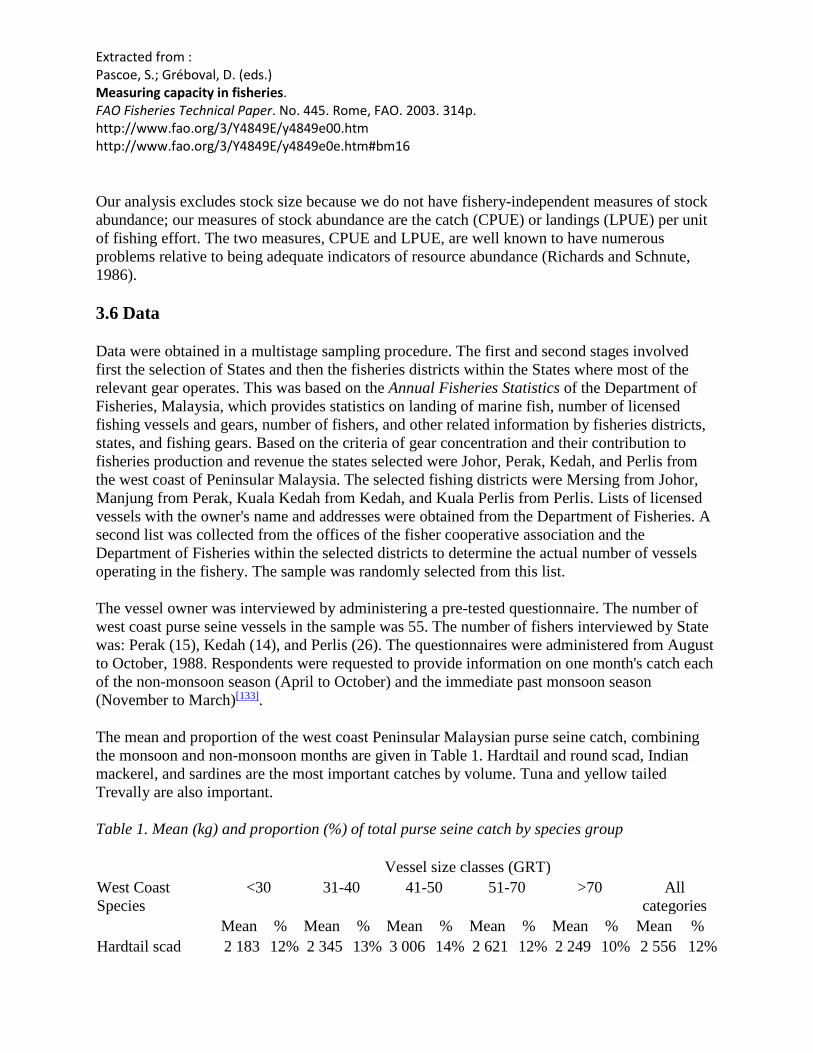
The mean and proportion of the west coast Peninsular Malaysian purse seine catch, combining the monsoon and non-monsoon months are given in Table 1. Hardtail and round scad, Indian mackerel, and sardines are the most important catches by volume. Tuna and yellow tailed Trevally are also important.
Table 1. Mean (kg) and proportion (%) of total purse seine catch by species group
West Coast Species
Vessel size classes (GRT) <30 31-40 41-50 51-70 >70 All
categories Mean % Mean % Mean % Mean % Mean % Mean %
Hardtail scad 2 183 12% 2 345 13% 3 006 14% 2 621 12% 2 249 10% 2 556 12%

Extracted from : Pascoe, S.; Gréboval, D. (eds.) Measuring capacity in fisheries. FAO Fisheries Technical Paper. No. 445. Rome, FAO. 2003. 314p. http://www.fao.org/3/Y4849E/y4849e00.htm http://www.fao.org/3/Y4849E/y4849e0e.htm#bm16 Selar scad 1 520 8% 1 408 8% 1 534 7% 1 041 5% 1 599 7% 1 292 6% Tuna 892 5% 1 217 7% 2 767 13% 2 418 11% 1 127 5% 1 969 10% Indian mackerel 3 829 21% 3 946 21% 4 525 21% 5 534 26% 5 508 24% 4 869 24% Yellow striped trevally
1 862 10% 1 589 8% 1 703 8% 2 132 10% 3 090 13% 1 996 10%
Round scad 2 675 14% 2 820 15% 3 336 16% 2 685 13% 3 168 14% 2 869 14% Ox-eye scad 1 350 7% 1 711 9% 1 077 5% 1 328 6% 1 440 6% 1 396 7% Sardine 3 538 19% 3 107 17% 2 806 13% 2 795 13% 3 275 14% 2 963 14% Mixed 738 4% 579 3% 360 2% 711 3% 1 482 6% 691 3% All species 18
633 100% 18
720 100% 21
113 100% 21
265 100% 22
936 100% 20
600 100%
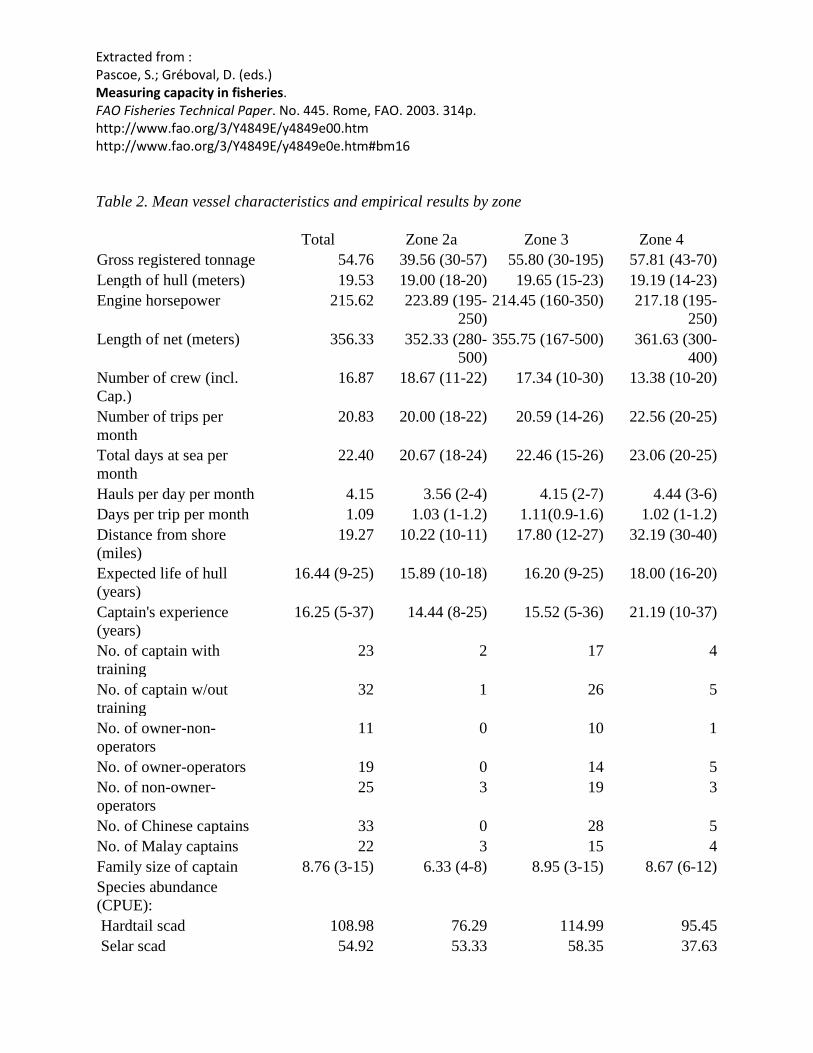
In Table 2, the mean vessel and fishing trip characteristics per month, by licence zone, combining monsoon and non-monsoon months are presented. Mean vessel size, indicated by the volumetric measure Gross Registered Tonnes (GRT), increases with distance from shore, although vessel length remains constant and some smaller vessels also fish in Zone 4. As vessels fish further offshore, their size tends to increase to hold larger catches and better handle rougher seas and adverse weather conditions. Engine horsepower remain roughly constant by zone. Mean expected life of the vessel hull increases with distance from shore. The purse seine nets are long, averaging 356 meters, with the length consistently slightly increasing with distance from shore[134]. Mean days at sea and number of trips per month increase with distance from shore, reflecting among other things, longer transit distances and times. Mean days per trip remains largely unchanged by zone. The mean number of hauls of the purse seine net per day per month increases with distance from shore. Interestingly, the mean number of crew (including captain) decreases with distance from shore, perhaps reflecting a greater eye to cost efficiency and stronger commercial orientation.
Fish abundance for the different species, measured by mean catch per day per month (catch per unit effort, CPUE), is also reported in Table 2[135]. We present CPUE only to provide information by which to relate technical efficiency, capacity, CU, and variable input utilization to resource levels. Abundance varies by species and zone. Zone 1 exhibits the greatest abundance for round scad, lolong, and sardines. Zone 2 exhibits the highest abundances for hardtail and selar scad and Indian mackerel. Zone 3 displays the highest abundances for only yellow striped Trevally and mixed species.
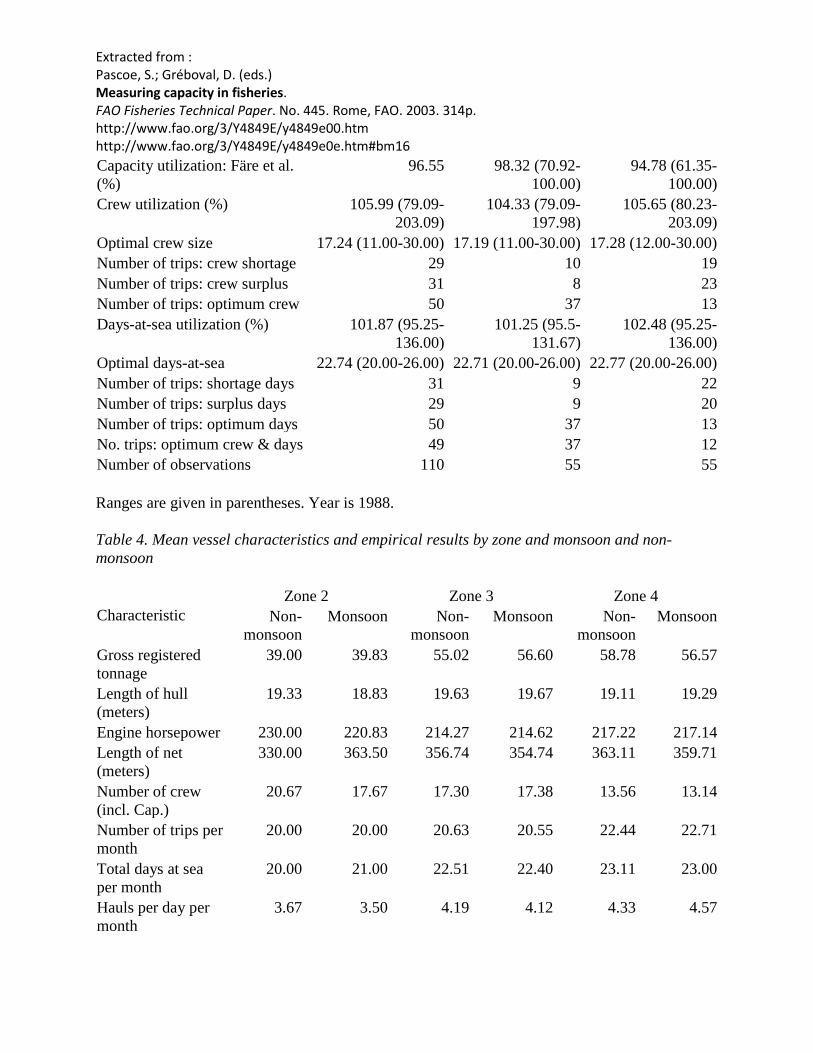
Days-at-sea utilization on an annual basis is very close to the optimum for Zones 3 and 4 (Table 2). However, optimum days at sea fall below the observed for Zone 2 vessels, suggesting these vessels should spend fewer days at sea[136]. Averaged over all zones, days-at-sea utilization drops slightly from the normal to monsoon seasons (Table 3). On a zonal basis, Zone 2 vessels' days-at-sea utilization increases slightly from the normal to monsoon season, while dropping slightly for Zone 3 and Zone 4 vessels (Table 4).
Extracted from : Pascoe, S.; Gréboval, D. (eds.) Measuring capacity in fisheries. FAO Fisheries Technical Paper. No. 445. Rome, FAO. 2003. 314p. http://www.fao.org/3/Y4849E/y4849e00.htm http://www.fao.org/3/Y4849E/y4849e0e.htm#bm16
Table 2. Mean vessel characteristics and empirical results by zone
Total Zone 2a Zone 3 Zone 4 Gross registered tonnage 54.76 39.56 (30-57) 55.80 (30-195) 57.81 (43-70) Length of hull (meters) 19.53 19.00 (18-20) 19.65 (15-23) 19.19 (14-23) Engine horsepower 215.62 223.89 (195-
250) 214.45 (160-350) 217.18 (195-
250) Length of net (meters) 356.33 352.33 (280-
500) 355.75 (167-500) 361.63 (300-
400) Number of crew (incl. Cap.)
16.87 18.67 (11-22) 17.34 (10-30) 13.38 (10-20)
Number of trips per month
20.83 20.00 (18-22) 20.59 (14-26) 22.56 (20-25)
Total days at sea per month
22.40 20.67 (18-24) 22.46 (15-26) 23.06 (20-25)
Hauls per day per month 4.15 3.56 (2-4) 4.15 (2-7) 4.44 (3-6) Days per trip per month 1.09 1.03 (1-1.2) 1.11(0.9-1.6) 1.02 (1-1.2) Distance from shore (miles)
19.27 10.22 (10-11) 17.80 (12-27) 32.19 (30-40)
Expected life of hull (years)
16.44 (9-25) 15.89 (10-18) 16.20 (9-25) 18.00 (16-20)
Captain's experience (years)
16.25 (5-37) 14.44 (8-25) 15.52 (5-36) 21.19 (10-37)
No. of captain with training
23 2 17 4
No. of captain w/out training
32 1 26 5
No. of owner-non-operators
11 0 10 1
No. of owner-operators 19 0 14 5 No. of non-owner-operators
25 3 19 3
No. of Chinese captains 33 0 28 5 No. of Malay captains 22 3 15 4 Family size of captain 8.76 (3-15) 6.33 (4-8) 8.95 (3-15) 8.67 (6-12) Species abundance (CPUE):
Hardtail scad 108.98 76.29 114.99 95.45 Selar scad 54.92 53.33 58.35 37.63

Extracted from : Pascoe, S.; Gréboval, D. (eds.) Measuring capacity in fisheries. FAO Fisheries Technical Paper. No. 445. Rome, FAO. 2003. 314p. http://www.fao.org/3/Y4849E/y4849e00.htm http://www.fao.org/3/Y4849E/y4849e0e.htm#bm16 Tuna 83.75 52.84 85.23 93.27 Indian mackerel 206.69 185.92 213.92 180.04 Y. S. Trevally 83.64 58.29 82.86 102.01 Round scad 123.50 157.53 121.43 115.32 Lolong 58.71 66.43 59.50 50.17 Sardine 126.03 165.88 124.35 112.53 Mixed species 28.91 17.04 28.17 39.48
Output technical efficiency
1.09 (1.00-1.89) 1.08 (1-1.17) 1.11(1-1.89) 1.04 (1-1.17)
Capacity technical efficiency
1.14 (1.00-1.90) 1.19 (1-1.55) 1.14 (1-1.9) 1.10 (1-1.41)
CU: observed (%) 89.46 (52.63-100.00)
85.42 (64.52-100)
89.47 (52.63-100)
91.68 (70.92-100)
CU: Färe et al. (%) 96.55 (61.35-100.00)
91.67 (64.52-100)
97.38 (61.35-100)
94.88 (70.92-100)
Crew utilization (%) 104.99 (79.09-203.09)
95.72 (79.09-139.06)
102.74 (81.95-203.09)
122.19 (99.62-197.98)
Optimal crew size 17.24 (11.00-30.00)
17.33 (15.29-20.00)
17.52 (11.00-30.00)
15.71 (11.00-20.00)
No. of trips: crew shortage
29 2 19 8
No. of trips: crew surplus 31 5 25 1 No.of trips: optimum crew
50 2 41 7
Days-at-sea utilization (%)
101.87 (95.25-136.00)
111.45 (99.54-131.67)
101.24 (95.25-136.00)
99.82 (95.48-106.54)
Optimal days-at-sea 22.74 (20.00-26.00)
22.85 (20.00-24.00)
22.68 (20.00-26.00)
23.00 (20.00-25.00)
No. of trips: shortage days
31 6 22 3
No. of trips: surplus days 29 1 22 6 No. of trips: optimum days
50 2 41 7
No. trips: optimum crew & days
49 2 40 7
No. of observations 110 9 85 16
a Zones are based on nautical distances from shore: (1) Zone 2 > 5 miles but < 12 miles; (2) Zone 3 > 12 miles but< 30 nautical miles; and (3) Zone 4 > 30 nautical miles. Ranges given in parentheses. Year is 1988. Results averaged over both monsoon and non-monsoon.

Extracted from : Pascoe, S.; Gréboval, D. (eds.) Measuring capacity in fisheries. FAO Fisheries Technical Paper. No. 445. Rome, FAO. 2003. 314p. http://www.fao.org/3/Y4849E/y4849e00.htm http://www.fao.org/3/Y4849E/y4849e0e.htm#bm16
Table 3. Mean vessel characteristics and empirical results by monsoon and non-monsoon
Total Non-monsoon Monsoon Gross registered tonnage 54.76 54.76 54.76 Length of hull (meters) 19.53 19.53 19.53 Engine horsepower 215.62 215.62 215.62 Length of net (meters) 356.33 356.33 356.33 Number of crew (incl. Cap) 16.87 16.87 16.87 Number of trips per month 20.83 20.89 20.76 Total days at sea per month 22.40 22.47 22.33 Hauls per day per month 4.15 4.18 4.11 Days per trip per month 1.09 1.09 1.09 Distance from shore (miles) 19.27 19.58 18.96 Expected life of hull (years) 16.44 (9-25) 16.44 (9-25) 16.44 (9-25) Captain's fishing experience (years)
16.25 (5-37) 16.25 (5-37) 16.25 (5-37)
No. of captain with training 23 23 23 No. of captain without training 32 32 32 No. of owner-non-operators 11 11 11 No. of owner-operators 19 19 19 No. of non-owner-operators 25 25 25 No. of Chinese captains 33 33 33 No. of Malay captains 22 22 22 Family size of captain 8.76 (3-15) 8.76 (3-15) 8.76 (3-15) Species abundance (CPUE)
Hardtail scad 108.98 121.76 96.19 Selar scad 54.92 61.58 48.26 Tuna 83.75 94.59 72.92 Indian mackerel 206.69 231.36 182.03 Y. S. Trevally 83.64 93.89 73.38 Round scad 123.50 134.01 112.98 Lolong 58.71 65.70 51.72 Sardine 126.03 138.52 113.54 Mixed species 28.91 32.60 25.21
Output technical efficiency 1.09 1.02 (1.00-1.48) 1.17 (1.00-1.89) Capacity technical efficiency 1.14 1.04 (1.00-1.51) 1.24 (1.00-1.90) Capacity utilization: observed (%)
89.46 96.94 (66.23-100.00)
81.98 (52.63-100.00)
Extracted from : Pascoe, S.; Gréboval, D. (eds.) Measuring capacity in fisheries. FAO Fisheries Technical Paper. No. 445. Rome, FAO. 2003. 314p. http://www.fao.org/3/Y4849E/y4849e00.htm http://www.fao.org/3/Y4849E/y4849e0e.htm#bm16 Capacity utilization: Färe et al. (%)
96.55 98.32 (70.92-100.00)
94.78 (61.35-100.00)
Crew utilization (%) 105.99 (79.09-203.09)
104.33 (79.09-197.98)
105.65 (80.23-203.09)
Optimal crew size 17.24 (11.00-30.00) 17.19 (11.00-30.00) 17.28 (12.00-30.00) Number of trips: crew shortage 29 10 19 Number of trips: crew surplus 31 8 23 Number of trips: optimum crew 50 37 13 Days-at-sea utilization (%) 101.87 (95.25-
136.00) 101.25 (95.5-
131.67) 102.48 (95.25-
136.00) Optimal days-at-sea 22.74 (20.00-26.00) 22.71 (20.00-26.00) 22.77 (20.00-26.00) Number of trips: shortage days 31 9 22 Number of trips: surplus days 29 9 20 Number of trips: optimum days 50 37 13 No. trips: optimum crew & days 49 37 12 Number of observations 110 55 55
Ranges are given in parentheses. Year is 1988.
Table 4. Mean vessel characteristics and empirical results by zone and monsoon and non-monsoon
Characteristic Zone 2 Zone 3 Zone 4
Non-monsoon
Monsoon Non-monsoon
Monsoon Non-monsoon
Monsoon
Gross registered tonnage
39.00 39.83 55.02 56.60 58.78 56.57
Length of hull (meters)
19.33 18.83 19.63 19.67 19.11 19.29
Engine horsepower 230.00 220.83 214.27 214.62 217.22 217.14 Length of net (meters)
330.00 363.50 356.74 354.74 363.11 359.71
Number of crew (incl. Cap.)
20.67 17.67 17.30 17.38 13.56 13.14
Number of trips per month
20.00 20.00 20.63 20.55 22.44 22.71
Total days at sea per month
20.00 21.00 22.51 22.40 23.11 23.00
Hauls per day per month
3.67 3.50 4.19 4.12 4.33 4.57

Extracted from : Pascoe, S.; Gréboval, D. (eds.) Measuring capacity in fisheries. FAO Fisheries Technical Paper. No. 445. Rome, FAO. 2003. 314p. http://www.fao.org/3/Y4849E/y4849e00.htm http://www.fao.org/3/Y4849E/y4849e0e.htm#bm16 Days per trip per month
1 1.05 1.11 1.11 1.03 1.01
Distance from shore (miles)
10 10.33 17.60 18.00 32.22 32.14
Expected life of hull (years)
16.67 (16-18)
15.50 (10-18)
16.09 (9-25)
16.31 (9-25) 18.0 (16-20) 18.0 (16-20)
Captain's experience (years)
14.67 (9-20)
14.33 (8-25) 15.30 (5-36)
15.74 (5-36) 21.33 (10-37)
21.00 (10-37)
No. of captain with training
2 2 17 18 4 3
No. of captain w/out training
1 4 26 24 5 4
No. of owner-non-operators
0 0 10 10 1 1
No. of owner-operators
0 1 14 14 5 4
No. of non-owner-operators
3 5 19 18 3 2
No. of Chinese captains
0 3 28 26 5 4
No. of Malay captains
3 3 15 16 4 3
Family size of captain
6.33 (4-8) 7.67 (4-12) 8.95 (3-15) 8.83 (3-15) 8.67 (6-12) 9.28 (7-12)
Species abundance (CPUE):
Hardtail scad 97.16 65.85 125.71 104.01 111.14 75.27 Selar scad 68.61 45.69 65.20 51.32 41.94 32.09 Tuna 51.56 54.48 96.33 73.87 100.59 86.87 Indian mackerel 221.25 168.25 240.98 186.20 188.77 168.81 Y. S. Trevally 50.11 62.37 92.02 73.49 117.44 82.17 Round scad 203.47 134.55 132.24 110.37 119.34 110.14 Lolong 77.78 60.75 67.89 50.91 51.18 48.87 Sardine 193.90 151.87 138.03 110.34 122.36 99.89 Mixed species 22.53 14.30 31.51 24.75 41.16 37.33 Output technical efficiency
1.00 (1.00-1.00)
1.11(1.00-1.17)
1.02 (1.00-1.48)
1.19 (1.00-1.89)
1.01 (1.00-1.07)
1.08 (1.00-1.17)
Capacity technical efficiency
1.04 (1.00-1.19)
1.27 (1.12-1.55)
1.03 (1.00-1.51)
1.25 (1.00-1.90)
1.07 (1.00-1.41)
1.15 (1.00-1.29)
CU: observed (%) 96.6 (90.9-100.0)
79.8 (64.5-89.2)
97.4 (66.2- 100.0)
81.3 (52.6-100.0)
94.6 (70.9-100.0)
87.9 (77.5-100.0)

Extracted from : Pascoe, S.; Gréboval, D. (eds.) Measuring capacity in fisheries. FAO Fisheries Technical Paper. No. 445. Rome, FAO. 2003. 314p. http://www.fao.org/3/Y4849E/y4849e00.htm http://www.fao.org/3/Y4849E/y4849e0e.htm#bm16 CU: Färe et al. (%) 96.6 (90.9-
100) 89.1 (61.5-
100.0) 99.0 (87.7-
100.0) 95.6 (61.3-
100.0) 95.3 (70.9-
100.0) 94.3 (83.3-
100.0) Crew utilization (%)
88.1 (79.0-100. 0)
99.0 (80.2-139.0)
101.1 (83.2- 149.5)
103.8 (81.9-203.0)
122.7 (100.0-197.9)
121.4 (99.6-160.0)
Optimal crew size 18.1 (17.0-20.0)
16.91 (15.2-18.2)
17.3 (11.0-30.0)
17.6 (12.0-30.0)
15.9 (11.0-20.0)
15.4 (12.9-20.0)
No. of trips: crew shortage
0 2 6 13 4 4
No.of trips: crew surplus
2 3 6 19 0 1
No.of trips: optimum crew
1 1 31 10 5 2
Days-at-sea utilization (%)
112.5 (100-131.6)
110.9 (99.5-130.9)
100.8 (96.7- 119.1)
101.6 (95.2-136.00)
99.5 (95.5-105.3)
100.1 (95.4-106.5)
Optimal days-at-sea
22.3 (20.0-23.7)
23.1 (21.7-24.0)
22.6 (20.0-26.0)
22.6 (20.0-26.0)
23.0 (20.0-25.0)
23.0 (20.0-25.0)
No.of trips: shortage days
2 4 6 16 1 2
No.of trips: surplus days
0 1 6 16 3 3
No.of trips: optimum days
1 1 31 10 5 2
No. trips: optimum crew & days
1 1 31 9 5 2
No. of observations 3 6 43 42 9 7
a Zones are based on nautical miles from shore: (1) Zone 2 > 5 but < 12 miles (2) Zone 3 > to 12 but < 30 miles (3) Zone 4 > 30 miles. Ranges in parentheses. Year is 1988.
In summary, the DEA empirical results, reported in Tables 2-4, indicate: (1) close to full technical efficiency for all three offshore licence zones, measured at both observed output and at full capacity, during the non-monsoon season, and declining during the monsoon; (2) for all three offshore licence zones, close to full CU during the non-monsoon season but somewhat reduced CU during the monsoon season; (3) vessels in Zones 3 and 4 with about the right days at sea during both seasons for full technical efficiency evaluated at full capacity output; (4) vessels in Zone 3 with the right crew size but vessels in Zone 4 somewhat overmanned during both seasons for full technical efficiency evaluated at full capacity output; and (5), vessels in Zone 2 that should fish fewer days at sea and add crew for both seasons to enhance technical efficiency evaluated at full capacity output.

Extracted from : Pascoe, S.; Gréboval, D. (eds.) Measuring capacity in fisheries. FAO Fisheries Technical Paper. No. 445. Rome, FAO. 2003. 314p. http://www.fao.org/3/Y4849E/y4849e00.htm http://www.fao.org/3/Y4849E/y4849e0e.htm#bm16
The high degrees of technical efficiency, CU, and variable input utilization do not appreciably vary by forms of owner-operatorship (Tables 2-4). This constancy across arrangements suggests that moral hazard or principal-agent problems arising from the divorce of ownership and operatorship do not arise.
4. CONCLUDING REMARKS Malaysia's fisheries policy promoting fishing capacity offshore, including movement from inshore waters has, for the west coast purse seine fleet of Peninsular Malaysia, largely resulted in, and/or coincided with, the desired matching of catch with capacity and with a very high level of technical efficiency. In light of the generally perceived belief (although not universally agreed upon) that offshore resource stocks are not overfished, and in the absence of formal biological resource stock assessments, Malaysia's policy for the west coast purse seine fishery can be viewed as biologically and economically sustainable. Whether the policy was the main motivating impetus behind the high level of technical efficiency and close to full CU cannot be directly ascertained, but at a minimum, the policy did not hinder. The truth probably lies somewhere in between, as a combination of governmental policy and industry responses to biological, governmental, and market conditions. There is also the added bonus that production is technically efficient.
The empirical results of this paper are short-run, conditional upon the existing capital and resource stocks. While at the vessel-level the government policy is largely successful on the west coast given the capital and resource stocks, the fishery as a whole might have excess capacity. The long-run steady-state level capacity can only be assessed with biological estimates of optimum fish stock sizes for the different species and the corresponding annual catch levels (total allowable catches or TACs). If optimal TACs were available by licence zone, the sum of the vessel capacities could be summed and matched with the TACs to provide a measure of excess capacity (Kirkley and Squires, 1999).
Although the broad capacity and overall technical efficiency pictures are about right, the Malaysian government and purse seine industry could, nonetheless, enhance efficiency by some fine-tuning. Government and industry could promote larger crew sizes and fewer days at sea for those purse seine vessels fishing in the licence zone just outside of that reserved for artisanal fishers and could encourage slightly smaller crews for those purse seine vessels fishing farther offshore.
In sum, the policy promoting harvests of offshore waters to efficiently produce fish, provide employment, and more fully utilize natural resource stocks appears to have been satisfied for purse seine vessels and pelagic fish species on the west coast of Peninsular Malaysia. In the absence of evidence to the contrary, the fishery and policy are biologically and economically sustainable.
Extracted from : Pascoe, S.; Gréboval, D. (eds.) Measuring capacity in fisheries. FAO Fisheries Technical Paper. No. 445. Rome, FAO. 2003. 314p. http://www.fao.org/3/Y4849E/y4849e00.htm http://www.fao.org/3/Y4849E/y4849e0e.htm#bm16
5. REFERENCES Bailey, C. 1983. The Sociology of Production in Rural Malay Society. Kuala Lumpur: Oxford University Press.
Bailey, C., Dwiponggo, A. & Marahudin, F. 1987. Indonesian Marine Capture Fisheries. ICLARM Studies and Reviews 10. Manila: International Centre for Living Aquatic Resources Management, Jakarta, Indonesia: Directorate General of Fisheries, and Marine Fisheries Research Institute, Ministry of Agriculture, 196 pp.
Bailey, C. 1997. Lessons from Indonesia's 1980 Trawler Ban. Marine Policy, 21(3): pp. 225-235.
Berndt, E.R. 1990. Comment to 'The Measurement of Capital' by Charles R. Hulten. In Ernst R. Berndt and Jack E. Triplett, eds., Fifty Years of Economic Measurement. Studies in Income and Wealth Volume 54, National Bureau of Economic Research. University of Chicago Press.
Berndt, E.R. & Fuss, M. 1989. Economic Capacity Utilization and Productivity Measurement for Multiproduct Firms with Multiple Quasi-Fixed Inputs. National Bureau of Economic Research Working Paper No. 2932. Cambridge, Mass.
Charnes, A., Cooper, W.W., Lewin, A.Y. & Seiford, L.M. 1994. Data Envelopment Analysis: the Theory, the Method and the Process. Boston: Dordrecht, London: Kluwer Academic press.
Department of Statistics, Government of Malaysia. Various years. Annual Fisheries Statistics.
Färe, R., Grosskopf, S. & Kokkelenberg, E.C. 1989. Measuring Plant Capacity, Utilization and Technical Change: A Nonparametric Approach, International Economic Review, 30(3): pp. 655-666.
Färe, R., Grosskopf, S. & Lovell, C.A.K. 1994. Production Frontiers. Cambridge, United Kingdom: Cambridge University Press.
FAO. 1998. Report of the Technical Working Group on the Management of Fishing Capacity. La Jolla, United States, 15-18 April 1998. FAO Fisheries Report No. 586. Rome, FAO.
Firth, R. 1975. Malay Fishermen: Their Peasant Economy, second edition, New York: Norton.
Indo-Pacific Fishery Commission (IPFC) 1994. Socio-Economic Issues in Coastal Fisheries Management, Bangkok.
Extracted from : Pascoe, S.; Gréboval, D. (eds.) Measuring capacity in fisheries. FAO Fisheries Technical Paper. No. 445. Rome, FAO. 2003. 314p. http://www.fao.org/3/Y4849E/y4849e00.htm http://www.fao.org/3/Y4849E/y4849e0e.htm#bm16
Ishak, H.O., Noh, K.M., Abdullah, N.M.R. & Kuperan, K. 1991. Malaysian Fisheries Policy: Search for New Grounds. Marine Policy, 16(6): pp. 438-450.
Ishak, H.O. 1994. Market Power, Vertical Linkages and Government Policy: The Malaysian Fish Industry, Singapore: South-East Asian Social Science Monographs, Oxford University Press.
Jahara, Y. 1988. Fishery Management and Regulation in Peninsular Malaysia: Issues and Constraints, Marine Resource Economics, 5: pp. 83-98.
Johansen, L. 1968. Production Functions and the Concept of Capacity, In Recherches récentes sur la fonction de production. Namur: Centre d'Etudes et de la Recherche Universitaire de Namur.
Kirkley, J.E. & Squire, D. 1999. Measuring Capacity and Capacity Utilization in Fisheries. In: Gréboval, D (Ed). Managing Fishing Capacity: Selected Papers on Underlying Concepts and Issues. FAO Fisheries Technical Paper No 386. pp. 75-200. Rome, FAO.
Klein, L.R. & Long, V. 1973. Capacity Utilization: Concept, Measurement, and Recent Estimates, Brookings Papers on Economic Activity, 3: pp. 743-756.
Klein, L.R. & Summers, R. 1966. The Wharton Index of Capacity Utilization. Philadelphia: University of Pennsylvania, Studies in Quantitative Economics, 94 pp.
Kurien, J. 1996. Towards a New Agenda for Sustainable Small-Scale Fisheries Development. Kerala, India: South Indian Federation of Fishermen Societies.
Lawson, R. 1984. Economics of Fisheries Development. New York: Praeger Publishers.
Majid, S.A. 1985. Controlling Fishing Effort: Malaysia's Experience and Problems. FAO Fisheries Technical Report 289, Supplement 3. Rome, FAO.
Malaysia, Government of. 1991. Sixth Malaysia Plan. Kuala Lumpur.
McElroy, J. 1991. The Java Sea Purse Seine Fishery: A Modern-Day 'Tragedy of the Commons'? Marine Policy, 15(4): pp. 255-271.
Meyen, W. 1989. Fisheries Development Resources Depletion and Political Mobilization in Kerala: The Problem of Alternatives, Development and Change, 20(4): pp. 735-770.

Extracted from : Pascoe, S.; Gréboval, D. (eds.) Measuring capacity in fisheries. FAO Fisheries Technical Paper. No. 445. Rome, FAO. 2003. 314p. http://www.fao.org/3/Y4849E/y4849e00.htm http://www.fao.org/3/Y4849E/y4849e0e.htm#bm16
Mohammed I.H.M.. 1991. National Management of Malaysian Fisheries. Marine Policy, 15(1): pp. 2-14.
Morrison, C.J. 1985. Primal and Dual Capacity Utilization: An Application to Productivity Measurement in the United States Automobile Industry. Journal of Business and Economic Statistics, 3: pp. 312-324.
Ooi, J.B. 1990. Development Problems of an Open-Access Resource: The Fisheries of Peninsular Malaysia. Occasional Paper No. 86. Singapore: Institute of Southeast Asian Studies.
Panayotou, T. 1982. Management Concepts for Small-Scale Fisheries: Economic and Social Aspects, FAO Fisheries Technical Paper, No. 228. Rome, FAO.
Panayotou, T. & Jetanavanich, S. 1987. The Economics and Management of Thai Marine Fisheries. ICLARM Studies and Reviews 14. Manila: International Centre for Living Aquatic Resources Management, 82 pp.
Pauly, D. 1997. Small-Scale Fisheries in the Tropics: Marginality, Marginalization, and Some Implications for Fisheries Management, in E.K. Pikitch, D.D. Huppert, and M.P. Sissenwine (eds.), Global Trends: Fisheries Management. American Fisheries Society Symposium 20, Bethesda, Maryland.
Platteau, J.P. 1989a. The Dynamics of Fisheries Development in Developing Countries: A General Overview, Development and Change, 20: pp. 565-597.
Platteau, J.P. 1989b. Penetration of Capitalism and Persistence of Small-Scale Organizational Forms in Third World Fisheries. Development and Change, 20: pp. 621-652.
Richards, L.J. & Schnute, J.T. 1986. An Experimental and Statistical Approach to the Question: Is CPUE An Index of Abundance? Canadian Journal of Fisheries and Aquatic Sciences, 43: pp. 1214-1227.
Robinson, M.A. 1976. Reconciling Conflicts Among Economic Interest Groups in Southeast Asian Fisheries. In Klau Tiews, ed., Fisheries Resources and Their Management in Southeast Asia. Bonn: Druckerei Heinz Lammerich.
Saharuddin, A.H. 1995. Development and Management of Malaysian Marine Fisheries. Marine Policy, 19(2): pp. 115-126.
Segerson, K. & Squires, D. 1994. On the Measurement of Economic Capacity Utilization for Multi-Product Industries. Journal of Econometrics, 44: pp. 347-361.

Extracted from : Pascoe, S.; Gréboval, D. (eds.) Measuring capacity in fisheries. FAO Fisheries Technical Paper. No. 445. Rome, FAO. 2003. 314p. http://www.fao.org/3/Y4849E/y4849e00.htm http://www.fao.org/3/Y4849E/y4849e0e.htm#bm16
Townsend, R.E. 1990. Entry Restrictions in the Fishery: A Survey of the Evidence. Land Economics, 66(4): pp. 359-378.
Vincent, J.R., Rozali, A. & Jahara, Y. 1997. Marine Fisheries. Chapter 8 In J.R. Vincent and Rozali Ali, eds., Environment and Development in a Resource-Rich Economy: Malaysia under the New Economic Policy. Cambridge, MA: Harvard University Press for Harvard Institute for International Development.
Wilen, J. 1988. Limited Entry Licensing: A Retrospective Assessment. Marine Resource Economics, 5: pp. 313-324.
[110] Virginia Institute of Marine Sciences, College of William and Mary, Gloucester Point, Virginia 23062 United States. Email: [email protected]. The authors are grateful to Quentin Grafton, Kamaruzaman Haji Salim, and Niels Vestergaard for comments and suggestions and for discussions with participants at the FAO Technical Working Group on the Management of Fishing Capacity, La Jolla, United States 15-18 April, 1998. The authors remain responsible for any remaining errors.
[111] United States National Marine Fisheries Service Southwest Fisheries Science Center P.O. Box 271, La Jolla, California 92038-0271 United States. Email: [email protected]. The results are not necessarily those of the United States National Marine Fisheries Service.
[112] Department of Agricultural Finance, Bangladesh Agricultural University, Bangladesh.
[113] Department of Natural Resource Economics, Faculty of Economics and Management, Universiti Putra Malaysia 43400 Serdang, Selangor Malaysia, Email: [email protected]
[114] The spatial allocation of fishing capacity, with a more traditional inshore sector and a more capital-intensive large-scale sector, with links between them, raises parallel social and political issues to those discussed in agriculture. Platteau (1989a, 1989b), Kurien (1996) and Meyen (1989) provide further discussion of the social organization of the fishing sector in less developed countries. These types of issues, however, are beyond the scope of this paper
[115] This issue has also been observed elsewhere in the world: e.g. North Yemen (Panayoyouu, 1982), Brazil and Sierra Leone (Lawson, 1984), and Morocco.

Extracted from : Pascoe, S.; Gréboval, D. (eds.) Measuring capacity in fisheries. FAO Fisheries Technical Paper. No. 445. Rome, FAO. 2003. 314p. http://www.fao.org/3/Y4849E/y4849e00.htm http://www.fao.org/3/Y4849E/y4849e0e.htm#bm16 [116] Prawns are most common in waters of three to six fathoms, which occur mainly in the three-to- seven mile zone in Peninsular Malaysia (Vincent et al., 1997). Moreover, in over-fished tropical waters, often only the younger age classes remain, which are located in inshore waters. Inshore waters are also the most nutrient rich. Kurien (1996) observes two salient features of tropical marine living resources: (a) over 70 percent of these resources are concentrated in the coastal zone and (b) the broad species diversity widely dispersed in this zone, with comparatively short life spans and with varied sizes at maturity, available in small quantities, and with a great degree of inter-species interaction.
[117] Strictly speaking, some small-scale vessels have the size and engine power to harvest in the closer reaches of offshore waters. Nonetheless, ranges are limited for a variety of reasons: limited hold capacity, little or no ice, low engine power and small vessel size which give considerable vulnerability to the vicissitudes of weather and make for long transit times and vulnerability to break downs, and some traditional gear cannot operate in deep water.
[118] In many instances, artisanal and large-scale commercial fishers come from different ethnic groups, exacerbating the conflicts. In addition, larger vessels home port in larger urban areas rather than in the traditional fishing villages and hamlets strung along the coast. This poses another source of conflict, as almost all of the employment gains associated with large-scale fishing and from modernization of fishing fleets are concentrated in towns and cities and not in artisanal fishing communities (IPFC, 1994). Large-scale fishers concentrate on production for urban and export markets (especially prawns for export), while artisanal fishers tend to concentrate on own consumption and local markets, with only a limited export orientation.
[119] Customary use rights or even common property by small-scale indigenous Malay fisheries withstand outside encroachments only with great difficulty or not at all without vigorous support by the State.
[120] See Wilen (1988) for a discussion of area licensing programs and Townsend (1990) for a review of licence limitation programs in general.
[121] The science of population dynamics in the complex multispecies tropical waters is still in its rudimentary stage and in addition, scientific and data infrastructures tend to be underdeveloped.
[122] Biological overfishing has occurred in inshore waters of the west coast of Peninsular Malaysia, particularly for the Straits of Malacca (Jahara, 1988). Jahara, footnote 2, provides a number of sources. Jahara further observes that symptoms of overfishing include: a persistent decline in total catch; a noticeable decrease in catch per unit effort; an increased proportion of “trash fish” in the demersal
Extracted from : Pascoe, S.; Gréboval, D. (eds.) Measuring capacity in fisheries. FAO Fisheries Technical Paper. No. 445. Rome, FAO. 2003. 314p. http://www.fao.org/3/Y4849E/y4849e00.htm http://www.fao.org/3/Y4849E/y4849e0e.htm#bm16 landings - reducing the average size and age of species caught; the virtual disappearance of certain commercial species, such as Lactarius lactarius or ikan shrumbu; and declining trends in catch rates in inshore waters up to a depth of 50 meters in demersal resource surveys carried out by the Malaysian Fisheries Research Institute and in other cited surveys.
[123] Trash fish are primarily juveniles of commercially valuable species or species with little or no commercial value.
[124] Malay pukat - net, jerut - to tighten a slip-cord, tarik - pull, kilat - lightening (referring to the speed at which a power winch tightens the bottom rope of the net). In more detail, pukat jerut proper, sometimes known as pukat jerut malam, is used at might. Pukat jerut tuas (tuas - lure) refers to a day fishery using lures. Pukat jerut bilis is the purse seine gear for the capture of ikan bilis (anchovy).
[125] During bright phases of the moon, vessels frequently do not fish, since fish can see the shadow of the net and will avoid it (Bailey, 1983).
[126] This section draws heavily from Kirkley and Squires (1998), who provide an extensive literature review of fishing capacity. Suffice it to note that the vast bulk of the fisheries literature equates capacity with the capital stock and CU with capital utilization. However, these concepts are equivalent only when there is a single measure of the capital stock, all variable inputs are in fixed proportions to the capital stock, and there are constant returns to scale. See Berndt (1990) for further discussion. This linear relationship between capacity and capital stock corresponds to a constant q or catchability coefficient in the basic population dynamics model.
[127] The optimal capital stock, capacity, and resource stock decisions are ultimately long- run in nature, with optimal levels in some very long-run, steady-state equilibrium, and new short-run optimal positions corresponding to intermediate stages along some approach path to this optimum.
[128] This definition directly corresponds to the technological-economic definition of capacity and excess capacity. Nonetheless, it can be readily extended to allow for an economic or socio-economic optimum and the corresponding definitions of capacity and CU.
[129] Two types of technical efficiency can be measured. The output-oriented measure addresses how much output quantities can be proportionally expanded without altering the input quantities used. The input-oriented measure addresses how much input quantities can be proportionally reduced without changing the output quantities produced. This paper uses the output-oriented measure of technical efficiency since that is consistent with the notion of capacity as the maximum quantity that can be

Extracted from : Pascoe, S.; Gréboval, D. (eds.) Measuring capacity in fisheries. FAO Fisheries Technical Paper. No. 445. Rome, FAO. 2003. 314p. http://www.fao.org/3/Y4849E/y4849e00.htm http://www.fao.org/3/Y4849E/y4849e0e.htm#bm16 produced given full utilization of variable inputs and fixed inputs. Note that technical efficiency does not require full utilization of variable inputs.
[130] With the technological-economic approach to capacity and a single output for example, CU may equal one, seemingly indicating full capacity, but when in fact one fixed factor may be fully utilized, while another has considerable excess capacity. Alternatively, in the economic approach to capacity, capacity corresponds to the tangency point of the short- and long-run average cost curves. With multiple fixed factors, there are multiple average cost curves, depending on the proportions of the fixed factors, or an average cost curve in which the proportions of fixed factors may vary with output levels. Alternatively, its interpretation becomes unclear with multiple fixed factors, since it is possible for CU to equal one even if the actual prices of the fixed factors do not equal their shadow values (e.g. if there are offsetting effects). The implications of this for investment incentives are unclear.
[131] A consistent scalar measure of output in multiproduct firms exists if all outputs are homothetically separable from inputs, and a direct analogue of the single-product primal measure of capacity and CU can be developed for the multiproduct firm (Segerson and Squires, 1994). When the technology is not homothetically separable, Segerson and Squires (1994) suggest two alternative ways of defining a primal CU measure: (1) outputs move along a ray, giving a ray measure of capacity and CU and (2) only output adjusts, giving a partial measure of capacity and CU.
[132] The inputs differ from the inputs typically considered in economic analysis (e.g. labour, energy, capital services and materials). Despite the fact the inputs are not well defined, they are the inputs most commonly considered in the economic analysis of fisheries and are consistent with the variable inputs typically considered by resource managers. Other than labour and materials and occasionally capital, there does not appear to have been any efforts by resource managers to regulate fisheries by controlling or limiting the conventional economic inputs. There is, however, a long history of regulation days at sea and crew size.
[133] The absence of widespread and detailed formal record-keeping required data requests on a monthly rather than annual basis. [134] The questionnaire did not contain year built for the vessel hull, so the age of the vessel could not be determined. Instead, the closest information to capture vintage effects from vessel hull age is the respondent’s estimate of expected life of the hull. Presumably, vessels with a longer expected life are newer.
[135] Catch is linearly aggregated, i.e. simply summed, for this measure.
Extracted from : Pascoe, S.; Gréboval, D. (eds.) Measuring capacity in fisheries. FAO Fisheries Technical Paper. No. 445. Rome, FAO. 2003. 314p. http://www.fao.org/3/Y4849E/y4849e00.htm http://www.fao.org/3/Y4849E/y4849e0e.htm#bm16 [136] Since Zone 2 lies closest to the shore and hence ports, most of this time would be taken up by fishing rather than transit to and from fishing grounds.

Extracted from : Pascoe, S.; Gréboval, D. (eds.) Measuring capacity in fisheries. FAO Fisheries Technical Paper. No. 445. Rome, FAO. 2003. 314p. http://www.fao.org/3/Y4849E/y4849e00.htm http://www.fao.org/3/Y4849E/y4849e0e.htm#bm16