Embed Size (px)
Citation preview
8 Ca—A cancer Journal for Clinicians
IntroductionCancer is an important public health con-cern in the United States and around theworld. To provide an up-to-date perspec-tive on the occurrence of cancer, theAmerican Cancer Society presents anoverview of cancer frequency, incidence,mortality, and survival statistics for 1999.
MethodsESTIMATED NEW CANCER CASES
Because the United States does not havea nationwide cancer registry, exactly howmany new cases of cancer are diagnosedin the total United States and individualstates each year is not known. Conse-quently, we estimated the number of newcancer cases occurring annually in theUnited States from 1979 through 1995 us-ing population data reported by the USBureau of the Census and age-specificcancer incidence rates collected by the
National Cancer Institute’s Surveillance,Epidemiology, and End Results (SEER)program.1 We fitted these annual cancercase estimates to an autoregressive quadratic model to forecast the numberof cancer cases expected to be diagnosedin the total United States in 1999. Thismethod has been described in detail elsewhere.2
Between 1987 and 1992, the incidencerate of prostate cancer increased 85%,followed by a decline of 28% between1992 and 1995.3 The sharp increase in in-cidence followed by the decline in recentyears probably reflects extensive use ofprostate-specific antigen (PSA) screeningin a previously unscreened populationand the subsequent increase in diagnosesat an early stage.4 We assumed that thenumber of prostate cancer cases wouldapproach the pattern of rates in effect be-fore widespread use of PSA screening,and we estimated new cases of prostatecancer for 1999 using a linear projectionbased on data from 1979 to 1989.
Because cancer incidence rates andcase counts for 1979 through 1995 werenot available for many states, we couldnot use the methods mentioned earlier toestimate new cases for individual states.To derive these estimates, we assumedthat the ratio of cancer deaths to cancercases for each state was the same as theratio for the United States. This methodhas been described in detail elsewhere.2
ESTIMATED CANCER DEATHS
We estimated the number of cancerdeaths expected to occur in the United
Ms. Landis is an Epidemiologist with the SurveillanceResearch Program, Department of Epidemiology andSurveillance Research, American Cancer Society,Atlanta, GA.Mr. Murray is a Research Analyst in the SurveillanceResearch Program, Department of Epidemiology andSurveillance Research, American Cancer Society,Atlanta, GA.Ms. Bolden is a Program Specialist with the SurveillanceResearch Program, Department of Epidemiology andSurveillance Research, American Cancer Society,Atlanta, GA.Dr. Wingo is Director of the Surveillance ResearchProgram, Department of Epidemiology andSurveillance Research, American Cancer Society,Atlanta, GA.The authors thank Belinda Hill, Kourtney JohnstonDavis, Kate O’Brien, and Elyse Luke for their assis-tance in the preparation of this manuscript. This article is also available online at http://www.ca-journal.org.
Cancer Statistics, 1999
Sarah H. Landis, MPHTaylor MurraySherry BoldenPhyllis A. Wingo, PhD, MS
C A N C E R S T A T I S T I C S , 1 9 9 9
States in 1999 using underlying cause ofdeath data from death certificates as re-ported to the National Center for HealthStatistics.5 The numbers of cancer deathsoccurring annually from 1979 to 1995were fitted to an autoregressive quadraticmodel to forecast the number of cancerdeaths expected to occur in the totalUnited States in 1999. The estimatednumber of cancer deaths for each statewas calculated with the same modelingprocedure used for the total UnitedStates. These methods have been described in detail elsewhere.2
OTHER STATISTICS
Mortality statistics for the leading causesof death and the leading causes of cancerdeath and cancer mortality rates for 1930to 1995 were obtained from the NationalCenter for Health Statistics.5 Incidencerates, the probability of developing cancer, and 5-year relative survival rateswere obtained from SEER.3,6
Selected Findings EXPECTED NUMBERS OF NEW
CANCER CASES
In 1999, we estimate that about 1,221,800new cases of invasive cancer will be diag-nosed in the United States (Table 1). Thisestimate does not include carcinoma insitu of any site except the urinary bladder,and it does not include basal and squa-mous cell cancers of the skin. Approxi-mately 1 million cases of basal and squa-mous cell skin cancers, 39,900 cases ofbreast carcinoma in situ, and 23,200 casesof melanoma carcinoma in situ are ex-pected to be newly diagnosed in 1999.
Among men, the most common can-cers in 1999 are expected to be cancers ofthe prostate, lung and bronchus, andcolon and rectum (Fig. 1). Prostate is theleading site for cancer incidence, account-ing for 29% of new cancer cases in men.This year, 179,300 new cases of prostatecancer are expected to be diagnosed.
Among women, the three most com-
monly diagnosed cancers are expected tobe cancers of the breast, lung andbronchus, and colon and rectum (Fig. 1).Cancers occurring at these sites are ex-pected to account for more than 50% ofnew cancer cases in women. Breast can-cer alone is expected to account for175,000 new cancer cases (29%) in 1999.
TRENDS IN CANCER INCIDENCE
For all sites combined, cancer incidencerates declined an average of –0.7% peryear from 1990 to 1995, in contrast to in-creasing trends in earlier years.7 Similarrecent declines are seen among manyleading cancer sites (Figs. 3 and 4).
Breast cancer incidence rates havebeen approximately level during the1990s; however, they appear to be decreas-ing in younger women. Decreases in colonand rectum cancer incidence began in themid-1980s, and today these rates continueto decline significantly, on average –2.3%per year.7 A downturn in the incidence oflung and bronchus cancer in males beganin the late 1980s, and during 1990 to 1995,incidence rates decreased significantly,–2.3% per year. Rates of incidence of lungand bronchus cancer among females arestabilizing. During 1990 to 1995, prostatecancer incidence rates declined significant-ly, on average –1.0% per year.
EXPECTED NUMBERS OF
CANCER DEATHS
In 1999, an estimated 563,100 Americansare expected to die of cancer—more than1,500 people a day (Table 2). Althoughmost 1999 cancer deaths in men (54%)are expected to be from cancers of thelung and bronchus, prostate, and colonand rectum (Fig. 2), the number of deathsfrom these three sites appears to be level-ing off and may be beginning to decline.
Among women, cancers of the lungand bronchus, breast, and colon and rec-tum are expected to account for morethan half of all cancer deaths in 1999 (Fig. 2). In 1987, lung cancer surpassedbreast cancer as the leading cause of
C A C a n c e r J C l i n 1 9 9 9 ; 4 9 : 8 - 3 1
Vol. 49 No. 1 JANUARY/FEBRUARY 1999 9

cancer death in women and is expected to account for 25% of all cancer deaths infemales in 1999. Breast and colon andrectum cancers will account for 16% and 11% of cancer deaths in females, respectively.
TRENDS IN CANCER MORTALITY
After significant increases over the past70 years, cancer mortality rates for allcancers combined began to decline in the1990s (Figs. 5 and 6).7 Significant de-creases have been seen among males andfemales, persons younger than 65 yearsof age, and among whites, AfricanAmericans, and Hispanics.
Breast cancer mortality rates in fe-males decreased an average of –1.7% peryear during 1990 to 1995; decreases weremore pronounced among white womenand among younger women. During 1990to 1995, mortality from cancers of thecolon and rectum decreased significantly,on average –1.5% per year.7
Similar to what was seen with trendsin incidence, significant decreases in mor-tality from lung and bronchus cancerhave occurred only among males (on av-erage –1.6% per year during 1990 to1995); rates among females recently havebegun to slow and appear to be stabiliz-ing. Prostate cancer mortality decreasedan average of –1.1% per year during 1990to 1995.7
TRENDS IN CANCER BY RACE
AND ETHNICITY
Overall rates of cancer incidence varyconsiderably among racial and ethnicgroups (Table 10). African Americanshave the highest incidence rates of can-cer; they are 60% more likely to developcancer than are Hispanics and Asian/Pacific Islanders and more than two timesmore likely to develop cancer than areAmerican Indians. During 1990 to 1995,incidence rates decreased about –1.0%per year among whites and Hispanics, re-mained relatively stable among AfricanAmericans and Asian/Pacific Islanders,
and appear to be increasing slightlyamong American Indians.3
White women are more likely to de-velop breast cancer than are women ofother racial and ethnic groups, andAfrican-American women are more like-ly to develop cancers of the colon andrectum.3 African-American men have thehighest incidence rates of colon and rec-tum, lung and bronchus, and prostatecancers; they are at least 50% more likelyto develop prostate cancer than are menof other racial and ethnic groups.
African Americans are about 34%more likely to die of cancer than arewhites and more than two times morelikely to die of cancer than are Asian/Pacific Islanders, American Indians, andHispanics. During 1990 to 1995, mortalityrates decreased significantly amongAfrican Americans (–0.8% per year),Hispanics (–0.6% per year), and whites(–0.4% per year); remained stable amongAsian/Pacific Islanders; and appear tobe increasing slightly among AmericanIndians.3
African-American women are morelikely to die of breast and colon and rec-tum cancers than are women of any otherracial and ethnic group, and they have ap-proximately the same lung and bronchuscancer mortality rate as white women.Similar to the pattern seen with incidencerates, African-American men have thehighest mortality rates of colon and rec-tum, lung and bronchus, and prostatecancer.3
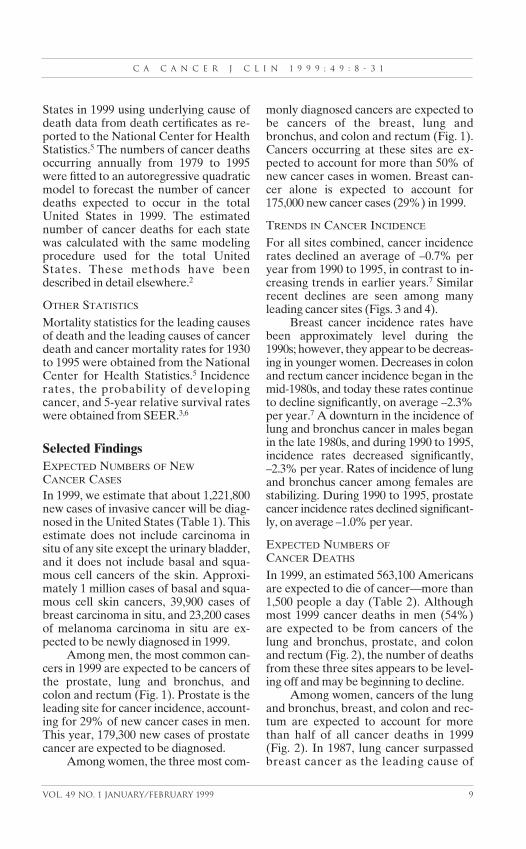
CANCER IN CHILDREN
Cancer is the second leading cause ofdeath among children aged 1 to 14 yearsin the United States. Accidents are themost frequent cause of death (Table 12).The most common cancers found in chil-dren are leukemias (in particular, acutelymphocytic leukemia), brain and othernervous system cancers, non-Hodgkin’slymphoma, and soft tissue cancers.3 Overthe past 20 years, significant improve-ments have occurred in the 5-year rela-
C A N C E R S T A T I S T I C S , 1 9 9 9
10 Ca—A cancer Journal for Clinicians

C A C a n c e r J C l i n 1 9 9 9 ; 4 9 : 8 - 3 1
Vol. 49 No. 1 JANUARY/FEBRUARY 1999 11
tive survival rate for many childhood cancers. Between 1974–1976 and 1989–1994, survival rates improved by atleast 20% for acute lymphocytic andmyeloid leukemias, neuroblastoma,non-Hodgkin’s lymphoma, soft tissuecancer, and Wilms’ tumor (Table 13).
Limitations and Future Challenges
Our estimated numbers of new cancercases and cancer deaths should be inter-preted with caution when used to studytrends in cancer incidence and mortality.These estimates may vary considerablyfrom year to year, particularly for rarecancers and for states with smaller popu-lations. We therefore discourage the useof these estimates to track year-to-yearchanges in cancer occurrence and death.
National Center for Health Statisticsmortality rates and SEER cancer inci-dence rates are generally more informa-tive statistics to use for tracking cancertrends. For example, breast cancer inci-dence rates increased about 1% per yearbetween 1979 and 1982, increased 4% per
year between 1982 and 1987, and wereapproximately constant between 1987and 1995. Despite the stabilization of rates during the latter period, the estimates of new breast cancer cases increased between 1988 and 1996.
Our estimates are based on themost currently available cancer inci-dence and mortality data; however,these data are 4 years old at the time thatthe estimates are calculated. As such,the effects of large changes occurring inthe 4-year interval between 1995 and1999 cannot be captured by our model-ing efforts. Finally, our estimates of newcancer cases are based on incidencerates for the geographic locations thatparticipate in the SEER program and,therefore, may not be representative ofthe total United States.
Despite these limitations, our esti-mates do provide an indication of currentpatterns of cancer in the United States.Such estimates will assist our continuingefforts to reduce the burden of cancer in the United States as the 21st centuryapproaches.
C
1. National Cancer Institute: SEER CancerIncidence Public-Use Database CD-ROM, 1973-1995. Bethesda, MD, US Department of Health andHuman Services, Public Health Service, 1998.2. Wingo PA, Landis S, Parker S, et al: Using can-cer registry and vital statistics data to estimate thenumber of new cancer cases and deaths in theUnited States for the upcoming year. J RegManagement 1998;25:43-51.3. Ries LAG, Kosary CL, Hankey BF, et al: SEERCancer Statistics Review, 1973-1995: Bethesda,MD, National Cancer Institute, 1998. http://www-seer.ims.nci.nih.gov/Publications/CSR7395
4. Wingo PA, Landis S, Ries LA: An adjustment tothe 1997 estimate for new prostate cancer cases. CACancer J Clin 1997;47:239-242.5. National Center for Health Statistics: Public usedata file documentation: Mortality detail for ICD-9,1995. Hyattsville, MD, Public Health Service, 1997. 6. Feuer EJ, Wun LM: DEVCAN: Probability ofdeveloping or dying of cancer [computer program],version 4. Bethesda, MD, National CancerInstitute, 1998.7. Wingo PA, Ries LA, Rosenberg HM, et al:Cancer incidence and mortality, 1973-1995: Areport card for the US. Cancer 1998;82:1197-1207.
References

C A N C E R S T A T I S T I C S , 1 9 9 9
12 Ca—A cancer Journal for Clinicians
Total Male FemaleAll Sites 1,221,800 623,800 598,000Oral cavity & pharynx 29,800 20,000 9,800Tongue 6,600 4,300 2,300Mouth 10,800 6,400 4,400Pharynx 8,300 6,100 2,200Other oral cavity 4,100 3,200 900Digestive system 226,300 117,200 109,100Esophagus 12,500 9,400 3,100Stomach 21,900 13,700 8,200Small intestine 4,800 2,500 2,300Colon 94,700 43,000 51,700Rectum 34,700 19,400 15,300Anus, anal canal, & anorectum 3,300 1,400 1,900Liver & intrahepatic bile duct 14,500 9,600 4,900Gallbladder & other biliary 7,200 3,000 4,200Pancreas 28,600 14,000 14,600Other digestive organs 4,100 1,200 2,900Respiratory system 187,600 106,800 80,800Larynx 10,600 8,600 2,000Lung & bronchus 171,600 94,000 77,600Other respiratory organs 5,400 4,200 1,200Bones & joints 2,600 1,400 1,200Soft tissue (including heart) 7,800 4,200 3,600Skin (excluding basal & squamous) 54,000 33,400 20,600Melanoma of skin 44,200 25,800 18,400Other non-epithelial skin 9,800 7,600 2,200Breast 176,300 1,300 175,000Genital system 269,100 188,100 81,000Uterine cervix 12,800 12,800Uterine corpus 37,400 37,400Ovary 25,200 25,200Vulva 3,300 3,300Vagina & other genital organs, female 2,300 2,300Prostate 179,300 179,300Testis 7,400 7,400Penis & other genital organs, male 1,400 1,400Urinary system 86,500 58,400 28,100Urinary bladder 54,200 39,100 15,100Kidney & renal pelvis 30,000 17,800 12,200Ureter & other urinary organs 2,300 1,500 800Eye & orbit 2,200 1,200 1,000Brain & other nervous system 16,800 9,500 7,300Endocrine system 19,800 5,400 14,400Thyroid 18,100 4,600 13,500Other endocrine 1,700 800 900Lymphoma 64,000 36,400 27,600Hodgkin’s disease 7,200 3,800 3,400Non-Hodgkin’s lymphoma 56,800 32,600 24,200Multiple myeloma 13,700 7,300 6,400Leukemia 30,200 16,800 13,400Acute lymphocytic leukemia 3,100 1,800 1,300Chronic lymphocytic leukemia 7,800 4,500 3,300Acute myeloid leukemia 10,100 4,900 5,200Chronic myeloid leukemia 4,500 2,700 1,800Other leukemia 4,700 2,900 1,800Other & unspecified primary sites 35,100 16,400 18,700
*Excludes basal and squamous cell skin cancers and in situ carcinomas except urinary bladder.
Table 1Estimated New Cancer Cases by Sex, United States, 1999*

C A C a n c e r J C l i n 1 9 9 9 ; 4 9 : 8 - 3 1
Vol. 49 No. 1 JANUARY/FEBRUARY 1999 13
Total Male FemaleAll Sites 563,100 291,100 272,000Oral cavity & pharynx 8,100 5,400 2,700Tongue 1,800 1,200 600Mouth 2,300 1,300 1,000Pharynx 2,100 1,500 600Other oral cavity 1,900 1,400 500Digestive system 131,000 69,900 61,100Esophagus 12,200 9,400 2,800Stomach 13,500 7,900 5,600Small intestine 1,200 600 600Colon 47,900 23,000 24,900Rectum 8,700 4,800 3,900Anus, anal canal, & anorectum 500 200 300Liver & intrahepatic bile duct 13,600 8,400 5,200Gallbladder & other biliary 3,600 1,300 2,300Pancreas 28,600 13,900 14,700Other digestive organs 1,200 400 800Respiratory system 164,200 94,900 69,300Larynx 4,200 3,300 900Lung & bronchus 158,900 90,900 68,000Other respiratory organs 1,100 700 400Bones & joints 1,400 800 600Soft tissue (including heart) 4,400 2,100 2,300Skin (excluding basal & squamous) 9,200 5,800 3,400Melanoma of skin 7,300 4,600 2,700Other non-epithelial skin 1,900 1,200 700Breast 43,700 400 43,300Genital system 64,700 37,500 27,200Uterine cervix 4,800 4,800Uterine corpus 6,400 6,400Ovary 14,500 14,500Vulva 900 900Vagina & other genital organs, female 600 600Prostate 37,000 37,000Testis 300 300Penis & other genital organs, male 200 200Urinary system 24,500 15,600 8,900Urinary bladder 12,100 8,100 4,000Kidney & renal pelvis 11,900 7,200 4,700Ureter & other urinary organs 500 300 200Eye & orbit 200 100 100Brain & other nervous system 13,100 7,200 5,900Endocrine system 2,000 900 1,100Thyroid 1,200 500 700Other endocrine 800 400 400Lymphoma 27,000 14,100 12,900Hodgkin’s disease 1,300 700 600Non-Hodgkin’s lymphoma 25,700 13,400 12,300Multiple myeloma 11,400 5,800 5,600Leukemia 22,100 12,400 9,700Acute lymphocytic leukemia 1,400 800 600Chronic lymphocytic leukemia 5,100 3,000 2,100Acute myeloid leukemia 6,900 3,700 3,200Chronic myeloid leukemia 2,300 1,300 1,000Other leukemia 6,400 3,600 2,800Other & unspecified primary sites 36,100 18,200 17,900
*Excludes basal and squamous cell skin cancers and in situ carcinomas except urinary bladder.
Table 2Estimated Cancer Deaths by Sex, United States, 1999*

C A N C E R S T A T I S T I C S , 1 9 9 9
14 Ca—A cancer Journal for Clinicians
All Female Colon & Lung & Melanoma Non-Hodgkin’s Urinary Uterine UterineState Sites Breast Rectum Bronchus of Skin Lymphoma Ovary Prostate Bladder Cervix Corpus
Alabama 21,100 2,500 1,600 2,900 700 900 400 3,100 800 200 500Alaska 1,400 200 200 200 — — — 200 — — —Arizona 20,000 2,600 2,000 2,800 1,000 900 500 3,300 800 200 600Arkansas 13,800 1,700 1,400 2,300 400 600 300 2,400 500 200 400California 112,300 16,900 11,200 14,600 4,800 5,000 2,600 16,300 5,200 1,300 3,500Colorado 13,300 2,000 1,300 1,600 600 700 200 2,000 600 200 500Connecticut 15,100 2,100 1,500 2,000 600 800 300 2,200 800 100 400Delaware 3,800 500 400 600 100 200 100 500 300 100 100Dist. of Col. 3,000 500 300 400 — 100 100 600 100 — 200Florida 88,000 11,900 8,900 13,000 3,000 4,000 1,800 13,600 4,300 800 2,500Georgia 29,100 4,000 2,700 4,400 1,000 1,000 600 4,300 900 300 1,000Hawaii 4,300 500 400 600 100 200 100 700 100 — 100Idaho 4,600 700 400 600 200 200 100 900 300 — —Illinois 56,800 8,500 6,200 7,800 1,900 2,700 1,100 7,700 2,500 600 1,700Indiana 27,900 3,900 3,000 4,300 1,100 1,300 600 3,700 1,200 300 700Iowa 14,300 2,100 1,700 2,000 500 800 300 2,100 700 100 600Kansas 12,000 1,700 1,200 1,600 600 600 300 1,900 500 100 400Kentucky 20,500 2,700 2,200 3,500 800 800 400 2,600 700 300 600Louisiana 20,300 3,100 2,200 3,000 700 800 300 3,000 700 200 400Maine 7,000 1,000 700 1,100 200 300 100 1,000 300 100 100Maryland 22,600 3,500 2,600 3,200 700 900 400 3,200 1,000 300 600Massachusetts 30,700 4,400 3,600 4,100 1,200 1,500 500 4,000 1,700 200 800Michigan 44,200 6,500 4,800 6,400 1,300 2,100 800 6,400 2,100 500 1,600Minnesota 19,400 2,800 2,000 2,400 600 1,200 400 3,200 800 100 500Mississippi 13,000 1,700 1,300 1,800 300 500 200 2,300 400 200 100Missouri 27,900 3,600 3,000 4,400 1,000 1,200 600 3,900 1,100 300 1,000Montana 4,100 600 400 600 100 200 100 600 200 — 100Nebraska 7,400 1,000 1,000 1,000 200 300 100 1,100 300 100 200Nevada 8,100 1,000 800 1,200 400 300 100 1,100 300 100 100New Hampshire 5,400 700 600 800 200 300 100 700 200 100 200New Jersey 40,000 5,900 4,700 4,900 1,500 2,000 900 5,600 2,100 400 1,500New Mexico 6,500 1,000 600 800 300 300 100 1,000 200 100 200New York 83,100 13,000 9,400 10,700 2,400 4,100 1,800 11,500 4,200 900 3,500North Carolina 35,500 4,700 3,900 5,300 1,200 1,400 700 5,400 1,400 300 1,100North Dakota 3,100 400 400 400 100 200 100 600 200 — 100Ohio 56,500 8,400 6,100 8,300 1,600 2,800 1,000 7,900 2,700 600 2,100Oklahoma 15,800 2,300 1,600 2,500 600 800 300 2,000 700 200 200Oregon 15,900 2,100 1,500 2,200 700 800 400 2,400 700 100 500Pennsylvania 66,600 10,000 7,700 9,000 2,300 3,200 1,400 9,900 3,100 600 2,000Rhode Island 5,200 700 600 800 200 300 100 600 300 100 200South Carolina 17,900 2,600 1,900 2,500 700 600 400 2,900 800 200 500South Dakota 3,400 500 300 400 200 200 100 700 200 — 100Tennessee 26,800 3,900 2,800 4,300 1,200 1,200 600 3,400 1,000 400 700Texas 77,400 11,300 8,400 11,500 2,900 3,900 1,500 11,600 2,800 1,100 2,500Utah 5,200 800 600 400 400 400 100 1,100 200 100 200Vermont 2,600 300 300 400 200 100 100 300 100 100 100Virginia 29,000 4,200 3,000 4,100 1,100 1,200 500 4,300 1,100 300 1,100Washington 23,800 3,300 2,300 3,400 800 1,100 600 3,200 1,200 200 500West Virginia 10,600 1,200 1,100 1,700 400 400 200 1,500 500 100 300Wisconsin 23,700 3,400 2,500 2,800 900 1,300 600 4,100 1,200 200 900Wyoming 2,000 300 200 300 100 100 — 300 100 — 100United States† 1,221,800 175,000 129,400 171,600 44,200 56,800 25,200 179,300 54,200 12,800 37,400
*Excludes basal and squamous cell skin cancers and in situ carcinomas except urinary bladder.†State estimates may not add up to United States total because of rounding.— Estimate is 50 or fewer cases. State case estimates between 51 and 99 were rounded to 100.
Table 3Estimated New Cancer Cases by Site and State, US, 1999*

Estimated Number of DeathsReported Non-
Death Rate All Female Colon & Lung & Hodgkin’sState per 100,000† Sites Breast Rectum Esophagus Leukemia Bronchus Lymphoma Ovary Pancreas Prostate Stomach
Alabama 180 9,700 600 700 200 400 2,700 400 200 500 600 200Alaska 167 600 100 100 — — 200 — — — — — Arizona 158 9,200 700 900 200 400 2,600 400 300 500 700 200 Arkansas 181 6,400 400 600 100 300 2,200 200 200 300 500 100 California 159 51,700 4,200 4,900 1,100 2,100 13,500 2,300 1,500 2,700 3,400 1,600Colorado 145 6,200 500 600 100 300 1,500 300 100 300 400 100 Connecticut 164 7,000 500 700 200 300 1,800 300 200 400 400 200 Delaware 195 1,800 100 200 100 100 600 100 — 100 100 — Dist. of Col. 216 1,400 100 100 — — 300 — — 100 100 100 Florida 167 40,600 2,900 3,900 900 1,500 12,100 1,800 1,000 2,200 2,800 900 Georgia 177 13,400 1,000 1,200 200 600 4,100 500 400 700 900 300 Hawaii 134 2,000 100 200 — 100 500 100 — 100 100 100 Idaho 148 2,100 200 200 100 100 500 100 100 100 200 100 Illinois 179 26,200 2,100 2,700 700 1,100 7,300 1,200 600 1,200 1,600 600 Indiana 178 12,900 1,000 1,300 300 500 4,000 600 400 700 800 200 Iowa 160 6,600 500 800 100 300 1,800 300 100 300 400 100 Kansas 160 5,600 400 500 100 200 1,500 300 200 300 400 100 Kentucky 192 9,500 700 900 200 300 3,300 400 200 400 500 200 Louisiana 194 9,400 800 1,000 100 400 2,700 400 200 500 600 300 Maine 187 3,200 200 300 100 100 1,000 200 100 200 200 100 Maryland 186 10,400 900 1,100 200 300 3,000 400 200 500 700 300 Massachusetts 179 14,200 1,100 1,600 300 500 3,800 700 300 700 800 300 Michigan 176 20,400 1,600 2,100 500 700 5,900 900 500 1,000 1,300 400 Minnesota 156 9,000 700 900 200 500 2,200 500 200 500 700 200 Mississippi 182 6,000 400 600 100 200 1,700 200 100 300 500 100 Missouri 177 12,900 900 1,300 300 500 4,000 500 300 600 800 300 Montana 161 1,900 200 200 — 100 500 100 100 100 100 — Nebraska 155 3,400 300 400 100 200 900 100 100 200 200 100 Nevada 183 3,800 300 300 100 100 1,100 200 100 200 200 100 New Hampshire 182 2,500 200 300 100 100 700 100 100 100 100 — New Jersey 181 18,400 1,500 2,000 400 800 4,500 900 500 1,100 1,200 500 New Mexico 146 3,000 200 300 100 100 700 100 100 200 200 100 New York 171 38,300 3,200 4,100 900 1,400 9,900 1,800 1,000 2,200 2,400 1,300 North Carolina 174 16,300 1,200 1,700 300 600 4,900 700 400 800 1,100 400 North Dakota 156 1,400 100 200 — — 300 100 100 100 100 — Ohio 181 26,000 2,100 2,700 600 1,000 7,700 1,300 600 1,300 1,600 500 Oklahoma 170 7,300 600 700 100 300 2,300 400 200 300 400 100 Oregon 167 7,300 500 700 200 300 2,100 400 200 400 500 100 Pennsylvania 177 30,700 2,500 3,400 700 1,200 8,400 1,500 800 1,500 2,000 700 Rhode Island 177 2,400 200 300 — 100 700 100 — 100 100 100 South Carolina 178 8,200 600 900 200 300 2,300 300 200 400 600 200 South Dakota 156 1,600 100 100 — 100 400 100 — 100 100 — Tennessee 181 12,300 1,000 1,200 200 500 3,900 500 300 500 700 200 Texas 169 35,700 2,800 3,700 700 1,400 10,600 1,700 900 1,900 2,400 1,000 Utah 126 2,400 200 300 — 100 400 200 100 100 200 — Vermont 172 1,200 100 100 — — 300 100 — — 100 — Virginia 178 13,300 1,000 1,300 300 500 3,800 600 300 600 900 300 Washington 163 11,000 800 1,000 300 500 3,100 500 300 500 700 200 West Virginia 186 4,900 300 500 100 200 1,600 200 100 200 300 100 Wisconsin 164 10,900 800 1,100 300 500 2,600 600 300 600 800 200 Wyoming 154 900 100 100 — — 300 — — 100 100 — United States‡ 171 563,100 43,300 56,600 12,200 22,100 158,900 25,700 14,500 28,600 37,000 13,500
*Excludes basal and squamous cell skin cancers and in situ carcinomas except urinary bladder.†NCHS average annual mortality rate for 1991–1995, age-adjusted to the 1970 US standard population.‡ State estimates may not add up to United States total because of rounding.— Estimate is 50 or fewer deaths. State death estimates between 51 and 99 were rounded to 100.
C A C a n c e r J C l i n 1 9 9 9 ; 4 9 : 8 - 3 1
Vol. 49 No. 1 JANUARY/FEBRUARY 1999 15
Table 4Estimated Cancer Mortality by Site and State, US, 1999*

C A N C E R S T A T I S T I C S , 1 9 9 9
16 Ca—A cancer Journal for Clinicians
29%
15%
10%
6%
5%
4%
3%
3%
3%
2%
20%
Prostate
Lung & Bronchus
Colon & Rectum
Urinary Bladder
Non-Hodgkin's Lymphoma
Melanoma of Skin
Oral Cavity & Pharynx
Kidney & Renal Pelvis
Leukemia
Pancreas
All Other Sites
29%
13%
11%
6%
4%
4%
3%
3%
2%
2%
23%
Breast
Lung & Bronchus
Colon & Rectum
Uterine Corpus
Ovary
Non-Hodgkin's Lymphoma
Melanoma of Skin
Urinary Bladder
Pancreas
Thyroid
All Other Sites
*Excludes basal and squamous cell skin cancers and in situ carcinomas except urinary bladder.
Figure 1Estimated New Cancer Cases*
10 Leading Sites by Sex, United States, 1999
Figure 2Estimated Cancer Deaths*
10 Leading Sites by Sex, United States, 1999
25%
16%
11%
5%
5%
5%
4%
2%
2%
2%
2%
21%
Lung & Bronchus
Breast
Colon & Rectum
Pancreas
Ovary
Non-Hodgkin's Lymphoma
Leukemia
Uterine Corpus
Brain & Other Nervous System
Stomach†
Multiple Myeloma†
All Other Sites
31%
13%
10%
5%
5%
4%
3%
3%
3%
3%
20%
Lung & Bronchus
Prostate
Colon & Rectum
Pancreas
Non-Hodgkin's Lymphoma
Leukemia
Esophagus
Liver & Intrahepatic Bile Duct
Urinary Bladder
Stomach
All Other Sites
*Excludes basal and squamous cell skin cancers and in situ carcinomas except urinary bladder.†These two cancers both received a ranking of 10; they have the same number of deaths and contribute the same percentage.

C A C a n c e r J C l i n 1 9 9 9 ; 4 9 : 8 - 3 1
Vol. 49 No. 1 JANUARY/FEBRUARY 1999 17
Birt
h to
39
Year
s40
to 5
9 Ye
ars
60 to
79
Year
sBi
rth
to D
eath
All s
ites*
Mal
e1.
65 (1
in 6
1)8.
25 (1
in 1
2)34
.94
(1 in
3)
44.6
6 (1
in 2
)
Fem
ale
1.95
(1 in
51)
9.14
(1 in
11)
22.3
3 (1
in 5
)38
.03
(1 in
3)
Brea
stFe
mal
e0.
43 (1
in 2
31)
4.00
(1 in
25)
6.88
(1 in
15)
12.5
0 (1
in 8
)
Colo
n &
Rect
umM
ale
0.06
(1 in
1,7
08)
0.87
(1 in
115
)4.
05 (1
in 2
5)5.
69 (1
in 1
8)
Fem
ale
0.05
(1 in
1,8
71)
0.67
(1 in
150
)3.
14 (1
in 3
2)5.
62 (1
in 1
8)
Lung
& B
ronc
hus
Mal
e0.
04 (1
in 2
,495
)1.
34 (1
in 7
5)6.
55 (1
in 1
5)8.
27 (1
in 1
2)
Fem
ale
0.03
(1 in
2,9
36)
0.97
(1 in
103
)3.
95 (1
in 2
5)5.
64 (1
in 1
8)
Pros
tate
Mal
eLe
ss th
an 1
in 1
0,00
01.
83 (1
in 5
5)14
.79
(1 in
7)
17.0
0 (1
in 6
)
* Ex
clud
es b
asal
and
squ
amou
s ce
ll sk
in c
ance
rs a
nd in
situ
car
cino
mas
exc
ept u
rinar
y bl
adde
r.Da
ta s
ourc
e: N
CI S
urve
illan
ce, E
pide
mio
logy
, and
End
Res
ults
Pro
gram
, 199
8.
Tab
le 5
Per
centa
ge
of
Pop
ula
tion D
evel
op
ing I
nva
sive
Can
cers
at C
erta
in A
ges
by
Sex
, U
nit
ed S
tate
s, 1
99
3–1
99
5

C A N C E R S T A T I S T I C S , 1 9 9 9
18 Ca—A cancer Journal for Clinicians
200
180
160
140
120
100
80
60
40
20
01973 1975 1977 1979 1981 1983 1985 1987 1989 1991 1993 1995
Year
Rate
per
100
,000
Fem
ale
Popu
latio
n
Figure 3Age-Adjusted Cancer Incidence Rates*
for Females by Site, United States, 1973–1995
*Rates are per 100,000 population and are age-adjusted to the 1970 US standard population. Data source: NCI Surveillance, Epidemiology, and End Results Program, 1998.
Breast
Ovary
Colon & Rectum
Lung & Bronchus
Uterine Corpus
Non-Hodgkin's Lymphoma

C A C a n c e r J C l i n 1 9 9 9 ; 4 9 : 8 - 3 1
Vol. 49 No. 1 JANUARY/FEBRUARY 1999 19
Year
Rate
per
100
,000
Mal
e Po
pula
tion
Figure 4Age-Adjusted Cancer Incidence Rates*
for Males by Site, United States, 1973–1995
*Rates are per 100,000 population and are age-adjusted to the 1970 US standard population. Data source: NCI Surveillance, Epidemiology, and End Results Program, 1998.
200
180
160
140
120
100
80
60
40
20
01973 1975 1977 1979 1981 1983 1985 1987 1989 1991 1993 1995
Colon & Rectum
Prostate
Lung & Bronchus
Urinary Bladder
Melanoma of Skin
Non-Hodgkin'sLymphoma
C A N C E R S T A T I S T I C S , 1 9 9 9
20 Ca—A cancer Journal for Clinicians
All Ages Ages 1–19 Ages 20–39Male Female Male Female Male Female
All Causes All Causes All Causes All Causes All Causes All Causes1,172,959 1,139,173 19,896 10,182 88,874 34,513
1 Heart Heart Accidents Accidents Accidents AccidentsDiseases Diseases 8,282 4,165 21,688 6,467362,714 374,849
2 Cancer Cancer Homicide Homicide HIV Infection Cancer281,611 256,844 3,403 903 18,589 6,452
3 Cerebro- Cerebro- Suicide Cancer Suicide HIV Infectionvasular vasular 1,876 900 10,397 4,075Diseases Diseases61,563 96,428
4 Accidents Chronic Cancer Congenital Homicide Heart61,401 Obstructive 1,305 Anomalies 10,003 Diseases
Pulmonary 648 2,789Disease48,961
5 Chronic Pneumonia Congenital Heart Heart HomicideObstructive & Influenza Anomalies Diseases Diseases 2,464Pulmonary 45,136 747 390 6,215Disease53,938
6 Pneumonia Diabetes Heart Suicide Cancer Suicide& Influenza Mellitus Diseases 351 5,683 2,12137,787 33,130 554
7 HIV Infection Accidents Cerebral HIV Infection Cirrhosis Cerebro-35,950 31,919 Palsy 223 of Liver vascular
246 1,360 Diseases928
8 Diabetes Alzheimer’s HIV Infection Cerebral Cerebro- Diabetes Mellitus Disease 232 Palsy vascular Mellitus26,124 13,607 205 Diseases 628
1,008
9 Suicide Nephritis Chronic Pneumonia Pneumonia Cirrhosis 25,369 12,287 Obstructive & Influenza & Influenza of Liver
Pulmonary 186 859 610Disease187
10 Homicide Septicemia Pneumonia Chronic Diabetes Pneumonia 17,740 11,974 & Influenza Obstructive Mellitus & Influenza
181 Pulmonary 829 551Disease125
Data source: Vital Statistics of the United States, 1998.
Table 6Reported Deaths for the 10 Leading Causes of Death
by Age and Sex, United States, 1995

C A C a n c e r J C l i n 1 9 9 9 ; 4 9 : 8 - 3 1
Vol. 49 No. 1 JANUARY/FEBRUARY 1999 21
Ages 40–59 Ages 60–79 Ages 80+Male Female Male Female Male Female
All Causes All Causes All Causes All Causes All Causes All Causes187,562 107,862 521,815 413,462 337,859 560,061
1 Heart Cancer Heart Cancer Heart HeartDiseases 44,963 Diseases 133,588 Diseases Diseases51,087 176,730 127,733 230,869
2 Cancer Heart Cancer Heart Cancer Cancer46,081 Diseases 164,794 Diseases 63,705 70,896
19,152 121,293
3 HIV Infection Accidents Chronic Cerebro- Cerebro- Cerebro-15,765 5,057 Obstructive vasular vasular vascular
Pulmonary Diseases Diseases DiseasesDisease 27,952 27,574 62,38531,058
4 Accidents Cerebro- Cerebro- Chronic Pneumonia Pneumonia14,238 vascular vascular Obstructive & Influenza & Influenza
Diseases Diseases Pulmonary 20,497 32,3404,993 26,648 Disease
26,107
5 Cirrhosis Diabetes Diabetes Diabetes Chronic Chronic of Liver Mellitus Mellitus Mellitus Obstructive Obstructive 7,398 3,727 14,180 16,310 Pulmonary Pulmonary
Disease Disease18,913 18,949
6 Suicide Chronic Pneumonia Pneumonia Accidents Diabetes 7,025 Obstructive & Influenza & Influenza 6,551 Mellitus
Pulmonary 13,367 10,237 12,437Disease3,377
7 Cerebro- Cirrhosis Accidents Accidents Diabetes Alzheimer’s vascular of Liver 10,120 7,012 Mellitus DiseaseDiseases 2,712 6,358 10,5246,092
8 Diabetes HIV Infection Diseases Diseases Nephritis AccidentsMellitus 2,554 of Arteries of Arteries 5,012 8,8494,714 8,462 4,929
9 Chronic Suicide Cirrhosis Nephritis Diseases AtherosclerosisObstructive 2,077 of Liver 4,453 of Arteries 8,249Pulmonary 6,730 4,597Disease3,337
10 Homicide Pneumonia Nephritis Cirrhosis Alzheimer’s Nephritis3,228 & Influenza 4,992 of Liver Disease 6,833
1,608 4,180 4,488
Data source: Vital Statistics of the United States, 1998.
Table 6 (Continued)Reported Deaths for the 10 Leading Causes of Death
by Age and Sex, United States, 1995
C A N C E R S T A T I S T I C S , 1 9 9 9
22 Ca—A cancer Journal for Clinicians
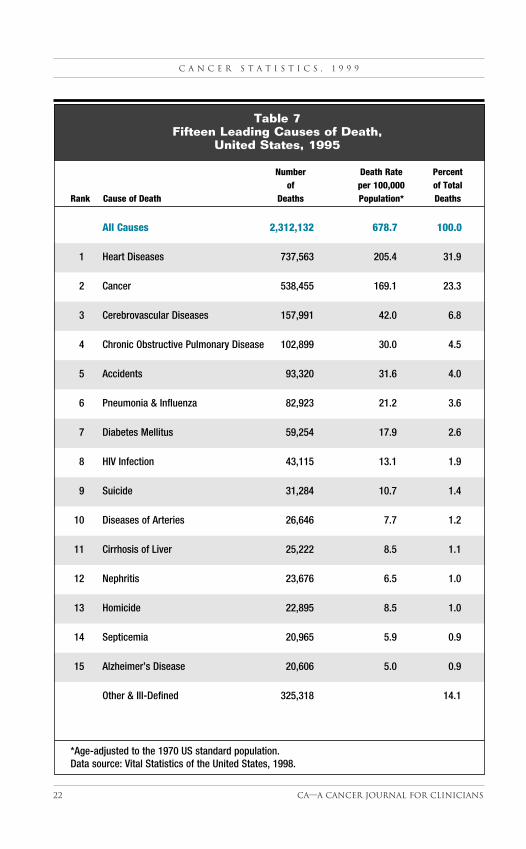
Number Death Rate Percentof per 100,000 of Total
Rank Cause of Death Deaths Population* Deaths
All Causes 2,312,132 678.7 100.0
1 Heart Diseases 737,563 205.4 31.9
2 Cancer 538,455 169.1 23.3
3 Cerebrovascular Diseases 157,991 42.0 6.8
4 Chronic Obstructive Pulmonary Disease 102,899 30.0 4.5
5 Accidents 93,320 31.6 4.0
6 Pneumonia & Influenza 82,923 21.2 3.6
7 Diabetes Mellitus 59,254 17.9 2.6
8 HIV Infection 43,115 13.1 1.9
9 Suicide 31,284 10.7 1.4
10 Diseases of Arteries 26,646 7.7 1.2
11 Cirrhosis of Liver 25,222 8.5 1.1
12 Nephritis 23,676 6.5 1.0
13 Homicide 22,895 8.5 1.0
14 Septicemia 20,965 5.9 0.9
15 Alzheimer’s Disease 20,606 5.0 0.9
Other & Ill-Defined 325,318 14.1
*Age-adjusted to the 1970 US standard population.Data source: Vital Statistics of the United States, 1998.
Table 7Fifteen Leading Causes of Death,
United States, 1995

C A C a n c e r J C l i n 1 9 9 9 ; 4 9 : 8 - 3 1
Vol. 49 No. 1 JANUARY/FEBRUARY 1999 23
All Ages Under 19 20–39 40–59 60–79 80+
All Sites All Sites All Sites All Sites All Sites All Sites281,611 1,341 5,683 46,081 164,794 63,705
Lung & Leukemia Non-Hodgkin’s Lung & Lung & ProstateBronchus 465 Lymphoma Bronchus Bronchus 15,65791,800 800 15,606 60,721
Prostate Brain Leukemia Colon & Prostate Lung &34,475 & ONS 686 Rectum 17,773 Bronchus
300 4,275 14,892
Colon & Bones & Brain Non-Hodgkin’s Colon & Colon & Rectum Joints & ONS Lymphoma Rectum Rectum28,409 104 643 2,370 16,306 7,416
Pancreas Endocrine Lung & Pancreas Pancreas Urinary12,826 System Bronchus 2,347 7,715 Bladder
102 563 2,752
Non-Hodgkin’s Non-Hodgkin’s Colon & Brain Non-Hodgkin’s LeukemiaLymphoma Lymphoma Rectum & ONS Lymphoma 2,72511,597 102 399 1,949 6,012
Note: All sites excludes basal and squamous cell skin cancers and in situ carcinomas except urinary bladder.ONS = other nervous system.Data source: Vital Statistics of the United States, 1998.
Table 8Reported Deaths for the Five Leading Cancer Sites
for Males by Age, United States, 1995
All Ages Under 19 20–39 40–59 60–79 80+
All Sites All Sites All Sites All Sites All Sites All Sites256,844 934 6,452 44,963 133,588 70,896
Lung & Leukemia Breast Breast Lung & Colon &Bronchus 305 1,764 12,202 Bronchus Rectum59,304 37,426 11,720
Breast Brain Uterine Lung & Breast Lung & 43,844 & ONS Cervix Bronchus 20,083 Bronchus
220 637 9,937 11,463
Colon & Endocrine Leukemia Colon & Colon & BreastRectum System 500 Rectum Rectum 9,79329,237 77 3,297 13,855
Pancreas Bones & Lung & Ovary Pancreas Pancreas13,940 Joints Bronchus 2,757 7,595 4,730
70 467
Ovary Soft Brain Uterine Ovary Non-Hodgkin’s13,342 Tissue & ONS Cervix 7,237 Lymphoma
50 401 1,720 3,501
Note: All sites excludes basal and squamous cell skin cancers and in situ carcinomas except urinary bladder.ONS = other nervous system.Data source: Vital Statistics of the United States, 1998.
Table 9Reported Deaths for the Five Leading Cancer Sites
for Females by Age, United States, 1995

C A N C E R S T A T I S T I C S , 1 9 9 9
24 Ca—A cancer Journal for Clinicians
African Asian/Pacific AmericanSite White American Islander Indian Hispanic†
INCIDENCEAll SitesTotal 405.2 445.8 277.9 153.8 278.1
Male 485.6 605.1 324.1 180.1 331.2
Female 352.0 336.1 243.4 135.9 244.9
Breast (Female) 113.2 99.0 71.4 31.9 69.3
Colon & RectumTotal 44.3 51.2 38.3 16.4 29.1
Male 53.8 59.4 47.2 21.9 35.6
Female 37.2 45.5 31.2 — 24.3
Lung & BronchusTotal 56.4 75.0 35.8 18.8 28.2
Male 74.3 114.4 52.4 25.1 40.0
Female 43.3 46.4 22.4 14.1 19.8
Prostate 150.3 224.3 82.2 46.4 104.4
MORTALITYAll SitesTotal 168.2 224.8 104.0 103.0 105.3
Male 210.1 311.4 129.9 122.8 132.6
Female 140.1 168.8 83.9 88.8 86.5
Breast (Female) 26.0 31.5 11.6 11.7 15.3
Colon & RectumTotal 17.6 23.3 11.0 9.6 10.5
Male 21.8 28.0 13.6 10.5 13.2
Female 14.6 20.1 9.0 8.7 8.5
Lung & BronchusTotal 49.4 61.0 23.9 28.5 20.1
Male 70.7 102.0 35.1 40.0 32.4
Female 33.6 32.7 15.0 19.6 11.0
Prostate 24.1 55.0 10.9 14.2 16.8
Note: Incidence data are from the 11 SEER areas; mortality data are from all states except Connecticut,Oklahoma, Louisiana, and New Hampshire.
*Rates are per 100,000 population and are age-adjusted to the 1970 US standard population.
†Hispanic is not mutually exclusive of white, African American, Asian/Pacific Islander, or American Indian.
— Statistic not calculated. Rate based on fewer than 10 cases per year within the time interval.
Data sources: NCI Surveillance, Epidemiology, and End Results Program, 1998 (incidence); Vital Statistics of theUnited States, 1998 (mortality).
Table 10Incidence and Mortality Rates* by Site,
Race, and Ethnicity, United States, 1990–1995

C A C a n c e r J C l i n 1 9 9 9 ; 4 9 : 8 - 3 1
Vol. 49 No. 1 JANUARY/FEBRUARY 1999 25
1974– 1980– 1989– 1974– 1980– 1989– 1974– 1980– 1989–1976 1982 1994 1976 1982 1994 1976 1982 1994
Site White African American All Races
All Sites 50 52 62† 39 40 47† 49 51 60†
Brain 22 25 30† 27 31 38† 22 25 30†
Breast (Female) 75 77 87† 63 66 71† 75 76 85†
Colon 50 56 64† 46 49 52† 50 55 63†
Esophagus 5 7 13† 4 5 9† 5 7 12†
Hodgkin’s Disease 71 75 83† 69 72 76 71 74 82†
Kidney 52 51 62† 49 55 58† 52 52 61†
Larynx 66 69 67 59 58 56 66 68 66
Leukemia 35 39 44† 31 33 31 34 38 43†
Liver 4 4 6† 1 2 2† 4 3 5†
Lung & Bronchus 13 14 15† 11 12 11 12 13 14†
Melanoma of Skin 80 83 88† 66‡ 60§ 69‡ 80 83 88†
Multiple Myeloma 24 28 28† 27 29 30 24 28 29†
Non-Hodgkin’s Lymphoma 48 52 52† 48 50 41† 47 51 51†
Oral Cavity & Pharynx 55 55 55 36 31 32 53 53 53
Ovary 37 39 50† 41 39 46† 37 39 50†
Pancreas 3 3 4† 3 5 4† 3 3 4†
Prostate 68 75 95† 58 65 81† 67 73 93†
Rectum 49 53 61† 42 38 53† 48 52 61†
Stomach 15 16 19† 17 19 21 15 18 21†
Testis 79 92 96† 76‡ 90‡ 90 79 92 95†
Thyroid 92 94 96† 88 94 88 92 94 95†
Urinary Bladder 74 79 84† 47 58 62† 72 78 82†
Uterine Cervix 70 68 72† 64 61 59 69 67 70
Uterine Corpus 89 83 87† 61 54 54 88 82 84†
*Survival rates are adjusted for normal life expectancy and are based on follow-up of patients through 1995.
†The difference in rates between 1974–1976 and 1989–1994 is statistically significant (P < 0.05).
‡ The standard error of the survival rate is between 5 and 10 percentage points.
§ The standard error of the survival rate is greater than 10 percentage points.
Data source: NCI Surveillance, Epidemiology, and End Results Program, 1998.
Table 11Trends in 5-Year Relative Cancer Survival Rates* (%)
by Race and Year of Diagnosis, United States, 1974–1994

C A N C E R S T A T I S T I C S , 1 9 9 9
26 Ca—A cancer Journal for Clinicians
80
70
60
50
40
30
20
10
01930 1940 1950 1960 1970 1980 1990
Year
Rate
per
100
,000
Fem
ale
Popu
latio
n
Figure 5Age-Adjusted Cancer Death Rates*
for Females by Site, United States, 1930–1995
Note: Due to changes in the ICD coding, numerator information has changed over time. Rates for cancerof the uterus, ovary, lung & bronchus, and colon & rectum are affected by these coding changes.*Rates are per 100,000 population and are age-adjusted to the 1970 US standard population.†Uterine cancer death rates are for uterine cervix and uterine corpus combined.Data source: Vital Statistics of the United States, 1998.
Uterus†
Lung & Bronchus
Breast
Stomach
Pancreas
Ovary
Colon & Rectum

C A C a n c e r J C l i n 1 9 9 9 ; 4 9 : 8 - 3 1
Vol. 49 No. 1 JANUARY/FEBRUARY 1999 27
Figure 6Age-Adjusted Cancer Death Rates*
for Males by Site, United States, 1930–1995
Liver
Leukemia
Pancreas
Prostate
Stomach
Colon & Rectum
Lung & Bronchus
80
70
60
50
40
30
20
10
01930 1940 1950 1960 1970 1980 1990
Year
Rate
per
100
,000
Mal
e Po
pula
tion
Note: Due to changes in the ICD coding, numerator information has changed over time. Rates for cancerof the liver, lung & bronchus, and colon & rectum are affected by these coding changes.*Rates are per 100,000 population and are age-adjusted to the 1970 US standard population.Data source: Vital Statistics of the United States, 1998.

C A N C E R S T A T I S T I C S , 1 9 9 9
28 Ca—A cancer Journal for Clinicians
Site
Localized
Regional
Distant
Percent
Note: Staging according to SEER summary stage categories rather than the American Joint Committee on Cancer (AJCC) staging system. For each siteand race, stage categories do not total 100% because sufficient informationis not available to assign a stage to all cancer cases.NC = Statistic could not be calculated.Data source: NCI Surveillance, Epidemiology, and End Results Program, 1998.
Figure 7Percent Distribution of Cancer Cases
by Race and Stage at Diagnosis, United States, 1989–1994
Percent
White African American
Uterine Corpus
Uterine Cervix
Urinary Bladder
Stomach
Prostate
Pancreas
Ovary
Oral Cavity & Pharynx
Melanoma of Skin
Lung & Bronchus
Esophagus
Colon & Rectum
Breast (Female)
0 20 40 60 80 100
91275
73155
31874
353020
81960
4724
7
619
24
84138
48
82
472315
242525
373720
0 20 40 60 80 100
202250
103743
92555
382919
141456
5123
8
581024
165418
NCNC55
522412
262328
253532
93550
2962
6
C A C a n c e r J C l i n 1 9 9 9 ; 4 9 : 8 - 3 1
Vol. 49 No. 1 JANUARY/FEBRUARY 1999 29
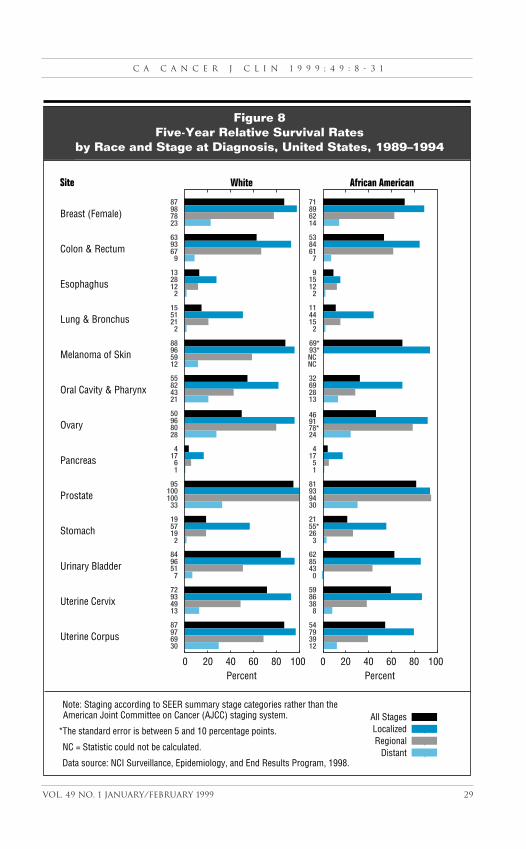
All StagesLocalizedRegional
Distant
Percent
Figure 8Five-Year Relative Survival Rates
by Race and Stage at Diagnosis, United States, 1989–1994
Note: Staging according to SEER summary stage categories rather than the American Joint Committee on Cancer (AJCC) staging system.
*The standard error is between 5 and 10 percentage points.
NC = Statistic could not be calculated.
Data source: NCI Surveillance, Epidemiology, and End Results Program, 1998.
Site White African American
Percent
Uterine Corpus
Uterine Cervix
Urinary Bladder
Stomach
Prostate
Pancreas
Ovary
Oral Cavity & Pharynx
Melanoma of Skin
Lung & Bronchus
Esophaghus
Colon & Rectum
Breast (Female)
30699787
13499372
7519684
2195719
33100100
95
16
174
28809650
21438255
12599688
2215115
2122813
9679363
23789887
12397954
8388659
0438562
32655*21
30949381
15
174
9146
78*24
13286932
NCNC93*69*
2154411
212159
7618453
14628971
0 20 40 60 80 1000 20 40 60 80 100

C A N C E R S T A T I S T I C S , 1 9 9 9
30 Ca—A cancer Journal for Clinicians
Number Death Rate Percentof per 100,000 of Total
Rank Cause of Death Deaths Population* Deaths
All Causes 14,989 27.3 100.0
1 Accidents 5,824 10.7 38.9
2 Cancer 1,514 2.8 10.1
3 Congenital Anomalies 1,144 2.0 7.6
4 Homicide 1,014 1.8 6.8
5 Heart Diseases 545 1.0 3.6
6 HIV Infection 399 0.7 2.7
7 Cerebral Palsy 338 0.6 2.3
8 Suicide 337 0.7 2.2
9 Pneumonia & Influenza 284 0.5 1.9
10 Chronic Obstructive Pulmonary Disease 180 0.3 1.2
11 Benign Neoplasms 159 0.3 1.1
12 Septicemia 137 0.2 0.9
13 Viral Diseases 131 0.2 0.9
14 Cerebrovascular Diseases 127 0.2 0.8
15 Anemias 122 0.2 0.8
All Others 2,734 18.2
*Age-adjusted to the 1970 US standard population.Data source: Vital Statistics of the United States, 1998.
Table 12Fifteen Leading Causes of Death Among Children
Aged 1–14 Years, United States, 1995

C A C a n c e r J C l i n 1 9 9 9 ; 4 9 : 8 - 3 1
Vol. 49 No. 1 JANUARY/FEBRUARY 1999 31
Five-Year Relative Survival Rates (%)
Year of Diagnosis1974– 1977– 1980– 1983– 1986– 1989–
Site 1976 1979 1982 1985 1988 1994
All Sites 56 62 65 68 70 74*
Acute Lymphocytic Leukemia 53 67 70 70 78 80*
Acute Myeloid Leukemia 14 26† 21† 32† 28† 43*
Bones & Joints 54† 53† 54† 59† 62† 64*
Brain & Other Nervous System 55 56 55 62 62 63*
Hodgkin’s Disease 79 83 91 90 90 92*
Neuroblastoma 52 54 53 54 60 69*
Non-Hodgkin’s Lymphoma 45 51 62 70 69 78*
Soft Tissue 61 69 65 76 66 76*
Wilms’ Tumor 74 77 87 86 91 93*
Note: All sites excludes basal and squamous cell skin cancers and in situ carcinomas except urinary bladder.*The difference in rates between 1974–1976 and 1989–1994 is statistically significant (P< 0.05).†The standard error of the survival rate is between 5 and 10 percentage points.Data source: NCI Surveillance, Epidemiology, and End Results Program, 1998.
Table 13Trends in Cancer Survival for Children Under Age 15
United States, 1974–1994