Embed Size (px)
Citation preview

IEEE TRANSACTIONS ON GEOSCIENCE AND REMOTE SENSING 1
Abstract— The Canadian Experiment for Soil Moisture in 2010 (CanEx-SM10) was carried out in Saskatchewan, Canada from 31 May to 16 June, 2010. Its main objective was to contribute to Soil Moisture and Ocean salinity (SMOS) mission validation and the pre-launch assessment of Soil Moisture and Active and Passive (SMAP) mission. During CanEx-SM10, SMOS data as well as other passive and active microwave measurements were collected by both airborne and satellite platforms. Ground-based measurements of soil (moisture, temperature, roughness, bulk density) and vegetation characteristics (Leaf Area Index, biomass, vegetation height) were conducted close in time to the airborne and satellite acquisitions. Besides, two ground-based in situ networks provided continuous measurements of meteorological conditions and soil moisture and soil temperature profiles. Two sites, each covering 33 km x 71 km (about two SMOS pixels) were selected in agricultural and boreal forested areas in order to provide contrasting soil and vegetation conditions. This paper describes the measurement strategy, provides an overview of the data sets and presents preliminary results. Over the agricultural area, the airborne L-band brightness temperatures matched up well with the SMOS data. The Radio frequency interference (RFI) observed in both SMOS
Manuscript received April 8, 2011. This work was supported by several
agencies in Canada (Natural Sciences and Engineering Research Council of Canada, Environment Canada, Canadian Space Agency, and Agriculture and Agri-Food Canada) and USA (National Aeronautics and Space Administration, United States Department of Agriculture).
R. Magagi, K. Goïta, I. Gherboudj, L.-P. Rousseau and N. Djamaï are with the Université de Sherbrooke, Département de géomatique appliquée, Sherbrooke, QC J1K 2R1, Canada ([email protected]).
A.A. Berg and John Belanger are from the University of Guelph, Department of Geography, Guelph, ON N1G 2W1, Canada ([email protected]).
B. Toth is from Environment Canada MSC Hydrometeorology and Arctic Lab, Saskatoon, (SK) Canada
S. Belair is from Environment Canada, Meteorological Research Branch, 2121, Trans-Canada Highway, Dorval, QC H9P 1J3, Canada A. Walker is from Environment Canada, Climate Research Division, 4905 Dufferin Street, Toronto, ON M3H 5T4, Canada
H. McNairn, A. Merzouki, and J. Shang are from Agriculture and Agri-Food Canada, 960 Carling Ave, Ottawa, ON K1A 0C6.
M. Moghddam, and M. Burgin are from the University of Michigan, Electrical Engineering and Computer Science Department, Ann Arbor, MI 48109-2122, USA.
S. Kim, A. Colliander, P. O’Neill, and J. Fisher are from Jet Propulsion Laboratory, Pasadena, CA 91109, USA.
T. Jackson, and M. Cosh are from USDA-ARS Hydrology and Remote Sensing Lab, Beltsville, MD 20705, USA.
and the airborne L-band radiometer data exhibited spatial and temporal variability and polarization dependency. The temporal evolution of SMOS soil moisture product matched that observed with the ground data, but the absolute soil moisture estimates did not meet the accuracy requirements (0.04 m3/m3) of the SMOS mission. AMSR-E soil moisture estimates are more closely correlated with measured soil moisture.
Index Terms— SMOS, soil moisture, brightness temperature, validation, field experiment, agricultural and boreal forested areas, microwave airborne sensors, AMSR-E.
I. INTRODUCTION
emote sensing of soil moisture is a key component of several observing and research programs including the Global Energy and Water Cycle Experiment (GEWEX),
the Integrated Global Water Cycle Observation (IGWCO) and the Global Soil Wetness Project (GSWP), among others. This is related to the fact that soil moisture plays a critical role in governing global water and energy cycles. Recently, Jung et al. [1] linked the decline in the global evapotranspiration since 1998 to a potential limitation in soil moisture supply. At regional and local scales, soil water availability affects the distribution of vegetation and crop health, and impacts flood risk. Bélair et al. [2] and Koster et al. [3] have shown the importance of the initial soil moisture state for improved climate and weather forecasts while Berg and Mulroy [4] have demonstrated the value of modeled soil moisture for improving streamflow forecasts. Numerous microwave satellite missions (RADARSAT-2, AMSR-E, ALOS-PalSAR, etc.) currently provide data which can be used to estimate and monitor changes in soil moisture. In addition, the European Space Agency’s (ESA) new mission Soil Moisture and Ocean Salinity (SMOS) and the National Aeronautics and Space Administration’s (NASA) future mission Soil Moisture Active and Passive (SMAP) are dedicated to monitoring global soil moisture information [5], [6]. Exploitation of this new satellite microwave data requires intensive campaigns to collect ground and airborne data to validate SMOS brightness temperature data and soil moisture products. Lessons learned from SMOS investigations, especially when complemented
Canadian Experiment for Soil Moisture in 2010 (CanEX-SM10): Overview and
Preliminary Results Ramata Magagi, Aaron Berg, Kalifa Goïta, Stephane Belair, Tom Jackson, Brenda Toth, Anne
Walker, Heather McNairn, Peggy O’Neill, Mahta Moghddam, Imen Gherboudj, Andreas Colliander, Michael Cosh, John Belanger, Mariko Burgin, Josh Fisher, Sab Kim, Louis-Philippe B.-Rousseau,
Nadjib Djamaï, Jiali Shang, and Amine Merzouki
R
https://ntrs.nasa.gov/search.jsp?R=20110011920 2018-06-16T13:23:03+00:00Z
IEEE TRANSACTIONS ON GEOSCIENCE AND REMOTE SENSING 2
with airborne radar data, will contribute to SMAP algorithm development and validation.
Several international field experiments, over a variety of landscapes, have been devoted to the assessment of SMOS brightness temperature data and soil moisture products. Each of these has value to the overall assessment of the SMOS products. The Canadian Experiment for Soil Moisture in 2010 (CanEx-SM10) complements these by focusing on a different climate region. Details on these field campaigns can be found in [7]-[12].
The purpose of this paper is to present an overview of CanEx-SM10 [11] which took place from 31 May to 16 June 2010 in Saskatchewan, Canada. CanEx-SM10 was a collaborative effort between researchers in Canada and the U.S.A. The campaign was designed to collect field measurements for the validation of SMOS data, the pre-launch assessment of SMAP soil moisture products, and the development of soil moisture retrieval algorithms specifically for agricultural and boreal forest areas in Saskatchewan, Canada. To meet the abovementioned objectives, L-band passive microwave data were acquired with a radiometer mounted on a Twin Otter aircraft owned by the National Research Council of Canada (NRC) and managed by Environment Canada. Data were also acquired by NASA’s Uninhabited Aerial Vehicle Synthetic Aperture Radar (UAVSAR), a polarimetric L-Band synthetic aperture radar (SAR) sensor flown on a Gulfstream-III aircraft. Coincident with airborne and satellite (SMOS, AMSR-E, RADARSAT-2 and ALOS-PalSAR) acquisitions, ground measurements were made to characterize the soil (moisture, temperature, roughness, bulk density) and the vegetation (height, biomass, Leaf Area Index (LAI), density). In addition, two ground-based networks managed by the University of Guelph (U of G) and Environment Canada (EC) provided continuous measurements of soil moisture over the study area. At the time of the present study, SMOS is in its early operational phase (since June 2010) and consequently, the large dataset collected during CanEx-SM10 provides critical data to improve the soil moisture retrieval algorithms for both agricultural and boreal forest landscapes, and to develop downscaling approaches. The large agricultural fields (approximately 60 ha), characteristic of Canada’s Prairies region, are well suited to address L-band coarse resolution passive microwave research questions. CanEx-SM10 was the first attempt in Canada to acquire soil moisture observations simultaneous with satellite and aircraft microwave measurements for the development of large-scale soil moisture retrieval algorithms. In addition, considering SMOS Cal/Val activities and the pre-launch assessment of SMAP, CanEx-SM10 is one of the few soil moisture experiments conducted over a boreal forest and subarctic environment.
The following sections describe the CanEx-SM10 study sites and the experimental design including the sampling strategy associated with the ground and airborne measurements and the selection of SMOS and other satellite acquisitions. The analysis of data collected during CanEx-SM10 is then presented followed by a short description on the CanEx-SM10 data base.
II. SITES 2.1. General description of the study sites
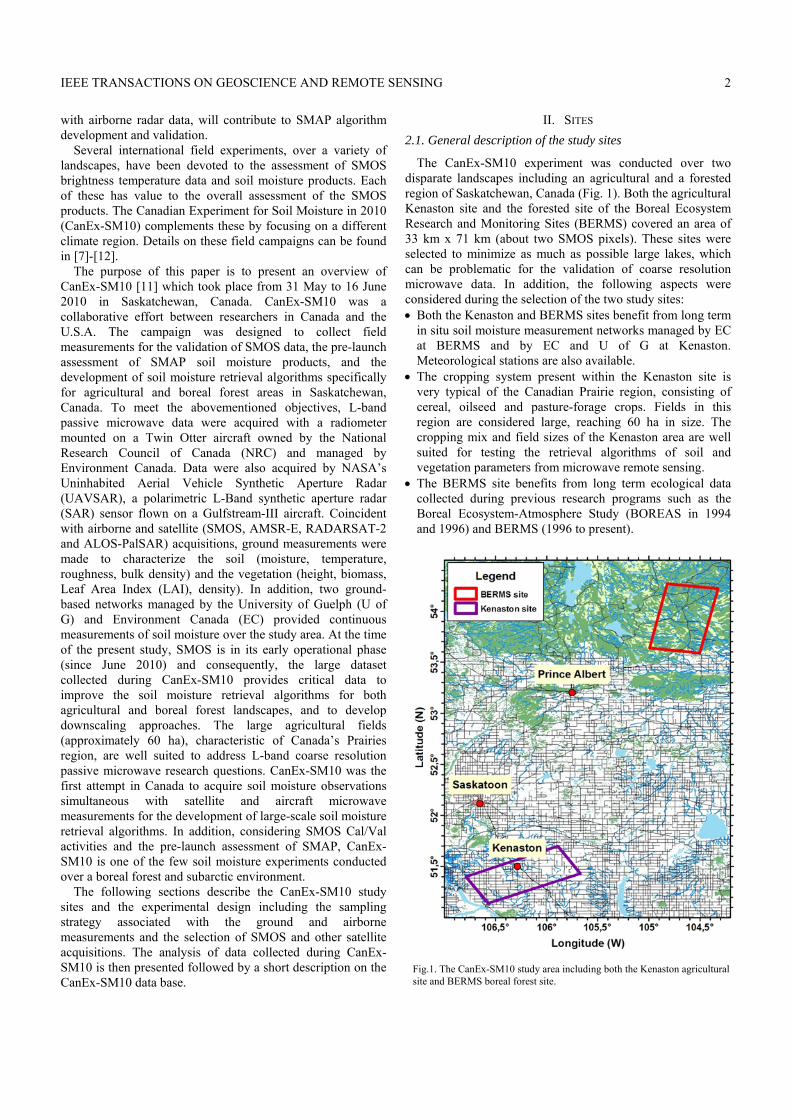
The CanEx-SM10 experiment was conducted over two disparate landscapes including an agricultural and a forested region of Saskatchewan, Canada (Fig. 1). Both the agricultural Kenaston site and the forested site of the Boreal Ecosystem Research and Monitoring Sites (BERMS) covered an area of 33 km x 71 km (about two SMOS pixels). These sites were selected to minimize as much as possible large lakes, which can be problematic for the validation of coarse resolution microwave data. In addition, the following aspects were considered during the selection of the two study sites: • Both the Kenaston and BERMS sites benefit from long term
in situ soil moisture measurement networks managed by EC at BERMS and by EC and U of G at Kenaston. Meteorological stations are also available.
• The cropping system present within the Kenaston site is very typical of the Canadian Prairie region, consisting of cereal, oilseed and pasture-forage crops. Fields in this region are considered large, reaching 60 ha in size. The cropping mix and field sizes of the Kenaston area are well suited for testing the retrieval algorithms of soil and vegetation parameters from microwave remote sensing.
• The BERMS site benefits from long term ecological data collected during previous research programs such as the Boreal Ecosystem-Atmosphere Study (BOREAS in 1994 and 1996) and BERMS (1996 to present).
Fig.1. The CanEx-SM10 study area including both the Kenaston agricultural site and BERMS boreal forest site.

IEEE TRANSACTIONS ON GEOSCIENCE AND REMOTE SENSING 3
2.1.1. Kenaston site
The agricultural site (51.50 N, 106.50 W) is located approximately 80 km from Saskatoon (Fig. 1), Saskatchewan, Canada. The topography of the region is shown in Fig. 2. As evident in this figure, the region is not perfectly flat and the highest elevations are in the eastern part of the area and there is a valley toward the west. Based on Landsat image classification, approximately 92% of the site is under annual cultivation with most of the remaining area in permanent grass and pasture. Production is almost exclusively rain-fed with minimal use of irrigation. Prior to and during the CanEx-SM10 experiment, the Kenaston area experienced above normal rainfall resulting in very wet soil conditions. As a consequence, pools of standing water were present in many fields, increasing the percentage of open water from 1.5% to 4.9 % [13], [14]. The presence of standing water inevitably complicates the analysis and interpretation of the coarse resolution microwave signals.
Table I describes the field conditions during CanEx-SM10. With the exception of the pasture fields, most fields had been tilled and were covered with varying amounts of crop residue. Seeding and crop development were delayed in the spring of 2010 due to the unusually wet soil conditions. Vegetation cover varied but was less than 50% for most fields (Table I). Although most of the soils are loamy, high variability was observed in soil texture, and the dominant textures included silt, clay and sandy loams.
2.1.2. BERMS site
The BERMS region is located north of Prince Albert (53.24
N, 105.75 W) in Saskatchewan near the southern extent of the boreal forest (Fig. 1). BERMS features several instrumented research sites located in regions with various vegetation types (mostly forest), ages and structures [15]. The topography is generally rolling and the dominant vegetation type depends on the soil types and drainage conditions. To reduce the contribution of lakes to the observed microwave signals, CanEx-SM10 only covered the eastern portion of the study area which was originally defined for the BERMS measurements program [13]. Five vegetation types (old Aspen, old Jack Pine, Harvested Jack Pine, Fen, and old Black Spruce) mostly forests are dominant in this region (Table II).
2.2. Ground truth locations
Measurements to characterize the soils and vegetation were spatially distributed over the Kenaston and BERMS sites, capturing the natural variability in the landscape. Sampling stations were selected based upon availability of resources, road accessibility, and ability to meet two objectives: 1) provide a suitable dataset to validate satellite and airborne soil moisture retrieval; and 2) relate point measurements to satellite acquisitions. A total of 60 fields were sampled over the Kenaston site. These included 24 fields instrumented with long term in situ soil moisture stations managed by EC and 16 fields instrumented managed by U of G. An additional 20 fields were added to complement these permanents sites (Table I and Fig. 2).
Over the BERMS site, the 35 sampling stations consisted of 6 BERMS permanent stations located at BERMS research sites, 20 BERMS temporary stations installed by the U.S. Department of Agriculture (USDA) from May to August 2010, and several ground truth sites. All of these 35 stations were sampled on the airborne flight day [13].
III. EXPERIMENTAL DESIGN CanEx-SM10 was an intensive short-term campaign (31
May to 16 June, 2010) designed to collect consistent field measurements at a time close to satellite and airborne acquisitions to support validation of both SMOS and SMAP products. Table III presents a comprehensive list of the field data collected during CanEX-SM10. The spatial extent of both the Kenaston and BERMS sites was equivalent to about two SMOS pixels. The size of the study sites impacted the experimental design and was a factor in optimizing the number of sampled stations. This optimization included minimizing sampling times and travel time from one field to another as well as coordinating sampling to be coincident with SMOS overpasses, all within available resources. Given these constraints and the requirement to collect spatially distributed soil and vegetation measurements (moisture, roughness, biomass, LAI, bulk density, etc.), the priority was to cover a large number of fields at the SMOS scale of approximately 30 km. A calendar of data collection and information on the available airborne and satellite acquisitions are provided in Table IV. 3.1. Ground data sampling strategy
3.1. 1. Soil moisture, temperature and bulk density
Over the Kenaston area soil moisture, bulk density, and temperature were measured approximately coincident with the satellite and airborne acquisitions. On each sampling day, measurements were taken on 48-60 fields, with each team of two visiting four to five fields. The location of each sampling point in each field was recorded using a GPS. During subsequent sampling days, these coordinates were used to navigate to the same point, ensuring that each successive measurement was taken at the same location.
Fig.2. Digital Elevation Model of the Kenaston site at 30 m resolution (downloaded from http://www.geobase.ca/) along with the location of the sampling stations. Basic information for all the stations is provided in Table 1.

IEEE TRANSACTIONS ON GEOSCIENCE AND REMOTE SENSING 4
TABLE I CHARACTERISTICS OF THE SAMPLING FIELDS OVER KENASTON AREA - 24 EC FIELDS, 16 U OF G FIELDS, AND 20 MANUAL SURVEY (MS)
FIELDS
Crop Soil
Type Height Fract. cover
Residue cover
Bulk density Sand Silt Clay Type Tillage
Field type
Field #
Lat (°N)
Long (°W)
- cm % % g/cm³ % % % EC D4 51.25 106.45 Canola - >50 1.18 26 51 23 Silt Loam Yes H1 51.39 106.52 Canola - 5-11 <25 1.18 42 41 17 Loam No H2 51.37 106.50 Canola - 8 >50 1.12 39 44 17 Loam No H3 51.36 106.51 Canola - 12-35 >50 1.17 34 50 16 Loam No H4 51.37 106.45 Cereal 2 25-50 1.14 50 32 18 Loam Yes H5 51.38 106.43 Canola 1 15 25-50 1.19 37 41 22 Loam No I1 51.37 106.43 Wheat - - <10 0.87 28 59 13 Silt Loam No I2 51.38 106.42 Wheat 8-10 1 <25 1.20 45 22 33 Clay Loam No I3 51.39 106.41 - - - <10 0.98 28 53 19 Silt Loam No I4 51.38 106.41 - - - <10 0.92 29 53 18 Silt Loam No J1 51.39 106.45 Wheat - 9 >50 1.19 23 57 20 Silt Loam No J2 51.40 106.43 Wheat - 18 >50 1.31 26 50 24 Loam Yes J3 51.39 106.43 Canola - 7-15 >50 1.34 31 46 23 Loam No J4 51.41 106.43 Canola 4 11 >50 1.32 37 40 23 Loam No J5 51.42 106.42 Wheat - 3-7 >50 1.30 33 46 21 Loam No K1 51.42 106.42 Wheat 3 - >50 1.14 29 49 22 Loam Yes K2 51.43 106.43 Peas - 2 >50 1.09 20 43 37 Clay Loam No K3 51.44 106.43 Canola 1 9-17 >50 1.06 33 47 20 Loam No K4 51.44 106.43 Peas 3 7 >50 1 21 53 26 Silt Loam No K5 51.45 106.50 Canola 3 6 >50 1.16 - - - - Yes L1 51.43 106.47 Wheat 25-30 60-80 <25 1.11 26 55 19 Silt Loam No L2 51.42 106.47 Wheat 10-15 40 <25 1.13 29 49 22 Loam Yes L3 51.43 106.54 Wheat 6-8 10-13 <25 1.09 34 45 21 Loam No L4 51.45 106.57 Canola 4-5 15 >50 1.03 37 42 21 Loam Yes U of G A2 51.57 106.18 Wheat 8-10 9-38 >50 1.26 29 42 29 Clay Loam No A3 51.63 106.10 Pasture 10-25 38 25-50 1.13 - - - - No A4 51.59 106.01 No crop - - - - - - - - A5 51.54 105.99 Peas 2 5-10 25-50 1.10 45 31 24 Loam No C1 51.36 105.94 Pasture 20-25 50-73 >10 1.25 41 38 21 Loam No C2 51.39 106.10 Not planted - - >50 1.08 41 38 21 Loam No C3 51.43 106.24 Wheat 8-10 8-14 <25 1.24 32 40 28 Clay Loam No C5 51.37 106.29 Wheat - 8-10 >50 1.03 20 53 27 Clay Loam Yes E1 51.27 106.39 Pasture - - <25 1.24 25 54 21 Silt Loam No E4 51.36 106.41 Bare soil - - >50 1.23 23 59 18 Silt Loam No F2 51.28 106.67 Canola - 9-15 25-50 1.10 30 49 21 Loam Yes G2 51.36 106.63 Lentil 2-3 11 >50 1.21 34 48 18 Loam Yes G4 51.36 106.57 Peas 3-4 15 >50 1.14 31 52 17 Silt Loam No G5 51.39 106.50 wheat - 13 >50 1.15 28 47 25 Loam No L5 51.56 106.24 Lentil - 7 >50 1.31 38 43 19 Loam No I5 51.40 106.45 - - - <10 1.02 30 54 16 Silt Loam No MS A1 51.56 106.24 No crop - - >50 1.12 40 39 21 Loam Yes A6 51.42 105.94 No crop - - 25-50 1.12 35 38 27 Clay Loam No B1 51.42 105.94 Pasture - 39 <10 1.33 58 28 14 Sandy Loam No B2 51.42 105.90 Pasture - 54 <10 1.34 72 17 11 Sandy Loam No B3 51.42 105.87 Pasture 10-40 23-75 <10 1.12 50 39 11 Loam No B4 51.41 105.86 Pasture - 28-50 <10 1.21 56 30 14 Sandy Loam No B5 51.50 106.09 Pasture - 7-22 >50 1.04 - - - - No C4 51.40 106.24 Bare soil - - >50 1.23 33 41 26 Loam Yes D1 51.39 106.29 Lentil 2-3 4 >50 1.16 30 43 27 Clay Loam Yes D2 51.44 106.33 Canola - 6 25-50 1.10 37 42 21 Loam Yes D3 51.42 106.45 wheat 4 11 25-50 1.18 34 39 27 Clay Loam Yes E2 51.33 106.36 Bare soil - - >50 1.32 31 51 18 Silt Loam No E3 51.33 106.39 Lentil - - >50 1.19 23 54 23 Silt Loam No E5 51.28 106.61 Wheat 4-8 7 25-50 1.26 28 51 21 Silt Loam Yes F1 51.27 106.66 lentil 3 9 >50 1.21 42 40 18 Loam No F3 51.29 106.68 Not planted - 8 >50 1.27 37 45 18 Loam No F4 51.30 106.66 Not planted - - >50 1.23 39 47 14 Loam No F5 51.39 106.78 Lentil 3 20 25-50 1.17 38 46 16 Loam Yes G1 51.38 106.61 Not planted - - >50 1.25 33 49 18 Loam No G3 51.33 106.67 Not planted - - >50 1.13 32 46 22 Loam No

IEEE TRANSACTIONS ON GEOSCIENCE AND REMOTE SENSING 5
In each field, soil moisture was measured to a depth of 6 cm using the Steven’s Water Hydra Probe inserted vertically. Sampling was conducted along two transects 400 m apart. Each transect included seven sample points at a 100 m spacing. At each sample point, three replicate moisture readings were collected. When tillage structure was evident, these replicates were located at the top, bottom and side of the tillage furrow. Table V presents the sampling regime for soil moisture, soil temperature, thermal infra red (TIR), and bulk density at Kenaston. For each field and on each sampling day, a gravimetric sample was obtained for a fixed volume of the surface layer. These samples were taken to the laboratory for oven drying over a 24 hour period. Then, they were used to calibrate the soil moisture probes and to derive soil texture and bulk density via lab analysis.
In addition to the manual sampling of soil moisture within each field, hourly soil moisture and soil temperature profiles at 5, 25, and 50 cm depths were recorded continuously at single points by the EC and U of G networks. They also used the Steven’s Water Hydra probes installed vertically and horizontally for respectively EC and U of G networks. Using the calibration curves developed for each network station, uncertainty in volumetric soil moisture ranged from +/- 0.03 m3/m3 to +/- 0.015-0.02 m3/m3, depending on the soil texture [16]. Some additional details regarding the network operated by the U of G are described in [17]. These profiles of soil moisture and soil temperature were complemented by precipitation measurements from rain gauges.
Over BERMS, a one-day field campaign was conducted on 16 June 2010. Soil moisture, bulk density, and temperature measurements were collected approximately coincident with the aircraft and SMOS acquisitions. In the sampling approach for this site, measurements were taken at 35 ground truth stations (GTS) that were spatially distributed over the study area and located along accessible roads and trails [13]. At each GTS station, three soil moisture measurements were taken at a 6-cm depth and at three measurement points located within the surrounding canopy at a nominal distance of 20, 25, and 30 m from the GTS location. The sampling was conducted by six teams of two people and covered the entire area, within the limits of road inaccessibility. Table V presents the sampling strategy for soil moisture, soil temperature, TIR, and bulk density at BERMS. As at the Kenaston site, pre-programmed GPS coordinates were used to easily and accurately geo-locate the sampling stations. In some cases, the collection of bulk density samples over BERMS was complicated by the presence of an organic layer of variable thickness. At each of the three replicate sampling locations, the organic layer was first measured and then removed from a 20 cm x 28 cm area in order to collect a sample of the underlying mineral soil from which the bulk density was derived. The depth of the organic layer was recorded and the material bagged and weighed for the determination of water volume.
TABLE II DESCRIPTION OF THE FIVE BERMS SAMPLING SITES
Site_ID Geographic
location Site description
OBS 53.99 N 105.12 W
Mature wet old black spruce Moss and Labrador tea understory Mean height: 7 m
OJP 53.92 N 104.69 W
Old dry jack Pine mature dry coniferous jack pine forest Lichen understory Mean height : 13.4 m
HO2
53.95 N 104.65 W
Harvested Jack Pine 2002 Ground cover consisting of sparse grass, shrubs and immature jack pine seedlings Mean height: 1.82 m
Temp 7 53.90 N 104.88 W
Mixed Forest Pine, Fir, Aspen Mean height: 6.44 m, 6.87 m, and 10.17 m for respectively Pine, Fir and Aspen
FEN
53.78 N 104.62 W
Flooded vegetation, among others horse tail, grass and 2-3 kind of shrubs. Mean height: 35.6 cm, 45.7 cm, and 43.2-96.5 cm for respectively horse tail, grass and shrubs.
TABLE III GROUND DATA COLLECTED AT THE KENASTON AND BERMS
SITES
Sites Measurements Human resource
Sampled stations
soil moisture at 6-cm depth, bulk density, soil temperature at 5 and 10-cm depth, and Thermal Infra Red (TIR)
12 teams of 2 people
48-60 per sampling day
Soil texture 12 teams of 2 people
60 for the entire campaign
Vegetation (water content, height, density, etc.) and soil roughness
2 teams of 2 people
60 for the entire campaign
Kenaston June 1-14, 2010
Leaf Area Index (LAI) 3 people 60 for the entire campaign
Soil moisture, soil temperature at 5 and 10-cm depth, surface temperature and TIR
6 teams of 2 people
35-40 for the sampling day
Tree characteristics (DBH, height, crown fractional cover, stem density, branch measurements, soil moisture at 5 cm depth, stem and branch dielectric constant)
1 team of 5 people 5
BERMS 16 June, 2010 14-16 June and on 13-20 July, 2010
Understory characteristics (type, fractional cover)
1 team of 5 people 5

IEEE TRANSACTIONS ON GEOSCIENCE AND REMOTE SENSING 6
TABLE IV AVAILABLE GROUND, AIRBORNE, AND SATELLITE MEASUREMENTS DURING CANEX-SM10
Sites Kenaston BERMS Measurements June 2010 1 2 3 4 5 6 7 8 9 10 11 12 13 14 16
Ground Data Collection - √ - - √ √ √* - √ - - - √ √ √ SMOS √√ √ √√ - √√ - √ √√ - √√ √ √ √√ - √√ AMSR-E √√ √√ √√ √ √√ √√ √√ √√ √√ √√ √√ √√ √√ √√ √√ RADARSAT-2 √√ √ - - √√ - - √√ - - √ √ - - - ASAR - - - - - √ √ - - √√ - - √ - √
Satellite
ALOS-PALSAR - - - - - √ √ - √ - - - - √ - Airborne Twin Otter and
UAVSAR - √ - - √ √ √* - √ - - - √ √ √
√: one acquisition per day √√: two acquisitions (ascending and descending) per day √*: Partial coverage due to rain event
TABLE V SAMPLING REGIMES OVER THE KENASTON AND BERMS STUDY SITES
Sites Soil sampling regime
Sampling points per field: 14 located at pre-programmed GPS points Transects per field: 2 transects 400 m apart Points per transect: 7 Spacing between points in transect: 100 m with the first point 50 m from the field edge Number of soil moisture readings per point 3 (top, bottom and side of furrow) Soil moisture measurements Probe inserted vertically, soil moisture is integrated over 6 cm Soil temperature 4 points at two depths (5 cm and 10 cm) Thermal infra red (TIR) 4 measurements in each field. Exposed Vegetation, shaded vegetation, exposed ground
and shaded ground. Bulk Density 1 core sample of 5 cm depth
Kenaston
Site Photos One taken in the direction of the crop row, Sampling points per GTS: 3, located at pre-programmed GPS points Spacing between points: 5 m (20 m, 25 m and 30 m from the GTS) Number of soil moisture readings per point 3 (top, left and right side of measurement point) Soil moisture measurements Probe inserted vertically, soil moisture is integrated over 6 cm Soil temperature Simultaneously to soil moisture at 5 cm depth Thermal infra red (TIR) 4 Measurements for each GTS. exposed vegetation, shaded vegetation, exposed Ground
and shaded ground. Gravimetric soil moisture 3 samples of 5 cm depth per GTS
BERMS
Site Photos Two landscape and one vertical Vegetation sampling regime
Vegetation characterization plant density, row spacing, row direction Wet and dry biomass and canopy water content 1 m sampling if rows were well defined, otherwise
sample of 50 cm x 50 cm using a gridded board, 3 replicates. Wet samples oven dried tdetermine dry biomass and canopy water content.
LAI 14 hemispherical photos along 2 parallel transects 30 m in length Site photos 1 photograph of a gridded board placed over the vegetation, 3 replicates;
14 crop architecture photos
Kenaston
Vegetation height and stem diameter 3 – 10 height and diameter measurements per site at each of three sites Transects per site: 3 of 100 m length for the mixed forest (Temp 7) and 1 of 100 m length for OBS, OJP, an
HO2 sites Spacing between points in transect: 10 m Vegetation characterization Species identification, tree height, diameter-at-breast-height (DBH), and tree count, crow
depth Densities of Stems, large and small branches, leaves From tree trunk density Radius and length of large and small branches, leaves From a destructive sampling of one ‘average’ tree
BERMS
Distribution parameters From photographs and site inspection

IEEE TRANSACTIONS ON GEOSCIENCE AND REMOTE SENSING 7
The above data sets were augmented with soil moisture and soil temperature which are continuously collected at different depths and at 4-hour intervals at the permanent BERMS research stations [15]. The only exception was the Fen site where data were recorded every 30 minutes. Furthermore, over BERMS, CanEx-SM10 also benefited from 5-cm depth soil moisture measurements collected on an hourly time interval at 20 temporary stations [13]. 3. 1.2. Soil roughness
The soil roughness measurements were made over the Kenaston fields using a 1-meter pin profiler consisting of 200 needles spaced at an interval of 5 mm. Each field was sampled at least once, however resampling was conducted over fields that were tilled during the campaign. The objective was to measure soil roughness characteristics (standard deviation of surface heights and correlation lengths) to quantify the impact of roughness on SAR backscatter and to a lesser extent on L-band passive microwave data for estimating soil moisture at the SMOS scale. Due to the expanse of the study area (about two SMOS pixels), an approach was adopted to optimize the number of roughness measurements across the site. Data collected in July of 2008 over Kenaston was analyzed to determine the within field variance in surface roughness to guide the sampling design. This analysis determined that the within field variance in roughness is far less than the field to field variance. Roughness in agricultural regions is largely driven by tillage applications and thus this observation is not unexpected. Based on this analysis it was determined that one sample site per field was sufficient to characterize roughness. The pin profiler is positioned perpendicular to the soil and once the board is level, the needles are released. The tops of the needles mimic the surface roughness profile. At each site, a 3 m roughness profile was created by placing the one metre profiler end to end in the look directions of both the UAVSAR and RADARSAT-2 (descending overpass). This 3 meter profile was replicated three times, at a distance of approximately five metres. A digital camera recorded the pin meter profiles and these photos were processed to derive surface roughness characteristics (standard deviation of surface heights and correlation lengths). Processing of the photos and the extraction of the roughness statistics are described in [18]. The mean and the standard deviation of the surface roughness parameters were computed to determine the average field roughness.
Over the BERMS forested site no roughness measurement was collected due to the presence of an understory. 3.1.3. Vegetation
The Kenaston data will be used to assess the impact of canopy water content on the microwave response in estimating soil moisture at SMOS/SMAP scales. For each field, three replicate vegetation samples were gathered at a single site. Measurements of plant height, stem diameter, plant density, row spacing and row direction were recorded. To minimize crop disturbance, vegetation in front of the 1-meter pin profiler was removed, providing a measurement of above ground wet biomass. The vegetation samples were oven-dried
at 80 oC to constant weight, which provided both dry biomass weights and canopy water content. Due to time constraints, each field was sampled once for the derivation of the abovementioned parameters.
In addition to destructive vegetation sampling, crop development was also monitored with the measurements of LAI. At each site, a total of 14 hemispherical photos were taken at 5 meters spacing along two parallel transects approximately 30 meters apart. This method of LAI determination was well suited conditions in this experiment given the limited canopy development. Coincident with the LAI measurements and accompanying each set of hemispherical photos, crop architecture photos were also collected at each site. A summary of the sampling of vegetation characteristics is given in Table V.
BERMS data will be used to investigate how well soil moisture can be retrieved in boreal landscapes using L-band active/passive microwave remote sensing. The data will also assist in improving SMOS soil moisture retrieval algorithms, in developing SMAP soil moisture retrieval algorithms and in forward modeling of SMAP radar backscatter. At BERMS a total of five sites were sampled (Table II). The ground measurements included three 100-m transects at a mixed forest site (Temp7) and one 100 m transect at each of the Old Jack Pine, Old Black Spruce, and Harvested Jack Pine sites. The Fen site vegetation characteristics were measured along the boardwalk leading to the flux tower location. Various vegetation measurements were taken in 10-m intervals along each transect. At every 10 m mark, tree height, trunk radius, and tree count were measured together with trees fractional cover, understory cover, and litter depth. The stem density along the entire transect was determined by counting the number of stems within a ~2 m arm-span and dividing by the area (approximately 100 m x 2 m). The densities of large and small branches as well as that of leaves were calculated from the trunk density and the quantity of these components for the measured trees at each 10 m mark. Crown layer depth and trunk height, as well as trunk diameter-at-breast-height (DBH) were recorded. For each forested site, one “average” tree was destructively sampled from which the radius and length of large and small branches as well as leaf dimensions were recorded. The distribution parameters of the branches were deduced from photographs and inspection in the field. 3.2. Remote sensing data
To meet the objectives of CanEx-SM10, both airborne and satellite remote sensing data were acquired. 3.2.1. Aircraft data
Two aircraft, one equipped with a passive microwave radiometer and the other with an active SAR, were used in CanEx-SM10. These included a Twin Otter aircraft owned by the NRC and managed by EC, and NASA’s Gulfstream-III (G-III) aircraft. These aircrafts were deployed to acquire data to support the validation of SMOS products (L1, L2), the pre-launch assessment of SMAP data, and evaluation of soil moisture retrieval algorithms from these two missions. The data will also be used to investigate approaches to scaling

IEEE TRANSACTIONS ON GEOSCIENCE AND REMOTE SENSING 8
among remote sensing sources and to understand the relationship between ground measurements and satellite products. The Twin Otter and G-III attempted to cover the Kenaston and BERMS study areas close in time to SMOS overpasses. The flight calendar is presented in Table IV.
Twin Otter: This aircraft was equipped with EC’s passive microwave radiometers which operate at 1.4, 6.9, and 19-37-89 GHz. Visible and infra red radiometers were also mounted on the aircraft and these sensors provide variable spectral information suitable to assist with data analysis and modeling. About 16 parallel flight lines were required to cover each study area. The L-band radiometer was flown at an altitude of approximately 2.3 km which resulted in a spatial resolution of about 2.25 km. These L-band data were collected at a 40° incidence angle. NASA G-III: This aircraft carried the UAVSAR which is a fully polarimetric L-band radar [19]. Using multiple flight lines, the UAVSAR provided spatial coverages similar to those of the L-band radiometer with a nominal flight altitude of 13 km. The UAVSAR collected data over a swath of about 21 km with the incidence angle ranging from 20° (near range) to 65° (far range). The pixel size is 7.5 m in range x 6 m in azimuth. The UAVSAR data are publicly available from the UAVSAR data server of the Jet Propulsion Laboratory [19] for both the Kenaston and BERMS sites.
Full details on the flight lines of both the Twin Otter and the G-III as well as additional information on passive and active microwave sensors aboard these aircrafts can be found in the Experimental plan of CanEx-SM10 [13]. 3.2.2. Satellite data
SMOS acquisitions available over the study sites during CanEx-SM10 are listed in Table IV. Other satellite acquisitions (AMSR-E, RADARSAT-2, Envisat ASAR and ALOS-PalSAR) were planned to be as close in time as possible to the SMOS overpasses. Several modes of RADARSAT-2 were planned including acquisitions of Fine Quad Polarimetric, Standard and Wide Swath, at varying incidence angles. Envisat ASAR acquisitions in Alternating Polarization and Wide modes were programmed to fill gaps in the RADARSAT-2 acquisition plan. ALOS-PalSAR data were acquired in Fine Dual and Wide modes. To maximize temporal coverage, whenever possible both ascending and descending microwave acquisitions were programmed. L- and C-band microwave satellite data (Table IV) will be compared with L- and C-bands airborne data to understand the scaling effect on soil moisture and to develop active/passive soil moisture retrieval algorithms. In addition to microwave satellite data, LANDSAT, SPOT, and AWiFS optical measurements were available over the Kenaston site.
IV. PRELIMINARY RESULTS
4.1. Ground measurements
4.1.1. Soil moisture, bulk density and temperature
Over the Kenaston fields, a site specific calibration of the volumetric soil moisture measured by the Steven’s Water Hydra Probes was performed using the gravimetric soil samples. Fig. 3 shows a summary of these dataset and suggests a strong agreement between soil moisture measured by the two methods. The data spread observed around the 1:1 line can be attributed to variances in soil type and errors in collecting gravimetric samples and thus in estimating soil bulk density. The soil bulk density values derived from the gravimetric samples are presented in Table I for each field.
The individual field average soil moisture measured at Kenaston during CanEx-SM10 are presented in Fig. 4a. The high soil moisture values reflect the very wet conditions due to heavy rainfall before and during the field campaign (Section 2). Some variation in soil moisture is observed between fields. A number of factors contribute to inter-field differences in wetness including topography, precipitation amounts, soil texture, and vegetation cover (Fig. 2 and Table I) and will be explored in greater detail in the future. As a complement of Fig. 4a, the temporal evolution of the averages soil moisture, soil temperature and precipitation data is given in Fig. 5. The lowest soil moisture conditions were observed for June 2nd, 5th and 6th. Rain on June 7th and 8th resulted in very wet conditions on June 9th. Warm and dry conditions observed after June 12th led to the soil drying towards the conclusion of the experiment. Indeed, soil moisture values on June 13th and June 14th were lower than the values observed on June 9th. Fig. 6 shows the coefficient of variation as a function of the mean soil moisture values measured during CanEx-SM10. These statistics indicate a decrease in the relative variation in soil moisture with an increase in moisture.
0 0.1 0.2 0.3 0.4 0.5 0.60
0.1
0.2
0.3
0.4
0.5
0.6
Hydra Probe measured volumetric water content (m³/m³)
Fiel
d m
easu
red
volu
met
ric w
ater
co
nten
t (m
³/m³)
bias=0RMSE=0.05R²=0.67
Fig.3. Calibration curve of the hydra probe sensors over the Kenaston fields.

IEEE TRANSACTIONS ON GEOSCIENCE AND REMOTE SENSING 9
A1 A2 A3 A4 A5A6 B1 B2 B3 B4 B5C1 C2 C3 C4 C5D1 D2 D3 D4 E1 E2E3 E4 E5 F1 F2 F3 F4 F5 G1G2G3G4G5H1 H2 H3 H4H5 I1 I2 I3 I4 I5 J1 J2 J3 J4 J5 K1 K2 K3 K4 K5 L1 L2 L3 L4 L50.1
0.2
0.3
0.4
0.5
Fields
Soi
l moi
stur
e (m
³/m³)
-a-
June 2 June 5 June 6 June 9 June 13 June 14
A1 A2 A3 A4 A5 A6 B1 B2 B3 B4 B5 C1 C2 C3 C4 C5 D1 D2 D3 D4 E1 E2 E3 E4 E5 F1 F2 F3 F4 F5 G1G2G3G4 G5H1 H2 H3 H4 H5 I1 I2 I3 I4 I5 J1 J2 J3 J4 J5 K1 K2 K3 K4 K5 L1 L2 L3 L4 L50
5
10
15
20
25
30
35
Fields
Soi
l tem
pera
ture
at 5
cm
(°C
)
-b-
June 2 June 5 June 6 June 9 June 13 June 14
A1 A2 A3 A4 A5 A6 B1 B2 B3 B4 B5 C1 C2 C3 C4 C5 D1 D2 D3 D4 E1 E2 E3 E4 E5 F1 F2 F3 F4 F5 G1G2G3 G4G5H1 H2 H3 H4 H5 I1 I2 I3 I4 I5 J1 J2 J3 J4 J5 K1 K2 K3 K4 K5 L1 L2 L3 L4 L50
1
2
3
4
Fields
Sur
face
roug
hnes
s he
ight
(cm
)
-c-
Profiler in the look direction of RADARSAT-2 Profiler in the look direction of UAVSAR
Fig.4. Field average soil characteristics over Kenaston during CanEx-SM10 a) 6-cm soil moisture; b) 5-cm depth soil temperature, and c) surface root mean square (rms) roughness height
150 155 160 165 1700
0.2
0.4
0.6
Soi
l moi
stur
e (m
³/m³)
Julian day 2010
Measured soil moisture
150 155 160 165 1700
20
40
60
Rai
n vo
lum
e (m
m)
Soi
l tem
pera
ture
(°C
)
Measured soil temperatureRainfall
Fig.5. Temporal evolution of the mean values of the measured soil moisture, soil temperature and precipitation over Kenaston during CanEx-SM10
0 0.1 0.2 0.3 0.4 0.5
10
20
30
40
Measured soil moisture (m³/m³)
Coe
ffici
ent o
f var
iatio
n (%
)
June 2June 5June 6June 9June 13June 14
Fig.6. Coefficient of variation in soil moisture versus the mean values of the measured soil moisture (m³/m³) during CanEx-SM10

IEEE TRANSACTIONS ON GEOSCIENCE AND REMOTE SENSING 10
Famiglietti et al. [20] have shown that this decrease in variance is reduced at higher moisture levels, within a range of 0.20-0.45 m3/m3 soil moisture. This suggests that other site factors may play a role and thus might explain the scatter observed in Fig. 6. The field to field variation of some of these factors is given in Table I. Current studies are focused on attributing the observed variance to physical processes.
Soil temperature was measured at a 5-cm depth simultaneous with the soil moisture measurements. The temporal trend in soil temperature matches that of soil moisture as presented in Fig. 4a. The soil temperature ranged from 10 to 20°C. 4.1.2. Soil roughness
The measurements of soil roughness in the look direction of both RADARSAT-2 (91° in descending) and UAVSAR (242°) are shown in Fig. 4c. In some cases, there was no significant macro tillage structure and the two measurements were similar. In the fields with tillage structure, roughness did vary as a function of the SAR look direction. In addition, roughness measured in the look direction of the UAVSAR was higher than that measured in the look direction of RADARSAT-2. Consequently, a constant surface roughness cannot be assumed in backscatter modelling in this region. 4.1.3. Vegetation
Several vegetation characteristics were measured over the Kenaston and BERMS sites (Section 3.1.3). In this paper, the consistency of the data was evaluated empirically. For the Kenaston fields, Fig. 7 demonstrates a positive relationship between LAI and percent crop fractional cover. This is expected during early crop development, which was the CanEx-SM10 condition. At higher LAI, this relationship weakens as crop cover becomes near complete yet LAI continues to increase. Additional information on crop characteristics associated with the Kenaston fields are given in Table I.
Measurements and vegetation observations collected over BERMS are described in Table III. Tree heights varied from 1 to 22 m; tree heights were greatest at the OJP site (8-19 m) followed by the OBS site (2-13 m). Younger trees dominated the HO2 with tree heights varying from 1 to 3 m. In Table VI, the strong relationship between tree heights (in meter) and the diameter-at-breast-height (DBH in meter) is demonstrated for sites Temp 7, HO2, and OBS. A much weaker relationship is observed for the OJP site (Table VI).
4.2. Remote sensing data
4.2.1. Aircraft
4.2.1. UAVSAR
The UAVSAR acquired data over the Kenaston site at incidence angles of 20-65 degrees. The original images were processed to produce a normalized data set with an incidence angle of 40° [21]. Fig. 8a is an R-G-B (HH-HV-VV) color composite of 13 June, 2010 acquisition. The extent of the UAVSAR coverage and its location within the Kenaston site are provided (upper left corner of the image) in Fig. 8a. In this figure, the strongest response is observed for the HH (red color) and VV (blue color) polarizations, with much lower contributions from the HV (green color) channel. This indicates a dominance of surface scattering from bare or sparsely vegetated surfaces, with little contribution from volume scattering. Variations in the HH and VV responses are evident and these reflect the field to field differences in soil moisture and roughness (Fig. 4a and Fig. 4c). Very dark locations are often associated with specular reflection from standing water. The UAVSAR data adequately discriminates between the different terrain features present at the Kenaston site and captures the ground conditions (i.e. soil moisture, vegetation cover) during the campaign.
The UAVSAR data acquired over the BERMS site on 16 June 2010 can be seen in Fig. 8b where the individual data swaths with 25- 65° incidence angle range were post-processed by geo-referencing and assembling them into a single image mosaic to cover the whole area of interest. The image is an R-G-B (HH-HV-VV) color composite of 16 June 2010 acquisition. The location of the five BERMS sites sampled for vegetation can be identified by their location with respect to White Gull Lake, which shows up prominently in
0
0.5
1
1.5
2
2.5
3
3.5
0 20 40 60 80 100Crop fractional cover (%)
LAI
CanolaLentilePastureWheatPeas
Fig.7. Measured effective LAI versus percent crop fractional cover
TABLE VI RELATIONSHIPS DBH (D IN M) VS TREE HEIGHT (H IN M)
MEASUREMENTS AT DIFFERENT SITES OF BERMS
Sites Tree species Linear relationships Temp 7 Pine (only) 009.0012.0 −= HD ; R2 = 0.81 OBS Old Black Spruce 002.0011.0 −= HD ; R2 = 0.80 HO2 Harvested Jack
Pine 012.002.0 −= HD ; R2 = 0.84
OJP Old Jack Pine 038.00074.0 += HD ; R2 = 0.41 OJP+HO2 Old and harvested
Jack Pine 0069.00096.0 += HD ; R2 = 0.94
All All 0065.00096.0 += HD ; R2 = 0.82

IEEE TRANSACTIONS ON GEOSCIENCE AND REMOTE SENSING 11
the image as a dark surface in the middle left of the image. The UAVSAR data show strong variations between the different vegetation types based on the combination of polarizations in the response and provide rich information content for use in quantitative retrieval and interpretation. Generally speaking, the darkest areas in the image correspond to bodies of water; bare soil surfaces and surfaces with grass or very short vegetation also appear dark, but not as much as the water surfaces. Since the VV response is generally stronger than HH and certainly HV, the bare surfaces though dark may appear with blue tones in the image. Forested areas with tall stems produce large amounts of the so-called “double-bounce” scattering, which is most pronounced in the HH channel and therefore contains a strong red component in the image. Locations with dense crown layers produce strong vegetation volume scattering, which shows up more strongly in the HV channel (green). Over the Fen site, the signal is dominated by surface scattering and therefore a good amount of both HH and VV is observed.
4.2.2. L-band Twin Otter data
Fig. 9 presents the maps of the calibrated L-band brightness temperatures acquired at a 40° incidence angle, in H and V
polarizations (TBH and TBV) by the Twin Otter over the Kenaston site on June 13th. The two maps exhibit similar pattern in the variability of the brightness temperatures which results from soil moisture variability (Section 4.1.1.), topography (Fig. 2) and other surface conditions (Table I). Low values of brightness temperature values are observed in the valley (falling in the delineated circle) while high values are measured in the Eastern part of the study area where high topography dominates (Fig. 2). Furthermore, a decreasing trend is observed in the brightness temperatures from south to north.
Fig. 10 shows that over the BERMS site both TBH and TBV
are affected by RFI to different degrees. RFI will result in higher than expected brightness temperatures. In the eastern part of the BERMS site, the first three flight lines appear free of RFI. The remaining flight lines have varying degrees of RFI. Some brightness temperature values are very high, up to 9250 K and 4400 K for the H and V polarizations, respectively. These values are far above the natural emission which is less than 300 K. Furthermore, Fig. 10 shows that the RFI is polarization dependent. In fact, TBV is spatially less affected than TBH. However, the later is more affected in terms of signal’s magnitude.
The possible source of RFI we identified in the BERMS site is the use of communication antennas with a central bandwidth very close to the protected L-band (1.4–1.5 GHz).
Kil t
± June 13th, 2010 - L-band Airborne Radar normalized to 40 dgrs
105°50'W106°40'W
51°4
0'N
51°1
5'N
Kenaston Study Area
Flight line #: 24204
0 30 6015Kilometers
a
b
Fig.8. R-G-B color composite of UAVSAR a) June 13th , 2010 acquisition normalized at 40° over the Kenaston site and b) Mosaic of June 16th , 2010acquisition over BERMS site from individual data swaths with 25- 65° incidence angle range. R-HH, G-HV, and B-VV.
51.14
51.25
51.36
51.47
51.58
51.69
106.78 106.56 106.34 106.12 105.90
Kenaston – June 13th, 2010
Longitude (°W)
Lat
itude
(°N
)
a)
106.78 106.56 106.34 106.12 105.90
51.14
51.25
51.36
51.47
51.58
51.69
Longitude (°W)
Lat
itude
(°N
)
Kenaston – June 13th, 2010
b)
Fig.9. Maps of L-band TBH and TBv measured by the Twin Otter over Kenaston site on June 13th, 2010. The circle of 31 km diameter is centered on the SMOS grid ID 147226 (51.35 N, 106.43W)

IEEE TRANSACTIONS ON GEOSCIENCE AND REMOTE SENSING 12
The flight lines with the highest RFI are within the corridor along which the antennas are transmitting. Some previous L-band airborne experiments conducted in the framework of SMOS Cal/Val activities have also suffered from RFI and methods have been developed and applied for RFI detection and mitigation [22], [23]. 4.2.3. SMOS and AMSR-E
The SMOS brightness temperature (L1c product) and soil moisture (L2 product) data used in this paper were processed with the prototypes 346 and 307, respectively. This suggests that the SMOS brightness temperatures are reprocessed data in contrast to the SMOS estimated soil moisture.
A preliminary analysis of the SMOS data has been conducted to assess the angular variation and temporal evolution and the polarization dependency of the data with respect to the differences in vegetation conditions (agricultural vs forested areas). SMOS data, shown in Fig. 11 and Fig. 12 for the Kenaston and BERMS sites, correspond respectively to the centre grid IDs 147226 (51.35 N, 106.43 W) and 139552 (53.80 N, 104.70 W). As observed with the Twin Otter’s L-band airborne data, the SMOS brightness temperatures acquired over BERMS are more significantly impacted by RFI (TB > 300 K) relative to the Kenaston acquisitions. The difference observed between the brightness temperatures of the Kenaston and BERMS sites is in accord with the theory [24] and previous results obtained from field experiments [25], [26]. Indeed, over Kenaston the observed signals should be representative of bare wet soil conditions and thus have low values, while the higher brightness values over BERMS are a result of a high vegetation contribution and a low soil contribution due to the attenuation from the forest layer.
Angular variation
The angular profiles of SMOS brightness temperature (TBH and TBV) acquired on 13 June are shown in Fig. 11 for the Kenaston and BERMS sites. The Twin Otter data at 40° not corrupted by RFI, over Kenaston, are also presented in Fig. 11a. These temperatures are average values calculated over the circle of 31 km diameter delineated in Fig. 9. This circle is centred on the above mentioned SMOS grid center # ID 147226 (51.35 N, 106.43 W) located in Kenaston. The observed angular behaviours over Kenaston and BERMS are typical of soil and vegetation layers, respectively [24], [27]. While the difference between TBH and TBV increases with the incidence angle over Kenaston (where bare soil conditions dominate), this difference is reduced over the BERMS forested site where a very weak angular dynamic is present. Good correspondence between SMOS and Twin Otter data can be observed over Kenaston on 13 June. Due to the impact of RFI on the Twin Otter acquisitions over BERMS (Fig. 10), no comparison is made between these data and SMOS measurements. Temporal evolution
Due to the variability observed in SMOS brightness temperatures for both H and V polarizations (Fig. 11), functions were fitted to the angular profiles of TBH and TBV measurements. These functions were used to simulate SMOS data at 40° incidence angle for H and V polarizations in order to make a comparison with the temporal evolution of the L-band airborne brightness temperatures. The temporal evolution of SMOS brightness temperatures (TBH, TBV) obtained at a 40° incidence angle from the best fit functions and that of the SMOS estimated soil moisture are provided in Fig. 12. Twin Otter data at 40° that was not corrupted by RFI
a)
b)
Fig.10. Maps of TBH and TBv measured by the Twin Otter over BERMS site on June 16th, 2010

IEEE TRANSACTIONS ON GEOSCIENCE AND REMOTE SENSING 13
over Kenaston are also presented. In addition, field measured soil moisture, precipitation [28] and AMSR-E soil moisture estimates [29] are also included in this figure. Fig. 12a shows that SMOS and the airborne brightness temperatures exhibit similar temporal trends. However, in contrast to Fig. 11a, a difference appears between the SMOS data obtained from the best fits and the airborne measurements, particularly in the V polarization which shows more variability (Fig. 11). Considering the range of variation of the root means square error (rmse) of these best fit functions and the range of variation of the standard deviation (std) of the airborne data over an area of 31 km diameter (Table VII), this difference is acceptable.
The response in brightness temperature as a function of
polarization is as expected. Indeed, depolarization of the signal occurs over the BERMS site where a more significant vegetation canopy is present.
Fig. 12a shows more variation in SMOS TBH than in TBV measurements over Kenaston, which may be a result of the greater sensitivity of H polarization to soil conditions relative to V polarization. While a good match is obtained between the temporal trend in soil moisture as measured throughout the CanEX-SM10 experiment and those of the airborne data and SMOS TBH, only a small agreement is observed with the trend in the SMOS brightness temperatures acquired in the V polarization. Indeed, the adverse weather conditions during the experiment reduced the number of soil moisture measurements and these data gaps make it more difficult to compare the temporal trends in soil moisture measurements with that of the SMOS brightness temperatures.
0 10 20 30 40 50 60 70150
200
250
300
350
400
Incidence angle (°)
TB(K
)
a) SMOS/Twin Otter Brightness Temperature over Kenaston
TBV (SMOS)
TBH (SMOS)
TBV, 1.4GHz (Twin Otter)
TBH, 1.4GHz (Twin Otter)
June 13, 2010
0 10 20 30 40 50 60 70150
200
250
300
350
400
Incidence angle (°)
TB(K
)
b) SMOS Brightness Temperature over BERMS
TBV (SMOS)
TBH (SMOS)
June 16, 2010
Fig.11. Angular profiles of SMOS TBH and TBV measurements over a) Kenaston on June 13th, 2010 and b) BERMS on June 16th, 2010. Twin Otter airborne brightness temperatures are compared to SMOS data over Kenaston site. Airborne data over BERMS contaminated by RFI are not shown.
150 155 160 165 170100
150
200
250
300
350a) SMOS Brightness Temperature over Kenaston at θ=40°
TB (K
)
Julian day 2010
TBV (SMOS)
TBV (Twin Otter)
TBH (SMOS)
TBH (Twin Otter)
150 155 160 165 1700
25
50
75
100
125
Rai
n vo
lum
e (m
m),
Soi
l moi
stur
e (%
v/v
)
SMOS soil moistureAMSR-E soil moistureMeasured soil moistureRainfall
150 155 160 165 170100
150
200
250
300
350b) SMOS Brightness Temperature over BERMS at θ=40°
TB (K
)
Julian day 2010
TBV (SMOS)
TBH (SMOS)
150 155 160 165 1700
25
50
75
100
125
Rai
n vo
lum
e (m
m),
Soi
l moi
stur
e (%
v/v
)
SMOS soil moistureAMSR-E soil moistureMeasured soil moistureRainfall
Fig.12. Temporal evolution of SMOS brightness temperatures (TBH, TBV
obtained at 40° incidence angle from the best fit functions) and retrieved soil moisture from SMOS, together with field measured soil moisture, precipitation downloaded from Environment Canada database (http://www.climat.meteo.gc.ca/) and AMSR-E soil moisture estimated values (http://nsidc.org/data/docs/daac/ae_land3_l3_soil_moisture.gd.html). a) over Kenaston with L-band airborne brightness temperatures in H and V polarizations, b) over BERMS.

IEEE TRANSACTIONS ON GEOSCIENCE AND REMOTE SENSING 14
Over BERMS (Fig. 12b), TBH appears more stable than
over Kenaston. This confirms the observation that over the BERMS forested site, the signal is less sensitive to variations in soil conditions relative to Kenaston. TBH and TBV measurements on Julian day 163 were erroneous; indeed TBV is somewhat higher than natural emission (TBV > 300 K) while TBH falls to ~ 200 K.
Over both the Kenaston and BERMS sites, SMOS significantly underestimates soil moisture when compared to field measured moisture. Thus, the accuracy requirements (0.04 m3/m3) for the SMOS mission [5] are not met with this data set based on the processing and analysis of the ground data we have conducted to date. Inadequate characterization of the vegetation contribution in the SMOS soil moisture estimation algorithm may offer one explanation. Over Kenaston, the soil moisture measurements and the estimates from SMOS (L2 products) followed a similar temporal trend, but with an absolute soil moisture offset of about 0.15 m3/m3. Such an evaluation can not be completed for BERMS, since only one day of field measurements is available. In Fig. 12, AMSR-E soil moisture estimates are much closer to the soil moisture measurements than the SMOS estimates. Recently, using soil moisture measurements from networks located in the U.S., Jackson [30] showed that despite its higher frequency AMSR-E performed similarly to SMOS.
V. CANEX-SM10 DATA BASE
A CanEX-SM10 data base is under development. It will include all field and remote sensing data sets acquired during CanEx-SM10, with the exception of satellite SAR and optical data (due to potential licensing issues). Once all quality assurances have been made, the data set is expected to be released to the general public in June 2012.
VI. CONCLUSION
The paper presents an overview of the data set collected during the CanEx-SM10 experiment. This experiment took place from 31 May to 16 June 2010 over an agricultural site (Kenaston) and a boreal forest (BERMS) located in Saskatchewan, Canada. Each site covered an area of 33 km x
71 km which corresponds to about two SMOS pixels. Soils were uncharacteristically wet at the Kenaston site due to above-normal precipitation prior to and during the campaign. Field measured volumetric soil moisture ranged from 0.20 to 0.45 m3/m3 with significant field to field variability in moisture conditions. Summer and spring tillage created macro structure in some fields and thus soil roughness varied from field to field and roughness parameters (root mean square and correlation statistics) varied depending on the direction of measurement. As for the vegetation, the consistency of data was evaluated by examining the empirical relationships between the LAI and crop fractional cover over the Kenaston site, and between tree heights and the DBH over the BERMS site.
Over both the Kenaston and BERMS sites, both airborne and satellite microwave data were collected near the SMOS overpass times and coincident with ground-based measurements. Both the UAVSAR and the Twin Otter aircraft acquisitions at L-band captured the surface conditions observed during the experiment. The RFI observed in the SMOS and the L-band airborne radiometer data sets was characterized by strong spatial and temporal variability and polarization dependency.
The airborne and satellite data acquired, as well as the field measurements and data available from long term soil moisture networks present in the sites will support the validation of SMOS data and products, as well as the pre-launch assessment of SMAP. SMOS is in its early operational phase (since June 2010) and the large dataset collected during CanEx-SM10 can be used to correct SMOS soil moisture estimated values (L2 product processed with the prototype 307). Early analysis has determined that these products significantly underestimate soil moisture over both the Kenaston and BERMS sites. For these data, the accuracy requirements (0.04 m3/m3) of the SMOS mission are not met. The AMSR-E soil moisture estimates more closely reflected the soil moisture conditions observed on the ground. Future work will focus on the development of improved soil moisture retrieval algorithms and disaggregation methods using the CanEx-SM10 data set.
ACKNOWLEDGMENT CanEx-SM10 was funded by several agencies in Canada
(Natural Sciences and Engineering Research Council of Canada, Environment Canada, Canadian Space Agency, and Agriculture and Agri-Food Canada) and USA (National Aeronautics and Space Administration, United States Department of Agriculture). It was a joint effort of Canadian and American research and academic institutions (Université de Sherbrooke/Centre d’applications et de recherches en télédétection, University of Guelph, Environment Canada, Agriculture and Agri-Food Canada, United States Department of Agriculture (USDA)- Hydrology and Remote Sensing Lab, National Aeronautics and Space Administration, Jet Propulsion Laboratory (JPL), and University of Michigan). The authors would like to thank the funding agencies and all the participants to CanEx-SM10.
TABLE VII RANGE OF VARIATION OF THE ROOT MEAN SQUARE ERROR
(RMSE) VALUES OF THE BEST FUNCTIONS FITTING THE SMOS ANGULAR PROFILES AND THE STANDARD DEVIATION (STD) OF
THE AIRBORNE DATA OVER AN AREA OF 31 KM DIAMETER
RMSE (K) of the best fit functions
STD (K) of airborne data over an area of 31 km diameter
Polarization H V H V Min 3.8 7.8 10.5 8.3 Max 29.5 35.4 15.2 13.1 Mean 7.3 15.3 12.1 9.8

IEEE TRANSACTIONS ON GEOSCIENCE AND REMOTE SENSING 15
REFERENCES
[1] M. Jung, M. Reichstein, P. Ciais, S. I. Seneviratne, J. Sheffield, M. L. Goulden, G. Bonan, A. Cescatti, J. Chen, R. de Jeu, A. J. Dolman, W. Eugster, D. Gerten, D. Gianelle, N. Gobron, J. Heinke, J. Kimball, B. E. Law, L. Montagnani, Q. Mu, B, Mueller, K. Oleson, D. Papale, A. D. Richardson, O. Roupsard, S. Running, E. Tomelleri, N. Viovy, U. Weber, C. Williams, E. Wood, S. Zaehle and K. Zhang, ‘‘Recent decline in the global land evapotranspiration trend due to limited moisture supply,’’ doi:10.1038/nature09396. Macmillan Publishers, 2010.
[2] S. Bélair, L.-P. Crevier, J. Mailhot, B. Bilodeau, and Y. Delage, ‘‘Operational implementation of the ISBA land surface scheme in the Canadian regional weather forecast model. Part I: Warm season results,’’ J. Hydromet., vol. 4, pp. 352-370, 2003.
[3] R. D. Koster, M. J. Suarez, P. Liu, U. Jambor, A. Berg, M. Kistler, R. Reichle, M. Rodell, and J. S. Famiglietti, ‘‘Realistic Initialization of Land Surface States: Impacts on Subseasonal Forecast Skill,’’ Journal of Hydrometeorology, vol. 5, pp. 1049–1063, 2004.
[4] A. A. Berg, and K. Mulroy, ‘‘Streamflow Predictability Given Macro-Scale Estimates of the Initial Soil Moisture Status,’’ Hydrological Sciences Journal, vol. 51, pp. 642-654, 2006.
[5] Y. H. Kerr, P. Waldteufel, J.-P. Wigneron, J. Martinuzzi, J. Font, M. Berger, ‘‘Soil moisture retrieval from space: The Soil Moisture and Ocean Salinity (SMOS) mission,’’ IEEE Trans. Geosci Remote Sens., vol. 39, 8, pp. 1729 – 1735, 2001.
[6] D. Entekhabi, E. G. Njoku, P. E. O’Neill, K. H. Kellogg, W. T. Crow, W. N. Edelstein, J. K. Entin, S. D. Goodman, T. J. Jackson, J. Johnson, J. Kimball, J. R. Piepmeier, R. D. Koster, N. Martin, K. C. McDonald, M. Moghaddam, S. Moran, R. Reichle, J. C. Shi, M. W. Spencer, S. W. Thurman, L. Tsang, and J. Van Zyl, ‘‘The Soil Moisture Active Passive (SMAP) Mission,’’ Proc. IEEE, vol. 8, no. 5, pp. 704-716, 2010.
[7] M. Vall-llossera, A. Camps, I. Corbella, F. Torres, N. Duffo, A. Monerris, R. Sabia, D. Selva, C. Antolín, E. López-Baeza, J. F. Ferrer, and K. Saleh, ‘‘SMOS REFLEX 2003: L-Band Emissivity Characterization of Vineyards,’’ IEEE Trans. Geosci Remote Sens., vol. 43, 5, pp. 973-982, 2005.
[8] P. de Rosnay, J. C. Calvet, Y. Kerr, J.-P. Wigneron, F. Lemaître, M. J. Escorihuela, J. M. Sabater, K. Saleh, J. Barrié, G. Bouhours, L. Coret, G. Cherel, G. Dedieu, R. Durbe, N. E. Fritz, F. Froissard, J. Hoedjes, A. Kruszewski, F. Lavenu, D. Suquia, and P. Waldteufel, ‘‘SMOSREX: A long term field campaign experiment for soil moisture and land surface processes remote sensing,’’ Remote Sens. Environ., vol. 102, 3-5, pp. 377–389, 2006.
[9] R. Panciera, J. P. Walker, J. D. Kalma, E. J. Kim, J. M. Hacker, O. Merlin, M. Berger, and N. Skou, ‘‘The NAFE’05/CoSMOS Data Set: Toward SMOS Soil Moisture Retrieval, Downscaling, and Assimilation,’’ IEEE Trans. Geosci Remote Sens., vol. 46, no. 3, pp. 736 – 745, 2008.
[10] M. Zribi, M. Pardé, J. Boutin, P. Fanise, D. Hauser, M. Dechambre, K. Kerr, M. Leduc-Leballeur, G. Reverdin, N. Skou, Sten Søbjærg, C. Albergel, J.-C. Calvet, J.-P. Wigneron, E. Lopez-Baeza, A. Rius, and J. Tenerelli, ‘‘CAROLS: A New Airborne L-Band Radiometer for Ocean Surface and Land Observations,’’ Sensors 2011, vol. 11, pp. 719-742; doi:10.3390/s110100719, 2011.
[11] http://earth.eo.esa.int/workshops/SVRT_Workshop/ [12] http://pages.usherbrooke.ca/canexsm10/ [13] http://pages.usherbrooke.ca/canexsm10/Experimental_plan_CANEx-
SM10.pdf [14] I. Gherboudj, R. Magagi, K. Goïta, A. A. Berg, B. Toth, and A. Walker,
‘‘Validation of SMOS data over agricultural and boreal forest areas in Canada,’’ This issue.
[15] http://berms.ccrp.ec.gc.ca/Sites/e-sites.htm [16] Steven Water Monitoring System Inc, ‘‘Comprehensive Steven hydra
Probe Users Manual,’’ 92915, 2007. [17] C. Champagne, A. A. Berg, J. Belanger, H. McNairn, and R. deJeu,
‘‘Evaluation of Soil Moisture Derived from Passive Microwave Remote Sensing Over Agricultural Sites in Canada Using Ground-based Soil Moisture Monitoring Networks,’’ International Journal of Remote Sensing, 31(14), pp. 3669-3690, 2010.
[18] M. Trudel, F. Charbonneau, F. Avendano, and R. Leconte, ‘‘Quick Profiler (QuiP): a friendly tool to extract roughness statistical parameters using a needle profiler,’’ Can. J. Remote Sensing, vol. 36, no. 4, pp. 391–396, 2010.
[19] http://uavsar.jpl.nasa.gov/ [20] J. Famiglietti, D. Ryu., A. A. Berg, M. Rodell, and T. J. Jackson, ‘‘Field
Observations of Soil Moisture Variability Across Scales,’’ Water Resources Research., 44, W01423, doi:10.1029/2006WR005804, 2008.
[21] I. Mladenova, Personnal communication, 2010. [22] N. Skou, S. Misra, J. Balling, S. Kristensen, and S. Søbjærg, ‘‘L-band
RFI as experienced during airborne campaigns in preparation for SMOS,’’ IEEE Trans. Geosci. Remote Sens., vol. 48, pt. 2, no. 3, pp. 1398–1407, 2010.
[23] M. Pardé, M. Zribi, P. Fanise, and M. Dechambre, ‘‘Analysis of RFI Issue Using the CAROLS L-Band Experiment,’’ IEEE Trans. Geosci Remote Sens., vol. 49, no. 3, pp. 1063-1070, 2011.
[24] F. T. Ulaby, R. K. Moore, and A. K. Fung, ‘‘Microwave Remote Sensing,’’ Volume 3, Dedham, MA : Artech House, 1986.
[25] M. Guglielmetti, M. Schwank, C. Mätzler, C. Oberdörster, J. Vanderborght, and H. Flühler, ‘‘FOSMEX: Forest soil moisture experiments with microwave radiometry,’’ IEEE Trans. Geosci Remote Sens., vol. 46, pp. 727–735, 2008.
[26] J. P. Grant, A. A. Van de Griend, J.-P. Wigneron, K. Saleh, R. Panciera, and J. P. Walker, ‘‘On the Influence of Forest Cover Fraction on L-band Soil Moisture Retrievals from Heterogeneous Pixels using Multi-Angular Observations,’’ Remote Sensing Environ., vol. 114, no. 5, pp. 1026-1037, 2010.
[27] J. P. Grant, J.-P. Wigneron, A. A. Van de Griend, A.Kruszewsky, S. Schmidl Søbjærg, and N. Skou, ‘‘A field experiment on microwave forest radiometry: L-band signal behaviour for varying conditions of surface wetness,” Remote Sens. Environ., vol. 109, pp. 10–19, 2007.
[28] http://www.climat.meteo.gc.ca/ [29] E. G. Njoku, ‘‘AMSR-E/Aqua daily L3 surface soil moisture,
interpretive parameters, & QC EASE-Grids V002, 2002–2009. Digital Media,’’
[30] T. J. Jackson, ‘‘Soil Moisture Validation with U.S. Networks, ‘‘ Personal communication presented to the SMOS VRT workshop, Frascati, Italy, November 29-30, 2010.