Embed Size (px)
Citation preview

June 2, 2016

2
19.4
76.9
7.4
103.8
20.7
82.8
7.3
110.9
Fishing Salmon Other Seafood TOTAL
Revenues: Jan – Mar
All figures in millions of dollars
+7%
-1%
2015 2016
+8%
+7%

3
Results Jan – Mar
EBITDA (before Fair Value)
Profit/Loss
2015 2016
-7.0
4.3
-0.3
-3.0 -3.6
1.4
-0.5
-2.7
Fishing Salmon Other Seafood TOTAL
-4.3
8.2
0.3
4.1
-1.2
-6.0
-0.2
-7.3
Fishing Salmon Other Seafood TOTAL
4
25.5
53.0 60.0
66.1 58.7
45.1 47.1
21.6
10.1
459
483 485
496 489
453
462
439 446
Q1 2014 Q2 2014 Q3 2014 Q4 2014 Q1 2015 Q2 2015 Q3 2015 Q4 2015 Q1 2016
EBITDA Revenues
Development: Last 4 mobile quarters
10.0%
5.6%
11.0%
12.4% 13.3%
X% EBITDA/Revenues
12.0%
10.2%
4.9%
2.3%

5
20
1
27
21 18
22
2015 2016 2015 2016 E 2015 2016 2015 2016
Q1 Q2 Q3 Q4
Anchovy: No catches due to impact of El Niño.
Pelagic Fishing
Thousands of tons
87
95
2015 2016 E
Year
Anchovy catches include own and third parties. Company’s estimations are based on current information, which could change due to deviations

6
73
45
42
44
2015 2016 E
Year
19 22 29
7 2
23
4
23
31
19
8
2015 2016 2015 2016 E 2015 2016 2015 2016
Q1 Q2 Q3 Q4
J. Macker.: Favorable fishing conditions (56% of the annual quota catched in 1Q 2016). Sardine: Higher catches vs Q1 2015, but low presence in the 8th region (third parties).
Pelagic Fishing
Jack Mackerel
Sardine
Thousands of tons
89
115
Sardine catches include own and third parties. Company’s estimations are based on current information, which could change due to deviations

7
Fishmeal Price
1,605 1,763 1,780
1,813 1,803
1,532
1,398 1,492
1,567
1,850
2,013
2,247
1,844
1,613
1,760
1,570
Q1 2013 Q2 2013 Q3 2013 Q4 2013 Q1 2014 Q2 2014 Q3 2014 Q4 2014 Q1 2015 Q2 2015 Q3 2015 Q4 2015 Q1 2016
Prices hit a peak in Q1 2015, and fell after normalization of the Peruvian quotas. Current prices show recovery due to the effects of El Niño and expectations of lower quota for Peru (under 2 M ton). US$ / ton (Camanchaca)
1,825
Prime Fishmeal Price (Chile) IFFO Week 20 2016
May to Jul: 2.5 MM Ton (68% catched)
Nov to Jan: 2.5 M Ton
May to Jul: 2 M Ton
Nov to Jan: No quota
Peru’s Fishing Quota (North-Centre Region):
Nov to Jan: 1.1 M Ton (99% catched)
May to Jul: 2.6 MM Ton (98% catched)

8
China: port off-takes and stocks
Stocks in China bellow the average and higher port off-takes to final consumers
Source: IFFO

9
March 31, 2016 December 31, 2015 March 31, 2015
VOLUME Months of
Production ThUS$ VOLUME ThUS$ ThUS$
SALMON
Atlantic Salmon (Tons) 4,864 2.2 34,089 7,458 42,198 32,940
Salmon Total 34,089 42,198 32,940
FISHING
Fishmeal (Tons) 7,873 1.8 8,136 5,793 6,937 12,454
Fish oil (Tons) 1,987 1.9 2,314 846 1,896 1,534
Frozen Jack Mackerel (Tons) 378 0.3 222 1,185 694 14
Canned Fish (thousands of boxes) 632 8.0 6,373 43 664 2,100
Langostino Lobster (Tons) 85 1.1 1,308 225 2,824 3,880
Fishing Total 18,353 13,015 19,982
OTHER SEAFOOD
Mussels (Tons) 2,521 3.5 5,337 2,280 5,304 3,884
Abalone (Tons) 82 4.6 1,855 86 1,969 3,711
Scallops (Tons) 19 1.0 147 19 157 857
Other Seaafood Total (Tons) 7,339 7,430 8,452
COMPANY TOTAL 59,781 62,643 61,374
Stocks (valued at cost)
Rise in canned fish due to productive focus and decrease in salmon due to higher sales with less production
10
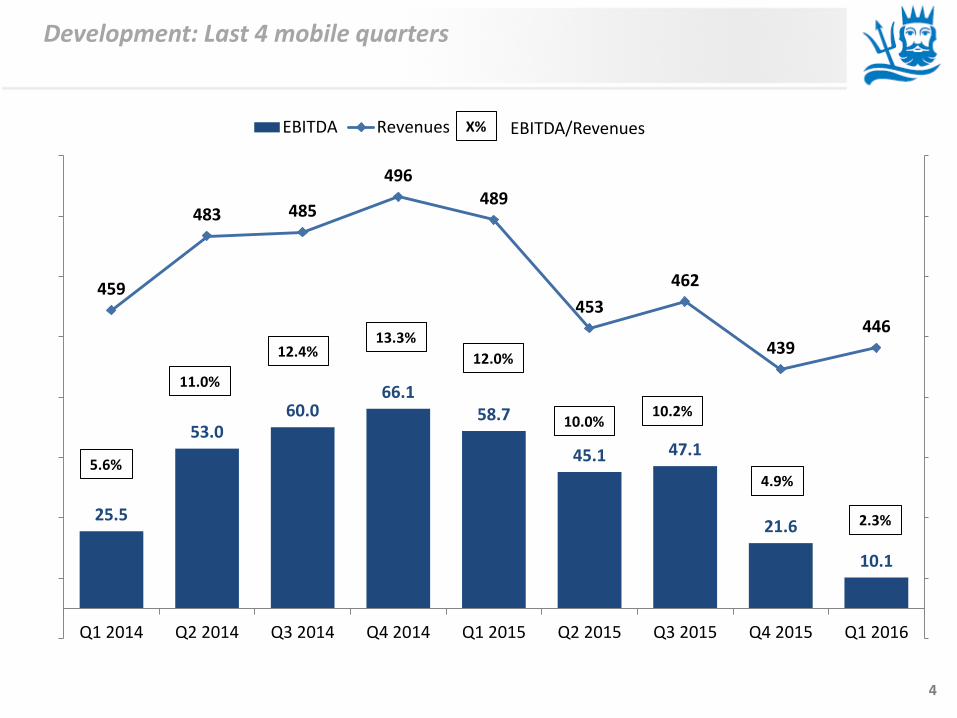
Algae Bloom in Chile: Feb-Mar 2016
• Industry impact: neighborhoods 1, 2, 3, 6, 7 and 10 (10th region) • Mortality of ~25 million fish • 45 sites affected
• Estimated impacts for Camanchaca: • 93% mortality in 3 sites (~2.7 million fish) • Estimated Direct Impact after insurances: US$ 5 – 7 million
• Camanchaca adjustments due to lower activity:
Company’s estimations are based on current information, which could change due to deviations
2015 2016 E
Hatcheries Units 5 3
Harvests Th Ton WFE 43 30
Fresh water sites Units 19 16
Harvested sea sites Units 11 7
Salmon staff 2015 3T 2016 E
Puerto Montt (Harvest) 546 363
Tomé (value added plant) 988 520
TOTAL 1,534 883
11
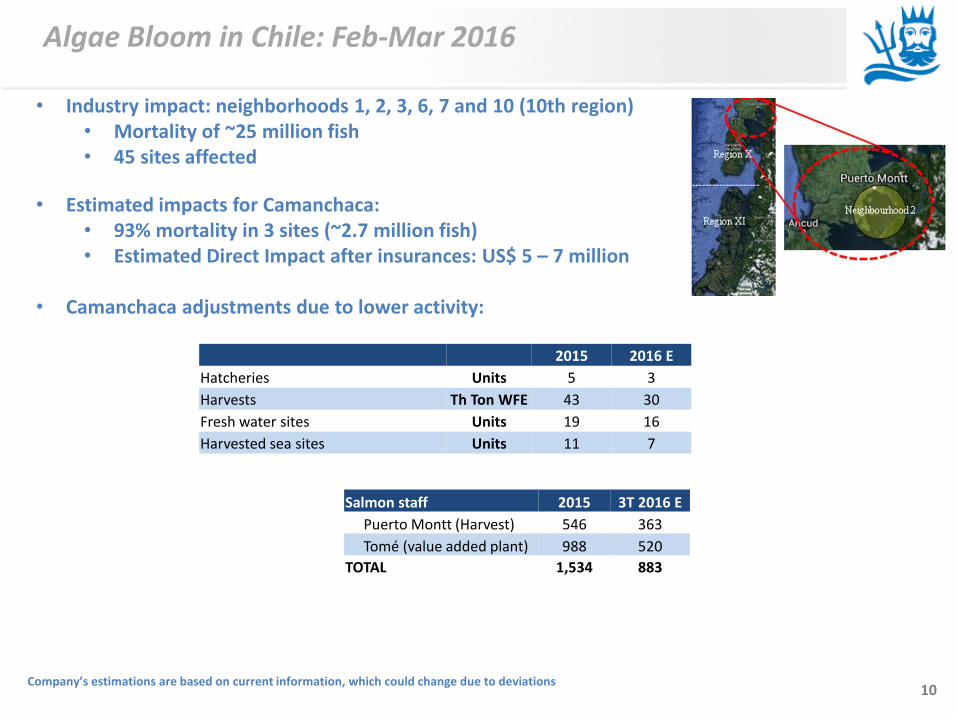
Mortality
Economic Feed Conversion Rate
2015 2016
Atlantic Salmon Sanitary Conditions (closed cycle)
15%
40% 8.7%
64.3%
5.4% 20.0% 14.2% 12.9% 10.9%
43.0%
Q1 Q2 Q3 Q4 Year
1.40
-
1.80 1.35
2.88
1.30 1.60 1.36 1.35 1.35 1.90
Q1 Q2 Q3 Q4 Year
Company’s estimations are based on current information, which could change due to deviations

12
Cost reduction
Atlantic Salmon - Cost ex-cage liveweight (US$ / kg)
3.41 3.01
Impacts in Q4-15 and Q1-16 due to SRS and lower oxygen in the 10th region since October 2015.
3.72 3.81
3.35 3.07 2.95 2.92 3.02 3.08
3.66
Q1 2014 Q2 2014 Q3 2014 Q4 2014 Q1 2015 Q2 2015 Q3 2015 Q4 2015 Q1 2016
Others
Medicine
Labor
Smolt
OPEX
Feed

13
43
30
4.4
5.2
E
Year
11.6 9.1
4.9 6.5
11.2
15.6
4.8
4.2 4.5
5.5
4.4 4.1
E
Q1 Q2 Q3 Q4
Atlantic Salmon Price
Prices upwards due to decreasing global supply. 2016 lower harvests due to algae bloom.
Company’s estimations are based on current information, which could change due to deviations
Δ-12%
Δ+22% Δ+18%
2015 2016
Harvest (Thousands of Tons) Price (US$ / Kg WFE)

14
2.0
2.5
3.0
3.5
4.0
4.5
5.0
5.5
6.0
jan
-04
jul-
04
jan
-05
jul-
05
jan
-06
jul-
06
jan
-07
jul-
07
jan
-08
jul-
08
jan
-09
jul-
09
jan
-10
jul-
10
jan
-11
jul-
11
jan
-12
jul-
12
jan
-13
jul-
13
jan
-14
jul-
14
jan
-15
jul-
15
jan
-16
Atlantic Salmon Price: Long-term trend
Urner Barry Equivalent Trim C 2-3 *- US$/Lb
Market prices on its trend line due to falling global supply. Effect on Camanchaca’s prices: starting from the 2nd quarter.
may
-16
* Equivalent Trim C

15
Hike in price
Prices every week: Chilean salmon (UB trim D 3-4 lb)
Source: ABG Sundal Collier (05/16/2016)
UB price hike to levels of US$ 5.95 /lb

16
Camanchaca’s Atlantic Salmon RMP
Camanchaca vs Market (Salmonex, January 2013 = Base 100)
March 2016: Camanchaca prices below UBarry and Salmonex indexes (-86 and -55 cents respectively) due to sharp rise in the spot price. Q1 2016: Tie with Salmonex and 8 cents below UBarry.
60
80
100
120
140
160
180
ene-
13
abr-
13
jul-
13
oct
-13
ene-
14
abr-
14
jul-
14
oct
-14
ene-
15
abr-
15
jul-
15
oct
-15
ene-
16
abr-
16
Urner Barry Salmonex Camanchaca

17
Price GAP 2016 By Country
Average price per Lb - Miami - Fillet Trim D 2-4 (Norway Price = Base 100)
63
83
0
20
40
60
80
100
120
Jan Feb Mar Apr May
Chile Norway Canada
Price GAP reduction in the last 5 months

18
70
90
110
130
150
170
190
210
Jan
-13
Ap
r-1
3
Jul-
13
Oct
-13
Jan
-14
Ap
r-1
4
Jul-
14
Oct
-14
Jan
-15
Ap
r-1
5
Jul-
15
Oct
-15
Jan
-16
Ap
r-1
6
Raw Material Cost and RMP (Raw Material Return) Base 100 = RMP January 2013
RM cost before processing RMP
Negative margin in Q1 2016, but reversed in April
10th region sites 11th region sites
Development of Atlantic Salmon Margins
Porcelana
Benjamín
Tahuenahuec
Izaza Cabudahue
Fiordo Largo
Pilpilehue
Ahoní
Loncochalgua
Leptepu
Cahuelmó
Lamalec
Licha Puelche
Contao
Mañihueico
Islotes
Edwards
Izaza
|F.Largo|
|-------P.Arg.------|
|---Cabudahue---|
|--Pilpilehue--|
|-----Ahoní-----|
Leptepu
Cahuelmó
Porc. Loncoch.
|-Marilmó-|
|-Forsyth-|
Johnson 2
Company’s estimations are based on current information, which could change due to deviations
Jun
-16

19
Development of Atlantic Salmon Margins
0.64 -0.10
0.87
-0.72 -0.8
-0.6
-0.4
-0.2
0.0
0.2
0.4
0.6
0.8
1.0
Q1 2014 Q2 2014 Q3 2014 Q4 2014 Q1 2015 Q2 2015 Q3 2015 Q4 2015 Q1 2016
EBIT (US$/Kg WFE) before Fair Value
Atlantic Salmon Business includes other Revenues and Costs due to services and sales to third parties, and intercompany salmon sales to our offices abroad.

20
Benchmarking Jan – Mar 2016 Salmon Producers with Public Information
Revenues x Gross Margin (before FV)
Gross Margin (before FV) / Revenues
E1 E2
E3
E4
E5
E6
Camanchaca
-20%
-18%
-16%
-14%
-12%
-10%
-8%
-6%
-4%
-2%
0%
-16 -14 -12 -10 -8 -6 -4 -2 0
21
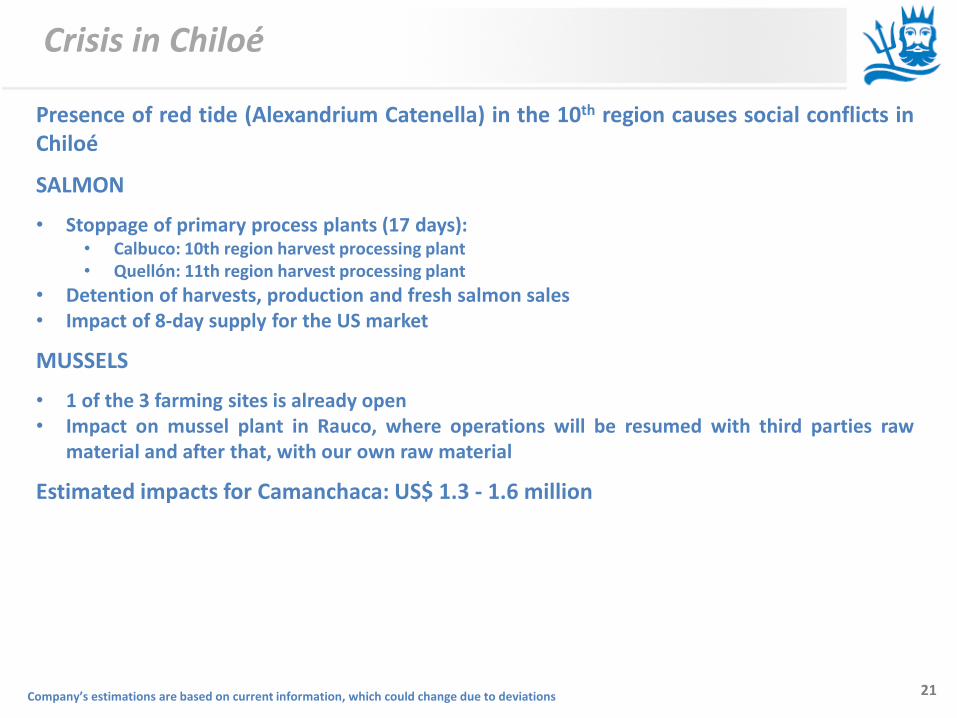
Crisis in Chiloé
Presence of red tide (Alexandrium Catenella) in the 10th region causes social conflicts in Chiloé
SALMON
• Stoppage of primary process plants (17 days): • Calbuco: 10th region harvest processing plant • Quellón: 11th region harvest processing plant
• Detention of harvests, production and fresh salmon sales • Impact of 8-day supply for the US market
MUSSELS
• 1 of the 3 farming sites is already open • Impact on mussel plant in Rauco, where operations will be resumed with third parties raw
material and after that, with our own raw material
Estimated impacts for Camanchaca: US$ 1.3 - 1.6 million
Company’s estimations are based on current information, which could change due to deviations

22
0.35 0.35
0.54
0.30
0.54
0.40
0.49 0.43
0.50
0.40
Q1 Q2 Q3 Q4 Year
2015 2016
Q1 2016: A constant volume, fuel savings of US$ 1.1 million.
Diesel Price: favorable effects on costs US$/lt
-44%
Company’s estimations are based on current information, which could change due to deviations
23
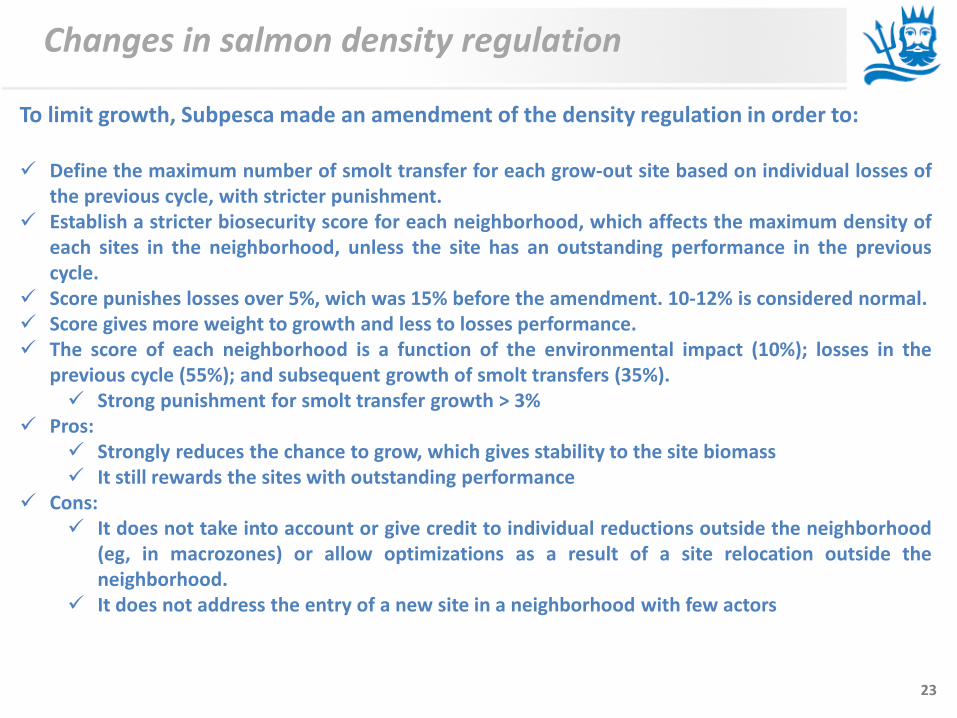
Changes in salmon density regulation
To limit growth, Subpesca made an amendment of the density regulation in order to: Define the maximum number of smolt transfer for each grow-out site based on individual losses of
the previous cycle, with stricter punishment. Establish a stricter biosecurity score for each neighborhood, which affects the maximum density of
each sites in the neighborhood, unless the site has an outstanding performance in the previous cycle.
Score punishes losses over 5%, wich was 15% before the amendment. 10-12% is considered normal. Score gives more weight to growth and less to losses performance. The score of each neighborhood is a function of the environmental impact (10%); losses in the
previous cycle (55%); and subsequent growth of smolt transfers (35%). Strong punishment for smolt transfer growth > 3%
Pros: Strongly reduces the chance to grow, which gives stability to the site biomass It still rewards the sites with outstanding performance
Cons: It does not take into account or give credit to individual reductions outside the neighborhood
(eg, in macrozones) or allow optimizations as a result of a site relocation outside the neighborhood.
It does not address the entry of a new site in a neighborhood with few actors
24
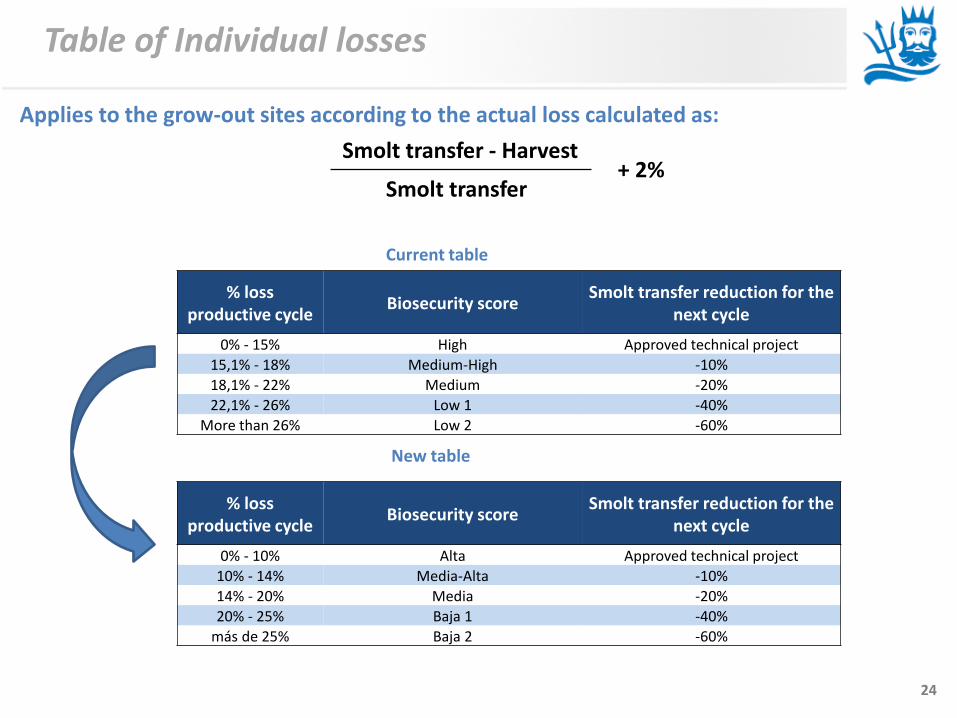
Table of Individual losses
Applies to the grow-out sites according to the actual loss calculated as:
% loss productive cycle
Biosecurity score Smolt transfer reduction for the
next cycle
0% - 15% High Approved technical project
15,1% - 18% Medium-High -10%
18,1% - 22% Medium -20%
22,1% - 26% Low 1 -40%
More than 26% Low 2 -60%
% loss productive cycle
Biosecurity score Smolt transfer reduction for the
next cycle
0% - 10% Alta Approved technical project
10% - 14% Media-Alta -10%
14% - 20% Media -20%
20% - 25% Baja 1 -40%
más de 25% Baja 2 -60%
Current table
New table
Smolt transfer + 2%
Smolt transfer - Harvest

25
Neighborhood score
Environmental element: unchanged
Environmental impact (INFA) % of sites operating with a positive last INFA
Score Weighing
75,1% - 100% 100
10% 50,1% - 75% 75
25,1% - 50% 50
0% - 25% 25
Change in sanitary element
Losses Score Weighing
0% - 15% 100
65% 15,1% - 17% 75
17,1% - 20% 50
More than 20% 25
Losses Score Weighing
0% - 5% 100
55%
5% - 15% 75
15% - 17% 50
17% - 20% 25
More than 20% 0
Current table
New table

26
Neighborhood score
Change in productive element
Smolt transfer projections (relative to the previous period)
Score Weighing
0 - 100% 100
25% 100,1 - 110% 75
110,1 - 120% 50
More than 120% 25
Smolt transfer projections (relative to the previous period)
Score Weighing
0% - 60% 200
35%
60% - 80% 150
80% - 100% 100
100% - 103% 50
103% - 110% 0
More than 110% -100
Current table
New table

27
Neighborhood score
Change in density table
Current table
New table
Total biosecurity score
Biosecurity Level
Maximum Salar density (kg/m3)
Individual site biosecurity
Maximum Salar density (kg/m3)
85,1 - 100 High 17 - 17
64,1 - 85 Medium 15 High (losses < 13%) 17
43,1 - 64 Low 1 13 High (losses < 13%) 15
0 - 43 Low 2 11 High (losses < 13%) 15
Total biosecurity score
Biosecurity Level
Maximum Salar density (kg/m3)
Individual site biosecurity
Maximum Salar density (kg/m3)
79 - 100 High 17 - 17
69 - 79 Medium 15 High (losses < 13%) 17
59 - 69 Low 1 13 High (losses < 13%) 15
42 - 59 Low 2 11 High (losses < 13%) 13
Less than 42 Low 3 8 High (losses < 13%) 11
28
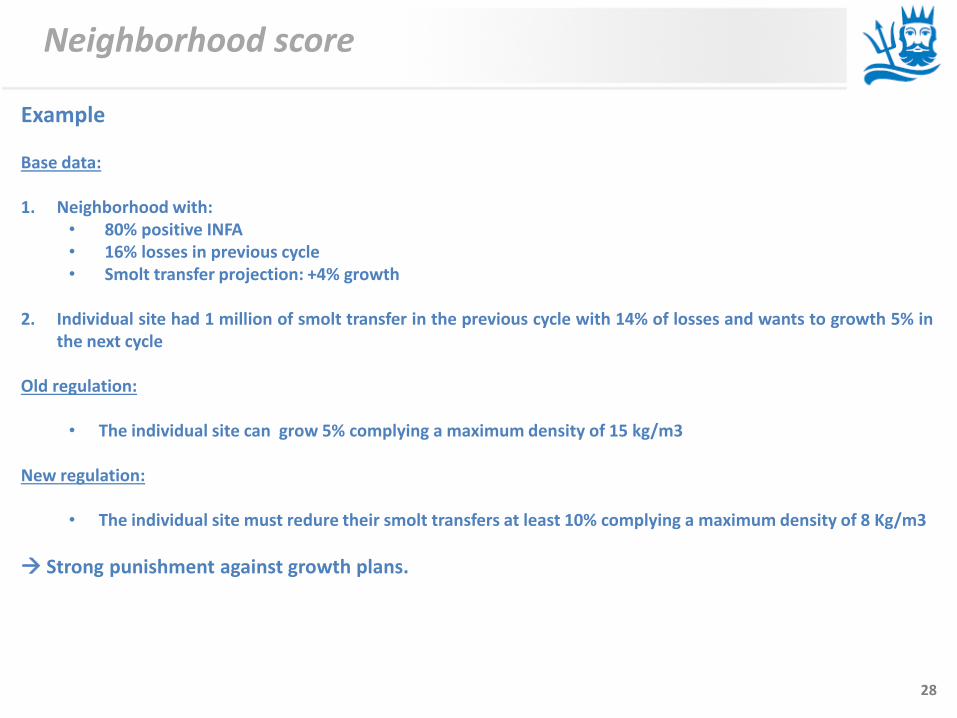
Neighborhood score
Example Base data: 1. Neighborhood with:
• 80% positive INFA • 16% losses in previous cycle • Smolt transfer projection: +4% growth
2. Individual site had 1 million of smolt transfer in the previous cycle with 14% of losses and wants to growth 5% in
the next cycle
Old regulation:
• The individual site can grow 5% complying a maximum density of 15 kg/m3
New regulation:
• The individual site must redure their smolt transfers at least 10% complying a maximum density of 8 Kg/m3
Strong punishment against growth plans.
29
Debt payment on May 25
Refinanced debt in May 2013: US$ 234 million On May 25, 2016: a payment of US$ 15.6 million is made:
Amortization quota: US$ 8.5 million Cash Sweep (Southern fishing): US$ 4.5 million Interests: US$ 2.6 million
Debt balance after payment: US$ 196 million


![Announces Q1 results [Result]](https://img.dokumen.tips/doc/110x75/577cb4121a28aba7118c4992/announces-q1-results-result.jpg)