Embed Size (px)
Citation preview

Calorimetry and scanning thermal measurements
R W McCallumAmes Laboratory
And
Materials Science and Engineering

Types of thermal analysis
• Semi Adiabatic Specific Heat• DTA differential thermal analysis (rt to 1650 C)• DSC Differential Scanning Calorimetry (rt to 750 C)• Heat flux DSC (rt to 1650 C), (-150 to 900 C)• TGA thermal gravimetric analysis (rt – 1500 C)• STA simultaneous thermal analysis (rt – 1500 C)• TMA
– thermo mechanical analysis– Thermo magnetic analysis
• Dilatometry ( thermal expansion ) – (rt to 1650 C), (-150 to 900 C)

Calorimetry
• the science of measuring the heat of chemical reactions or physical changes
– Note: heat not temperature
• Founded by Joseph Black (1728-1799)
– Discovered latent heat
– Specific heat
– Carbon dioxide
– Knife edge balanceWikipedia

Calorie
• The gram calorie, small calorie or calorie (cal) is the amount of energy required to raise the temperature of one gram of water by 1 °C at standard atmospheric pressure– 15 °C calorie (cal15) 14.5 °C to 15.5 °C 4.1852 J to 4.1858 J. – 20 °C 19.5 °C to 20.5 °C 4.182 J. – 4 °C 3.5 °C to 4.5 °C 4.204 J.– Mean calorie 1⁄100 0 °C to 100 °C about 4.190 J – International Steam Table Calorie (1956) (calIT) 1.163 mW·h =
4.1868 J exactly. – IUNS calorie 4.182 J exactly. This is a ratio adopted by the
Committee on Nomenclature of the International Union of Nutritional Sciences.[
• Thermochemical calorie (calth) 4.184 J exactly.
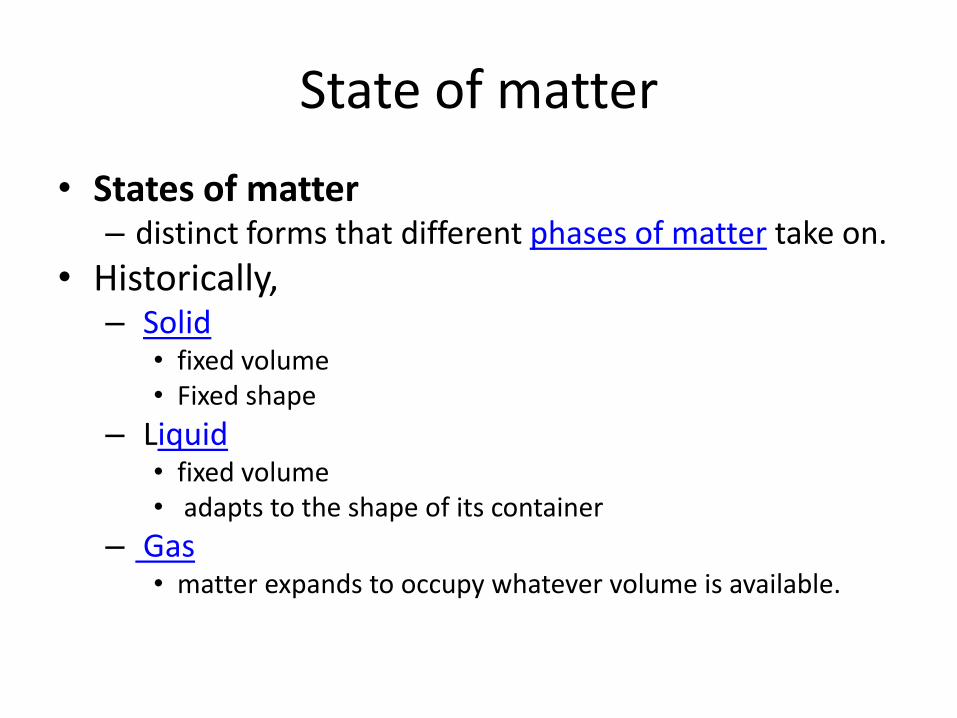
State of matter
• States of matter– distinct forms that different phases of matter take on.
• Historically,– Solid
• fixed volume• Fixed shape
– Liquid• fixed volume • adapts to the shape of its container
– Gas• matter expands to occupy whatever volume is available.

Water
-50
0
50
100
150
0 10 20 30 40 50 60
Tem
pe
ratu
re (
C)
Time (min)
1 kg ice uniformly heated
with 1kW from -40 C to
140 C
boiling
melting

Specific Heat vs Heat Capacity
• Specific Heat
– measure of the heat energy required to increase the temperature of a unit quantity of a substance by a unit degree
• Heat Capacity
– measure of the heat energy required to increase the temperature of a sample by a unit degree

Water
• Specific heat capacity water - 4.187 kJ/kgK
• Specific heat capacity ice - 2.108 kJ/kgK
• Specific heat capacity water vapor - 1.996 kJ/kgK

Water
-50
0
50
100
150
0 10 20 30 40 50 60
Tem
pe
ratu
re (
C)
Time (min)
1 kg ice uniformly heated
with 1kW from -40 C to
140 C
boiling
melting

Latent Heat
• latent heat
– amount of energy released or absorbed by a chemical substance during a change of state that occurs without changing its temperature,
– The term was introduced around 1750 by Joseph Black as derived from the Latin latere, to lie hidden

Water
-50
0
50
100
150
0 10 20 30 40 50 60
Tem
pe
ratu
re (
C)
Time (min)
1 kg ice uniformly heated
with 1kW from -40 C to
140 C
boiling
melting

Water
• Specific heat capacity water - 4.187 kJ/kgK
• Specific heat capacity ice - 2.108 kJ/kgK
• Specific heat capacity water vapor - 1.996 kJ/kgK
• Latent heat of melting - 334 kJ/kg
• Latent heat of evaporation - 2,270 kJ/kg

Water
• Specific heat capacity water - 4.187 kJ/kgK
• Specific heat capacity ice - 2.108 kJ/kgK
• Specific heat capacity water vapor - 1.996 kJ/kgK
• Latent heat of melting - 334 kJ/kg
• Latent heat of evaporation - 2,270 kJ/kg
• Thermal conductivity of ice 2.22 W/mK
– (200 times less than Cu)

Water
-50
0
50
100
150
0 10 20 30 40 50 60
Tem
pe
ratu
re (
C)
Time (min)
1 kg ice uniformly heated
with 1kW from -40 C to
140 C
melting
boiling

Effect of thermal conductivity
-50
0
50
100
150
0 10 20 30 40 50 60
Tem
pe
ratu
re (
C)
Time (min)
1 kg ice heated with 1kW from outside from
-40 C to 140 C

entropy
• measure of the randomness of molecules in a system
– and is central to the second law of thermodynamics
• thermodynamics entropy, (symbolized by S)
– is a measure of the unavailability of a system’s energyto do work
• statistical mechanics
– entropy describes the number of the possible microscopic configurations of the system

Enthalpy (H)
• a quotient or description of thermodynamic potential of a system, which can be used to calculate the "useful" work obtainable from a closed thermodynamic system under constant pressure and entropy
• H E+pV– Where E = internal energy
– p is pressure
– V is volume

Specific enthalpy
• h = H / m
– where m is the mass of the system.
• The SI unit for specific enthalpy is joules per kilogram.

Heats of reactionenthalpy
• The total enthalpy of a system cannot be measured directly; the enthalpy change of a system is measured instead.
• Enthalpy change is defined by the following equation:ΔH = Hfinal - Hinitial
• where– ΔH is the enthalpy change– Hfinal is the final enthalpy of the system, measured in
joules. • In a chemical reaction, Hfinal is the enthalpy of the products.
– Hinitial is the initial enthalpy of the system, measured in joules. • In a chemical reaction, Hinitial is the enthalpy of the reactants.

Physical Properties
• Standard enthalpy change of solution– “the enthalpy change observed in a constituent of a thermodynamic system,
when one mole of an solute is dissolved completely in an excess of solvent under standard conditions. ”
• Standard enthalpy change of fusion– “the enthalpy change required to completely change the state of one mole of
substance between solid and liquid states under standard conditions. ”
• Standard enthalpy change of vapourization– “the enthalpy change required to completely change the state of one mole of
substance between liquid and gaseous states under standard conditions. ”
• Standard enthalpy change of sublimation– “the enthalpy change required to completely change the state of one mole of
substance between solid and gaseous states under standard conditions. ”
• Lattice enthalpy– “the enthalpy required to separate one mole of an ionic compound into
separated gaseous ions to an infinite distance apart (meaning no force of attraction) under standard conditions.

exothermic reaction
• For an exothermic reaction at constant pressure, the system's change in enthalpy is equal to the energy released in the reaction, including the energy retained in the system and lost through expansion against its surroundings.
• if ΔH is negative, the reaction is exothermic

Endothermic reaction
• for an endothermic reaction, the system's change in enthalpy is equal to the energy absorbed in the reaction, including the energy lost by the system and gained from compression from its surroundings
• If ΔH is positive, the reaction is endothermic

ice-calorimeterThe world’s first ice-calorimeter, used in the winter of 1782-83, by Antoine Lavoisier and Pierre-Simon Laplace, to determine the heatevolved in various chemical changes; calculations which were based on Joseph Black’s prior discovery of latent heat. These experiments mark the foundation of thermochemistry.
Wikipedia
Apparatus to gage heat released during the melting of a compound by measuring the increase in volume of the surrounding ice-water solution caused by the melting of the ice. Also known as ice calorimeterDensity of water at 0 C .9998 g/cm3Density of ice at 0 C .9167 g/cm3

Measurement
Sample
Thermometer
Heater

0
500
1000
1500
2000
2500
3000
3500Te
mp
era
ture
(t i
n
C )
Time (T)
Gas
Liquid
Fe
Fe
Fe
Fe
Constant Power (P)
Cp (solid)=P( T/ t)
Cp(gas)=P( T/ t)
Cp(liquid)=P( T/ t)
h =P T
h =P T
hsl=P T
hlg=P T

Measurement• Unaccounted for heat
flow– Convection– Conduction
• Heater wires• Thermometer wires• Support structure
– Radiation
• Unaccounted for heat capacity– Heater– Heater wires– Thermometer– Thermometer wires– Support structure
Sample
Thermometer
Heater

Semi adiabatic
Sample
Thermometer
Heater
Isothermal shield

Differential Calorimeterequal power both heaters
Reference Sample
Thermometer
Heater
Isothermal shield
Sample
Thermometer
Heater

0
500
1000
1500
2000
2500
3000
3500Te
mp
era
ture
(C
)
Time
Gas
Liquid
Fe
Fe
Fe
Reference
Fe
T
Constant Power

Differential Calorimeterheater power adjusted for equal temperature both samples
Reference Sample
Thermometer
Heater
Isothermal shield
Sample
Thermometer
Heater

DSC
100
150
200
250
300
350
400
450
500
0
500
1000
1500
2000
2500
3000
3500
Tem
pe
ratu
re (
C )
Time
Gas
Liquid
Fe
Fe
Fe
Reference
Fe
Reference Constant PowerSample Power Varaible

Differential Thermal Analysis
Reference Sample
Thermometer
Furnace
Sample
Thermometer

Netzsch DSC 404 C Pegasus®

Differential Heat Flux Calorimeter
Reference Sample
Thermometer
Furnace
Sample
Thermometer
Calibrated link

500
700
900
1100
1300
1500
0 20 40 60 80 100
Tem
pera
ture
Hypothetical Phase Diagrams
35% 45%60% 75% 80%
liquidliquid
liquid
liquidliquid

550 650 750 850 950 1050
Temperature (C)
80%Initial Melting
Nonequilibrium Solidification
Nonequilibrium Melting
500
700
900
1100
1300
1500
0 20 40 60 80 100
Tem
pera
ture
Hypothetical Phase Diagrams
35% 45%60% 75% 80%
liquidliquid
liquid
liquidliquid

550 650 750 850 950 1050
75%initial
500
700
900
1100
1300
1500
0 20 40 60 80 100
Tem
pera
ture
Hypothetical Phase Diagrams
35% 45%60% 75% 80%
liquidliquid
liquid
liquidliquid

550 650 750 850 950 1050
de
lta
T
60%
initial
500
700
900
1100
1300
1500
0 20 40 60 80 100
Tem
pera
ture
Hypothetical Phase Diagrams
35% 45%60% 75% 80%
liquidliquid
liquid
liquidliquid

550 650 750 850 950 1050
45%
initial
500
700
900
1100
1300
1500
0 20 40 60 80 100
Tem
pera
ture
Hypothetical Phase Diagrams
35% 45%60% 75% 80%
liquidliquid
liquid
liquidliquid

550 650 750 850 950 1050
35%initial
500
700
900
1100
1300
1500
0 20 40 60 80 100
Tem
pera
ture
Hypothetical Phase Diagrams
35% 45%60% 75% 80%
liquidliquid
liquid
liquidliquid

Phase transition
From Wikipedia,

Phase Transition
• At phase-transition point – the two phases have
identical free energies
– equally likely to exist.
• Below the phase-transition point – Low temperature
phase is more stable state of the two.
• Above the phase-transition point – High temperature
phase is more stable state of the two.
Fre
e E
ne
rgy
Temperature (K)
Low Temperature Phase
High Temperature Phase
Phase Transition
Gl El-TSl+pVl
Gh Eh-TSh+pVh
Llh=(Sh-Sl)T

Types of phase transitions
• first-order phase transitions– involve a latent heat
• system either absorbs or releases a fixed (and typically large) amount of energy.
• the temperature of the system will stay constant as heat is added or released.
– "mixed-phase regimes“• in which some parts of the system have completed the
transition and others have not. – a pot of boiling water:
» turbulent mixture of water and water vapor bubbles.

International Union of Pure and Applied Chemistry.first-order phase transitionA transition in which the molar Gibbs energies or molar Helmholtz energiesof the two phases (or chemical potentials of all components in the twophases) are equal at the transition temperature, but their first derivativeswith respect to temperature and pressure (for example, specific enthalpyof transition and specific volume) are discontinuous at the transition point,as for two dissimilar phases that coexist and that can be transformed intoone another by a change in a field variable such as pressure, temperature,magnetic or electric field.Example:The transition on heating CsCl to 752 K at which it changes from thelow-temperature, CsCl-type structure to the high-temperature NaCl-typestructure.Synonymous with discontinuous phase transition.1994, 66, 583IUPAC Compendium of Chemical Terminology 2nd Edition (1997)

second-order transitionA transition in which a crystal structure undergoes a continuous change and in which the first derivatives of the Gibbs energies (or chemical potentials) are continuous but the second derivatives with respect to temperature and pressure (i.e. heat capacity, thermal expansion, compressibility) are discontinuous. Example: The order-disorder transition in metal alloys, for example, CuZn. Synonymous with continuous transition.

Ehrenfest's classification of phase transitions
• phase transitions labeled by the lowest derivative of the free energy that is discontinuous at the transition.
• First-order phase transitions– exhibit a discontinuity in the first derivative of the free energy with a
thermodynamic variable. – solid/liquid/gas transitions are first-order transitions
• because they involve a discontinuous change in density (which is the first derivative of the free energy with respect to chemical potential.)
• Second-order phase transitions– continuous in the first derivative– exhibit discontinuity in a second derivative of the free energy.
• example, the ferromagnetic phase transition in materials such as Fe, – magnetization ( the first derivative of the free energy with the applied magnetic field
strength), increases continuously from zero as the temperature is lowered below Tc– magnetic susceptibility (the second derivative of the free energy with the field) changes
discontinuously.

NIST Recommended Practice GuideSpecial Publication 960-15
• DTA and Heat-flux DSC Measurements of Alloy Melting and Freezing– W. J. Boettinger, U. R. Kattner, K.-W. Moon
• Metallurgy Division• Materials Science and Engineering Laboratory,• National Institute of Standards and Technology
– J. H. Perepezko• Department of Materials Science and Engineering,• University of Wisconsin - Madison
– Special Publications– November 2006– U.S. Department of Commerce
Terms and definitions
• ASTM E473, "Standard Terminology Relating to Thermal Analysis," is a compilation of definitions of terms used in other ASTM documents on all thermal analysis methods including techniques besides DTA and HF-DSC.
• ASTM E1142, "Terminology Relating to Thermophysical Properties," is a compilation of definitions of terms used in other ASTM documents that involve the measurement of thermophysical properties in general.

ASTM Practice Standards
• ASTM E967, "Practice for Temperature Calibration of DSC and DTA," presents simple recipes for calibration for fixed mass and heating rate using two pure materials to obtain a linear correction for conversion of measured temperature to actual temperature. The onset temperature extracted from the melting peak is determined by the extrapolation method, see section 2.4.3. For some ♦DTA and Heat-flux DSC Measurements 5 materials the standard suggests using the peak for calibration, a method not recommended for metals.
• ASTM E968, "Standard Practice for Heat Flow Calibration of DSC," uses sapphire as heat capacity standard. The method is described in section 2.4.4.
• ASTM E2253, "Standard Method for Enthalpy Measurement Validation of Differential Scanning Calorimeters," presents a method using three small masses to determine the detection limit of DTA/DSC.
ASTM Practice Standards
• ASTM E928, "Standard Test Method for Determining Purity by DSC,” employs comparison of the shape of the melting peak of an impure sample to the shape for a high purity sample to determine the concentration of the impurity. The method uses the "1/F plot" which examines the down slope of the melting peak.
• ASTM E794, "Standard Test Method for Melting and Crystallization Temperatures by Thermal Analysis," employs the extrapolated onset determination method.
• ASTM E793, "Standard Test Method for Enthalpies of Fusion and Crystallization by DSC," uses area on signal vs. time plot for comparison to known heats of fusion of pure materials.
• ASTM E1269, "Standard Test Method for Determining Specific Heat Capacity by DSC," uses sapphire or aluminum as a standard.


![Differential scanning calorimetry [dsc]](https://img.dokumen.tips/doc/110x75/58f9b1b1760da3da068bc34a/differential-scanning-calorimetry-dsc-58f9c49a6e874.jpg)


