Embed Size (px)
Citation preview
California Transportation: Current Practices, Challenges & Opportunities
May 17, 2017
Transportation Research Board
Future Interstate Study Committee
Caltrans, District 4 – Traffic Operations S. Sean Nozzari, Deputy District Director [email protected] 510-286-6345
The National Academies of SCIENCES ENGINEERING MEDICINE

Outline
1. Background 2. Current Practices
• Transportation Management System • Incident & Emergency Management • Freeway Operations • Commercial Vehicles Operations • Pedestrians & Bicycles • Transit & Rail • California Connected Vehicle Test Bed
3. Challenges • Population, Housing, Jobs, and Transportation • Climate Change • Funding
4. Opportunities • California Senate Bill 1 (2017) • Asset Management • California Connected Corridors • Express Lanes Network • Connected/Autonomous Vehicles • Next Steps • Predictions, Anyone?
5. Questions • Appendix
2

California at a Glance
3
Highway Traffic Congestion • Annual Highway VMT: ± 330 billion,
growing at >2% per year • Three of the US Top 20 Most Congested
Urban Regions Los Angeles; San Francisco; and San Diego
• Average Daily Vehicle Hours of Delay: BIG!
• Population: 39.5 million people (>12% of the US total!) • Four of the Top 10 Most Populated Regions in US
Los Angeles/Long Beach (#1); San Francisco/Oakland (#3); Riverside/San Bernardino (#13); San Diego (#17)
• 170,000 miles of roadways • Licensed Drivers: ± 26 million • Registered Light Vehicles: ± 25 million • Registered Trucks/Delivery Vehicles: ± 6 million
Safety (all roads) • Number of Injury Crashes (2014): ± 166,000 (rising) • Number of Deaths (2015): ± 3,200 (also rising)
Demographics (2017)

Caltrans - District 4 California Department of Transportation (Caltrans)
4
Caltrans: Owner and Operator of the State Highway System
• Responsible for > 50 K lane-miles of highways Planning Design Construction Operation Maintenance
• Operates Inter-city rail services • Permits > 400 public and special use airports
and heliports • Partners with regional and local agencies
19 MPO’s 58 Counties > 500 Incorporated Cities
• 12 Districts

Caltrans - District 4 San Francisco Bay Area
5
• District 4 encompasses nine San Francisco Bay Area counties of Alameda, Contra Costa, Marin, Napa, San Francisco, San Mateo, Solano, Sonoma, and Santa Clara
• About 2,900 positions with an annual operating budget of over $460 million
• Manages about 6,500 lane miles on over 770 centerline miles of conventional highways
and 690 centerline miles of freeways, including 494 miles of managed lanes (HOV and Express Lanes)
• Owns/Operates seven toll bridges: Antioch, Benicia-Martinez, Carquinez, Richmond-San Rafael, San Mateo-Hayward, San Francisco-Oakland and Dumbarton
• 156 projects in construction for $1.56 B • FY 16/17 Contract for Delivery: 48
projects for $349 M

6
California State Highway System
Inventory Statewide District 4 Lane Miles 50,000 6,468
Bridges 12,559 2,500 Acres of Landscape 29,000 4,600
Culverts 205,000 43,059
Roadside Rest Area 87 3
Park & Ride Lots 325 46 Vista Points 146 20
Traffic Signals 6,263 1,441
Vehicle Miles of Travel, Billion Miles 148 31
2014 Collisions* Total (Fatal + Injury) 94,539(49,884) 28,110 (9,583)
2016 Congestion Delay*, Million Vehicle Hours 305 73 * TASAS and PeMS Preliminary Data, State Highways only

7
California 2016 Congestion by Caltrans Districts
(Delay at 60 MPH)
D3 - North Central 4%
D4 - Bay Area 24% D5 - Central Coast
1%
D6 - South Central 1%
D7 - LA/Ventura
43%
D8 - San Bernardino/Riversi
de 8%
D10 - Central 1%
D11 - San Diego/Imperial
8%
D12 - Orange County
10%
Source: PeMS 2016
INRIX 2016 Traffic Scorecard

San Francisco Bay Area County Period
Vehicle Hours of
Delay (VHD) Lost Time, $
(VHD x 15.7/hr) Wasted Fuel, $
(VHD x 1.719 x 2.727) Total Cost, $
Alameda Annual 24,983,000 392,233,000 117,113,000 509,346,000 Daily 68,000 1,075,000 321,000 1,395,000
Santa Clara Annual 16,843,000 264,435,000 78,955,000 343,390,000 Daily 46,000 724,000 216,000 941,000
Contra Costa Annual 10,229,000 160,595,000 47,951,000 208,546,000 Daily 28,000 440,000 131,000 571,000
San Mateo Annual 7,490,000 117,593,000 35,111,000 152,704,000 Daily 21,000 322,000 96,000 418,000
San Francisco Annual 4,820,000 75,674,000 22,595,000 98,269,000 Daily 13,000 207,000 62,000 269,000
Solano Annual 3,719,000 58,388,000 17,434,000 75,822,000 Daily 10,000 160,000 48,000 208,000
Marin Annual 2,178,000 34,195,000 10,210,000 44,405,000 Daily 6,000 94,000 28,000 122,000
Sonoma Annual 2,636,000 41,385,000 12,357,000 53,742,000 Daily 7,000 113,000 34,000 147,000
Napa Annual 93,000 1,460,000 436,000 1,896,000 Daily 250 4,000 1,000 5,000
All Annual 72,991,000 1,145,959,000 342,161,000 $ 1,488,120,000 Daily 200,000 3,140,000 937,000 $ 4,077,000
Notes: • Cost of lost time assumes: total delay x $15.70 per hour; average vehicle occupancy of 1.15; nine percent truck volume; and 4% real discount rate. • Cost of wasted fuel = wasted fuel (gallons) x $2.727 a gallon. • Wasted fuel (gallons) = total delay in VHD x 1.719 for each vehicle hour of delay. • Figures may not add up exactly due to rounding.
San Francisco Bay Area Freeway Congestion Costs, 2016
8
$1.5 B Annual
$4 M Daily

9
Transportation Management System
10
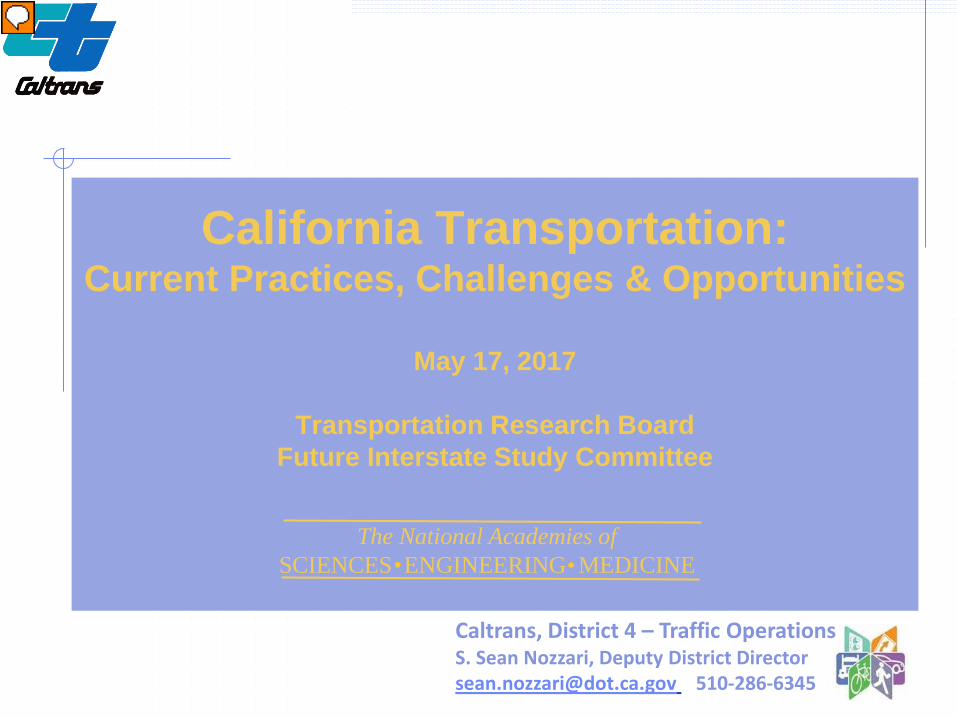
California Department of Transportation Embracing Transportation System Management & Operations
(TSMO)
• Mobility Pyramid established in early 2000’s with foundation on maintenance & system management
• Performance as the basis for investment decisions
• Updated Mission, Vision & Goals and Strategic Management Plan
• “Fix it First” (TSMO) Philosophy

California Focus Areas Transportation System Management & Operations (TSMO)
11
• Transportation Management System Build-out (TMS) Adaptive Ramp Metering
• Emergency Management System Monitoring & Performance Measurement Incident Management & Disaster Planning Traveler Information (Regional & Statewide)
• Integrated Corridor Management Integrated Freeway & Arterial Operations Transit/Rail, Pedestrians, & Bicyclists
• Operational Improvements & System Completion Express or High Occupancy/Toll Lanes Strategic Improvements
• Embrace New Technology Connected/Automated Vehicles & Infrastructure

Traffic Management Systems (TMS) for Improved Mobility
12 CCTV Cameras Detection Stations Ramp Meters
Changeable Message Signs Highway Advisory Radios
511 Traveler Information (Regional) Caltrans Quickmap (Statewide)
Planned Highway Work
Coordinated Emergency Response

California Transportation Management System
(TMS)
Notes: • CCTVs includes freeway and arterial signal cameras. • CMSs include larger informational display boards & smaller variable message signs. • EMSs include informational message signs and curve warning signs. • VDSs include freeway mainline, connectors, & on- & off-ramps.
Inventory Statewide Traffic Signals 6,263 Closed Circuit TV Cameras (CCTV) 2,821 Changeable Message Signs (CMS) 897 Highway Advisory Radio (HAR) 188
Extinguishable Message Sign (EMS) 585
Vehicle Detection Stations (VDS) 17,723
2
1 3
9
8
11
10 4
5 6
7 12
13

San Francisco Bay Area Ramp Metering (Various Stages of Development)
• As an Example, in the next two years, the existing 618 active ramp meters in the Bay Area are expected to grow by 14% to 706, and then more than double in the future as funding becomes available.
Note: The estimated cost to complete the system is +$1.1B.
14
• Ramp Metering is a key element of the TMS, and continues to grow.

15
San Francisco Bay Area TMS Performance & Health
TMS Element August 2012 April 2017
Inventory Performance Inventory Performance
Changeable Message Sign 128 69% 172 92% Closed Circuit TV Camera 353 43% 591 84% Ramp Meter 347 97% 618 94% Vehicle Detection Station 2,334 47% 3,676 74% Vehicle Sensors (Lane) 7,533 48% 10,777 71%
Notes: • Performance Target: 80% or better (90% or better by 2020) • Additional State SHOPP funds invested $19M (2013 – 2016) • System Degradation is currently at less than 4% of inventory per month. • Continued Investment:
2014 SHOPP, 3 Service Contracts($18M, 2016-2018) – Started Sept 2016. MTC I-880 Performance-based TOS Device Maintenance Contracts ($12M, 2016-21) $65.7 M SHOPP funds programmed for TMS Health (2018-25)
2016 SHOPP TOS Service Contract ($16M, 2017-2019) 2016 SHOPP Detection Repair ($30M, 2018 or later) 2018 SHOPP Asset Management Pilot ATMS Upgrade Project ($3.7M, 2020-25) 2016 SHOPP Detection Life Cycle Replacement ($16M, 2022)

16
Incident & Emergency Management

17
total “incidents” reported 4000 traffic hazard reports 165 accident reports 140
reports reviewed by Caltrans 300
reports involving Caltrans field activities 270
reports requiring action by TMC 69
CHP CAD: INCIDENTS REPORTED PER DAY
• Caltrans Communications Center and Traffic Operators
• California Highway Patrol • MTC-511 Travel Information
24/7 TMC
San Francisco Bay Area Incident Management
Caltrans/CHP Goal: Clear major highway incidents within 90 minutes or less (achieved for 75% of incidents in FY 2015/16).

18
• Emergency Operations through pre-planning & coordination among multiple agencies with defined roles & responsibilities.
• Caltrans Inter-regional, Regional, and Satellite TMCs.
• Caltrans Emergency Operations Centers (EOCs) are activated as a separate unit in response to incidents regionally impacting transportation mobility.
Caltrans TMCs & Emergency Operations Centers
WETA
United States Coast Guard
Metropolitan Transportation Commission
California Highway Patrol

19
Freeway Operations

20
Caltrans
Freeway Operations
• Many congested urban corridors commute/recreational/freight traffic Significant incident patterns Ridesharing & Transit Integration
• Widening no longer always viable. • Must use technology to make existing
transportation system more efficient.
• Integrated Corridor Management (ICM) I-80 Smart Corridor (Alameda/Contra Costa Co.)
US 101 Smart Corridor (San Mateo County) Interstate 880 ICM (Alameda County) Interstate 680 Forward (Contra Costa County) Interstate 210 ICM Pilot (Los Angeles County)
I-80 Smart
Corridor

21
San Francisco Bay Area: Integrated Corridor Management
I-80 Smart Corridor
• 20-Mile Freeway segment, fully outfitted with ITS elements: Vehicle Detection Stations Closed Circuit TV Cameras Electronic Changeable Message Signs Variable Advisory Speed Signs Information Display Board Adaptive Ramp Meters (5 a.m.- 8 p.m., including weekends) Highway Advisory Radios
• Arterial Elements Interconnected Signal Systems CCTVs at Traffic Signals Transit Signal Priority System Detectors “Trailblazer” Signs
• Results, promising! Official After-study expected in Fall 2017
Active Traffic Management Toolbox:

22
San Francisco Bay Area: Integrated Corridor Management
I-80 Smart Corridor
X
Incident
Freeway: Electronic signs on overhead gantries turn ON upstream of an incident, and immediately past.
Arterial: Trailblazer Signs turn ON and signal “flush plan” implemented along main arterial to guide traffic back to freeway
Ope
n M
erge
Bl
ocke
d O
pen
Activations: 155 WB I-80: 107 EB I-80: 46 Typ. Duration: 30’
8/25/16 to 4/1/17

23 Los
Angeles San
Francisco Sacramento San Diego San
Bernardino Stockton Orange
County
Lane
Mile
s
500
450
400
350
300
250
200
150
100
50
California High Occupancy Vehicle (HOV) Lanes
Existing: 1,515 Miles
Under Construction: 63 Miles
Proposed/Programmed: 695 Miles
Future: 2,273
24
Los Angeles
San Francisco
Sacramento San Diego San Bernardino
Stockton Orange County
Lane
Mile
s
800
700
600
500
400
300
200
100
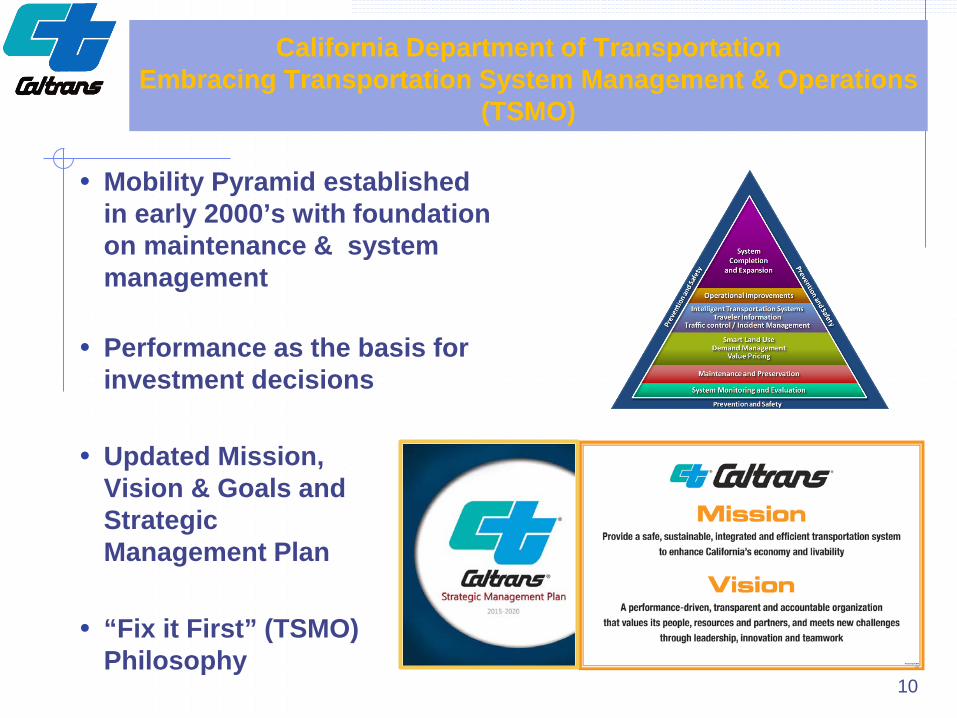
California Express (or HOV/Toll) Lanes
Existing: 250 Miles Under Construction: 58 Miles Proposed/Programmed: 1,250 Miles
Future: 1,558 Miles

Caltrans Rural Freeway Operations
• Freeway Operations in rural areas are more focused on safety and responding to changing conditions, such as: Weather (snow; chain controls) Wildfires Mud or Rock Slides Floods Major crashes, particularly involving
trucks
• Providing accurate timely, and reliable traveler information is the primary objective, in addition to efficient response to incidents.
25

26
Commercial Vehicles Operations

27
Truck Routes in California
Caltrans works with the trucking industry, California Legislature, California Highway Patrol (CHP), and the US Department of Transportation to provide a safe & efficient environment for commercial vehicle operations on California roadways.
• Truck routes are reviewed and selected based on truck volumes, absence of alternate routes, length of detour, and time savings.
• 137 Weigh-in-Motion (WIM) sites with sensors embedded in the roadway to capture and record axle weights and gross vehicle weights as vehicles drive over them a reduced or normal traffic speed. Truck axle weight data are collected for reporting, structure analysis, freight traffic modeling, highway performance monitoring, and immediate enforcement by the CHP.
• Pre-Pass uses WIM data for electronic screening & clearance system for qualifying motor carriers that meet compliance criteria, allowing trucks to bypass the adjacent CVEF.
• Bridges & overpasses along routes are being considered for strengthening or replacement based on structure age, substandard weight rating, and vertical clearance.
• 127 Commercial Vehicle Enforcement Facilities (CVEF) at major ports of entry and rural routes with high truck traffic for inspection of safety systems, size/weight compliance, and driver vehicle credentials.

28
California Connected Vehicles Test Bed

San Francisco Bay Area California Connected Vehicle Test-bed
29
• In 2005, Caltrans and MTC created the first locally funded CV Test Bed on State Route 82 (El Camino Real), in Palo Alto.
• Today, the following 11
intersections along a 2-mile long segment are equipped with DSRC radios broadcasting SPAT and MAP messages: Stanford; Cambridge; California; Page Mill; Portage/Hansen; Matadero; Curtner; Ventura; Los Robles; Maybell; Charleston
DSRC Radio DSRC
Antenna
30
Pedestrians/Bicycles

31
Pedestrians/Bicycles
• Various related guides:
Main Street, California Guide Complete Streets Policy Endorsement of the National Association of
City Transportation Officials “Urban Design Guide”, and “Urban Bikeway Design Guide”
Active Transportation Program “Yes We Can” Brochure for bicycle and
pedestrian accommodating designs that can be used on California Highway System
Statewide Bicycle and Pedestrian plan, Under development; District 4 Bike Plan to include list of prioritized projects underway
• Caltrans Changing Culture from “design standards” to “flexible or practical design”.
Pedestrians and bicyclists need to be able to safely use and cross highways and
freeway interchanges.

32
Transit & Rail

33
• 29 Transit Agencies, including: Bay Area Rapid Transit (BART) Caltrain San Mateo County Transit District (SAMTRANS) Alameda Contra Costa County Transit (ACTransit) Santa Clara Valley Transportation Authority (VTA) San Francisco Municipal Transportation Agency (MUNI) Golden Gate Bridge Highway & Transportation District West Contra Costa County Transit (WESTCAT)
• Two Bus Rapid Transit projects underway San Francisco, Van Ness Avenue (U.S. 101/SR1), 3 mile International Bl/E. 14th Avenue (SR185), 9.5 mile
• Sonoma – Marin Area Rail Transit (nearly completed) • Caltrain Electrification & BART Extension • Tech Firm Shuttles/Bus Services (Google, Genentech, etc.) • Mobility Companies (Uber, Lyft, & other)
*
San Francisco Bay Area Transit & Rail
There is an increasing interest to consider freeway part-time lanes and bus-on-shoulder operations.

34
Challenges

San Francisco Bay Area Population, Housing, Jobs, & Transportation
35
2.6 million households
rise to 3.4 million
3.4 million Jobs rise to 4.7 million
• Plan Bay Area 2040, a blueprint for regional growth and transportation investment to be adopted in July 2017.
• Where will the region plan for the 820,000 new households?
• Where will the region plan for the 1.3 million new jobs?
• How will the limited available Transportation funds be invested?

San Francisco Plan Bay Area 2040 Funding Distribution in Year-Of-Expenditure
36
90%
10%
Operate, Maintain, and Modernize
Expand Existing System
Total = $303 Billion
• Transportation investments that preserve the existing infrastructure & support economic development, and resiliency.

*
California Department of Transportation Climate Change
37
• Collaborative Efforts 2011, Adapting to Rising Tides:
Transportation Vulnerability and Risk Assessment Pilot Project (Caltrans, MTC, & BCDC)
2014, Climate Change and Extreme Weather Adaptation Options for Transportation Assets in the Bay Area (Caltrans, MTC, BCDC, BART)
2016, State Route 37 Integrated Traffic, Infrastructure and Sea Level Rise Analysis (UC Davis)
A Resilient Transportation System for Safe and Sustainable Communities (Caltrans, BART, MTC, BCDC)
Underway: Caltrans District 4 Climate Change Vulnerability Assessment (Caltrans HQ Climate Change Branch)
• Emphasis on sustainability & resilience

*
California Department of Transportation Funding
38
A Simplified Overview of California Transportation Funding

*
California Department of Transportation Funding
39
2016 State Highway Operation & Protection Plan (SHOPP)
Safety $13.3
Stewardship
$35.5
Sustainability
$13.3
System Performa
nce $9.9
Escalation $16.4
Safety 17%
Stewardship 67%
Sustainability 10%
System Performa
nce 6%
Investment Plan- $26.6 B
Fix it First.

40
Opportunities

*
California Department of Transportation Funding
41
• SB 1- Road Repair and Accountability Act of 2017 provides significant additional funds in the form of tax and fee increases. $7.3 B by increasing diesel excise tax 20 cents;
$3.5 B by increasing diesel sales tax to 5.75%;
$24.4 B by increasing gasoline excise tax 12 cents;
$16.3 B by an annual transportation improvement fee based on a vehicle's value;
$200 M from an annual $100 Zero Emission Vehicle fee (commencing in 2020);
$706 M in General Fund loan repayments;
TOTAL: $52.406 Billion
$25.9 Billion for State Highway System and Other Infrastructure.
$26.6 Billion for Local Streets and Roads
Amounts identified are over 10 year figures but the Tax/fee increases are permanent.
Source: California Governor’s Office
• California Road User Charge Pilot

42
San Francisco Bay Area Express Lanes Network
• Optimizes use of the existing system. • Improved mobility for all, utilizing
available unused capacity in HOV Lanes.
• Dynamic pricing controls demand & preserves ridesharing incentives.
• Added Choice & Reliability. • Enhanced Environment. • New funding source to close gaps in
network, to provide additional time savings and incentives for transit & carpools.
Working with MTC and local partners to expand and convert HOV lanes into an Express Lanes Network
Existing, 45 Miles By 2020, 150 “ By 2030, 200 “ Beyond, 150 “

*
California Department of Transportation Asset Management
43
• 2017 State Highway System Management Plan Integrates 10 Year SHOPP & five-Year Maintenance Plans. Aligns objectives with Caltrans Strategic Plan Transparency
• Implements Performance Management (of physical assets) Use individual objective management systems Use deterioration rates, service life estimates, & expert judgement Establish condition targets & determine condition gaps Determine unconstrained need & develop a constrained investment plan
Good 75%
Fair 22%
Poor 3% Current
Condition
Good 83.5%
Fair 15%
Poor 1.5%
Target Condition
Increase by 8.5%
Decrease by 7.0%
Decrease by 1.5%
Distribute funding for objectives based on a statewide performance target (not $’s) in proportion to each objective performance gap for each district
If a District has achieved the statewide goal, their target will be zero.
Balance work across all objectives Fiscal targets are set for a 5 year period
and included in 10 Year SHOPP

44
California Connected Corridors Program
• Caltrans intends to utilize Capability Maturity Model as a tool to support ICM: Regional Operations Workshops to
evaluate capabilities by corridor for integrated management
Move from separate ad-hoc processes towards mature, cross functional, integrated and optimized operations.
• Focus to be on transportation corridors with maximum peak travel time delay.
• Caltrans Strategic Management Plan commits to ICM implementation: By 2018, five corridors (SR-57, I-80, SR-91, I-110, 210) BY 2020, three corridors (SR-57, I-80, I-210)

45
Next Steps: CVO Issues, Challenges, & Recommendations
• Parking shortage: Parking shortages at rest areas and near the origin/destination is an issue; recommend building more truck-friendly parking facilities.
• Safety Awareness/Education: Drivers still need to be made aware of the operational limitations of commercial vehicles traveling on the highway. Crashes involving commercial vehicles tend to be more severe and result in greater loss of life than those involving only passenger cars.
• Congestion and delays: Congestion in the urban areas is also a challenge for commercial vehicles which need to be considered as part of mobility improvements, integrated & connected corridors, express lanes, traveler information.
• Hours of service: Fatigue is a big issue facing drivers and a major cause of crashes; recommend stricter enforcement on the hours of operations.

46
Next Step: Connected Vehicles
• On freeways, end-of-queue warnings using V2V can address 50% of the crashes.
• V2I can alert drivers to slow or stopped traffic just ahead of them.
• Connected Vehicles use vehicle-to-vehicle (V2V) and vehicle-to-infrastructure (V2I) communication technology to provide information, alerts, and if necessary, warnings to drivers that enable them to travel safely and more efficiently.
47
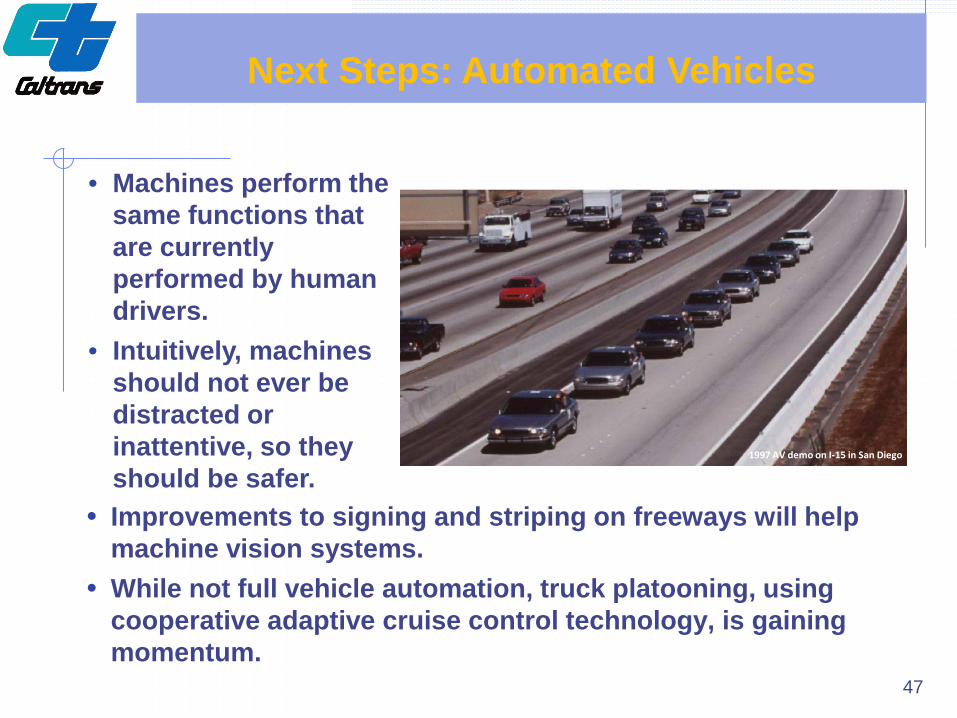
Next Steps: Automated Vehicles
• Improvements to signing and striping on freeways will help machine vision systems.
• While not full vehicle automation, truck platooning, using cooperative adaptive cruise control technology, is gaining momentum.
• Machines perform the same functions that are currently performed by human drivers.
• Intuitively, machines should not ever be distracted or inattentive, so they should be safer.
1997 AV demo on I-15 in San Diego

48
Next Steps: Active Traffic Management
• After analyzing the corridor’s traffic patterns using simulation and modeling tools, optimal plans are determined for CRM and VSL that squeeze more efficiency out of the existing freeway.
• Using V2I, vehicle speeds can be controlled to delay or even eliminate the onset of stop-and-go driving.
• Supplementing ICM, Active Traffic Management includes Coordinated Ramp Metering (CRM) and Variable Speed Limits (VSL).

49
Predictions, anyone?
San Francisco Bay Area Possible Transportation Network Improvements
• By 2020, 50% of mobility as a service rides will be via autonomous vehicles.
• By 2025, No one will own a car; we’ll be able to ride Hyperloop; there will be 88 Smart Cities worldwide.
• By 2029, 146 million vehicles in the US will have connected vehicle technology.
• By 2040, you can travel by Hypersonic Jet.
• By 2045, There will be buildings 18-24 miles high; flying cars will exist in the near future. Connected/Autonomous vehicles will eliminate the need for roadway sensors, all roadway signage, traffic signals, etc.
Source: California PATH 30th Anniversary Event

Safety
Mobility
Questions?
50

51
San Francisco Bay Area Innovative Pedestrian & Bicycle Facilities
Bicycle-Pedestrian Bridge, Across Interstate 80/580, Berkeley, CA Completed: 2002
Bay Bridge Bicycle-Pedestrian Path, Across Interstate 80, Oakland, CA Completed: 2013/16
Richmond-San Rafael Bridge Bike Path with Moveable barrier on shoulder Estimated Completion: Spring 2018

52
San Pablo Avenue (SR 123) Two-way raised cycle track Status: In Construction
Alpine Road bike lanes across I-280 ramp crossings Status: Completed in 2013
Old Redwood Highway at U.S. 101 Raised crosswalk & bike lane at ramp Status: Completed 2014
San Francisco Bay Area Innovative Pedestrian & Bicycle Facilities

53
Sloat Boulevard (State Route 35), San Francisco:
• “Road Diet” from six to four lanes • New Bicycle lanes with buffer
• Speed & Crash Reduction
San Francisco Bay Area Innovative Pedestrian & Bicycle Facilities

54
California Commitment for Funding
• Active Transportation Program (ATP) 2017- Cycle 3 District 4 (Statewide ATP): $31.76 M (of $131.76 M)
MTC (Regional ATP): $22.171 M
• New Senate Bill 1 Provisions: $100 million/year for ATP
Vallejo – Bay Trail/Vine Trail Gap Closure Oakland – Fruitvale Alive Gap Closure

55
San Francisco Bay Area: Integrated Corridor Management
San Mateo US 101 Smart Corridor
• $ 35.3 M project for Enhanced Congestion Monitoring & Management • 20-mile freeway stretch through 10 cities in San Mateo County • New & upgraded field elements and communication • State & local TMCs + remote operations • “Smart Corridor Routes”: Local arterials & State Routes 82, 84, 109, 114
Smart Corridor Route

56
• 32 mile corridor in Alameda & Santa Clara Counties, including nine cities
• Segment 1 focuses on arterial improvements for incident management. Improved Arterial Incident Management ITS components: trailblazer signs,
CCTV, detection stations, signal coordination, and communications improvements
Parallel State Arterials: SR 61 (Davis Street & Doolittle Drive), SR 77 (42ndAvenue), SR 112 (Davis Street), & SR185 (International Blvd).
Project Cost: $14M Completion: 2019
• Future Segments 2 and 3 are In Alameda County and Segment 4 would extend to Santa Clara County.
San Francisco Bay Area: Integrated Corridor Management
Interstate 880 Smart Corridor

57
San Francisco Bay Area: Integrated Corridor Management
State Route 4 Smart Corridor
• Approximately 30 miles from I-80 to SR-160 through seven cities • In Early planning stage • 18 month schedule: Prepare Concept of Operations & High Level
System Requirements for: Corridor Ramp Metering Incident Management Travel Demand Management

58
Contra Costa County I-680 Forward
San Francisco Bay Area: Integrated Corridor Management
Interstate 680 Smart Corridor
• 25 mile Corridor, from
Benicia-Martinez Bridge to Alameda County Line
• Corridor Ramp Metering • Incident Management • Bus on Shoulder Use • First Mile/Last Mile,
including Autonomous/ Connected Vehicles,
• Travel Demand Management

59
California Integrated Corridor Management
Interstate 210 ICM Pilot
• Completion Date: Freeway ITS Improvements: March 2018 Arterial improvements & Decision Support System (DSS) : 2018
• Cost: $ 26.4 M
• 11.5-mile corridor, between SR-134 in Pasadena to I-605 in Duarte, including: Fragmented Arterial signal systems &
modal operations Advanced Ramp metering Operations,
light-rail, and several transit operators A multitude of express commuter transit
and distributed parking facilities
• Project features: Improved real-time system monitoring capabilities Improved incident response coordination Improved traffic and demand management applications Optimized corridor operations in real-time
Excellent freeway detection and communication system

*
San Francisco Bay Area Van Ness Avenue (US 101) BRT
• San Francisco’s first BRT • 3-mile corridor • Converts one of three existing lanes in
each direction to a dedicated bus lane • Showcases Caltrans’ Main Streets and
Complete Streets policies • Other features:
Replaces MUNI’s Overhead Contact System; Upgrades of Traffic signal system and street
lighting; Replacement of Water, Sewer and Auxiliary
Water Supply System
• Completion date: March 2020 • Project Cost: +$273 M
60

61
*
San Francisco Bay Area East Bay Bus Rapid Transit
• 9.5-mile alignment on International Boulevard/E. 14th Street (SR 185), from Uptown Oakland to San Leandro BART Transit Center
• A combination of 80% dedicated bus-only & mixed-flow lanes
• Includes 34 stations (46 total platforms at 21 median, 12 curbside & 1 southern terminal)
• 27 hybrid-electric buses (low-emission, 60-foot articulated)
• Pedestrian scale lighting & visibility • New traffic & pedestrian signals with transit priority • Best ADA Practices & level boarding • Bike Racks at platforms and inside the bus • Same fare as local service (with 7 to 8 minute headways for
increased frequency and reliability)
• Revenue Service Date: Anticipated 2018

*
San Francisco Bay Area Sonoma-Marin Area Rail Transit (SMART)
• SMART is a voter-approved passenger rail and bicycle-pedestrian pathway
• 70-mile corridor from Larkspur to Cloverdale Phase 1: 43-mile route from San Rafael to
Santa Rosa, including 10 stations, and 2 planned future stations
Phase 2: Remainder, including five planned stations
• Train service between Sonoma County Airport and San Rafael is scheduled to begin in late Spring 2017
• First rail agency to use Positive Train Control technology, enhancing safety & service reliability along the corridor
• Made in the USA: Trains, Rails, Ties, & Ballast produced domestically
• SMART contracts have put >$24M into the local economy 62

San Francisco Bay Area Planned Express Lanes Projects
63
Begin Construction Expected Opening
Alameda/Santa Clara I-680 (Southbound) 2008 Opened 9/20/2010 Santa Clara 880/237 (Connectors) 2011 Opened 3/20/2012
Eastbound Alameda I-580 2014 Opened 2/19/2016
Westbound Alameda I-580 2014 Opened 2/20/2016 Contra Costa 680 2015 2017 Santa Clara State Route 237 2017 2018 Alameda I-880 2017 2019 Alameda I-680 (Northbound) 2017 2019 Alameda 84 & 92 2017 2020 Solano I-80 2018 2021 Alameda I-80 TBD TBD Santa Clara State Route 85 TBD TBD
Next

*
California Department of Transportation Climate Change
64
• Recent 2017 storms: 21 Bay Area vulnerable locations $
170,
642,
000
$45
,579
,040
$12
3,41
7,50
0
$37
5,84
1,00
0
$10
3,88
9,10
0
$7,
673,
154
$80
,792
,000
$7,
375,
000
$1,
210,
000
$9,
260,
000
$10
,006
,000
$2,
520,
000
$-
$50,000,000
$100,000,000
$150,000,000
$200,000,000
$250,000,000
$300,000,000
$350,000,000
$400,000,000
1 2 3 4 5 6 7 8 9 10 11 12
Caltrans Damage by District County Repair Costs Number of Incidents
Alameda $ 37,425,000 37
Contra Costa $ 8,805,000 7
Marin $ 104,071,000 58
Napa $ 20,240,000 61
Santa Clara $ 79,125,000 85
San Francisco $ 675,000 19
San Mateo $ 68,045,000 61
Solano $ 17,480,000 35
Sonoma $ 39,975,000 102
Total $375,841,000 465

*
California Department of Transportation Sustainability Efforts in Bay Area
65
• Caltrans Green Fleet & Green Building Measures
• ZEV 30-30: Charging Stations at 30 locations in 30 months (Park & Ride Lots, and Maintenance Stations)
• Water Savings: Smart controllers for landscaping irrigation & Recycled Water
• Recycled construction materials (asphalt and concrete)
• LEED Gold Certified, SFOBB Maintenance Complex
• Implosion project at SFOBB (Construction Manager General
Contractor hired micro-blasting sub minimized water pollutant and reduced Carbon footprint.)

66
*
California High Speed Rail
• Over the next 30/40 years, California will add the current population of New York state to its current 38 million residents.
• First high speed rail (HSR) system in the nation, California HSR will connect mega-regions, contribute to economic development & a cleaner environment, create jobs and preserve agricultural and protected lands.
• By 2029, the system will run from San Francisco to the Los Angeles basin in under three hours at speeds over 200 MPH.
• HSR will eventually extend to Sacramento and San Diego, totaling 800 miles with up to 24 stations.
• ENVIRONMENTAL/QUALITY OF LIFE BENEFITS Tree planting and other programs will result in
about 520,000 tons of GHG reductions. In first year of operation HSR will take the
equivalent of 31,000 passenger vehicles off road. Caltrain electrification program will reduce an
estimated 68 thousand tons of CO2 a year starting in 2019.