Embed Size (px)
Citation preview

IntroductionWhen considering profitable agriculture from a practical perspective, thefactors affecting plant growth and harvestable productivity are of theutmost importance. A myriad of factors, such as genetics, environment,and irrigation management, impact yields independently and throughinteractions. Knowledge of these factors, the interactions, and how tomanipulate them make it possible for the farm operation to maximizethe return. Of course, all are not under the control of the grower.However, crop nutrition and soil fertility can be managed for goodyields and production efficiency.
There are 17 elements that are essential to the growth of plants in gener-al. Not all are required for all plants. Carbon, hydrogen, oxygen, nitro-gen, phosphorus, and sulfur are the elements required for proteins andcell walls. The other thirteen elements include calcium, magnesium,potassium, iron, manganese, molybdenum, copper, boron, zinc, chlo-rine, and silicon. A few plants require sodium, cobalt, and vanadium.Among the essential nutrients, nitrogen, phosphorus, potassium, zinc,and to a lesser extent sulfur and iron are the nutrients of concern in theCalifornia rice cropping system. The behavior of these elements andtheir management is somewhat unique in rice as compared to othercropping systems because of the anaerobic soil due to flooding.
Soil under rice cultivationThe major characteristic of a submerged soil is the depletion of oxygen(O2). Microorganisms deplete the free O2 throughout most of the rootzone within a few days of flooding. The water contains dissolved O2,which can diffuse a short distance into the soil. The deeper the water, theless O2 can move from the air to the soil. The thickness of the oxidizedlayer at the soil/water interface ranges up to about 1 inch thick depend-ing on the microbial activity. For example, in a soil with a large supplyof decomposable organic matter (i.e. incorporated straw) the oxidizedlayer is very thin. Once the soil O2 supply becomes depleted, the soil bac-teria are forced to extract O2 from other compounds. These compoundsin the order of utilization are nitrate, manganese oxide, iron hydroxide,and sulfate-sulfur. Once this pool of compounds is exhausted, the soilbacteria will use the energy stored in organic compounds by fermentingorganic matter to carbon dioxide and methane. Another unique proper-ty of flooded soil is that upon flooding the soil, regardless of the startingpH, the pH approaches neutrality (pH 6.5 to 7.5). This occurs in abouttwo weeks. As a result, the chemistry of an anaerobic soil alters the leveland forms of some plant nutrients and results in the production of com-pounds which are sometimes toxic to rice.
California Rice Production Workshop, 2013-1
6.1
The major char-acteristic of asubmerged soil isthe depletion ofoxygen (O2).Microorganismsdeplete the freeO2 throughoutmost of the rootzone within afew days of flooding.
Fertility and Crop Nutrition

Approaches to nutrient managementThe goal in nutrient management is to match nutrient supply with croprequirements and to minimize nutrient losses from fields. Properly man-aged fertilizers support cropping systems that provide economic, socialand environmental benefits. On the other hand, poorly managed nutri-ent applications can decrease profitability and increase nutrient losses,potentially degrading water and air quality.
The 4R approach is one that offers enhancedenvironmental protection, increased produc-tion, increased farmer profitability, andimproved sustainability. The concept is to usethe right fertilizer source, at the right rate, atthe right time, with the right placement.
In order to implement the 4R approach it isnecessary to understand some fundamentalsabout when the crop needs nutrients and howmuch it needs. In general, maximum nutrientuptake occurs from tillering and goesthrough to the onset of the reproductive stage(Fig. 1). The peak nutrient uptake rate coin-cides with the maximum root biomass accu-mulation. As the grain ripens nutrients andcarbohydrates are transported from the vege-tative parts of the plant into the panicle.Therefore, the critical time frame for careful
nutrient management is between planting and panicle initiation. In thecase of some specialty varieties, there may some fertility managementdecisions based on grain quality that would justify later applications ofnitrogen.
The plant gets nutrients from the soil, irrigation water and atmosphericdeposition. What is not provided from these sources needs to be madeup from other nutrient inputs (fertilizer, manure, cover crops, etc).Nutrients have different roles within the plant and thus are needed indifferent quantities by the plant. Of the three main nutrients that are typ-ically applied the rice plant demands similar amounts of N and K (33-34lb N or K /ton) and less of P (6 lb P/ton grain yield) (Table 1). To put thisin fertilizer equivalents where P is expressed as P2O5 and K as K2O thecrop takes up 14 lb P2O5/ton and 40 lb K2O/ton grain yield (Table 1).
Soil and tissue samplingNutrient deficiencies can be determined from both soil and tissue tests.Soil samples are usually taken before planting and before any fertilizershave been applied. Soil samples are useful in that you may be able todetermine deficiencies before the season and take corrective measures.
California Rice Production Workshop, 2013-1
6.2
Figure 1. Seasonal uptake rate of selected nutrients and rootgrowth by a rice plant.
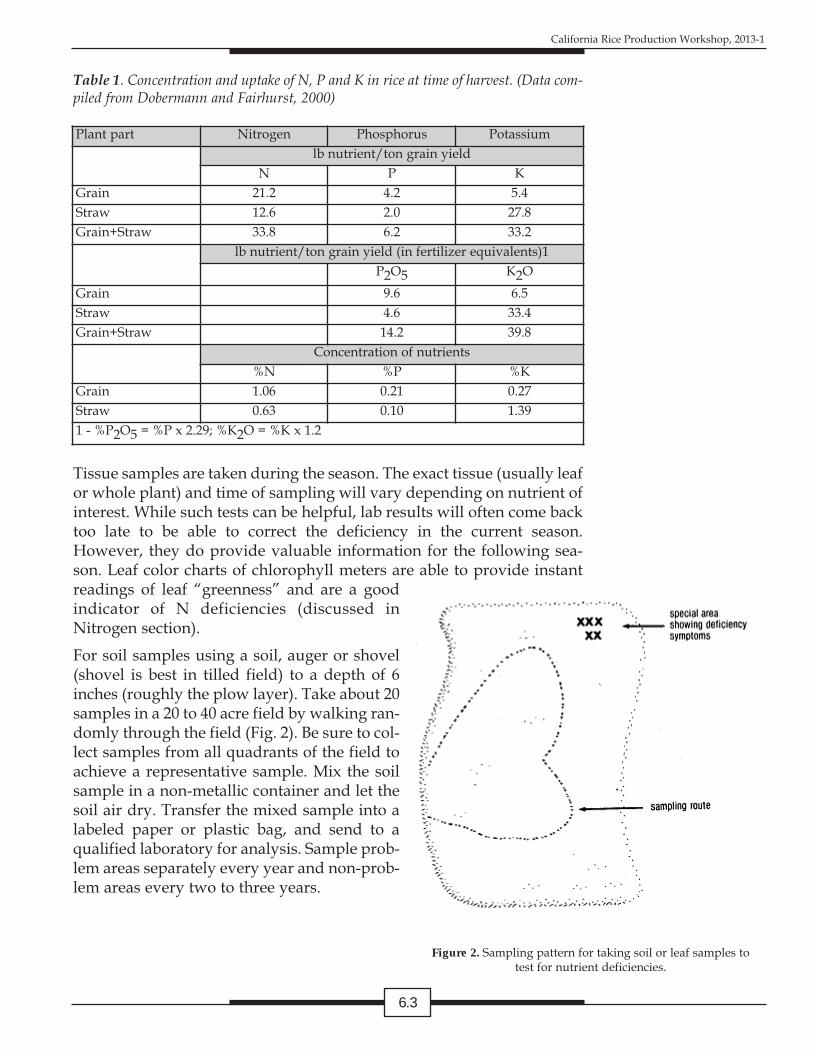
Tissue samples are taken during the season. The exact tissue (usually leafor whole plant) and time of sampling will vary depending on nutrient ofinterest. While such tests can be helpful, lab results will often come backtoo late to be able to correct the deficiency in the current season.However, they do provide valuable information for the following sea-son. Leaf color charts of chlorophyll meters are able to provide instantreadings of leaf “greenness” and are a goodindicator of N deficiencies (discussed inNitrogen section).
For soil samples using a soil, auger or shovel(shovel is best in tilled field) to a depth of 6inches (roughly the plow layer). Take about 20samples in a 20 to 40 acre field by walking ran-domly through the field (Fig. 2). Be sure to col-lect samples from all quadrants of the field toachieve a representative sample. Mix the soilsample in a non-metallic container and let thesoil air dry. Transfer the mixed sample into alabeled paper or plastic bag, and send to aqualified laboratory for analysis. Sample prob-lem areas separately every year and non-prob-lem areas every two to three years.
California Rice Production Workshop, 2013-1
6.3
Table 1. Concentration and uptake of N, P and K in rice at time of harvest. (Data com-piled from Dobermann and Fairhurst, 2000)
Plant part Nitrogen Phosphorus Potassiumlb nutrient/ton grain yield
N P KGrain 21.2 4.2 5.4Straw 12.6 2.0 27.8Grain+Straw 33.8 6.2 33.2
lb nutrient/ton grain yield (in fertilizer equivalents)1P2O5 K2O
Grain 9.6 6.5Straw 4.6 33.4Grain+Straw 14.2 39.8
Concentration of nutrients%N %P %K
Grain 1.06 0.21 0.27Straw 0.63 0.10 1.391 - %P2O5 = %P x 2.29; %K2O = %K x 1.2
Figure 2. Sampling pattern for taking soil or leaf samples totest for nutrient deficiencies.
NitrogenPlant function
Nitrogen is an essential part of all amino acids, proteins, enzymes,chlorophyll molecules, and nucleotides (e.g. DNA). Because nitrogen ispresent in so many essential compounds even slight deficiencies canresult in reduced growth and productivity.
Deficiency symptoms
Nitrogen deficiency is the most common nutrient deficiency in rice.Older leaves (and sometime all leaves) are light green (or even yellow)and may be chlorotic at the tip. Under severe N stress older leaves willdie and young leaves will be narrow, short and yellowish green.Visually, N deficiencies can look like S deficiencies (which are not verycommon); however in an S deficiency all leaves turn light green/yellow.
Nitrogen cycle/soil nitrogen
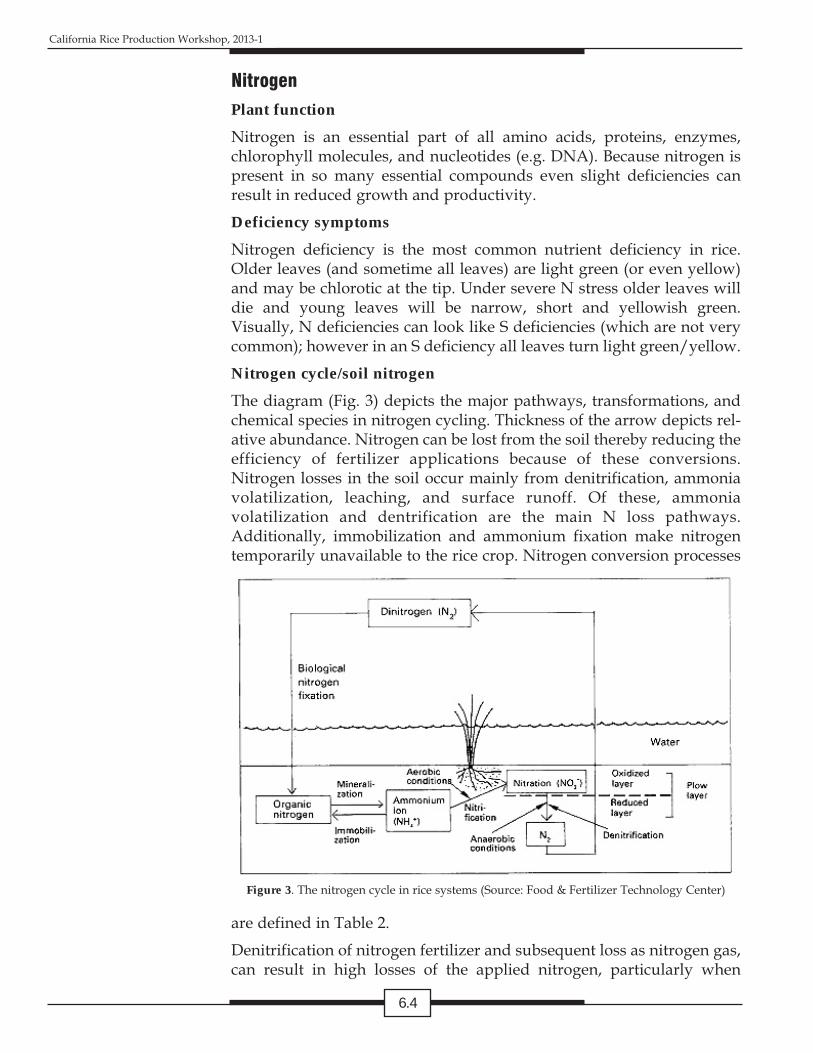
The diagram (Fig. 3) depicts the major pathways, transformations, andchemical species in nitrogen cycling. Thickness of the arrow depicts rel-ative abundance. Nitrogen can be lost from the soil thereby reducing theefficiency of fertilizer applications because of these conversions.Nitrogen losses in the soil occur mainly from denitrification, ammoniavolatilization, leaching, and surface runoff. Of these, ammoniavolatilization and dentrification are the main N loss pathways.Additionally, immobilization and ammonium fixation make nitrogentemporarily unavailable to the rice crop. Nitrogen conversion processes
are defined in Table 2.
Denitrification of nitrogen fertilizer and subsequent loss as nitrogen gas,can result in high losses of the applied nitrogen, particularly when
California Rice Production Workshop, 2013-1
6.4
Figure 3. The nitrogen cycle in rice systems (Source: Food & Fertilizer Technology Center)

applied in a nitrate form (nitrate fertilizers should not be applied to ricesystems) or when there has been significant nitrification of N fertilizers(aqua ammonia, urea or ammonium sulfate). The conversion occurs inthe anaerobic zone of the soil. Manageable factors contributing to deni-trification include wet/dry cycles and fertilizer management. Severenitrogen losses occur in soils subjected to alternate draining (aerobic)and flooding (anaerobic) which occur after N fertilizer has been applied.Lowering water following planting for a short time period to ensuregood crop establishment (Leather’s Method) does not lead to significantdenitrification losses provided the soils a reflooded relatively quickly.
Another important mechanism of nitrogen loss is the volatilization ofammonium formed as a result of mineralization. Among the factorsaffecting the process are moisture content, pH, cation exchange capacity,lime content, temperature, flood depth, and the type of fertilizer. Againmaintaining a constant flood is one method by which growers can min-imize the loss. Surface applied urea and ammonium sulfate volatilizemore readily than incorporated aqua-ammonia. Regardless of the form,however, the longer the time between application and the establishmentof the permanent flood the greater the loss.
Another critical process of particular relevance to California is immobi-lization. The incorporation of straw (carbon) stimulates microbial activi-ty. Consequently, nitrogen becomes unavailable for plant uptakebecause the nitrogen is incorporated into the microbial biomass.
Determining a deficiencyStandard soil tests are not reliable for determining the amount of nitro-gen available for a rice crop. The dynamic nature of the various forms ofnitrogen in a flooded soil makes it difficult to sample and analyze the soilin a condition that is representative of actual growing conditions. For
California Rice Production Workshop, 2013-1
6.5
Table 2. Definition of terms describing major processes in the nitrogen cycle.
Nitrogen fixation The process by which atmospheric nitrogen is converted to bio-logically usable forms of nitrogen by microorganisms.
Mineralization The breakdown of organic matter resulting in the release ofammonium (NH4) and other nutrients which can be used byplants.
Nitrification The conversion of ammonium (NH4) to nitrate (NO3).
Denitrification The conversion of nitrate (NO3) to nitrogen gas (N2), resulting ina loss of plant available N.
Immobilization The assimilation (tying up) of inorganic N (NH4 and NO3) bymicroorganisms resulting in the nitrogen being unavailable forplant uptake.
Ammoniavolatilization
The loss of ammonia gas to the atmosphere, following the conver-sion of ammonium (NH4) to ammonia (NH3).
example if sampled in a dry aerobic state, nitrate-nitrogen may be thedominant form available to the plant, but once flooded the soil becomesanaerobic, nitrate-nitrogen is lost via denitrification.
Latter in the season leaf tissue tests, leaf color charts, or chlorophyllmeters may be used to identify deficiencies. These will be discussedlater.
4R management
—Right rate—
Despite the fact that N is required in greater quantities than any othernutrient and is usually the most expensive nutrient input, there are nogood soil tests to determine the correct nutrient rate to use in rice sys-tems. Therefore, many growers use historical experience to decide ontheir N rate. However, with changing practices over time (i.e. strawmanagement, fertilizer N management, water management, and vari-eties) the optimal N rate can change. With the increased use of yieldmonitors, an effective way to identify the correct N rate for a particularfield is to do test strips using different N rates. To do this we recommend
1. Identifying a representative field and check.
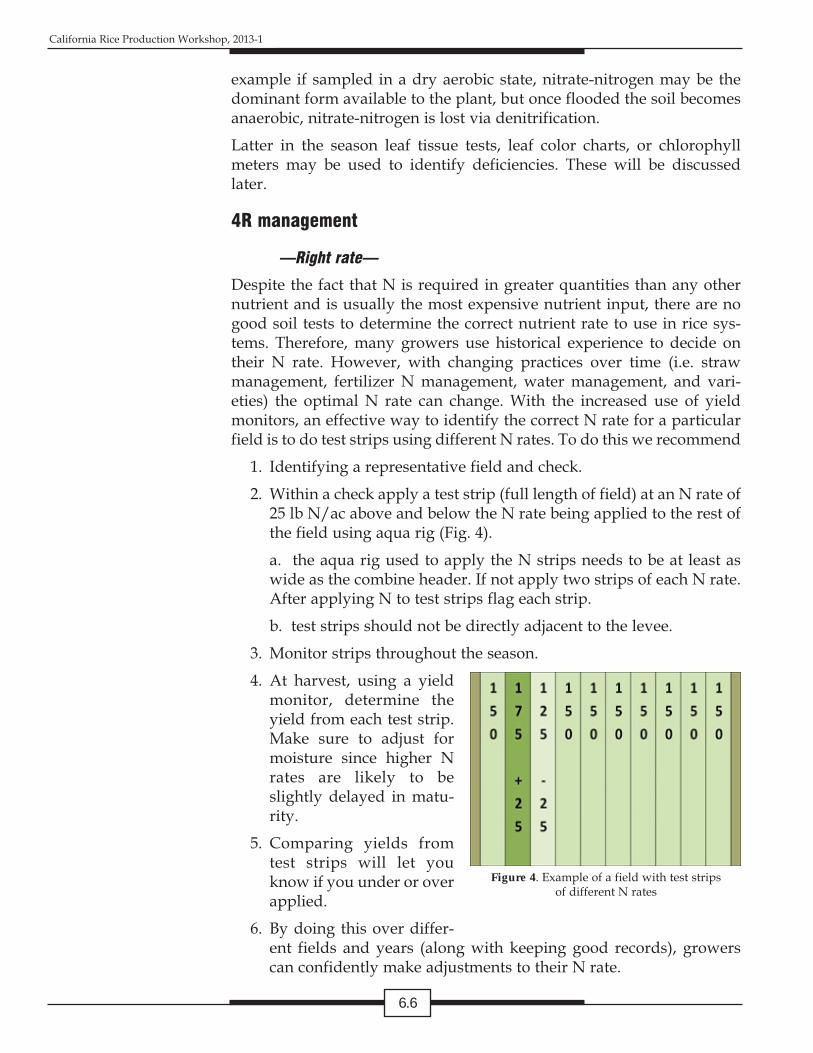
2. Within a check apply a test strip (full length of field) at an N rate of25 lb N/ac above and below the N rate being applied to the rest ofthe field using aqua rig (Fig. 4).
a. the aqua rig used to apply the N strips needs to be at least aswide as the combine header. If not apply two strips of each N rate.After applying N to test strips flag each strip.
b. test strips should not be directly adjacent to the levee.
3. Monitor strips throughout the season.
4. At harvest, using a yieldmonitor, determine theyield from each test strip.Make sure to adjust formoisture since higher Nrates are likely to beslightly delayed in matu-rity.
5. Comparing yields fromtest strips will let youknow if you under or overapplied.
6. By doing this over differ-ent fields and years (along with keeping good records), growerscan confidently make adjustments to their N rate.
California Rice Production Workshop, 2013-1
6.6
Figure 4. Example of a field with test stripsof different N rates

—Right source—
There are a number of N-fertilizer choices available for rice growers.However, N sources containing nitrate-N should not be used due topotential for high N loss. The N source applied in largest quantities towater-seeded rice systems is aqua-ammonia or “aqua”. Aqua contains20% N. Other common N sources used in California rice systems areurea (45-46% N), ammonium sulfate (21% N) and various starter blendsstarters which are usually blended from ammonium phosphates andammonium sulfate.
Growers typically apply the majority of their N rate as aqua (60-75%)and apply the rest of the N rate in the starter blend and sometimes as atopdress later in the season. The rational for applying starter N is to pro-vide young emerging seedlings with a readily available N until the riceroots grow into the aqua that isinjected 3-4” below the soil sur-face. On-farm research address-ing the need for starter N showsthat starter N is not necessary. Infact, at equivalent N rates higheryields and N uptake wereachieved when all of the N wasapplied as aqua (Fig. 5). The rea-son for this is that the N injectedbelow the soil surface is betterprotected from both ammoniavolatilization and denitrificationlosses. While applying starterdid increase plant size early inthe season in some of the trials,this never translated intoincreased yields at the end of theseason. Results of this research suggest that overall N rates to achieveoptimal yields could be reduced by 10 lb/ac if all the N was applied asaqua.
While starter N may not be necessary, P fertilizer is often required and Pis usually only available as ammonium phosphates (i.e. a fertilizer thatcontains N). Thus, applying P fertilizer usually requires that some N fer-tilizer is also applied. Applying P is usually applied as a starter fertiliz-er before planting. Therefore, if a starter fertilizer is necessary (due toneed for P), we recommend using a starter blend with the lowest amountof N possible. The N in the starter should be considered as part of thetotal N rate.
If a top dress is necessary, ammonium sulfate is often used as it has alower N content and is easier to apply uniformly by air. However, ureacould also be used and is generally a cheaper source of N.
California Rice Production Workshop, 2013-1
6.7
Figure 5. Effect of N source and placementon yields. The N rate shown here is 100 lbN/ac and the date represent the average
response across 7 different fields.

—Right time—
Numerous research trials have shown that the most efficient time toapply N to water seeded rice systems is to apply it all before planting.These trials have shownno benefit to splitting theN rate between plantingand a topdress applica-tion. In drill seeded sys-tems or when water isdrained from the field foran extended period oftime it may be necessaryto apply fertilizer at differ-ent times.
Therefore, there is no ben-efit to planning a topdressapplication of nitrogen.All the nitrogen should be applied before planting. However, there maybe cases where a topdress is necessary. For example, if the growing sea-son is particularly favorable resulting in greater growth and yield poten-tial. Or, an unplanned water drainage event may necessitate a topdressdue to N losses associated with draining the field. Topdress N fertilizershould be applied before PI.
In these cases a decision on whether or not to topdress can be made witha chlorophyll meter or a leaf color chart.
Leaf color chart: The UC leaf color chart is a series of color panels againstwhich leaves are compared (Fig. 6). With some practice, leaf nitrogen canbe predicted with a high degree of accuracy using the LCC. Furthermore,it does not take a lot of practice to get good results. On the back of thechart there is table relating panel color to leaf nitrogen. Refer to Table 4to determine if the leaf N concentration is adequate.
Chlorophyll Meter (SPAD meter). The meter is a hand held device thatestimates leaf nitrogen based on leaf color and transmitted light. Themeter is quick. However, the meter displays numbers which are notdirectly related to leaf nitrogen. Consequently, considerable effort isrequired to establish a calibration curve. Moreover, leaf thickness caninfluence the readings because the chlorophyll meter relies on transmit-ted light. Thus, a single curve may not accurately describe leaf nitrogenfor all varieties. Table 3 presents the relationship between the SPADmeter reading and leaf N (%) at panicle initiation for ten rice varieties. Itis based on currently available information which does not includenewer varieties such as M-206. In this case, M-202 calibration would pro-vide a reasonable estimation of leaf N for M-206. Using the %N valuefrom Table 3, one can determine if crop N is sufficient using Table 4.
California Rice Production Workshop, 2013-1
6.8
Figure 6. The UC leaf color chart determines leafnitrogen based on leaf color

Table 3. Leaf N content (%) at panicle initiation of select rice varieties and the corre-sponding chlorophyll meter (SPAD, Minolta) readings
Table 4. Interpretive guide for leaf nitrogen percentage. Total leaf N concentrations arefor California short, medium and long grain varieties.
—Right place—
In water-seeded rice systems, the objective needs to be to get as muchof the fertilizer N as possible below the soil surface. In a flooded sys-tem the top 0.5” of soil is oxidized and fertilizer N in this area can benitrified which can then lead to N losses via denitrification. Many stud-ies both in California and in other parts of the world have shown thatN placed deep into the soil results in greater N use efficiency.
California Rice Production Workshop, 2013-1
6.9
% Nitrogen at Panicle InitiationSPAD S-102 Calhikari M-202 M-204 M-205 L-204 L-205 Calmati Akita Koshi25 2.3 2.6 2.4 2.4 2.5 2.4 2.2 2.2 1.8 1.826 2.4 2.7 2.5 2.5 2.7 2.5 2.4 2.4 1.9 1.927 2.5 2.8 2.6 2.7 2.8 2.6 2.5 2.5 2.0 2.028 2.6 2.9 2.8 2.8 2.9 2.8 2.6 2.7 2.1 2.129 2.7 3.0 2.9 2.9 3.1 2.9 2.8 2.8 2.2 2.230 2.8 3.1 3.0 3.0 3.2 3.0 2.9 3.0 2.3 2.331 2.9 3.3 3.2 3.1 3.3 3.2 3.0 3.1 2.4 2.432 3.0 3.4 3.3 3.2 3.5 3.3 3.2 3.3 2.5 2.533 3.1 3.5 3.4 3.4 3.6 3.4 3.3 3.5 2.6 2.634 3.2 3.6 3.5 3.5 3.7 3.5 3.4 3.6 2.7 2.735 3.3 3.7 3.7 3.6 3.8 3.7 3.6 3.8 2.8 2.836 3.4 3.8 3.8 3.7 4.0 3.8 3.7 3.9 2.9 2.937 3.5 4.0 3.9 3.8 4.1 3.9 3.9 4.1 3.0 3.038 3.6 4.1 4.1 3.9 4.2 4.1 4.0 4.2 3.1 3.139 3.7 4.2 4.2 4.1 4.4 4.2 4.1 4.4 3.2 3.240 3.8 4.3 4.3 4.2 4.5 4.3 4.3 4.6 3.3 3.341 3.9 4.4 4.5 4.3 4.6 4.5 4.4 4.7 3.3 3.442 4.0 4.5 4.6 4.4 4.8 4.6 4.5 4.9 3.4 3.543 4.1 4.6 4.7 4.5 4.9 4.7 4.7 5.0 3.5 3.644 4.2 4.8 4.9 4.6 5.0 4.8 4.8 5.2 3.6 3.745 4.3 4.9 5.0 4.8 5.1 5.0 4.9 5.3 3.7 3.7
Plant growth stage Critical Adequatemid-tillering 4.0 4.0 - 4.6maximum tillering 3.6 3.6 - 4.2panicle initiation 3.2 3.2 - 3.6flag leaf 2.8 2.8 - 3.2

Given that the majority of N applied to water-seeded rice systems isaqua-ammonia the issue of fertilizer placement is not so relevant asaqua is always injected into the soil. The main issue then becomes howdeep should aqua be injected. This has not been a topic of research;however most growers apply aqua at 3-4 inches deed which is ade-quate to get good soil coverage following application. N applied at thisdepth will ensure that the fertilizer is in the zone of soil that is reducedfollowing flooding which will help minimize N losses. At this timethere does not seem to be a good rational for placing the aqua anydeeper than the 3-4 inches currently being practiced.
Starter and topdress fertilizers are usually applied to the surface. Toredcue N losses from N in teh starter fertilizer, growers should seek tolimit the amount of N in the starter blend by using a blend containingthe lowest amount of N possible. Also, lightly harrowing fertilizer intothe soil can help prevent N losses. For the topdress N, this N is usuallyapplied later in the season (i.e. between maximum tillering and panicleinitiation) when the crop is growing rapidly and the demand for N ishigh. Therefore, much of the N is taken up by the crop rapidly afterapplication which helps to minimize losses.
Effect of straw management on N management
California rice growers annually incorporate about 8000 lb/ac of strawacross most of the Sacramento Valley. This straw contains approxi-
mately 50 lb of N (Table 1). This large introduc-tion of organic matter influences the immobiliza-tion-mineralization dynamics and consequentlynitrogen fertility management. Straw incorpora-tion results in more nitrogen in the soil microbialbiomass. Since microbial biomass is a primesource of available nitrogen for the crop, strawincorporation can lead to an increase in cropavailable soil nitrogen. Depending on how strawis managed it can lead to either an increase ordecrease in the amount of N applied.
A number of studies have shown that the overallN rate applied to rice can be reduced by about 25lb N/ac when rice straw is incorporated in thefall and the field is winter flooded. An exampleof this is shown in Figure 7 where burned andincorporated fields were compared. In fieldswhere the straw was burned the standard grow-er N rate provided optimal yields and loweryields when the N rate was reduced by 25 lbN/ac. In contrast, where the rice straw was
California Rice Production Workshop, 2013-1
6.10
Figure 7. Yield of burned and strawincorporated/flooded fields when fertilized at the
standard grower practice (SP) and plus of minus 25 lbN/acre averaged over three years.

incorporated, the N rate could be reduced by 25 lb N/ac without ayield reduction.
Importantly, this N benefit from straw incorporation is
1. Typically observed only after about three years of implementingthis practice.
2. Is only observed when the straw is incorporated and flooded (orthe soil remains moist) during the winter. If the straw is left stand-ing or on the soil surface during the winter and only incorporatedduring the spring land preparation the rice straw can lead to Nimmobilization (Table 2) at the start of the season resulting inreduced growth, yellow plants and reduced yields. If straw is man-aged in this fashion, it will most likely be necessary to apply addi-tional N fertilizer to overcome early season N immobilization.
Effect of varietyThere is very little difference in the overall N fertilization requirementand strategy for California’s major short and medium grain convention-al varieties. This is shownclearly in Table 5 where theN rate required for maxi-mum yields was the same(in this case 150 lb N/ac)for all varieties over twosites.
Nitrogen managementpractices do vary signifi-cantly for specialty ricevarieties. Many of thesespecialty rice varieties arelower yielding and highlysusceptible to lodging andthus require lower N rates.Furthermore, grain qualitycharacteristics can be affect-ed by N management.Research and grower expe-rience demonstrated thatyield and grain qualitycharacteristics in specialty varieties benefit from split applications ofnitrogen. For example, the yields of Akitakomachi responded favorablyto split applications of nitrogen. A preplant/panicle initiation (PI) splitof 40-40 lb/a nitrogen produced the highest yields across all locations(Table 6). Furthermore, gains in grain quality were associated with desir-able changes in physicochemical properties and improved agronomics,
California Rice Production Workshop, 2013-1
6.11
Table 5. Yield response (@ 14% MC) of selected varieties variable rates of pre-plant nitrogen in Sutter County (top) and Butte County (bottom).
N Rate S-102 M-104 M-202 M-205 M-206 M-402 Mean0 3723 3878 3745 4350 3789 4074 392750 5902 5707 5932 5886 6182 6775 6064100 7306 6978 6794 8181 7755 7690 7451150 8527 7972 7791 8743 8528 8523 8347200 7317 7709 7114 8613 8175 7820 7791Mean 6555 6449 6275 7155 6886 6977 6716
N Rate S-102 M-104 M-202 M-205 M-206 M-402 Mean0 4137 3880 4479 4254 4754 4241 429150 6776 6428 7358 6993 7461 6863 6980100 9568 9269 9770 9641 9936 9190 9562150 9766 9753 10644 10181 10788 10292 10238200 8515 8175 8538 8748 8894 8552 8570Mean 7752 7501 8158 7963 8367 7828 7928

such as reduced lodging. Lodging causes uneven ripening which resultsin a greater spread in individual kernel moisture contents. In a sample ofrice with an average moisture content of 23%, it is possible for individ-ual kernel moisture to range from 16 to 34%. Reduced lodging does notguarantee complete uniformity of ripening because plant genetics are afactor. However, good nitrogen management minimizes the moisturecontent range. Lodging also contributes to the development of off-odorswhich degrades quality, particularly for the north-eastern Asia market.
Table 6. Yield response of Akitakomachi to different preplant and topdressing rates ofnitrogen at three locations in the Sacramento Valley.
3. PhosphorusPlant function
The major roles of phosphorus in plants are energy storage, transport ofmetabolites, and cell membrane integrity. Adequate levels in the plantpromote tillering, root development, flowering, and ripening. It is par-ticularly important during the early stages of growth. Similar to potassi-um, the uptake rate of phosphorus peaks at the early reproductive stage(Fig. 1). If an adequate soil supply was available during vegetativegrowth, enough will have been taken up to supply the plant require-ments for grain production.
Deficiency symptoms
Phosphorus deficient plants are stunted with reduced tillering. Leavesare narrow, dark green, short, and erect. Overall plant height is compro-mised. Red or purple colors may develop on the older leaves, whicheventually turn brown. Phosphorus deficiency also contributes todelayed maturity, unfilled grains, and reduced response to nitrogenapplication.
Soil phosphorus
Most soils have very high amounts of total phosphorus; however only avery small portion of this is available for plant uptake during a typicalgrowing season. The transformation processes of phosphorus in flooded
California Rice Production Workshop, 2013-1
6.12
Treatment Pleasant Grovelb/a
Colusalb/a
Richvalelb/a
Averagelb/a
0 4916 4270 4892 4693
60 - 0 - 0 5511 6045 5623 5727
80 - 0 - 0 5307 5442 5358 5369
40 - 40 - 0 5806 6268 5943 6006
100 - 0 - 0 4901 4956 4742 4860
50 - 50 - 0 5941 5890 5297 5709

soils are quite different from those in non-flooded soils. Flooded soilsexhibit a greater capacity to supply plant available phosphorus thannon-flooded soils. Crops grown on flooded soils may not show aresponse to phosphorus applications, while crops grown on the samesoil under aerobic conditions may exhibit deficiencies.
Determining a deficiency
In a study evaluating rice yield response to P fertilizer in roughly 60California rice fields, less than 10% of the soils were deficient based onwhether or not grain yields responded significantly to added fertilizer P.There are a number of ways to identify P deficiencies, each with its ownbenefits and setbacks as discussed at the start of this section. These testsprovide a general indication of a deficiency and the use of more than onecan provide a better indication.
Soil test
A number of soil tests are available; however for rice soils the Olsen-Ptest (also called the sodium bicarbonate test) has been shown to be bestat identifying a deficiency. The Bray test has also been evaluated and isa poor indicator of P deficiency on rice soils. The Olsen-P test is also themost widely used soil test for rice soils around the world. The criticalOlsen-P value is 6 ppm and this has been confirmed in California ricefields.
Leaf tissue tests
Leaf tissue tests taken at 35 days after planting (around maximum tiller-ing) can also be useful in predicting a P deficiency. Y-leaf tissue concen-trations of less than 0.2% suggests a deficiency.
Input-output budgets
A good idea of whether a soil is P deficient can be achieved by develop-ing a P input-output budget. In terms of inputs almost all P that enters arice field is from fertilizer (very little in irrigation water, rainfall, etc).Also, just about all outputs are the P that is removed in grain (yield) andstraw (if it is removed from the field). Burning does not result in a sig-nificant loss of P. Also, very little to no P is lost via leaching or run-off.Therefore a simple budget can be developed using the following equa-tion:
P balance = Inputs (lb/ac of P2O5 as fertilizer) – Outputs (lb/ac removedin grain and straw).
For best results determine the P balance using a 5-yr average of inputsand outputs over the previous 5 years. A negative balance indicates thatmore P is being removed from the soil than is being added and thus itcould be deficient. This will be discussed later when we discuss the cor-rect rate.
As shown in Figure 8, the P budget reflects soil P (Olsen-P) status. As the
California Rice Production Workshop, 2013-1
6.13

P budget becomes more negative, the soil becomes increasingly P defi-cient. It is also apparent that where there were significant yield respons-
es to P fertilizer were usuallywere P balance was negativeand Olsen-P values were low.
4R Management
—Right rate—
Before determining the appro-priate P rate, it is first neces-sary to determine if it is evennecessary to apply P fertilizer.This can be best determinedusing the Olsen-P value andthe soil P balance.
Apply no P when there is bothhigh soil P and a positive P bal-ance (yellow circle in Fig. 9).
Apply maintenance P rateswhen soil P values are between6 and 20 ppm (green circle in
Fig. 9). Maintenance rates can be determined from Table 7 depending onwhether or not rice straw is being removed.
Build-up soil P when soil P is less than 6 and there is a negative P bal-ance (red circle in Fig. 9). Pbuild-up rates rates can bedetermined from Table 7depending on whether or notrice straw is being removed.To build up P one would needto add more than the mainte-nance rate.
—Right source—
While there are many differentP fertilizers, most P fertilizersusing in CA rice systems aresome form of ammoniumphosphate (contains both Nand P). In order to meet our Nmanagement objectives ofapplying as much N as possi-ble in aqua form, the P fertiliz-er with the lowest N content
California Rice Production Workshop, 2013-1
6.14
Figure 8. The relationship between soil Olsen-P values, P balance and yieldresponse to P fertilizer. Data are from on-farm studies and the P balance reflectsthe 5 yr average of inputs and outputs. The open diamonds indicate a study in
which there was a significant yield response to add P fertilizer.
Figure 9. The relationship between soil Olsen-P values, P balance and yieldresponse to P fertilizer. Circles indicate fields in which different P management
strategies need to be used.

California Rice Production Workshop, 2013-1
6.15
Table X. Charts relating rice yield with how much P (expressed in fertilizer equivalents-P2O5) is removed from thesoil. The chart on the left assumes only grain is removed while the chart on the right is for when grain is removed andhalf of the rice straw.
To determine P balance first determine P outputs. To do this determine average yields from field over past 5 years.Based on if straw was removed or not choose appropriate chart. The amount of P removed based on average yields willbe the value under the “0” P fertilizer added or removed column. For example if average yields were 85 cwt and onlygrain was removed then the amount of P removed was 44 lb/ac.
Grain yield(cwt@14%)
P fertilizer added (pounds P2O5/ac)
0 5 10 15 20 25 30 35 40 45 50 55 60 65 70P balance (pounds P2O5/ac)
50 -26 -21 -16 -11 -6 -1 4 9 14 19 24 29 34 39 4455 -29 -24 -19 -14 -9 -4 1 6 11 16 21 26 31 36 4160 -30 -26 -21 -16 -11 -6 -1 4 9 14 19 24 29 34 3965 -34 -29 -24 -19 -14 -9 -4 1 6 11 16 21 26 31 3670 -37 -32 -27 -22 -17 -12 -7 -2 3 8 13 18 23 28 3375 -39 -34 -29 -24 -19 -14 -9 -4 1 6 11 16 21 26 3180 -42 -37 -32 -27 -22 -17 -12 -7 -2 3 8 13 18 23 2885 -44 -39 -34 -29 -24 -19 -14 -9 -4 1 6 11 16 21 2690 -47 -42 -37 -32 -27 -22 -17 -12 -7 -2 3 8 13 18 2395 -50 -45 -40 -35 -30 -24 -20 -15 -10 -5 0 5 10 15 20
100 -52 -47 -42 -37 -32 -27 -22 -17 -12 -7 -2 3 8 13 18105 -55 -50 -45 -40 -35 -30 -25 -20 -15 -10 -5 0 5 10 15110 -57 -52 -47 -42 -37 -32 -27 -22 -17 -12 -7 -2 3 8 13
Grain yield(cwt@14%)
P fertilizer added (pounds P2O5/ac)
0 5 10 15 20 25 30 35 40 45 50 55 60 65 70P balance (pounds P2O5/ac)
50 -31 -26 -21 -16 -11 -6 -1 4 9 14 19 24 29 34 3955 -34 -29 -24 -19 -14 -9 -4 1 6 11 16 21 26 31 3660 -37 -32 -27 -22 -17 -12 -7 -2 3 8 13 18 23 28 3365 -40 -35 -30 -25 -20 -15 -10 -5 0 5 10 15 20 25 3070 -43 -38 -33 -28 -23 -18 -13 -8 -3 2 7 12 17 22 2775 -46 -41 -36 -31 -26 -21 -16 -11 -6 -1 4 9 14 19 2480 -49 -44 -39 -34 -29 -24 -19 -14 -9 -4 1 6 11 16 2185 -52 -47 -42 -37 -32 -27 -22 -17 -12 -7 -2 3 8 13 1890 -55 -50 -45 -40 -35 -30 -25 -20 -15 -10 -5 0 5 10 1595 -58 -53 -48 -43 -38 -33 -28 -23 -18 -13 -8 -3 2 7 12
100 -61 -56 -51 -46 -41 -36 -31 -26 -21 -16 -11 -6 -1 4 9105 -64 -59 -54 -49 -44 -39 -34 -29 -24 -19 -14 -3 -4 1 6110 -67 -62 -57 -52 -47 -42 -37 -32 -27 -22 -17 -12 -7 -2 3

should be chosen.
—Right time—
Generally speaking, we recommend most of the P being applied duringtillage and seedbed preparation. Most growers will apply a starter blendcontaining P just before flooding the field. To avoid potential algae(scum) problems we recommend this fertilizer be lightly harrowed intothe soil rather than sitting on top of the soil.
If algae is a severe problem, one can manage P fertilizer in a way so as toreduce the algae build-up early in the season. Many studies have shownthat algae increases with increasing P concentration in water. Fertilizer Papplications increase water P concentrations and can lead to increasedalgae build-up in rice fields.
Research has shown thatincorporating P into thesoil or delaying the Papplication by 30 days(or until the rice leaveshave emerged above thesoil surface) can reducealgae problems (or delayalgae growth until it sinot a problem for rice).An example is shown inFigure 10 which showsthat overall, algae variedbetween the differentgrowers. However, inboth cases, algae washighest when it wasapplied on the soil sur-face. Incorporating the P into the soil reduced algae levels by over 50%;however, delaying the P application (applying 30 days after planting)reduced algae levels by almost 90% on average.
It is important that delaying P fertilizer applications does not reduceyields. A number of studies have examined this and results show that infields where P is deficient that delaying P application by up to 28 dayshas no negative effect on yield. However, applications later than this canresult in lower yields (Fig. 11).
One issue related to late P applications is that P can leave the field in therun-off water – a potential off-site pollution concern. Therefore for late Papplications, the water should be held for about 2 weeks after P applica-tion
.
California Rice Production Workshop, 2013-1
6.16
Figure 10. Effect of P fertilizer management (timingand placement) on algal growth in two rice fields

—Right place—
As mentioned above, if P is applied before flooding and planting itshould be lightly incorporated to help reduce algae problems.
Effect of straw management on P managementThe main effect of straw management is whether or not it is removedfrom the field or not. There is approximately 5 to 6 lb P2O5 in every tonof rice straw. Removing straw from the field will affect the soil P budg-et and require that more fertilizer P be added to maintain existing P bal-ances.
4. PotassiumPlant function
Potassium (K) functions in osmoregulation, enzyme activation, regula-tion of stomatal function, transport of assimilates, cell wall synthesis,and cellular pH. Adequate potassium nutrient increases leaf chlorophyllcontents, delays leaf senescence, and therefore contributes greater pho-tosynthesis. It improves the plants tolerance to adverse environmentalconditions and improves tolerance to disease. It remains in ionic formand is very mobile within the plant. Potassium is readily transportedfrom old senescencing to young developing leaves. Yield response topotassium requires sufficient supplies of other nutrients, especiallynitrogen. Similar to nitrogen, potassium uptake rate peaks at the onset ofthe reproductive phase (Figure 1).
Deficiency symptoms
Potassium deficiency show up as dark green plants with yellow/brownleaf margins starting at tip of leaf or dark brown or rusty brown necrot-ic spots on leaf-also starting on leaf tips and margins. These symptomsfirst appear on older leaves, then along leaf edge and finally at leaf base.
California Rice Production Workshop, 2013-1
6.17
Figure 11. Effect of P fertilizer timing on rice yields in two rice fields

Yellow stripes may appearalong leaf interveins and lowerleaves become droopy.
K deficiencies can also lead toincreased diseases in rice. Thisis because K deficiency resultsin an accumulation of sugarsand amino acids that are goodfood sources for pathogens.An example of this is show inFigure 12 where aggregatesheath spot severity increaseswhen K concentrations are lowin the leaf.
Soil potassium
Potassium (K) is present in soils in four forms, which are in dynamicequilibrium. The forms are soluble K (readily available); exchangeable K(easily mobilized reserve); non-exchangeable K (slowly mobilized); andmineral K (semi-permanent reserve). Only about 1 - 2 % of the totalpotassium in a mineral soil is readily available for plant uptake. Undercertain conditions, fertilizer potassium is fixed by the soil colloids andtherefore not readily available to the plant. Clays of 2:1 type, such asmontmorillinite, commonly found in the Sacramento Valley can readilyfix large amounts of potassium. Wet-dry cycles and presence of limeinfluences the magnitude of the fixation. Under continuous flooding,plant uptake favors the release of fixed potassium.
Determining a deficiency
A number of factors can lead to a soil being deficient in K and, apartfrom visual plant symptoms or soil/tissuetests, these can be used as a guide in deter-mining if K deficiencies are likely. InCalifornia, in a study of over 30 fields the onlyfields having soil K values below 100 ppmwere located east of the Sacramento River.Lower soil K values were observed as onemoved further east to the red soils nearer thefoothills. While differences in soil K is due inpart to differences in soil type, the irrigationwater supplied to rice soils in these regionsalso varies. Irrigation water from theSacramento River which supplies much of theirrigation on the west side of the valley ismuch higher in K than in the Feather River orother Sierra rivers which supply water on theeast side (Fig. 13). Over time, these differences
California Rice Production Workshop, 2013-1
6.18
Figure 12. Aggregate sheath spot (AgSS) rat-ing as affected by Y-leaf (at panicle initiation)
K concentration.
Figure 13. Irrigation water potassium concentrations. Sierrarivers include the Yuba River and Bear River. Irrigationwater was sampled from clean (not recycled) irrigation
canals during the 2012 growing season.

in K concentration couldaffect soil K values; howeverthese differences also affecthow much K fertilizer mayneed to be recommended.
Soil
A soil test is a good way todetermine if a soil is defi-cient in K fertilizer. Criticallevels at which a soil is con-sidered deficient varies withfigures ranging from 60 to 85ppm. However, in recentresearch where soil K valueswere compared to flag leaf Kconcentrations, it was appeared that where soil K values were above 100ppm that flag leaf K values were high (between 1.4 and 1.8%) and unaf-fected by soil K (Fig. 14). However, when soil K was below 100 ppm(only two fields), flag leaf were lower and around the level considered tobe deficient (see below). Therefore, taking a conservative approach,when soil K values are 100 ppm or below the soil may be deficient in K.
Plant leaf tissue
To determine a K deficiency using plant tissue, Y-leaf samples can betaken between tillering and panicle initiation or a flag leaf sample can betaken at heading or flowering. Critical values for tissue samples takenduring this time are 1.5% for Y-leaf samples or 1.2% for flag leaf samples.Data from Figure 14 also confirm that flag leaf samples of about 1.2% aredeficient in K.
4R Management
—Right rate—
Average K fertilizer rates used in California are about 30 lb K2O/ac.Potassium fertilizer rates will depend on a number of factors includingsoil test value, straw management, and irrigation water source. Giventhat relatively few fields in California are deficient in K, there has notbeen a focused effort at calibrating soil test values to K application rates.Here we provide a few guidelines.
1. To maintain soil K based on nutrient removal in harvest considerthat about 5 to 6 lb K2O/ton is removed in grain and 33 lb K2O/tonin straw. Therefore, with a grain yield of 85 cwt, if only grain is har-vested and the straw stays in the field, 24 lb K2O is removed.However, if 2 ton/ac of straw is also removed then an additional66 lb K2O/ac is removed. To simply maintain soil K levels then is
California Rice Production Workshop, 2013-1
6.19
Figure 14. The relationship between soil K and flag leaf K values(taken at flowering) in fields where K fertilizer was not applied.

very different depending on how straw is managed.
2. If irrigation water is from the Sacramento River, then K rates can bereduced by about 5 lb/ac.
3. High water flow rates during the winter flood can lead to high Klosses from field during the winter.
—Right source—
The main source used in California is muriate of potash (or KCl) whichcontains 60 to 62% K2O. Sulfate of potash (potassium sulfate – K2SO4) isanother option and this contains 50 to 53% K2O. Sulfate of potash is usu-ally more expensive but could be considered if the high chloride contentof KCL is a concern or if sulfur deficiencies are of concern. Various fer-tilizer blends used in rice (i.e. 15-15-15) are usually made from one of theK sources blended with other N and P sources.
—Right time—
Usually K fertilizer is applied at planting or early in the season (in starterblends) where it is most beneficial and effective. If K deficiency symp-toms appear early in the season it may be possible to correct deficiencywith an application of K fertilizer. Research from Asia has shownresponses to K fertilization as late as flowering. However, in most of therice soils in CA which require relatively low rates and soils are heavyclays a single application at the start of the season is adequate.
—Right place—
If K is applied before flooding it should be lightly incorporated into thesoil. This is of benefit to ensuring maximum use of the K fertilizer andalso the P and N fertilizer in the starter blend.
Effect of straw management on K fertilityIncorporation of rice straw adds significant potassium to the soil. Theaverage concentration of potassium in the straw is around 1.4% with arange of 0.6 to 1.8%. The amount of potassium removed when straw isbaled can be as much as 90 lb/a. The continual removal of straw canhave a profound effect on available soil potassium levels. Results fromthe Rice Experiment Station showed that the extractable potassium in thetop inches declined to less than 60 ppm after 3 years of baling. Field stud-ies in District 10 demonstrated that straw removal reduced soil potassi-um 30 ppm after one year.
5. Other nutrientsZinc
Plant Function. Zinc (Zn) is essential for numerous biochemical process-es, such as chlorophyll production, enzyme activation, and nucleotide
California Rice Production Workshop, 2013-1
6.20

synthesis.
Soil Zinc. Zinc deficiency, originally called “alkali disease,” is commonin high pH, sodic soils, and in areas where the topsoil has been removedby land leveling or where irrigation water is high in bicarbonate (>4milli-equivalents [meq]). In zinc-deficient soils (< 0.5 ppm), rice seedlinggrowth may be reduced and, in severe cases, stand loss may occur.Preflood surface applications of 2 to 16 pounds per acre of actual Zn,depending on the source, have effectively corrected this deficiency. Zincdeficiency occurs more frequently in cool weather during stand estab-lishment. Zinc fertilizer in the form of zinc sulfate, zinc oxide, or zincchelate is broadcast or sprayed on the soil surface after the last seedbedtillage for maximum effectiveness.
Zinc deficiencies: There is very little translocation from old to newleaves. Consequently, deficiency symptoms are more pronounced on theyoung leaves. Plants may grow out of Zn deficiencies early in the season.Severe Zn deficiencies reduce tillering, delays crop maturity and canincrease spikelet sterility. Midribs near the base of young leaves becomecholorotic and older leaves become droopy and turn brown. Overallplant growth is stunted and leaf blade size is reduced.
The Y-leaf at tillering should have a zinc concentration of 25-50 ppm. Ifit is below 20 ppm it is considered deficient.
Sulfur
Plant Function. Sulfur is a component of proteins and amino acids.Most sulfur in the plant is the organic form, as opposed to inorganicforms. Sulfur concentration in the plant decrease with time.
Soil Sulfur. Rice plants absorb sulfur as sulfate, which has similardynamics in the soil as nitrate. Thus, analysis for soil sulfur is unreli-able and of little value for predicting deficiencies in rice soils. Underflooded conditions, sulfate can change to sulfide and combine with zincand iron to form unavailable compounds. Large amounts of decayingorganic matter may intensify the immobilization of sulfur.
Sulfur deficiencies. Sulfur is not as readily translocated; thus, deficien-cy symptoms are more pronounced on the younger leaves. Overalllight yellowing of the whole plant with the worst of such symptoms inthe younger leaves are signs of low sulfur. Field symptoms are general-ly less uniform than nitrogen deficiencies. While it may be confusedwith nitrogen deficiency, nitrogen deficiency symptoms occur first onthe older leaves. However at the early stages of growth, the two aresometimes difficult to distinguish. Healthy rice shoots at tilleringshould have between 0.15 and 0.30% sulfur. At maturity, if the strawcontains less than 0.06% sulfur it is considered deficient.
Sulfur Fertilizers. Any sulfate containing fertilizer, such as ammonium
California Rice Production Workshop, 2013-1
6.21

sulfate and 16-20-0, will suffice. If either nitrogen or phosphorus arenot needed, gypsum (calcium sulfate) or magnesium sulfate work well.Mixed with aqua, ammonium thiosulfate solution is effective.Elemental sulfur can be used, but plant response will be slower.Application rates of 25 to 50 lb/a sulfur are suggested. Extreme casesmay require more. Preplant applications are best, but topdressing tocorrect a mid-season plant deficiency is also effective. Unlike nitrogen,sulfur deficiencies may be treated late in the season. However, suchlate applications are unlikely to restore the full yield potential.
6. Adjustments for other establishment systemsDrill seeding
In drill (or dry) seeded systems in California, rice is planted and then thefield is flushed one to three times to establish the crop. At about the 3- to4-leaf stage a permanent flood is bought on the field. The best time toapply all fertilizers is just before permanent flood. There have been somethat have recommended a small portion of the N rate (i.e. 25 lb N/ac)being applied at planting. However, research addressing the need forthis preplant N indicates there is no benefit to applying N at that time.Since N is applied when the crop is already established, aqua is not anoption. Usually urea is used as the primary N source. Research evaluat-ing urea versus ammonium sulfate shows no difference between these Nsources. Therefore, unless the soil is deficient is sulfur, there is no bene-fit to ammonium sulfate.
For P and K applications can also be made at permanent flood – at thesame time as the N application. There is no harm in applying these nutri-ents earlier, however if P is being applied, some N is also likely beingapplied and this needs to be accounted for in the overall N rate.
Stale seedbed
From a nutrient management standpoint, the stale seed be presents somechallenges – especially for nitrogen management. Management is a dif-ferent depending of if rice is established by drill or water seeding.
In water-seeded systems, flushing the soil with water prior to planting toinduce weed germination can stimulate N mineralization but it can alsopromote N losses through denitrification. Prior to planting especially itmay be likely that there is a large supply of nitrate in the soil that is lostto denitrification when the field is flooded for planting. Furthermore, theN fertilizer needs to be applied to the soil surface because in staleseedbeds one does not want to disturb the soil after the stale seedbedtreatment. Urea is typically applied, but as discussed above, surfaceapplications of N fertilizer can lead to increased N losses. Theseincreased losses result in the need to apply a higher rate of N fertilizer toachieve desired yields than for conventionally managed water seededsystems (Fig. 15). Research conducted at the Rice Experiment Station has
California Rice Production Workshop, 2013-1
6.22

shown that water seeded stale seedbed systems require about 30 lb N/acmore. Other research has shown that this fertilizer is best applied as ureajust before flooding the field for planting.
In drill-seeded systems there was no difference in N requirementbetween conventional and water seeded systems (Fig. 15). Therefore, itis recommended to apply the same N rate, using urea and at the sametime as one would (just before to permanent flood) in conventionallymanaged drill seeded systems.
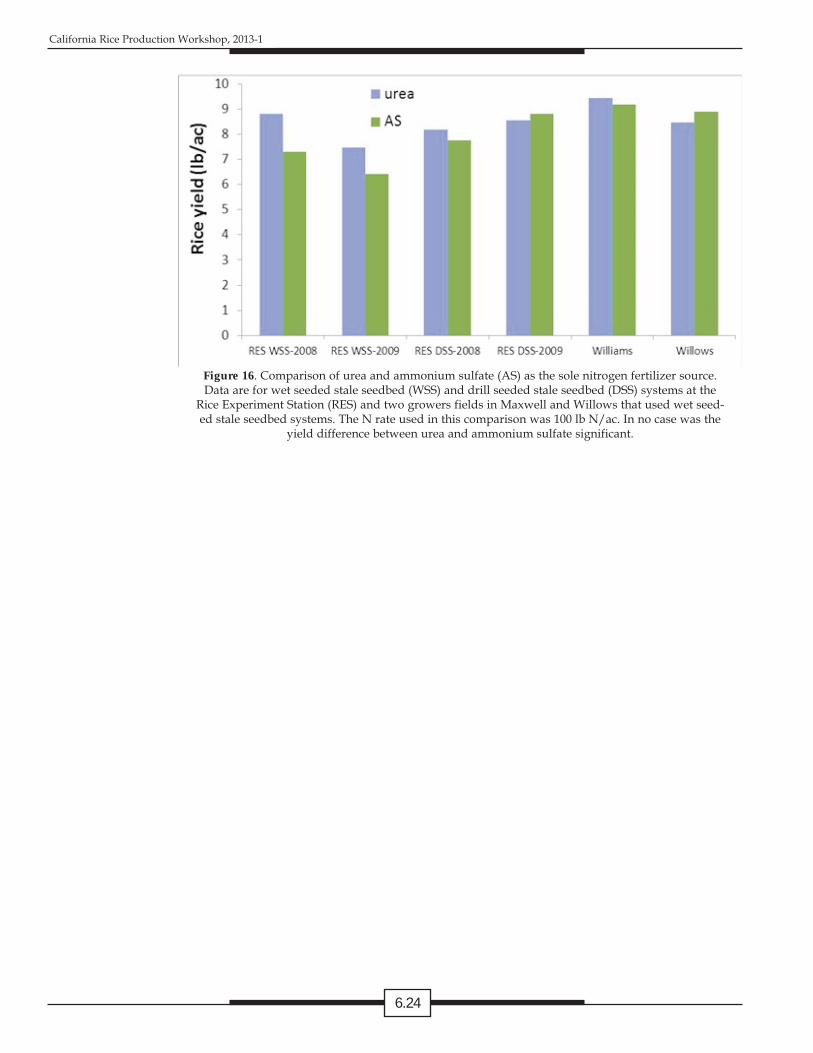
Since fertilizer N needs to be surface applied in stale seedbed systemsthe main fertilizer choices are urea and ammonium sulfate. Researchcomparing these two N sources in both water and drill seeded staleseedbed systems shows no difference (Fig. 16). Unless sulfur is deficientin the soil or the soil is alkaline, urea would be the best choice of fertiliz-er given its high N content (45-46%) and generally more favorable cost.
Phosphorus and potassium fertilizer rates remain the same when usingstale seedbed systems. These nutrients can be applied at the same timeas the N fertilizer.
California Rice Production Workshop, 2013-1
6.23
Figure 15. Grain yield response to N fertilizer in water and drill seeded rice when managed conventionally orwith a stale seedbed. In the water seeded system both a tilled and no-till stale seedbed system was evaluated.
California Rice Production Workshop, 2013-1
6.24
Figure 16. Comparison of urea and ammonium sulfate (AS) as the sole nitrogen fertilizer source.Data are for wet seeded stale seedbed (WSS) and drill seeded stale seedbed (DSS) systems at theRice Experiment Station (RES) and two growers fields in Maxwell and Willows that used wet seed-ed stale seedbed systems. The N rate used in this comparison was 100 lb N/ac. In no case was the
yield difference between urea and ammonium sulfate significant.

California Rice Production Workshop, 2013-1
6.25
Localized on older leaves first
Localized on younger leaves first
Not localized
symptoms
Light
green, nar-
row, short
leaves
Dark green,
narrow,
erect leaves
Green to
dark green
leaves
Chlorotic
necrotic
leaf mar-
gins
Rusty
brown
necrotic
spots
Green &
yellow
stripes run-
ning paral-
lel
Leaf rolling
Orange-
yellow
interveinal
chlorosis,
patchy
Pale overall
color
Green col-
oring
remains
patchy (no
stripes)
Soft,
droopy
leaves and
culms
Light
green, pale
leaves
Chlorotic
upper
leaves
Whole
plant
affected,
but upper
leaves
affected
first
Chlorotic-
necrotic
split or
rolled leaf
tips
Symptoms
only visible
under
severe defi-
ciency
Interveinal
yellowing
and chloro-
sis of
emerging
leaves
Reduced
chlorophyll
content in
leaves
Later, entire
leaves
chlorotic or
whitish
Pale gray-
ish green
interveinal
chlorosis at
the tip of
young
leaves
Necrotic
spotting
Chlorotic
streaks
Blusih
green
leaves
Wilting
young
leaves
White,
rolled leaf
tips of
young
leaves
Death of
growth
point if
severe
Soft, droopy
leaves
Stunted
plants
Poor tiller-
ing
Stunted
plants
Poor tiller-
ing
Shorter
plants
Stunted
plants
Poor tiller-
ing
Stunted
plants
Reduced
tillering
Shorter
plants
Reduced
tillering
Reduced
plant
height
Whole field
appears
yellowish
Early matu-
rity
Delayed
maturity
Early wilt-
ing and
maturity
Unhealthy
root system
Increased
incidence
of diseases
Unhealty
root sys-
tems
Uneven,
patchy
field
growth
Delayed
maturity
Unhealthy
root system
Very rare
in irrigated
rice
Only on dry
soil
Very rare in
irrigated
rice
Only on
dry soil
Very rare
in irrigated
rice
Increased
spikelet
sterility
Panicle
emergence
fails
Very rare
in irrigated
rice
Lodging
Increased inci-
dence of dis-
ease
NP
KMg
ZnS
Ca
FeMn
Cu
BSi
Nutrient deficiency symptoms in rice are mainly expressed in the color and size of the leaves, stems, and roots, plant height and
tillering habit, the development of the root system, and the effect of nutrient deficiency on crop phenology, particularly in terms
of advanced or delayed maturity. Most deficiencies are best detected during early stages of rice growth.


![Biochem 22 [Nucleotides]](https://img.dokumen.tips/doc/110x75/577c82b31a28abe054b1e527/biochem-22-nucleotides.jpg)