Embed Size (px)
Citation preview

8/6/2019 California County Health Status Profiles 2004
http://slidepdf.com/reader/full/california-county-health-status-profiles-2004 1/85

8/6/2019 California County Health Status Profiles 2004
http://slidepdf.com/reader/full/california-county-health-status-profiles-2004 2/85
8/6/2019 California County Health Status Profiles 2004
http://slidepdf.com/reader/full/california-county-health-status-profiles-2004 3/85ii
ACKNOWLEDGMENTS
Steven Shippen, Research Program Specialist, and Cheryl Wilson, Research Analyst,with the Center for Health Statistics, Planning and Data Analysis Section, prepared thisreport. The principal authors would like to extend their appreciation to the followingpeople for their contribution in preparing this report:
Janet Ciarcia (Office of Health Information and Research) composed the formulaswithin the technical notes and coordinated the mass mailing of this report.
Michael Curtis (Maternal and Child Health Branch) provided breastfeeding initiationdata.
Denise Gilson (Division of Communicable Disease Control) provided syphilis andchlamydia case incidence data.
Mary Heim (Department of Finance) provided the 2000 census data and the 2001race/ethnic population estimates by county with age and sex detail, December 1998.
Ann Nakamura (Office of AIDS) provided AIDS case incidence data.
Shu Sebesta (Division of Communicable Disease Control) provided hepatitis C caseincidence data.
Rina Shaikh (Division of Communicable Disease Control) provided measles caseincidence data.
Mich Tashiro and Marie Jungkeit (Office of Health Information and Research)matched the birth and infant death records from the separate Birth and Death StatisticalMaster Files to create the Birth Cohort-Perinatal Outcome Files of linked births anddeaths.
Janice Westenhouse (Tuberculosis Control Program) provided tuberculosis caseincidence data.
The Staff of the Office of Vital Records collected, coded, and edited birth and deathcertificates, which form the basis of the Birth and Death Statistical Master Files.
Cover Photography by Jim Klein: Yosemite Valley from Inspiration Point, includingEl Capitan and Bridal Falls.

8/6/2019 California County Health Status Profiles 2004
http://slidepdf.com/reader/full/california-county-health-status-profiles-2004 4/85

8/6/2019 California County Health Status Profiles 2004
http://slidepdf.com/reader/full/california-county-health-status-profiles-2004 5/85iv
TABLE OF CONTENTS
INTRODUCTION..................................................................................................... 1-2
TABLES WITH HIGHLIGHTS ................................................................................. 3-63
TABLES HEALTH STATUS INDICATORS
1 – 13 MORTALITY INDICATORS PER 100,000 POPULATION
1 All Causes of Death............................................................................................. 3-42 Motor Vehicle Crashes ........................................................................................ 5-63 Unintentional Injuries........................................................................................... 7-84 Firearm Injuries ................................................................................................... 9-105 Homicide .............................................................................................................11-126 Suicide................................................................................................................. 13-147 All Cancer Deaths ............................................................................................... 15-168 Lung Cancer........................................................................................................ 17-18
9 Female Breast Cancer ........................................................................................ 19-2010 Coronary Heart Disease...................................................................................... 21-2211 Cerebrovascular Disease (Stroke) ...................................................................... 23-2412 Drug-Induced Deaths .......................................................................................... 25-2613 Diabetes ..............................................................................................................27-28
14 – 19 MORBIDITY INDICATORS PER 100,000 POPULATION
14 Hepatitis C........................................................................................................... 29-3015 Acquired Immunodeficiency Syndrome (AIDS) ................................................... 31-3216 Tuberculosis ........................................................................................................ 33-3417 Chlamydia ........................................................................................................... 35-3618 Syphilis (Primary and Secondary) ....................................................................... 37
19 Measles ............................................................................................................... 38
20A – 20E BIRTH COHORT INFANT MORTALITY UNDER ONE YEAROF AGE PER 1,000 LIVE BIRTHS
20A All Race/Ethnic Groups Infant Mortality............................................................... 39-4020B Asian/Other Race Group Infant Mortality ............................................................ 41-4220C Black Race Group Infant Mortality....................................................................... 43-4420D Hispanic Ethnic Group Infant Mortality ................................................................ 45-4620E White Race Group Infant Mortality ...................................................................... 47-48
21 – 23B NATALITY INDICATORS PER 100 LIVE BIRTHS OR 1,000
POPULATION
21 Low Birthweight Infants ....................................................................................... 49-5022 Births to Adolescent Mothers, 15-19 Years Old Per 1,000 Live Births................ 51-5223A Prenatal Care Not Begun During The First Trimester ......................................... 53-5423B Adequate/Adequate Plus Prenatal Care (APNCU Index).................................... 55-56
BREASTFEEDING INITIATION RATES PER 100 LIVE BIRTHS
24 Breastfeeding Initiation During Early Postpartum................................................ 57-58

8/6/2019 California County Health Status Profiles 2004
http://slidepdf.com/reader/full/california-county-health-status-profiles-2004 6/85v
TABLE OF CONTENTS (continued)
TABLES HEALTH STATUS INDICATORS
2000 CENSUS POPULATION HEALTH INDICATOR
25 Persons Under 18 Below Poverty .......................................................................59-60
A COMPARISON OF THREE-YEAR AVERAGE DATA
26 A comparison of three-year average data among selected indicators ................ 61-63
TECHNICAL NOTES................................................................................................................... 64-75
Comparison of 1940 and 2000 Standard Population Age-Adjusted Rates(Appendix A)............................................................................................................................. 75
BIBLIOGRAPHY........................................................................................................................... 76
ORDER FORM.............................................................................................................................. 77
NOTES (blank page) ................................................................................................................... 78
8/6/2019 California County Health Status Profiles 2004
http://slidepdf.com/reader/full/california-county-health-status-profiles-2004 7/85
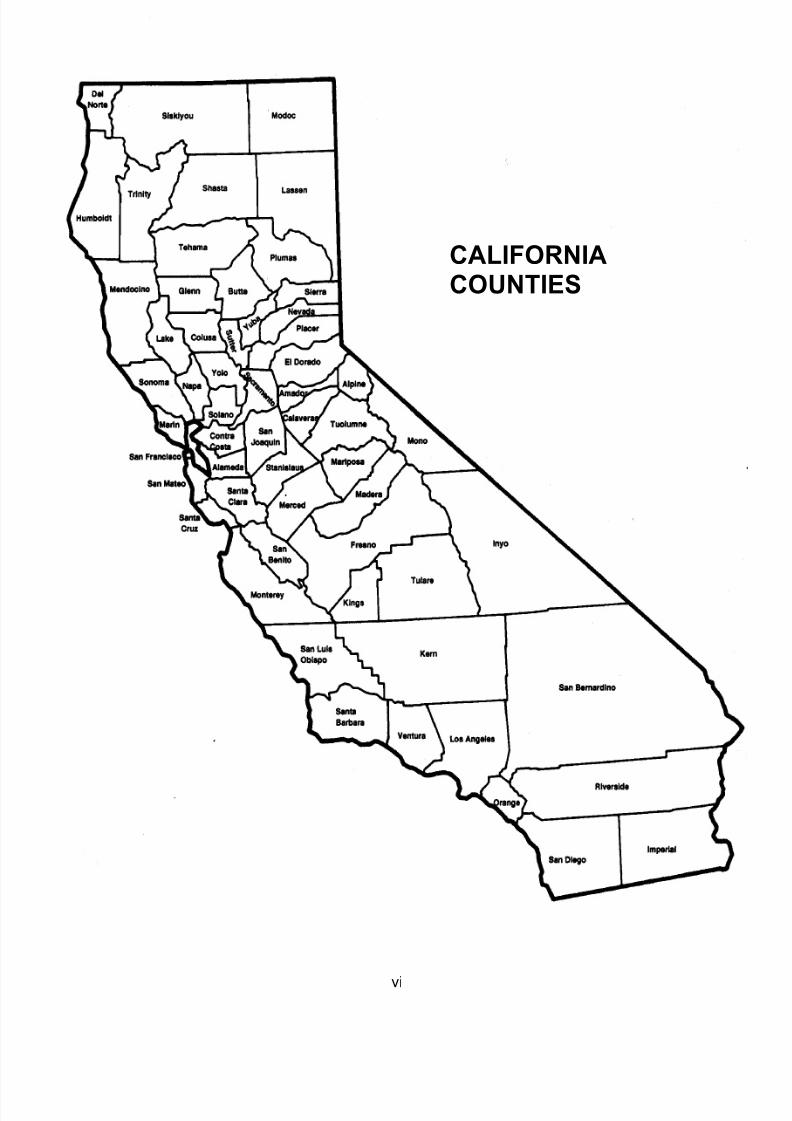
CALIFORNIACOUNTIES
vi

8/6/2019 California County Health Status Profiles 2004
http://slidepdf.com/reader/full/california-county-health-status-profiles-2004 8/85
California Department of Health Services County Health Status Profiles 20041
INTRODUCTION
County Health Status Profiles has been presented annually for the State of California since1993. The purpose of this report is to present public health data that can be directlycompared with clearly established benchmarks, such as national standards, andpopulations of similar composition.
In keeping with the goal of using national standards, two major changes were implementedbeginning with the 2001 report:
Mortality causes of death data were coded using the International Classification of Diseases, Tenth Revision ( reports prior to 2001 used the International Classificationof Diseases, Ninth Revision).
Age-adjusted rates use the 2000 Standard Population (reports prior to 2001 usedthe 1940 Standard Population).
The impact of these changes is discussed in the Technical Notes section of this report.
This report presents vital statistics and morbidity tables that show the population, number of events, percentages, crude rates, and age-adjusted death rates by county. Also shown onthese tables are the upper and lower 95 percent confidence limits, which provide a meansfor assessing the degree of stability of the estimated rates and percentages. Vital statisticsrates and percentages are also subject to random variation, which is inversely related tothe number of events (e.g., deaths) used to calculate the rates and percentages. Therefore,standard errors and relative standard errors (coefficients of variation) are calculated tomeasure the reliability of the rates and percentages. Estimated rates and percentages that
are categorized as unreliable (relative standard error 23 percent) are marked on thesetables with an asterisk ( * ). The counties on these tables are ranked by the rates or percentages, regardless of their reliability, in ascending order. Those with identical rates or percentages are ranked next by the county’s population size in descending order.
The “Highlights” and the explanatory “Notes” are adjacent to each of the tables. Theexplanatory “Notes” as well as the “Technical Notes” are provided to assist the reader withinformation on data limitations and qualifications for correctly interpreting and comparingthese data among the counties. For those who may want to learn more about the problemsassociated with analysis of vital events involving small numbers, small area analysis, andage-adjusted death rates, references to relevant statistical publications are located in theBibliography.
Data for this report have been provided by the California Department of Health Services’Center for Health Statistics, Division of Communicable Disease Control, Genetic DiseaseBranch, and the Office of AIDS. In addition, the Demographic Research Unit and theCensus Data Center of the Department of Finance provided the 2000 census data and the2001 race/ethnicity population estimates by county with age and sex detail,December 1998.

8/6/2019 California County Health Status Profiles 2004
http://slidepdf.com/reader/full/california-county-health-status-profiles-2004 9/85
California Department of Health Services County Health Status Profiles 20042
You may access this report online at the California Department of Health Services webpage. The web page address for the index of publications where this report will be listed is:www.dhs.ca.gov/hisp/chs/OHIR/publication/publicationindex.htm.
If you have questions about this report, or desire additional state or county health statusdata and statistics (either hard copy reports or electronic media), please write or phone:
California Department of Health ServicesCenter for Health Statistics
1616 Capitol Avenue, Suite 74.165MS 5103
P.O. Box 997410Sacramento, CA 95899-7410
Telephone (916) 552-8095
Should you wish additional copies of County Health Status Profiles, instructions for placingyour order appear on page 77 of this report.

8/6/2019 California County Health Status Profiles 2004
http://slidepdf.com/reader/full/california-county-health-status-profiles-2004 10/85
California Department of Health Services County Health Status Profiles 20043
TABLE 1: DEATHS DUE TO ALL CAUSES, 2000-2002
California Counties Ranked by Three-Year Average Age-Adjusted Death Rate
The crude death rate from all causes for California was 656.9 per 100,000
population, a risk of dying equivalent to approximately one death for every 152persons. This rate was based on a three-year average number of deaths of 231,439.0 from 2000 to 2002, and a population of 35,233,335 as of July 1, 2001. Among counties with "reliable" rates, the crude rate ranged from1,260.2 in Lake County to 442.2 in Mono County, a difference in rates by afactor of 2.8 to 1.
The age-adjusted death rate from all causes for California for the three-year period from 2000 to 2002 was 745.0 per 100,000 population. Reliableage-adjusted death rates ranged from 968.9 in Yuba County to 545.0 inMono County.
A Healthy People 2010 National Objective for deaths due to all causes hasnot been established.
Notes:
Death rates are per 100,000 population. The crude death rate is the actual risk of dying. The age-adjustedrate is the hypothetical rate that the State/County would have if its population were distributed by age in thesame proportions as the 2000 United States population.
* Death rate unreliable, relative standard error is greater than or equal to 23 percent.
Counties were rank ordered first by increasing age-adjusted death rate (calculated to 15 decimal places),second by decreasing size of the population. For purposes of this report, rates with a relative standard error of greater than or equal to 23 percent are considered "unreliable." The upper and lower limits of theage-adjusted death rate at the 95 percent confidence level indicate the precision of the estimated death rate.Precision of the death rate decreases as the interval widens. The upper and lower limits define the rangewithin which the death rate probably would occur in 95 out of 100 independent sets of data similar to thepresent set. (For additional information see the Technical Notes, pages 64 through 75.)
DATA SOURCES
Department of Health Services: Death Statistical Master Files, 2000-2002.Department of Finance: 2001 Population Estimates with Age, Sex, and Race/Ethnic Detail, December 1998.

8/6/2019 California County Health Status Profiles 2004
http://slidepdf.com/reader/full/california-county-health-status-profiles-2004 11/85
California Department of Health Services County Health Status Profiles 20044
TABLE 1
DEATHS DUE TO ALL CAUSES
RANKED BY THREE-YEAR AVERAGE AGE-ADJUSTED DEATH RATE
CALIFORNIA COUNTIES, 2000-2002
2000-2002
RANK 2001 DEATHS CRUDE AGE-ADJUSTED 95% CONFIDENCE LIMITS
ORDER COUNTY POPULATION (AVERAGE) DEATH RATE D EATH RATE LOWER UPPER
HEALTHY PEOPLE 2010 NATIONAL OBJECTIVE: NONE ESTABLISHED
1 ALPINE 1,268 5.7 446.9 * 507.3 * 87.2 927.5
2 MONO 11,081 49.0 442.2 545.0 386.1 703.93 SAN BENITO 53,577 269.3 502.7 581.8 512.0 651.5
4 SAN MATEO 759,313 4,716.0 621.1 610.2 592.8 627.7
5 LASSEN 36,759 204.7 556.8 617.6 532.8 702.5
6 COLUSA 22,012 141.3 642.1 628.0 523.8 732.2
7 SANTA CLARA 1,795,132 8,736.3 486.7 636.8 623.2 650.4
8 MARIPOSA 17,218 158.7 921.5 644.2 541.2 747.2
9 NEVADA 99,670 917.0 920.0 649.4 606.4 692.4
10 IMPERIAL 161,177 860.7 534.0 655.3 610.6 699.9
11 SAN FRANCISCO 794,342 6,412.7 807.3 658.4 642.1 674.7
12 SANTA CRUZ 264,525 1,666.3 629.9 659.5 627.5 691.4
13 SAN LUIS OBISPO 262,123 2,009.3 766.6 664.3 634.8 693.7
14 CALAVERAS 43,392 390.3 899.6 664.5 597.0 732.1
15 PLUMAS 21,044 203.3 966.2 666.9 572.7 761.1
16 SIERRA 3,465 36.3 1,048.6 680.1 452.0 908.1
17 MODOC 10,589 96.7 912.9 680.7 542.0 819.418 EL DORADO 168,912 1,151.0 681.4 685.9 646.0 725.8
19 SANTA BARBARA 417,331 2,917.0 699.0 696.4 671.0 721.7
20 MARIN 249,634 1,850.7 741.4 705.6 673.4 737.8
21 MONTEREY 409,511 2,399.0 585.8 720.3 691.3 749.2
22 AMADOR 35,242 380.7 1,080.2 726.9 652.3 801.4
23 MADERA 131,052 898.3 685.5 728.2 680.5 775.9
24 ALAMEDA 1,492,004 9,710.7 650.8 735.9 721.2 750.7
25 VENTURA 763,586 4,775.0 625.3 736.8 715.8 757.8
26 LOS ANGELES 9,925,413 59,464.0 599.1 739.5 733.5 745.5
27 SAN DIEGO 3,005,038 19,616.0 652.8 739.9 729.5 750.3
28 GLENN 30,291 237.0 782.4 743.9 648.3 839.5
CALIFORNIA 35,233,335 231,439.0 656.9 745.0 741.9 748.0
29 CONTRA COSTA 942,662 6,843.7 726.0 746.4 728.7 764.2
30 DEL NORTE 31,801 264.0 830.2 751.2 660.0 842.5
31 SONOMA 468,682 3,857.0 822.9 754.8 730.9 778.832 ORANGE 2,872,632 16,679.3 580.6 757.2 745.6 768.8
33 RIVERSIDE 1,626,134 12,543.3 771.4 757.9 744.5 771.2
34 INYO 18,510 206.7 1,116.5 764.0 656.8 871.1
35 BUTTE 213,040 2,209.0 1,036.9 764.9 732.1 797.6
36 NAPA 129,130 1,276.3 988.4 769.1 726.4 811.9
37 TUOLUMNE 57,497 597.3 1,038.9 785.3 721.3 849.3
38 SUTTER 83,999 698.3 831.4 793.2 734.2 852.2
39 SAN JOAQUIN 593,538 4,420.7 744.8 798.3 774.7 821.9
40 FRESNO 825,365 5,575.7 675.5 799.3 778.2 820.3
41 KINGS 129,375 714.0 551.9 802.8 743.1 862.5
42 TULARE 388,730 2,676.0 688.4 807.1 776.4 837.8
43 YOLO 167,259 1,125.3 672.8 811.1 763.5 858.7
44 PLACER 252,688 2,006.0 793.9 814.2 778.4 849.9
45 MERCED 219,936 1,385.0 629.7 815.6 772.4 858.8
46 MENDOCINO 91,963 830.0 902.5 821.6 765.4 877.7
47 KERN 694,749 4,863.0 700.0 822.3 799.1 845.448 TRINITY 13,605 141.7 1,041.3 823.6 685.2 962.0
49 TEHAMA 57,642 616.0 1,068.7 826.6 760.1 893.0
50 SISKIYOU 45,624 496.3 1,087.9 832.1 757.6 906.6
51 SACRAMENTO 1,236,054 9,314.0 753.5 841.0 823.9 858.2
52 SOLANO 408,095 2,563.3 628.1 841.6 808.4 874.8
53 LAKE 62,080 782.3 1,260.2 849.8 787.2 912.4
54 STANISLAUS 472,096 3,568.3 755.8 859.9 831.6 888.1
55 SHASTA 179,892 1,782.0 990.6 870.2 829.6 910.7
56 SAN BERNARDINO 1,771,707 11,369.0 641.7 885.4 869.0 901.9
57 HUMBOLDT 129,211 1,236.7 957.1 938.1 885.7 990.5
58 YUBA 64,938 525.7 809.5 968.9 885.8 1,052.0

8/6/2019 California County Health Status Profiles 2004
http://slidepdf.com/reader/full/california-county-health-status-profiles-2004 12/85
California Department of Health Services County Health Status Profiles 20045
TABLE 2: DEATHS DUE TO MOTOR VEHICLE CRASHES, 2000-2002
California Counties Ranked by Three-Year Average Age-Adjusted Death Rate
The crude death rate from motor vehicle crashes for California was 10.8 per
100,000 population, a risk of dying equivalent to approximately one death for every 9,284 persons. This rate was based on a three-year average number of deaths of 3,795.0 from 2000 to 2002 and a population of 35,233,335 as of July 1, 2001. Among counties with "reliable" rates, the crude rate ranged from23.6 in Merced County to 5.8 in San Mateo County, a difference in rates by afactor of 4.1 to 1.
The age-adjusted death rate from motor vehicle crashes for California for thethree-year period from 2000 to 2002 was 11.1 per 100,000 population.Reliable age-adjusted death rates ranged from 24.8 in Merced County to 5.9in San Mateo County.
Altogether 11 counties (8 with reliable age-adjusted death rates), but notCalifornia as a whole, met the Healthy People 2010 National Objective of nomore than 9.2 age-adjusted deaths due to motor vehicle crashes per 100,000population.
Notes:
Death rates are per 100,000 population. The crude death rate is the actual risk of dying. The age-adjustedrate is the hypothetical rate that the State/County would have if its population were distributed by age in thesame proportions as the 2000 United States population.
* Death rate unreliable, relative standard error is greater than or equal to 23 percent.+ Standard error indeterminate because the death rate is based on no (zero) deaths.- Upper and lower limits at the 95 percent confidence level are not calculated for zero deaths.
Counties were rank ordered first by increasing age-adjusted death rate (calculated to 15 decimal places),second by decreasing size of the population. For purposes of this report, rates with a relative standard error of greater than or equal to 23 percent are considered “unreliable.” The upper and lower limits of theage-adjusted death rate at the 95 percent confidence level indicate the precision of the estimated death rate.Precision of the death rate decreases as the interval widens. The upper and lower limits define the range
within which the death rate probably would occur in 95 out of 100 independent sets of data similar to thepresent set. (For additional information see the Technical Notes, pages 64 through 75.)
DATA SOURCES
Department of Health Services: Death Statistical Master Files, 2000-2002.Department of Finance: 2001 Population Estimates with Age, Sex, and Race/Ethnic Detail, December 1998.

8/6/2019 California County Health Status Profiles 2004
http://slidepdf.com/reader/full/california-county-health-status-profiles-2004 13/85
California Department of Health Services County Health Status Profiles 20046
TABLE 2
DEATHS DUE TO MOTOR VEHICLE CRASHES
RANKED BY THREE-YEAR AVERAGE AGE-ADJUSTED DEATH RATE
CALIFORNIA COUNTIES, 2000-2002
2000-2002
RANK 2001 DEATHS CRUDE AGE-ADJUSTED 95% CONFIDENCE LIMITS
ORDER COUNTY POPULATION (AVERAGE) DEATH RATE DEATH RATE LOWER UPPER
1 ALPINE 1,268 0.0 0.0 + 0.0 + - -
2 SAN MATEO 759,313 44.3 5.8 5.9 4.2 7.7
3 MARIN 249,634 15.7 6.3 * 6.1 * 3.0 9.1
4 SAN FRANCISCO 794,342 57.0 7.2 7.0 5.2 8.9
5 SANTA CLARA 1,795,132 131.7 7.3 7.8 6.4 9.1
6 SANTA BARBARA 417,331 33.0 7.9 7.9 5.2 10.6
7 ALAMEDA 1,492,004 115.3 7.7 8.0 6.5 9.4
8 ORANGE 2,872,632 215.0 7.5 8.1 7.0 9.2
9 CONTRA COSTA 942,662 75.7 8.0 8.2 6.3 10.0
10 YOLO 167,259 15.0 9.0 * 8.5 * 4.0 13.0
11 LOS ANGELES 9,925,413 850.7 8.6 9.1 8.5 9.7
HEALTHY PEOPLE 2010 NATIONAL OBJECTIVE: 9.2
12 SAN DIEGO 3,005,038 275.7 9.2 9.4 8.2 10.5
13 SANTA CRUZ 264,525 25.3 9.6 9.5 5.8 13.3
14 SOLANO 408,095 38.7 9.5 9.8 6.7 12.9
15 SONOMA 468,682 47.3 10.1 9.9 7.1 12.8
16 PLACER 252,688 26.0 10.3 10.4 6.4 14.5
17 VENTURA 763,586 77.3 10.1 10.5 8.1 12.8CALIFORNIA 35,233,335 3,795.0 10.8 11.1 10.7 11.4
18 NAPA 129,130 15.7 12.1 * 11.7 * 5.8 17.5
19 SAN LUIS OBISPO 262,123 31.3 12.0 11.8 7.6 16.0
20 EL DORADO 168,912 19.7 11.6 11.9 6.6 17.2
21 SACRAMENTO 1,236,054 149.7 12.1 12.4 10.4 14.4
22 COLUSA 22,012 2.7 12.1 * 12.5 * 0.0 27.8
23 NEVADA 99,670 13.0 13.0 * 12.5 * 5.5 19.6
24 MONTEREY 409,511 51.3 12.5 13.0 9.4 16.6
25 INYO 18,510 3.3 18.0 * 14.6 * 0.0 30.7
26 LASSEN 36,759 5.7 15.4 * 14.8 * 2.5 27.2
27 SIERRA 3,465 0.7 19.2 * 15.3 * 0.0 52.0
28 SAN BERNARDINO 1,771,707 261.3 14.8 15.6 13.6 17.5
29 RIVERSIDE 1,626,134 254.0 15.6 15.9 14.0 17.9
30 BUTTE 213,040 35.7 16.7 16.1 10.8 21.5
31 IMPERIAL 161,177 24.0 14.9 16.3 9.6 23.132 SISKIYOU 45,624 8.3 18.3 * 17.2 * 5.3 29.1
33 HUMBOLDT 129,211 23.0 17.8 17.5 10.3 24.7
34 SHASTA 179,892 33.0 18.3 18.1 11.9 24.3
35 SAN JOAQUIN 593,538 107.3 18.1 18.4 14.9 21.9
36 KERN 694,749 123.0 17.7 18.5 15.2 21.8
37 MENDOCINO 91,963 17.3 18.8 * 18.5 * 9.7 27.3
38 SAN BENITO 53,577 9.7 18.0 * 18.5 * 6.8 30.3
39 STANISLAUS 472,096 88.3 18.7 19.0 15.0 23.0
40 TUOLUMNE 57,497 11.3 19.7 * 19.0 * 7.8 30.3
41 LAKE 62,080 13.0 20.9 * 19.9 * 8.8 31.1
42 FRESNO 825,365 155.0 18.8 20.0 16.8 23.1
43 AMADOR 35,242 7.7 21.8 * 20.0 * 5.5 34.6
44 SUTTER 83,999 17.0 20.2 * 20.4 * 10.7 30.1
45 DEL NORTE 31,801 7.0 22.0 * 20.9 * 5.3 36.5
46 YUBA 64,938 14.0 21.6 * 21.6 * 10.1 33.047 TULARE 388,730 81.0 20.8 21.7 16.9 26.6
48 TEHAMA 57,642 13.3 23.1 * 22.1 * 9.8 34.3
49 PLUMAS 21,044 5.0 23.8 * 22.1 * 2.1 42.0
50 KINGS 129,375 28.7 22.2 23.4 14.6 32.2
51 MADERA 131,052 30.7 23.4 23.6 15.1 32.0
52 MERCED 219,936 52.0 23.6 24.8 17.9 31.6
53 MODOC 10,589 3.3 31.5 * 26.4 * 0.0 55.0
54 CALAVERAS 43,392 12.7 29.2 * 28.1 * 12.1 44.1
55 MARIPOSA 17,218 5.0 29.0 * 29.1 * 2.9 55.3
56 GLENN 30,291 8.3 27.5 * 29.3 * 9.3 49.3
57 MONO 11,081 3.3 30.1 * 32.7 * 0.0 69.3
58 TRINITY 13,605 5.0 36.8 * 33.6 * 3.0 64.1

8/6/2019 California County Health Status Profiles 2004
http://slidepdf.com/reader/full/california-county-health-status-profiles-2004 14/85
California Department of Health Services County Health Status Profiles 20047
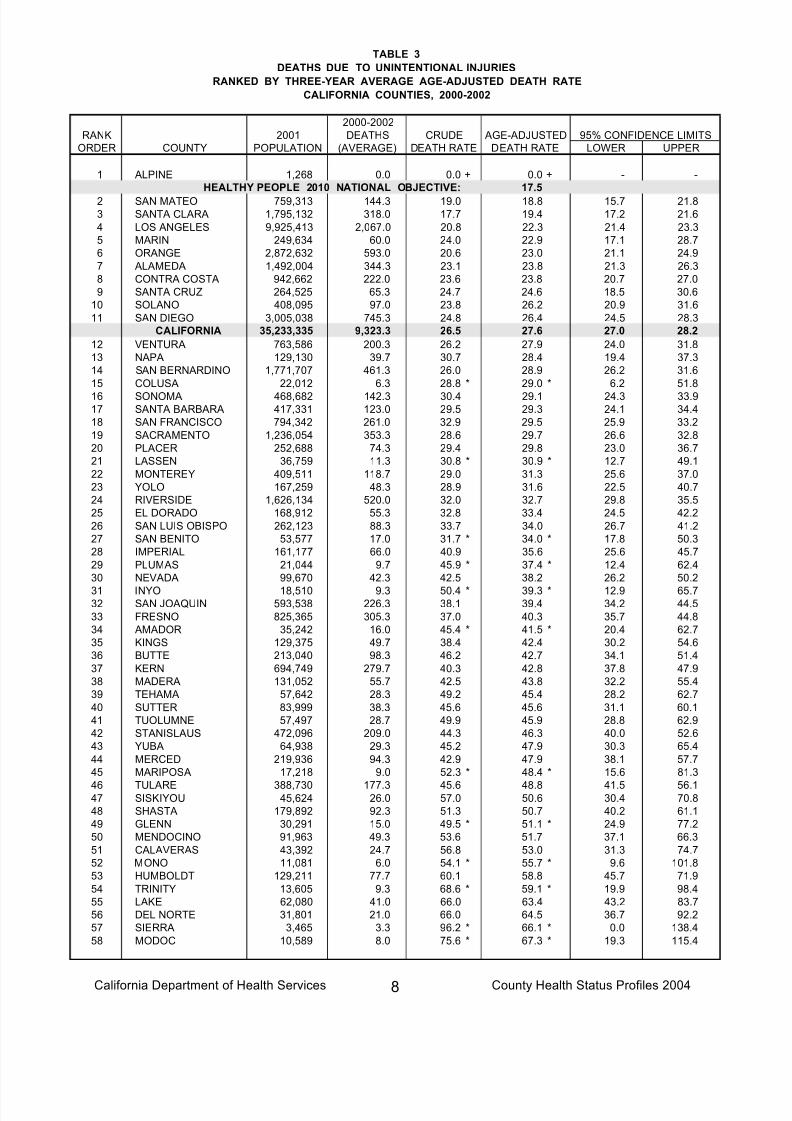
TABLE 3: DEATHS DUE TO UNINTENTIONAL INJURIES, 2000-2002
California Counties Ranked by Three-Year Average Age-Adjusted Death Rate
The crude death rate from unintentional injuries for California was 26.5 per
100,000 population, a risk of dying equivalent to approximately one death for every 3,779 persons. This rate was based on a three-year average number of deaths of 9,323.3 from 2000 to 2002 and a population of 35,233,335 as of July 1, 2001. Among counties with "reliable" rates, the crude rate ranged from66.0 in Del Norte and Lake Counties to 17.7 in Santa Clara County, adifference in rates by a factor of 3.7 to 1.
The age-adjusted death rate from unintentional injuries for California for thethree-year period from 2000 to 2002 was 27.6 per 100,000 population.
Reliable age-adjusted death rates ranged from 64.5 in Del Norte County to18.8 in San Mateo County.
Altogether one county (with an unreliable age-adjusted death rate), but notCalifornia as a whole, met the Healthy People 2010 National Objective of nomore than 17.5 age-adjusted deaths due to unintentional injuries per 100,000population.
Notes:
Death rates are per 100,000 population. The crude death rate is the actual risk of dying. The age-adjustedrate is the hypothetical rate that the State/County would have if its population were distributed by age in thesame proportions as the 2000 United States population.
* Death rate unreliable, relative standard error is greater than or equal to 23 percent.+ Standard error indeterminate because the death rate is based on no (zero) deaths.- Upper and lower limits at the 95 percent confidence level are not calculated for zero deaths.
Counties were rank ordered first by increasing age-adjusted death rate (calculated to 15 decimal places),second by decreasing size of the population. For purposes of this report, rates with a relative standard error of greater than or equal to 23 percent are considered “unreliable.” The upper and lower limits of theage-adjusted death rate at the 95 percent confidence level indicate the precision of the estimated death rate.Precision of the death rate decreases as the interval widens. The upper and lower limits define the range
within which the death rate probably would occur in 95 out of 100 independent sets of data similar to thepresent set. (For additional information see the Technical Notes, pages 64 through 75.)
DATA SOURCES
Department of Health Services: Death Statistical Master Files, 2000-2002.Department of Finance: 2001 Population Estimates with Age, Sex, and Race/Ethnic Detail, December 1998.
8/6/2019 California County Health Status Profiles 2004
http://slidepdf.com/reader/full/california-county-health-status-profiles-2004 15/85
California Department of Health Services County Health Status Profiles 20048
TABLE 3
DEATHS DUE TO UNINTENTIONAL INJURIES
RANKED BY THREE-YEAR AVERAGE AGE-ADJUSTED DEATH RATE
CALIFORNIA COUNTIES, 2000-2002
2000-2002
RANK 2001 DEATHS CRUDE AGE-ADJUSTED 95% CONFIDENCE LIMITS
ORDER COUNTY POPULATION (AVERAGE) DEATH RATE DEATH RATE LOWER UPPER
1 ALPINE 1,268 0.0 0.0 + 0.0 + - -
HEALTHY PEOPLE 2010 NATIONAL OBJECTIVE: 17.5
2 SAN MATEO 759,313 144.3 19.0 18.8 15.7 21.8
3 SANTA CLARA 1,795,132 318.0 17.7 19.4 17.2 21.6
4 LOS ANGELES 9,925,413 2,067.0 20.8 22.3 21.4 23.3
5 MARIN 249,634 60.0 24.0 22.9 17.1 28.7
6 ORANGE 2,872,632 593.0 20.6 23.0 21.1 24.9
7 ALAMEDA 1,492,004 344.3 23.1 23.8 21.3 26.3
8 CONTRA COSTA 942,662 222.0 23.6 23.8 20.7 27.0
9 SANTA CRUZ 264,525 65.3 24.7 24.6 18.5 30.6
10 SOLANO 408,095 97.0 23.8 26.2 20.9 31.6
11 SAN DIEGO 3,005,038 745.3 24.8 26.4 24.5 28.3
CALIFORNIA 35,233,335 9,323.3 26.5 27.6 27.0 28.2
12 VENTURA 763,586 200.3 26.2 27.9 24.0 31.8
13 NAPA 129,130 39.7 30.7 28.4 19.4 37.3
14 SAN BERNARDINO 1,771,707 461.3 26.0 28.9 26.2 31.6
15 COLUSA 22,012 6.3 28.8 * 29.0 * 6.2 51.8
16 SONOMA 468,682 142.3 30.4 29.1 24.3 33.917 SANTA BARBARA 417,331 123.0 29.5 29.3 24.1 34.4
18 SAN FRANCISCO 794,342 261.0 32.9 29.5 25.9 33.2
19 SACRAMENTO 1,236,054 353.3 28.6 29.7 26.6 32.8
20 PLACER 252,688 74.3 29.4 29.8 23.0 36.7
21 LASSEN 36,759 11.3 30.8 * 30.9 * 12.7 49.1
22 MONTEREY 409,511 118.7 29.0 31.3 25.6 37.0
23 YOLO 167,259 48.3 28.9 31.6 22.5 40.7
24 RIVERSIDE 1,626,134 520.0 32.0 32.7 29.8 35.5
25 EL DORADO 168,912 55.3 32.8 33.4 24.5 42.2
26 SAN LUIS OBISPO 262,123 88.3 33.7 34.0 26.7 41.2
27 SAN BENITO 53,577 17.0 31.7 * 34.0 * 17.8 50.3
28 IMPERIAL 161,177 66.0 40.9 35.6 25.6 45.7
29 PLUMAS 21,044 9.7 45.9 * 37.4 * 12.4 62.4
30 NEVADA 99,670 42.3 42.5 38.2 26.2 50.2
31 INYO 18,510 9.3 50.4 * 39.3 * 12.9 65.732 SAN JOAQUIN 593,538 226.3 38.1 39.4 34.2 44.5
33 FRESNO 825,365 305.3 37.0 40.3 35.7 44.8
34 AMADOR 35,242 16.0 45.4 * 41.5 * 20.4 62.7
35 KINGS 129,375 49.7 38.4 42.4 30.2 54.6
36 BUTTE 213,040 98.3 46.2 42.7 34.1 51.4
37 KERN 694,749 279.7 40.3 42.8 37.8 47.9
38 MADERA 131,052 55.7 42.5 43.8 32.2 55.4
39 TEHAMA 57,642 28.3 49.2 45.4 28.2 62.7
40 SUTTER 83,999 38.3 45.6 45.6 31.1 60.1
41 TUOLUMNE 57,497 28.7 49.9 45.9 28.8 62.9
42 STANISLAUS 472,096 209.0 44.3 46.3 40.0 52.6
43 YUBA 64,938 29.3 45.2 47.9 30.3 65.4
44 MERCED 219,936 94.3 42.9 47.9 38.1 57.7
45 MARIPOSA 17,218 9.0 52.3 * 48.4 * 15.6 81.3
46 TULARE 388,730 177.3 45.6 48.8 41.5 56.147 SISKIYOU 45,624 26.0 57.0 50.6 30.4 70.8
48 SHASTA 179,892 92.3 51.3 50.7 40.2 61.1
49 GLENN 30,291 15.0 49.5 * 51.1 * 24.9 77.2
50 MENDOCINO 91,963 49.3 53.6 51.7 37.1 66.3
51 CALAVERAS 43,392 24.7 56.8 53.0 31.3 74.7
52 MONO 11,081 6.0 54.1 * 55.7 * 9.6 101.8
53 HUMBOLDT 129,211 77.7 60.1 58.8 45.7 71.9
54 TRINITY 13,605 9.3 68.6 * 59.1 * 19.9 98.4
55 LAKE 62,080 41.0 66.0 63.4 43.2 83.7
56 DEL NORTE 31,801 21.0 66.0 64.5 36.7 92.2
57 SIERRA 3,465 3.3 96.2 * 66.1 * 0.0 138.4
58 MODOC 10,589 8.0 75.6 * 67.3 * 19.3 115.4

8/6/2019 California County Health Status Profiles 2004
http://slidepdf.com/reader/full/california-county-health-status-profiles-2004 16/85
California Department of Health Services County Health Status Profiles 20049
TABLE 4: DEATHS DUE TO FIREARM INJURIES, 2000-2002
California Counties Ranked by Three-Year Average Age-Adjusted Death Rate
The crude death rate from firearm injuries for California was 9.2 per 100,000
population, a risk of dying equivalent to approximately one death for every10,837 persons. This rate was based on the three-year average number of deaths from 2000 to 2002 of 3,251.3 and a population of 35,233,335 as of July 1, 2001. Among counties with "reliable" rates, the crude rate ranged from16.3 in Humboldt County to 3.7 in Santa Clara County, a difference in rates bya factor of 4.4 to 1.
The age-adjusted death rate from firearm injuries for California for thethree-year period from 2000 to 2002 was 9.5 per 100,000 population.Reliable age-adjusted death rates ranged from 15.8 in Humboldt Countyto 3.9 in Santa Clara County.
Altogether 3 counties (1 with a reliable age-adjusted death rate), but notCalifornia as a whole, met the Healthy People 2010 National Objective of nomore than 4.1 age-adjusted deaths due to firearm-related injuries per 100,000population.
Notes:
Death rates are per 100,000 population. The crude death rate is the actual risk of dying. The age-adjustedrate is the hypothetical rate that the State/County would have if its population were distributed by age in thesame proportions as the 2000 United States population.
* Death rate unreliable, relative standard error is greater than or equal to 23 percent.
Counties were rank ordered first by increasing age-adjusted death rate (calculated to 15 decimal places),second by decreasing size of the population. For purposes of this report, rates with a relative standard error of greater than or equal to 23 percent are considered “unreliable.” The upper and lower limits of theage-adjusted death rate at the 95 percent confidence level indicate the precision of the estimated death rate.Precision of the death rate decreases as the interval widens. The upper and lower limits define the rangewithin which the death rate probably would occur in 95 out of 100 independent sets of data similar to thepresent set. (For additional information see the Technical Notes, pages 64 through 75.)
DATA SOURCES
Department of Health Services: Death Statistical Master Files, 2000-2002.Department of Finance: 2001 Population Estimates with Age, Sex, and Race/Ethnic Detail, December 1998.

8/6/2019 California County Health Status Profiles 2004
http://slidepdf.com/reader/full/california-county-health-status-profiles-2004 17/85
California Department of Health Services County Health Status Profiles 200410
TABLE 4
DEATHS DUE TO FIREARM INJURIES
RANKED BY THREE-YEAR AVERAGE AGE-ADJUSTED DEATH RATE
CALIFORNIA COUNTIES, 2000-2002
2000-2002
RANK 2001 DEATHS CRUDE AGE-ADJUSTED 95% CONFIDENCE LIMITS
ORDER COUNTY POPULATION (AVERAGE) DEATH RATE DEATH RATE LOWER UPPER
1 MODOC 10,589 0.3 3.1 * 2.7 * 0.0 12.1
2 SANTA CLARA 1,795,132 66.7 3.7 3.9 2.9 4.8
3 MARIPOSA 17,218 1.0 5.8 * 4.1 * 0.0 12.4
HEALTHY PEOPLE 2010 NATIONAL OBJECTIVE: 4.1
4 SAN MATEO 759,313 31.0 4.1 4.2 2.7 5.6
5 KINGS 129,375 6.3 4.9 * 4.8 * 0.9 8.7
6 IMPERIAL 161,177 7.0 4.3 * 5.0 * 1.2 8.7
7 MARIN 249,634 13.7 5.5 * 5.2 * 2.4 8.0
8 NAPA 129,130 7.7 5.9 * 5.4 * 1.5 9.3
9 ORANGE 2,872,632 154.0 5.4 5.8 4.8 6.7
10 SANTA BARBARA 417,331 26.3 6.3 6.4 4.0 8.9
11 SAN BENITO 53,577 3.3 6.2 * 6.5 * 0.0 13.6
12 SONOMA 468,682 34.3 7.3 7.1 4.7 9.5
13 SAN FRANCISCO 794,342 50.7 6.4 7.1 5.1 9.1
14 SAN DIEGO 3,005,038 204.7 6.8 7.2 6.2 8.2
15 STANISLAUS 472,096 32.3 6.8 7.2 4.7 9.7
16 SAN LUIS OBISPO 262,123 20.0 7.6 7.3 4.0 10.5
17 VENTURA 763,586 55.3 7.2 7.6 5.6 9.618 SANTA CRUZ 264,525 20.0 7.6 7.8 4.4 11.2
19 YOLO 167,259 12.3 7.4 * 7.9 * 3.4 12.4
20 MONO 11,081 1.0 9.0 * 7.9 * 0.0 23.9
21 PLUMAS 21,044 2.0 9.5 * 8.7 * 0.0 21.5
22 MONTEREY 409,511 35.0 8.5 8.7 5.8 11.6
23 MADERA 131,052 10.7 8.1 * 8.8 * 3.5 14.1
24 PLACER 252,688 22.0 8.7 8.9 5.1 12.6
25 TULARE 388,730 34.3 8.8 9.2 6.1 12.4
CALIFORNIA 35,233,335 3,251.3 9.2 9.5 9.2 9.9
26 MERCED 219,936 19.3 8.8 9.6 * 5.2 13.9
27 FRESNO 825,365 75.7 9.2 9.6 7.4 11.8
28 SOLANO 408,095 36.7 9.0 9.7 6.5 12.8
29 CONTRA COSTA 942,662 89.3 9.5 9.7 7.7 11.8
30 TUOLUMNE 57,497 6.7 11.6 * 9.8 * 2.2 17.4
31 SACRAMENTO 1,236,054 118.0 9.5 9.8 8.1 11.632 NEVADA 99,670 12.0 12.0 * 9.9 * 4.0 15.8
33 EL DORADO 168,912 17.0 10.1 * 9.9 * 5.2 14.7
34 MENDOCINO 91,963 9.7 10.5 * 10.0 * 3.6 16.3
35 RIVERSIDE 1,626,134 161.3 9.9 10.2 8.7 11.8
36 ALAMEDA 1,492,004 150.7 10.1 10.3 8.7 12.0
37 KERN 694,749 69.0 9.9 10.5 8.0 13.0
38 SAN JOAQUIN 593,538 61.3 10.3 10.6 7.9 13.2
39 BUTTE 213,040 24.3 11.4 10.6 6.3 14.9
40 DEL NORTE 31,801 3.7 11.5 * 10.8 * 0.0 22.0
41 TEHAMA 57,642 8.0 13.9 * 12.0 * 3.4 20.5
42 SAN BERNARDINO 1,771,707 202.3 11.4 12.2 10.5 13.9
43 YUBA 64,938 7.3 11.3 * 12.8 * 3.5 22.1
44 LOS ANGELES 9,925,413 1,218.3 12.3 12.9 12.2 13.6
45 SHASTA 179,892 24.3 13.5 13.3 7.9 18.6
46 LAKE 62,080 10.7 17.2 * 13.9 * 5.1 22.847 AMADOR 35,242 5.3 15.1 * 14.5 * 1.8 27.2
48 SISKIYOU 45,624 6.7 14.6 * 14.5 * 3.1 25.9
49 SUTTER 83,999 12.3 14.7 * 14.7 * 6.5 22.9
50 INYO 18,510 3.3 18.0 * 14.9 * 0.0 31.3
51 LASSEN 36,759 5.3 14.5 * 15.0 * 2.1 27.9
52 CALAVERAS 43,392 6.7 15.4 * 15.5 * 3.3 27.7
53 HUMBOLDT 129,211 21.0 16.3 15.8 9.1 22.6
54 COLUSA 22,012 3.3 15.1 * 16.6 * 0.0 34.7
55 GLENN 30,291 5.7 18.7 * 17.1 * 2.9 31.2
56 SIERRA 3,465 0.7 19.2 * 19.4 * 0.0 67.7
57 TRINITY 13,605 3.0 22.1 * 19.8 * 0.0 43.0
58 ALPINE 1,268 0.3 26.3 * 27.5 * 0.0 120.9
8/6/2019 California County Health Status Profiles 2004
http://slidepdf.com/reader/full/california-county-health-status-profiles-2004 18/85
California Department of Health Services County Health Status Profiles 200411
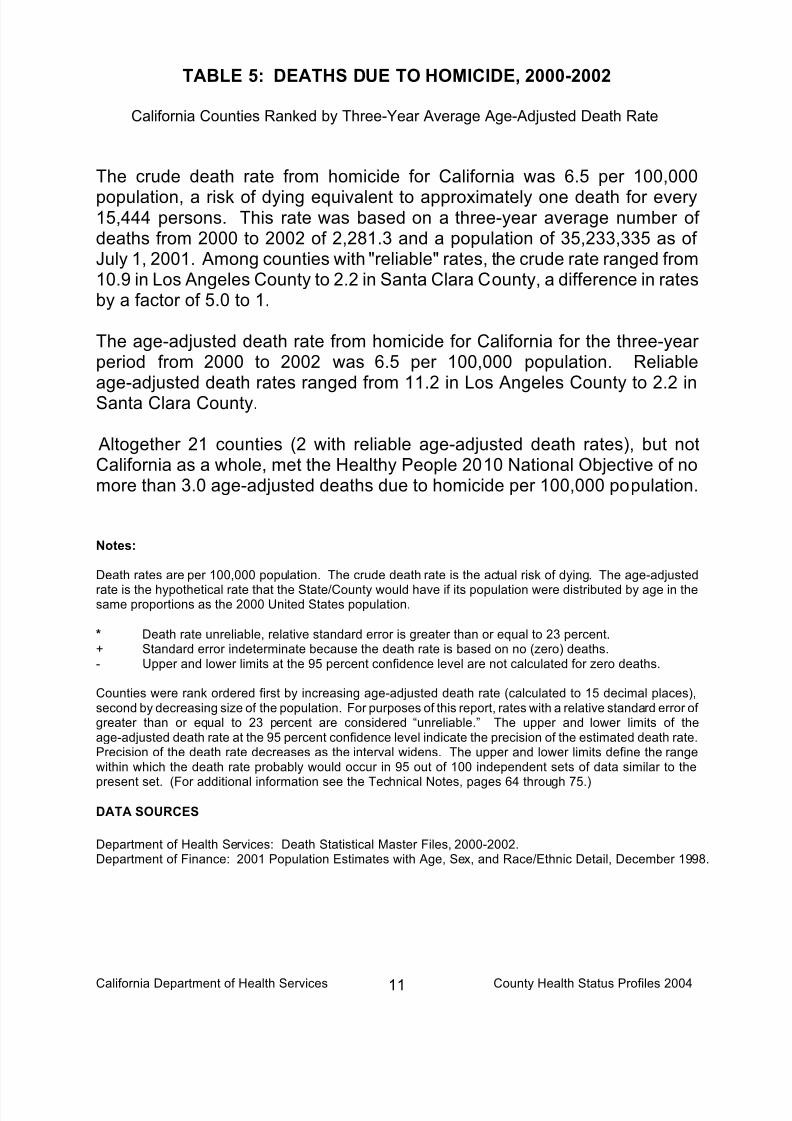
TABLE 5: DEATHS DUE TO HOMICIDE, 2000-2002
California Counties Ranked by Three-Year Average Age-Adjusted Death Rate
The crude death rate from homicide for California was 6.5 per 100,000
population, a risk of dying equivalent to approximately one death for every15,444 persons. This rate was based on a three-year average number of deaths from 2000 to 2002 of 2,281.3 and a population of 35,233,335 as of July 1, 2001. Among counties with "reliable" rates, the crude rate ranged from10.9 in Los Angeles County to 2.2 in Santa Clara County, a difference in ratesby a factor of 5.0 to 1.
The age-adjusted death rate from homicide for California for the three-year period from 2000 to 2002 was 6.5 per 100,000 population. Reliableage-adjusted death rates ranged from 11.2 in Los Angeles County to 2.2 inSanta Clara County.
Altogether 21 counties (2 with reliable age-adjusted death rates), but notCalifornia as a whole, met the Healthy People 2010 National Objective of nomore than 3.0 age-adjusted deaths due to homicide per 100,000 population.
Notes:
Death rates are per 100,000 population. The crude death rate is the actual risk of dying. The age-adjusted
rate is the hypothetical rate that the State/County would have if its population were distributed by age in thesame proportions as the 2000 United States population.
* Death rate unreliable, relative standard error is greater than or equal to 23 percent.+ Standard error indeterminate because the death rate is based on no (zero) deaths.- Upper and lower limits at the 95 percent confidence level are not calculated for zero deaths.
Counties were rank ordered first by increasing age-adjusted death rate (calculated to 15 decimal places),second by decreasing size of the population. For purposes of this report, rates with a relative standard error of greater than or equal to 23 percent are considered “unreliable.” The upper and lower limits of theage-adjusted death rate at the 95 percent confidence level indicate the precision of the estimated death rate.Precision of the death rate decreases as the interval widens. The upper and lower limits define the rangewithin which the death rate probably would occur in 95 out of 100 independent sets of data similar to the
present set. (For additional information see the Technical Notes, pages 64 through 75.)
DATA SOURCES
Department of Health Services: Death Statistical Master Files, 2000-2002.Department of Finance: 2001 Population Estimates with Age, Sex, and Race/Ethnic Detail, December 1998.

8/6/2019 California County Health Status Profiles 2004
http://slidepdf.com/reader/full/california-county-health-status-profiles-2004 19/85
California Department of Health Services County Health Status Profiles 200412
TABLE 5
DEATHS DUE TO HOMICIDE
RANKED BY THREE-YEAR AVERAGE AGE-ADJUSTED DEATH RATE
CALIFORNIA COUNTIES, 2000-2002
2000-2002
RANK 2001 DEATHS CRUDE AGE-ADJUSTED 95% CONFIDENCE LIMITS
ORDER COUNTY POPULATION (AVERAGE) DEATH RATE DEATH RATE LOWER UPPER
1 PLUMAS 21,044 0.0 0.0 + 0.0 + - -
2 INYO 18,510 0.0 0.0 + 0.0 + - -
3 MARIPOSA 17,218 0.0 0.0 + 0.0 + - -
4 MODOC 10,589 0.0 0.0 + 0.0 + - -
5 SIERRA 3,465 0.0 0.0 + 0.0 + - -
6 ALPINE 1,268 0.0 0.0 + 0.0 + - -
7 GLENN 30,291 0.3 1.1 * 0.9 * 0.0 4.1
8 PLACER 252,688 3.7 1.5 * 1.4 * 0.0 2.9
9 NAPA 129,130 2.0 1.5 * 1.5 * 0.0 3.6
10 AMADOR 35,242 0.7 1.9 * 1.6 * 0.0 5.8
11 SAN LUIS OBISPO 262,123 4.3 1.7 * 1.7 * 0.1 3.3
12 MARIN 249,634 4.3 1.7 * 1.8 * 0.1 3.5
13 LAKE 62,080 1.0 1.6 * 1.9 * 0.0 5.8
14 EL DORADO 168,912 3.3 2.0 * 1.9 * 0.0 4.0
15 SANTA CLARA 1,795,132 39.0 2.2 2.2 1.5 2.9
16 SANTA BARBARA 417,331 9.3 2.2 * 2.2 * 0.8 3.6
17 MONO 11,081 0.3 3.0 * 2.2 * 0.0 9.8
18 TUOLUMNE 57,497 1.3 2.3 * 2.4 * 0.0 6.419 SAN MATEO 759,313 18.7 2.5 * 2.6 * 1.4 3.8
20 ORANGE 2,872,632 76.7 2.7 2.8 2.2 3.4
21 SONOMA 468,682 14.0 3.0 * 3.0 * 1.4 4.6
HEALTHY PEOPLE 2010 NATIONAL OBJECTIVE: 3.0
22 SAN DIEGO 3,005,038 97.0 3.2 3.1 2.4 3.7
23 SANTA CRUZ 264,525 8.3 3.2 * 3.1 * 1.0 5.3
24 YOLO 167,259 5.0 3.0 * 3.2 * 0.3 6.2
25 NEVADA 99,670 3.3 3.3 * 3.4 * 0.0 7.2
26 VENTURA 763,586 26.0 3.4 3.5 2.1 4.8
27 SHASTA 179,892 6.0 3.3 * 3.5 * 0.7 6.3
28 KINGS 129,375 5.0 3.9 * 3.9 * 0.3 7.4
29 YUBA 64,938 2.7 4.1 * 3.9 * 0.0 8.7
30 DEL NORTE 31,801 1.3 4.2 * 4.0 * 0.0 10.9
31 BUTTE 213,040 8.7 4.1 * 4.2 * 1.4 7.0
32 MERCED 219,936 10.3 4.7 * 4.4 * 1.7 7.033 CALAVERAS 43,392 1.7 3.8 * 4.4 * 0.0 11.2
34 LASSEN 36,759 1.7 4.5 * 4.5 * 0.0 11.4
35 IMPERIAL 161,177 6.7 4.1 * 4.5 * 1.0 8.1
36 TEHAMA 57,642 2.3 4.0 * 4.6 * 0.0 10.5
37 STANISLAUS 472,096 22.3 4.7 4.8 2.8 6.8
38 SAN BENITO 53,577 2.7 5.0 * 4.9 * 0.0 10.7
39 SISKIYOU 45,624 2.0 4.4 * 4.9 * 0.0 11.9
40 SOLANO 408,095 22.7 5.6 5.5 3.2 7.8
41 SUTTER 83,999 4.7 5.6 * 5.6 * 0.5 10.7
42 MENDOCINO 91,963 5.0 5.4 * 5.7 * 0.6 10.8
43 TULARE 388,730 22.7 5.8 5.7 3.3 8.1
44 SACRAMENTO 1,236,054 73.7 6.0 6.0 4.6 7.4
45 RIVERSIDE 1,626,134 100.0 6.1 6.3 5.0 7.5
46 HUMBOLDT 129,211 8.7 6.7 * 6.4 * 2.1 10.7
CALIFORNIA 35,233,335 2,281.3 6.5 6.5 6.2 6.847 MONTEREY 409,511 27.7 6.8 6.6 4.1 9.1
48 CONTRA COSTA 942,662 61.0 6.5 6.7 5.0 8.4
49 FRESNO 825,365 55.3 6.7 6.8 5.0 8.5
50 KERN 694,749 48.0 6.9 6.9 5.0 8.9
51 MADERA 131,052 9.3 7.1 * 7.0 * 2.4 11.5
52 COLUSA 22,012 1.7 7.6 * 7.8 * 0.0 19.6
53 SAN FRANCISCO 794,342 55.3 7.0 7.8 5.7 10.0
54 SAN BERNARDINO 1,771,707 139.7 7.9 7.9 6.6 9.2
55 SAN JOAQUIN 593,538 47.7 8.0 8.1 5.8 10.4
56 ALAMEDA 1,492,004 125.3 8.4 8.5 7.0 10.0
57 TRINITY 13,605 1.3 9.8 * 8.6 * 0.0 23.6
58 LOS ANGELES 9,925,413 1,079.7 10.9 11.2 10.5 11.9

8/6/2019 California County Health Status Profiles 2004
http://slidepdf.com/reader/full/california-county-health-status-profiles-2004 20/85
California Department of Health Services County Health Status Profiles 200413
TABLE 6: DEATHS DUE TO SUICIDE, 2000-2002
California Counties Ranked by Three-Year Average Age-Adjusted Death Rate
The crude death rate from suicide for California was 9.1 per 100,000
population, a risk of dying equivalent to approximately one death for every11,035 persons. This rate was based on a three-year average number of deaths from 2000 to 2002 of 3,193.0 and a population of 35,233,335 as of July 1, 2001. Among counties with "reliable" rates, the crude rate ranged from20.4 in Humboldt County to 6.4 in San Mateo County, a difference in rates bya factor of 3.2 to 1.
The age-adjusted death rate from suicide for California for the three-year period from 2000 to 2002 was 9.5 per 100,000 population. Reliableage-adjusted death rates ranged from 19.9 in Humboldt County to 6.3 inSan Mateo County.
Neither the counties, nor California as a whole, met the Healthy People 2010National Objective of no more than 5.0 age-adjusted deaths due to suicide per 100,000 population.
Notes:
Death rates are per 100,000 population. The crude death rate is the actual risk of dying. The age-adjusted
rate is the hypothetical rate that the State/County would have if its population were distributed by age in thesame proportions as the 2000 United States population.
* Death rate unreliable, relative standard error is greater than or equal to 23 percent.
Counties were rank ordered first by increasing age-adjusted death rate (calculated to 15 decimal places),second by decreasing size of the population. For purposes of this report, rates with a relative standard error of greater than or equal to 23 percent are considered “unreliable.” The upper and lower limits of theage-adjusted death rate at the 95 percent confidence level indicate the precision of the estimated death rate.Precision of the death rate decreases as the interval widens. The upper and lower limits define the rangewithin which the death rate probably would occur in 95 out of 100 independent sets of data similar to thepresent set. (For additional information see the Technical Notes, pages 64 through 75.)
DATA SOURCES
Department of Health Services: Death Statistical Master Files, 2000-2002.Department of Finance: 2001 Population Estimates with Age, Sex, and Race/Ethnic Detail, December 1998.

8/6/2019 California County Health Status Profiles 2004
http://slidepdf.com/reader/full/california-county-health-status-profiles-2004 21/85
California Department of Health Services County Health Status Profiles 200414
TABLE 6
DEATHS DUE TO SUICIDE
RANKED BY THREE-YEAR AVERAGE AGE-ADJUSTED DEATH RATE
CALIFORNIA COUNTIES, 2000-2002
2000-2002
RANK 2001 DEATHS CRUDE AGE-ADJUSTED 95% CONFIDENCE LIMITS
ORDER COUNTY POPULATION (AVERAGE) DEATH RATE DEATH RATE LOWER UPPER
HEALTHY PEOPLE 2010 NATIONAL OBJECTIVE: 5.0
1 SAN MATEO 759,313 48.3 6.4 6.3 4.5 8.0
2 IMPERIAL 161,177 8.7 5.4 * 6.3 * 2.0 10.5
3 SAN BENITO 53,577 3.3 6.2 * 6.5 * 0.0 13.6
4 MARIPOSA 17,218 1.7 9.7 * 7.0 * 0.0 18.0
5 MODOC 10,589 0.7 6.3 * 7.1 * 0.0 24.2
6 SANTA CLARA 1,795,132 122.7 6.8 7.1 5.8 8.3
7 MONTEREY 409,511 27.3 6.7 7.2 4.5 9.9
8 NAPA 129,130 11.0 8.5 * 7.7 * 3.1 12.3
9 TULARE 388,730 26.7 6.9 7.7 4.8 10.7
10 LOS ANGELES 9,925,413 733.3 7.4 7.9 7.3 8.5
11 ALAMEDA 1,492,004 117.0 7.8 8.0 6.6 9.5
12 FRESNO 825,365 63.7 7.7 8.4 6.3 10.5
13 KINGS 129,375 10.7 8.2 * 8.7 * 3.3 14.1
14 ORANGE 2,872,632 237.3 8.3 8.8 7.7 10.0
15 CONTRA COSTA 942,662 85.0 9.0 9.0 7.1 10.9
16 STANISLAUS 472,096 41.7 8.8 9.3 6.5 12.2
17 VENTURA 763,586 69.0 9.0 9.5 7.2 11.7CALIFORNIA 35,233,335 3,193.0 9.1 9.5 9.1 9.8
18 MERCED 219,936 18.3 8.3 * 9.7 * 5.2 14.3
19 MADERA 131,052 11.7 8.9 * 9.8 * 4.1 15.4
20 SAN JOAQUIN 593,538 57.7 9.7 10.2 7.5 12.8
21 SONOMA 468,682 51.0 10.9 10.4 7.5 13.3
22 SOLANO 408,095 39.0 9.6 10.5 7.1 13.9
23 SAN BERNARDINO 1,771,707 165.7 9.4 10.6 8.9 12.2
24 RIVERSIDE 1,626,134 168.3 10.4 10.8 9.2 12.5
25 SAN FRANCISCO 794,342 93.3 11.7 10.9 8.6 13.1
26 KERN 694,749 69.0 9.9 10.9 8.3 13.5
27 YOLO 167,259 17.0 10.2 * 11.3 * 5.8 16.8
28 SANTA BARBARA 417,331 46.3 11.1 11.3 8.1 14.6
29 SACRAMENTO 1,236,054 137.3 11.1 11.4 9.5 13.3
30 MONO 11,081 1.3 12.0 * 11.5 * 0.0 31.2
31 SAN DIEGO 3,005,038 318.3 10.6 11.5 10.2 12.832 SANTA CRUZ 264,525 31.7 12.0 12.0 7.8 16.2
33 MARIN 249,634 33.3 13.4 12.8 8.4 17.2
34 PLACER 252,688 32.0 12.7 12.8 8.4 17.3
35 EL DORADO 168,912 22.0 13.0 12.9 7.5 18.3
36 SAN LUIS OBISPO 262,123 35.0 13.4 13.6 9.0 18.2
37 CALAVERAS 43,392 6.3 14.6 * 13.8 * 2.7 24.9
38 TUOLUMNE 57,497 9.3 16.2 * 14.1 * 4.8 23.3
39 SUTTER 83,999 11.7 13.9 * 14.2 * 6.0 22.3
40 YUBA 64,938 8.3 12.8 * 14.7 * 4.7 24.7
41 MENDOCINO 91,963 14.3 15.6 * 15.0 * 7.2 22.9
42 BUTTE 213,040 34.0 16.0 15.3 10.1 20.5
43 COLUSA 22,012 3.0 13.6 * 15.3 * 0.0 32.9
44 NEVADA 99,670 17.7 17.7 * 15.5 * 7.9 23.2
45 AMADOR 35,242 5.7 16.1 * 15.6 * 2.4 28.8
46 TEHAMA 57,642 11.0 19.1 * 17.2 * 6.8 27.647 PLUMAS 21,044 3.7 17.4 * 17.9 * 0.0 37.1
48 SHASTA 179,892 34.0 18.9 18.8 12.4 25.2
49 SIERRA 3,465 0.7 19.2 * 19.4 * 0.0 67.7
50 SISKIYOU 45,624 9.0 19.7 * 19.5 * 6.3 32.7
51 LASSEN 36,759 7.0 19.0 * 19.7 * 4.9 34.4
52 DEL NORTE 31,801 6.3 19.9 * 19.8 * 4.3 35.4
53 GLENN 30,291 6.3 20.9 * 19.8 * 4.2 35.5
54 HUMBOLDT 129,211 26.3 20.4 19.9 12.3 27.5
55 LAKE 62,080 14.3 23.1 * 20.2 * 9.1 31.2
56 INYO 18,510 4.3 23.4 * 20.3 * 0.6 40.1
57 TRINITY 13,605 3.0 22.1 * 22.6 * 0.0 49.4
58 ALPINE 1,268 0.3 26.3 * 27.5 * 0.0 120.9

8/6/2019 California County Health Status Profiles 2004
http://slidepdf.com/reader/full/california-county-health-status-profiles-2004 22/85
California Department of Health Services County Health Status Profiles 200415
TABLE 7: DEATHS DUE TO ALL CANCERS, 2000-2002
California Counties Ranked by Three-Year Average Age-Adjusted Death Rate
The crude death rate from all cancers for California was 152.1 per 100,000
population, a risk of dying equivalent to approximately one death for every658 persons. This rate was based on a three-year average number of deathsfrom 2000 to 2002 of 53,580.3 and a population of 35,233,335 as of July 1, 2001. Among counties with "reliable" rates, the crude rate ranged from293.7 in Lake County to 110.3 in Kings County, a difference in rates by afactor of 2.7 to 1.
The age-adjusted death rate from all cancers for California for the three-year period from 2000 to 2002 was 172.7 per 100,000 population. Reliableage-adjusted death rates ranged from 235.1 in Yuba County to 131.2 inSan Benito County.
Altogether 11 counties (8 with reliable age-adjusted death rates), but notCalifornia as a whole, met the Healthy People 2010 National Objective of nomore than 159.9 age-adjusted deaths due to all cancers per 100,000population.
Notes:
Death rates are per 100,000 population. The crude death rate is the actual risk of dying. The age-adjustedrate is the hypothetical rate that the State/County would have if its population were distributed by age in thesame proportions as the 2000 United States population.
* Death rate unreliable, relative standard error is greater than or equal to 23 percent.
Counties were rank ordered first by increasing age-adjusted death rate (calculated to 15 decimal places),second by decreasing size of the population. For purposes of this report, rates with a relative standard error of greater than or equal to 23 percent are considered “unreliable.” The upper and lower limits of theage-adjusted death rate at the 95 percent confidence level indicate the precision of the estimated death rate.Precision of the death rate decreases as the interval widens. The upper and lower limits define the rangewithin which the death rate probably would occur in 95 out of 100 independent sets of data similar to thepresent set. (For additional information see the Technical Notes, pages 64 through 75.)
DATA SOURCES
Department of Health Services: Death Statistical Master Files, 2000-2002.Department of Finance: 2001 Population Estimates with Age, Sex, and Race/Ethnic Detail, December 1998.

8/6/2019 California County Health Status Profiles 2004
http://slidepdf.com/reader/full/california-county-health-status-profiles-2004 23/85
California Department of Health Services County Health Status Profiles 200416
TABLE 7
DEATHS DUE TO ALL CANCERS
RANKED BY THREE-YEAR AVERAGE AGE-ADJUSTED DEATH RATE
CALIFORNIA COUNTIES, 2000-2002
2000-2002
RANK 2001 DEATHS CRUDE AGE-ADJUSTED 95% CONFIDENCE LIMITS
ORDER COUNTY POPULATION (AVERAGE) DEATH RATE DEATH RATE LOWER UPPER
1 MODOC 10,589 16.0 151.1 * 120.0 * 60.0 180.0
2 SAN BENITO 53,577 61.0 113.9 131.2 98.2 164.2
3 LASSEN 36,759 45.7 124.2 140.7 99.8 181.5
4 MONO 11,081 13.0 117.3 * 142.7 * 62.5 222.8
5 SANTA CLARA 1,795,132 2,107.3 117.4 144.8 138.5 151.1
6 SANTA CRUZ 264,525 362.7 137.1 147.3 132.0 162.6
7 ALPINE 1,268 1.7 131.4 * 151.3 * 0.0 382.7
8 CALAVERAS 43,392 96.0 221.2 153.7 122.6 184.9
9 SAN FRANCISCO 794,342 1,468.3 184.8 154.6 146.7 162.6
10 MADERA 131,052 190.0 145.0 155.2 133.1 177.3
11 IMPERIAL 161,177 198.3 123.1 157.9 135.9 180.0
HEALTHY PEOPLE 2010 NATIONAL OBJECTIVE: 159.9
12 SAN MATEO 759,313 1,247.7 164.3 160.0 151.1 168.9
13 COLUSA 22,012 35.3 160.5 162.9 109.0 216.8
14 SANTA BARBARA 417,331 665.0 159.3 164.1 151.6 176.6
15 MONTEREY 409,511 544.0 132.8 164.7 150.8 178.6
16 TULARE 388,730 529.3 136.2 164.7 150.7 178.8
17 SAN LUIS OBISPO 262,123 487.0 185.8 165.0 150.1 179.818 KINGS 129,375 142.7 110.3 166.1 138.7 193.5
19 LOS ANGELES 9,925,413 13,424.3 135.3 167.0 164.2 169.8
20 NEVADA 99,670 235.7 236.4 167.0 145.4 188.7
21 FRESNO 825,365 1,159.0 140.4 170.5 160.7 180.3
22 DEL NORTE 31,801 60.0 188.7 170.9 127.5 214.4
CALIFORNIA 35,233,335 53,580.3 152.1 172.7 171.3 174.2
23 SUTTER 83,999 151.3 180.2 172.8 145.2 200.4
24 INYO 18,510 45.0 243.1 173.3 121.5 225.2
25 KERN 694,749 1,009.3 145.3 173.4 162.7 184.1
26 RIVERSIDE 1,626,134 2,829.3 174.0 174.0 167.6 180.5
27 TRINITY 13,605 31.3 230.3 174.3 112.9 235.8
28 EL DORADO 168,912 306.0 181.2 174.5 154.8 194.1
29 VENTURA 763,586 1,160.0 151.9 175.1 165.0 185.3
30 ALAMEDA 1,492,004 2,320.3 155.5 175.8 168.6 183.0
31 ORANGE 2,872,632 4,048.0 140.9 176.0 170.5 181.432 MERCED 219,936 296.7 134.9 176.7 156.6 196.9
33 AMADOR 35,242 95.7 271.5 177.3 141.5 213.2
34 MARIN 249,634 467.3 187.2 178.2 162.0 194.3
35 BUTTE 213,040 492.3 231.1 178.2 162.1 194.3
36 CONTRA COSTA 942,662 1,679.0 178.1 178.2 169.7 186.8
37 SAN DIEGO 3,005,038 4,658.0 155.0 179.5 174.3 184.7
38 SAN JOAQUIN 593,538 985.3 166.0 183.1 171.6 194.5
39 STANISLAUS 472,096 756.7 160.3 185.4 172.2 198.7
40 MARIPOSA 17,218 47.0 273.0 186.4 132.3 240.5
41 SONOMA 468,682 932.7 199.0 187.6 175.5 199.6
42 YOLO 167,259 256.0 153.1 188.1 165.0 211.2
43 NAPA 129,130 299.7 232.1 189.9 168.2 211.5
44 GLENN 30,291 58.3 192.6 192.4 142.7 242.1
45 SHASTA 179,892 398.7 221.6 193.8 174.7 212.9
46 LAKE 62,080 182.3 293.7 194.0 164.8 223.247 SAN BERNARDINO 1,771,707 2,491.3 140.6 194.0 186.4 201.7
48 SIERRA 3,465 9.3 269.4 * 194.6 * 66.2 323.0
49 SISKIYOU 45,624 119.0 260.8 196.6 160.9 232.3
50 PLUMAS 21,044 61.7 293.0 197.4 147.4 247.3
51 SACRAMENTO 1,236,054 2,203.7 178.3 197.5 189.2 205.7
52 MENDOCINO 91,963 198.3 215.7 197.7 170.1 225.3
53 SOLANO 408,095 638.3 156.4 199.9 184.1 215.7
54 TEHAMA 57,642 152.7 264.9 207.2 173.9 240.5
55 PLACER 252,688 529.0 209.3 210.9 192.9 228.9
56 TUOLUMNE 57,497 159.0 276.5 211.0 177.6 244.3
57 HUMBOLDT 129,211 295.7 228.8 227.0 201.0 252.9
58 YUBA 64,938 126.0 194.0 235.1 194.0 276.1

8/6/2019 California County Health Status Profiles 2004
http://slidepdf.com/reader/full/california-county-health-status-profiles-2004 24/85
California Department of Health Services County Health Status Profiles 200417
TABLE 8: DEATHS DUE TO LUNG CANCER, 2000-2002
California Counties Ranked by Three-Year Average Age-Adjusted Death Rate
The crude death rate from lung cancer for California was 39.1 per 100,000
population, a risk of dying equivalent to approximately one death for every2,555 persons. This rate was based on a three-year average number of deaths from 2000 to 2002 of 13,789.3 and a population of 35,233,335 as of July 1, 2001. Among counties with "reliable" rates, the crude rate ranged from101.5 in Lake County to 27.1 in Santa Clara County, a difference in rates by afactor of 3.7 to 1.
The age-adjusted death rate from lung cancer for California for the three-year period from 2000 to 2002 was 44.8 per 100,000 population. Reliableage-adjusted death rates ranged from 81.7 in Yuba County to 33.6 inSanta Clara County.
Altogether 22 counties (17 with reliable age-adjusted death rates) andCalifornia met the Healthy People National Objective of no more than 44.9age-adjusted deaths due to lung cancer per 100,000 population.
Notes:
Death rates are per 100,000 population. The crude death rate is the actual risk of dying. The age-adjusted
rate is the hypothetical rate that the State/County would have if its population were distributed by age in thesame proportions as the 2000 United States population.
* Death rate unreliable, relative standard error is greater than or equal to 23 percent.
Counties were rank ordered first by increasing age-adjusted death rate (calculated to 15 decimal places),second by decreasing size of the population. For purposes of this report, rates with a relative standard error of greater than or equal to 23 percent are considered “unreliable.” The upper and lower limits of theage-adjusted death rate at the 95 percent confidence level indicate the precision of the estimated death rate.Precision of the death rate decreases as the interval widens. The upper and lower limits define the rangewithin which the death rate probably would occur in 95 out of 100 independent sets of data similar to thepresent set. (For additional information see the Technical Notes, pages 64 through 75.)
DATA SOURCES
Department of Health Services: Death Statistical Master Files, 2000-2002.Department of Finance: 2001 Population Estimates with Age, Sex, and Race/Ethnic Detail, December 1998.

8/6/2019 California County Health Status Profiles 2004
http://slidepdf.com/reader/full/california-county-health-status-profiles-2004 25/85
California Department of Health Services County Health Status Profiles 200418
TABLE 8
DEATHS DUE TO LUNG CANCER
RANKED BY THREE-YEAR AVERAGE AGE-ADJUSTED DEATH RATE
CALIFORNIA COUNTIES, 2000-2002
2000-2002
RANK 2001 DEATHS CRUDE AGE-ADJUSTED 95% CONFIDENCE LIMITS
ORDER COUNTY POPULATION (AVERAGE) DEATH RATE DEATH RATE LOWER UPPER
1 MODOC 10,589 4.0 37.8 * 29.5 * 0.4 58.6
2 SAN BENITO 53,577 15.3 28.6 * 33.2 * 16.6 49.9
3 SANTA CLARA 1,795,132 486.0 27.1 33.6 30.6 36.6
4 COLUSA 22,012 7.7 34.8 * 36.2 * 10.5 61.8
5 MONO 11,081 3.7 33.1 * 37.1 * 0.0 75.7
6 SAN FRANCISCO 794,342 353.7 44.5 37.5 33.6 41.4
7 SANTA CRUZ 264,525 90.0 34.0 37.6 29.7 45.4
8 IMPERIAL 161,177 48.0 29.8 38.6 27.7 49.5
9 LOS ANGELES 9,925,413 3,154.3 31.8 39.8 38.4 41.2
10 SANTA BARBARA 417,331 162.3 38.9 40.4 34.2 46.6
11 SAN MATEO 759,313 325.7 42.9 41.9 37.3 46.4
12 NEVADA 99,670 60.7 60.9 41.9 31.2 52.5
13 FRESNO 825,365 283.7 34.4 42.4 37.5 47.4
14 MADERA 131,052 52.7 40.2 42.8 31.3 54.4
15 ORANGE 2,872,632 1,002.3 34.9 43.7 41.0 46.5
16 MONTEREY 409,511 143.0 34.9 44.0 36.7 51.2
17 TULARE 388,730 140.0 36.0 44.2 36.8 51.5
18 VENTURA 763,586 291.7 38.2 44.3 39.2 49.419 KINGS 129,375 37.7 29.1 44.3 30.1 58.6
20 MERCED 219,936 74.0 33.6 44.4 34.3 54.5
21 LASSEN 36,759 14.3 39.0 * 44.7 * 21.6 67.9
CALIFORNIA 35,233,335 13,789.3 39.1 44.8 44.1 45.6
22 CONTRA COSTA 942,662 426.3 45.2 44.9 40.6 49.1
HEALTHY PEOPLE 2010 NATIONAL OBJECTIVE: 44.9
23 SAN LUIS OBISPO 262,123 135.7 51.8 45.8 38.0 53.6
24 SAN DIEGO 3,005,038 1,208.0 40.2 46.8 44.2 49.4
25 ALAMEDA 1,492,004 615.7 41.3 47.2 43.5 50.9
26 RIVERSIDE 1,626,134 777.3 47.8 47.7 44.3 51.0
27 EL DORADO 168,912 84.7 50.1 47.8 37.6 58.0
28 SIERRA 3,465 2.3 67.3 * 48.2 * 0.0 110.3
29 MARIN 249,634 126.7 50.7 48.4 39.9 56.8
30 SUTTER 83,999 43.0 51.2 49.5 34.7 64.3
31 SONOMA 468,682 244.0 52.1 49.6 43.4 55.932 CALAVERAS 43,392 31.0 71.4 50.2 32.3 68.2
33 NAPA 129,130 79.3 61.4 50.3 39.1 61.4
34 KERN 694,749 297.3 42.8 51.6 45.7 57.4
35 MARIPOSA 17,218 13.3 77.4 * 51.7 * 23.8 79.6
36 YOLO 167,259 70.0 41.9 51.9 39.7 64.1
37 INYO 18,510 14.0 75.6 * 52.7 * 24.8 80.6
38 SAN BERNARDINO 1,771,707 664.7 37.5 52.8 48.7 56.8
39 AMADOR 35,242 29.0 82.3 52.8 33.5 72.2
40 STANISLAUS 472,096 216.7 45.9 53.6 46.5 60.8
41 DEL NORTE 31,801 19.0 59.7 54.2 * 29.8 78.7
42 SAN JOAQUIN 593,538 288.0 48.5 54.3 48.0 60.5
43 BUTTE 213,040 149.3 70.1 54.5 45.6 63.4
44 SACRAMENTO 1,236,054 609.7 49.3 54.7 50.3 59.0
45 MENDOCINO 91,963 57.0 62.0 56.9 42.1 71.7
46 SOLANO 408,095 181.0 44.4 57.4 48.9 65.847 TUOLUMNE 57,497 43.7 75.9 57.9 40.5 75.4
48 PLACER 252,688 147.7 58.4 59.1 49.5 68.6
49 SISKIYOU 45,624 35.7 78.2 59.1 39.6 78.7
50 HUMBOLDT 129,211 80.7 62.4 62.5 48.8 76.2
51 SHASTA 179,892 130.7 72.6 62.8 52.0 73.6
52 PLUMAS 21,044 20.7 98.2 64.6 36.5 92.6
53 TRINITY 13,605 12.0 88.2 * 66.8 * 28.9 104.8
54 LAKE 62,080 63.0 101.5 67.2 50.1 84.2
55 GLENN 30,291 20.7 68.2 68.9 39.1 98.8
56 TEHAMA 57,642 56.3 97.7 76.0 56.0 96.1
57 YUBA 64,938 43.7 67.2 81.7 57.4 105.9
58 ALPINE 1,268 1.0 78.9 * 89.0 * 0.0 264.6

8/6/2019 California County Health Status Profiles 2004
http://slidepdf.com/reader/full/california-county-health-status-profiles-2004 26/85
California Department of Health Services County Health Status Profiles 200419
TABLE 9: DEATHS DUE TO FEMALE BREAST CANCER, 2000-2002
California Counties Ranked by Three-Year Average Age-Adjusted Death Rate
The crude death rate from female breast cancer for California was 23.8 per
100,000 population, a risk of dying equivalent to approximately one death for every 4,201 females. This rate was based on a three-year average number of deaths of 4,174.7 from 1999 to 2001 and a female population of 17,538,924as of July 1, 2001. Among counties with "reliable" rates, the crude rateranged from 41.4 in Humboldt County to 18.9 in Tulare County, a difference inrates by a factor of 2.2 to 1.
The age-adjusted death rate from female breast cancer for California for thethree-year period from 2000 to 2002 was 24.1 per 100,000 population.
Reliable age-adjusted death rates ranged from 37.2 in Humboldt Countyto 19.0 in San Francisco County.
Altogether 22 counties (7 with reliable age-adjusted death rates), but notCalifornia as a whole, met the Healthy People 2010 National Objective of nomore than 22.3 age-adjusted deaths due to female breast cancer per 100,000population.
Notes:
Death rates are per 100,000 population. The crude death rate is the actual risk of dying. The age-adjustedrate is the hypothetical rate that the State/County would have if its population were distributed by age in thesame proportions as the 2000 United States population.
* Death rate unreliable, relative standard error is greater than or equal to 23 percent.+ Standard error indeterminate because the death rate is based on no (zero) deaths.- Upper and lower limits at the 95 percent confidence level are not calculated for zero deaths.
Counties were rank ordered first by increasing age-adjusted death rate (calculated to 15 decimal places),second by decreasing size of the population. For purposes of this report, rates with a relative standard error of greater than or equal to 23 percent are considered “unreliable.” The upper and lower limits of theage-adjusted death rate at the 95 percent confidence level indicate the precision of the estimated death rate.Precision of the death rate decreases as the interval widens. The upper and lower limits define the rangewithin which the death rate probably would occur in 95 out of 100 independent sets of data similar to thepresent set. (For additional information see the Technical Notes, pages 64 through 75.)
DATA SOURCES
Department of Health Services: Death Statistical Master Files, 2000-2002.Department of Finance: 2001 Population Estimates with Age, Sex, and Race/Ethnic Detail, December 1998.

8/6/2019 California County Health Status Profiles 2004
http://slidepdf.com/reader/full/california-county-health-status-profiles-2004 27/85
California Department of Health Services County Health Status Profiles 200420
TABLE 9
DEATHS DUE TO FEMALE BREAST CANCER
RANKED BY THREE-YEAR AVERAGE AGE-ADJUSTED DEATH RATE
CALIFORNIA COUNTIES, 2000-2002
2001 2000-2002
RANK FEMALE DEATHS CRUDE AGE-ADJUSTED 95% CONFIDENCE LIMITS
ORDER COUNTY POPULATION (AVERAGE) DEATH RATE DEATH RATE LOWER UPPER
1 ALPINE 604 0.0 0.0 + 0.0 + - -
2 DEL NORTE 14,621 1.3 9.1 * 7.7 * 0.0 21.0
3 COLUSA 10,639 1.3 12.5 * 11.7 * 0.0 31.8
4 MODOC 5,189 0.7 12.8 * 11.9 * 0.0 42.8
5 LASSEN 14,424 2.3 16.2 * 13.8 * 0.0 31.7
6 SAN BENITO 26,516 3.7 13.8 * 14.5 * 0.0 29.4
7 MADERA 67,303 11.3 16.8 * 17.4 * 7.2 27.7
8 SAN FRANCISCO 399,783 99.3 24.8 19.0 15.2 22.8
9 CALAVERAS 21,953 6.0 27.3 * 19.2 * 3.6 34.7
10 SANTA CRUZ 132,282 27.7 20.9 19.9 12.4 27.5
11 KINGS 58,736 9.3 15.9 * 19.9 * 7.1 32.8
12 SANTA CLARA 881,686 170.3 19.3 20.2 17.1 23.2
13 NEVADA 50,591 15.0 29.6 * 20.4 * 9.8 31.1
14 LAKE 31,627 9.0 28.5 * 20.6 * 6.7 34.5
15 SANTA BARBARA 205,688 45.7 22.2 20.9 14.8 27.0
16 IMPERIAL 78,534 14.0 17.8 * 21.0 * 10.0 32.1
17 TULARE 194,283 36.7 18.9 21.2 14.3 28.1
18 TRINITY 6,738 2.0 29.7 * 21.5 * 0.0 51.619 MENDOCINO 45,947 11.3 24.7 * 21.5 * 8.9 34.2
20 SAN MATEO 383,029 95.7 25.0 21.7 17.3 26.1
21 SAN LUIS OBISPO 127,920 32.3 25.3 21.8 13.9 29.7
22 YOLO 84,128 16.3 19.4 * 22.2 * 11.4 33.1
HEALTHY PEOPLE 2010 NATIONAL OBJECTIVE: 22.3
23 BUTTE 108,913 31.3 28.8 22.7 14.5 31.0
24 SIERRA 1,744 0.7 38.2 * 22.8 * 0.0 80.2
25 LOS ANGELES 4,953,110 1,061.7 21.4 22.9 21.5 24.2
26 AMADOR 16,308 5.7 34.7 * 23.0 * 3.5 42.5
27 EL DORADO 84,533 21.7 25.6 23.0 13.3 32.8
28 MONO 5,140 1.0 19.5 * 23.3 * 0.0 69.3
29 ORANGE 1,419,458 314.3 22.1 23.6 21.0 26.2
30 TEHAMA 29,366 9.7 32.9 * 23.6 * 8.3 38.9
31 FRESNO 415,320 88.3 21.3 23.6 18.7 28.6
32 STANISLAUS 239,146 53.7 22.4 23.9 17.5 30.3CALIFORNIA 17,538,924 4,174.7 23.8 24.1 23.3 24.8
33 SHASTA 91,542 27.0 29.5 24.2 15.0 33.5
34 NAPA 64,891 20.3 31.3 24.3 13.4 35.2
35 MONTEREY 194,517 44.3 22.8 24.3 17.1 31.5
36 KERN 340,259 75.7 22.2 24.5 18.9 30.0
37 ALAMEDA 752,020 190.0 25.3 24.7 21.2 28.3
38 SAN BERNARDINO 882,437 184.3 20.9 25.1 21.5 28.7
39 SISKIYOU 23,259 8.0 34.4 * 25.5 * 7.4 43.7
40 YUBA 32,477 7.3 22.6 * 25.6 * 7.1 44.2
41 SAN JOAQUIN 292,209 74.0 25.3 25.9 19.9 31.8
42 RIVERSIDE 813,798 226.0 27.8 26.4 22.9 29.9
43 PLACER 127,314 36.7 28.8 26.5 17.9 35.1
44 VENTURA 377,523 99.7 26.4 26.7 21.4 31.9
45 SOLANO 199,888 49.3 24.7 26.9 19.3 34.5
46 SONOMA 237,782 75.0 31.5 26.9 20.7 33.147 SACRAMENTO 628,464 170.3 27.1 26.9 22.9 31.0
48 TUOLUMNE 27,439 10.0 36.4 * 27.3 * 9.9 44.8
49 SUTTER 42,292 12.7 30.0 * 27.5 * 12.3 42.7
50 SAN DIEGO 1,476,140 398.3 27.0 28.1 25.3 30.9
51 CONTRA COSTA 476,519 150.3 31.5 28.2 23.6 32.7
52 GLENN 14,984 4.3 28.9 * 28.7 * 1.1 56.2
53 MERCED 108,862 27.7 25.4 29.7 18.6 40.7
54 MARIN 125,275 43.3 34.6 30.6 21.4 39.8
55 PLUMAS 10,596 5.0 47.2 * 34.5 * 3.3 65.6
56 MARIPOSA 8,592 4.0 46.6 * 34.7 * 0.0 69.8
57 INYO 9,437 4.7 49.5 * 36.1 * 1.2 70.9
58 HUMBOLDT 65,149 27.0 41.4 37.2 23.1 51.3

8/6/2019 California County Health Status Profiles 2004
http://slidepdf.com/reader/full/california-county-health-status-profiles-2004 28/85
California Department of Health Services County Health Status Profiles 200421
TABLE 10: DEATHS DUE TO CORONARY HEART DISEASE,2000-2002
California Counties Ranked by Three-Year Average Age-Adjusted Death Rate
The crude death rate from coronary heart disease for California was 161.0 per 100,000 population, a risk of dying equivalent to approximately one death for every 621 persons. This rate was based on a three-year average number of deaths of 56,734.7 from 2000 to 2002 and a population of 35,233,335 as of July 1, 2001. Among counties with "reliable" rates, the crude rate ranged from275.5 in Inyo County to 91.5 in San Benito County, a difference in rates by afactor of 3.0 to 1.
The age-adjusted death rate from coronary heart disease for California for thethree-year period from 2000 to 2002 was 186.0 per 100,000 population.Reliable age-adjusted death rates ranged from 237.8 in Stanislaus County to108.7 in San Benito County.
Altogether 37 counties (34 with reliable age-adjusted death rates), but notCalifornia as a whole, met the Healthy People 2010 National Objective of nomore than 166.0 age-adjusted deaths due to coronary heart disease per 100,000 population.
Notes:
Death rates are per 100,000 population. The crude death rate is the actual risk of dying. The age-adjustedrate is the hypothetical rate that the State/County would have if its population were distributed by age in thesame proportions as the 2000 United States population.
* Death rate unreliable, relative standard error is greater than or equal to 23 percent.
Counties were rank ordered first by increasing age-adjusted death rate (calculated to 15 decimal places),second by decreasing size of the population. For purposes of this report, rates with a relative standard error of greater than or equal to 23 percent are considered “unreliable.” The upper and lower limits of theage-adjusted death rate at the 95 percent confidence level indicate the precision of the estimated death rate.Precision of the death rate decreases as the interval widens. The upper and lower limits define the rangewithin which the death rate probably would occur in 95 out of 100 independent sets of data similar to the
present set. (For additional information see the Technical Notes, pages 64 through 75.)
DATA SOURCES
Department of Health Services: Death Statistical Master Files, 2000-2002.Department of Finance: 2001 Population Estimates with Age, Sex, and Race/Ethnic Detail, December 1998.

8/6/2019 California County Health Status Profiles 2004
http://slidepdf.com/reader/full/california-county-health-status-profiles-2004 29/85
California Department of Health Services County Health Status Profiles 200422
TABLE 10
DEATHS DUE TO CORONARY HEART DISEASE
RANKED BY THREE-YEAR AVERAGE AGE-ADJUSTED DEATH RATE
CALIFORNIA COUNTIES, 2000-2002
2000-2002
RANK 2001 DEATHS CRUDE AGE-ADJUSTED 95% CONFIDENCE LIMITS
ORDER COUNTY POPULATION (AVERAGE) DEATH RATE DEATH RATE LOWER UPPER
1 SIERRA 3,465 4.3 125.1 * 76.7 * 3.5 150.0
2 ALPINE 1,268 1.0 78.9 * 98.2 * 0.0 291.5
3 MONO 11,081 8.0 72.2 * 100.9 * 28.6 173.3
4 SAN BENITO 53,577 49.0 91.5 108.7 78.2 139.1
5 PLUMAS 21,044 34.7 164.7 110.5 73.1 148.0
6 DEL NORTE 31,801 44.3 139.4 122.2 86.0 158.3
7 SAN MATEO 759,313 964.0 127.0 124.9 117.0 132.7
8 MODOC 10,589 19.3 182.6 127.1 69.9 184.4
9 SANTA CRUZ 264,525 331.0 125.1 132.1 117.7 146.4
10 NEVADA 99,670 196.0 196.6 132.6 113.9 151.3
11 TRINITY 13,605 23.3 171.5 132.6 77.5 187.8
12 GLENN 30,291 43.7 144.2 132.6 92.9 172.3
13 SAN LUIS OBISPO 262,123 432.7 165.1 138.8 125.6 152.0
14 MARIPOSA 17,218 36.0 209.1 140.6 93.9 187.2
15 COLUSA 22,012 32.3 146.9 141.7 92.6 190.7
16 EL DORADO 168,912 236.3 139.9 142.6 124.3 160.9
17 MENDOCINO 91,963 148.0 160.9 143.6 120.4 166.8
18 CALAVERAS 43,392 90.0 207.4 145.1 114.9 175.419 LASSEN 36,759 48.0 130.6 146.6 105.1 188.0
20 SAN FRANCISCO 794,342 1,482.3 186.6 147.1 139.5 154.6
21 MARIN 249,634 386.3 154.8 147.4 132.7 162.1
22 YOLO 167,259 203.0 121.4 147.8 127.4 168.1
23 IMPERIAL 161,177 185.3 115.0 147.9 126.6 169.2
24 MONTEREY 409,511 485.0 118.4 150.2 136.8 163.6
25 SANTA CLARA 1,795,132 1,959.0 109.1 151.0 144.2 157.8
26 SONOMA 468,682 788.3 168.2 151.2 140.6 161.7
27 HUMBOLDT 129,211 201.7 156.1 151.9 130.9 172.9
28 BUTTE 213,040 464.3 218.0 152.9 138.7 167.1
29 SISKIYOU 45,624 94.7 207.5 155.2 123.6 186.8
30 SANTA BARBARA 417,331 659.3 158.0 155.9 144.0 167.9
31 NAPA 129,130 274.3 212.4 158.8 139.8 177.8
32 TEHAMA 57,642 122.3 212.2 159.0 130.4 187.5
33 CONTRA COSTA 942,662 1,466.0 155.5 161.5 153.2 169.734 VENTURA 763,586 1,027.0 134.5 163.0 153.0 173.1
35 AMADOR 35,242 87.7 248.8 163.7 128.9 198.4
36 LAKE 62,080 166.7 268.5 164.4 138.8 190.0
37 TUOLUMNE 57,497 131.7 229.0 165.9 137.3 194.6
HEALTHY PEOPLE 2010 NATIONAL OBJECTIVE: 166.0
38 ALAMEDA 1,492,004 2,173.3 145.7 168.0 161.0 175.1
39 SAN DIEGO 3,005,038 4,437.0 147.7 168.3 163.4 173.3
40 SHASTA 179,892 356.3 198.1 170.9 153.1 188.7
41 TULARE 388,730 566.7 145.8 173.3 159.0 187.6
42 INYO 18,510 51.0 275.5 176.2 127.4 225.1
43 SOLANO 408,095 514.7 126.1 177.7 162.1 193.3
44 PLACER 252,688 444.3 175.8 181.6 164.7 198.6
45 KINGS 129,375 153.3 118.5 182.9 153.9 212.0
46 SUTTER 83,999 164.7 196.0 183.3 155.2 211.4
47 MADERA 131,052 226.3 172.7 184.4 160.3 208.4CALIFORNIA 35,233,335 56,734.7 161.0 186.0 184.5 187.6
48 SAN JOAQUIN 593,538 1,050.7 177.0 189.7 178.2 201.2
49 FRESNO 825,365 1,310.0 158.7 190.7 180.4 201.1
50 MERCED 219,936 315.0 143.2 192.6 171.3 213.9
51 SACRAMENTO 1,236,054 2,200.0 178.0 202.9 194.4 211.4
52 ORANGE 2,872,632 4,373.7 152.3 207.9 201.7 214.1
53 RIVERSIDE 1,626,134 3,525.3 216.8 210.9 204.0 217.9
54 LOS ANGELES 9,925,413 16,674.7 168.0 214.5 211.2 217.7
55 YUBA 64,938 115.3 177.6 216.4 176.9 256.0
56 KERN 694,749 1,307.3 188.2 225.5 213.3 237.8
57 SAN BERNARDINO 1,771,707 2,876.3 162.3 237.1 228.4 245.8
58 STANISLAUS 472,096 971.7 205.8 237.8 222.8 252.7

8/6/2019 California County Health Status Profiles 2004
http://slidepdf.com/reader/full/california-county-health-status-profiles-2004 30/85
California Department of Health Services County Health Status Profiles 200423
TABLE 11: DEATHS DUE TO CEREBROVASCULAR DISEASE(STROKE), 2000-2002
California Counties Ranked by Three-Year Average Age-Adjusted Death Rate
The crude death rate from cerebrovascular disease for California was 50.8 per 100,000 population, a risk of dying equivalent to approximately one death for every 1,968 persons. This rate was based on a three-year average number of deaths of 17,906.3 from 2000 to 2002 and a population of 35,233,335 as of July 1, 2001. Among counties with "reliable" rates, the crude rate ranged from101.7 in Napa County to 36.3 in Kings County, a difference in rates by a factor of 2.8 to 1.
The age-adjusted death rate from cerebrovascular disease for California for the three-year period from 2000 to 2002 was 58.9 per 100,000 population.Reliable age-adjusted death rates ranged from 78.6 in Solano County to 42.3in El Dorado County.
Altogether 13 counties (5 with a reliable age-adjusted death rate), but notCalifornia as a whole, met the Healthy People 2010 National Objective of nomore than 48.0 age-adjusted deaths due to cerebrovascular disease per 100,000 population.
Notes:
Death rates are per 100,000 population. The crude death rate is the actual risk of dying. The age-adjustedrate is the hypothetical rate that the State/County would have if its population were distributed by age in thesame proportions as the 2000 United States population.
* Death rate unreliable, relative standard error is greater than or equal to 23 percent.+ Standard error indeterminate because the death rate is based on no (zero) deaths.- Upper and lower limits at the 95 percent confidence level are not calculated for zero deaths.
Counties were rank ordered first by increasing age-adjusted death rate (calculated to 15 decimal places),second by decreasing size of the population. For purposes of this report, rates with a relative standard error of greater than or equal to 23 percent are considered “unreliable.” The upper and lower limits of theage-adjusted death rate at the 95 percent confidence level indicate the precision of the estimated death rate.
Precision of the death rate decreases as the interval widens. The upper and lower limits define the rangewithin which the death rate probably would occur in 95 out of 100 independent sets of data similar to thepresent set. (For additional information see the Technical Notes, pages 64 through 75.)
DATA SOURCES
Department of Health Services: Death Statistical Master Files, 2000-2002.Department of Finance: 2001 Population Estimates with Age, Sex, and Race/Ethnic Detail, December 1998.

8/6/2019 California County Health Status Profiles 2004
http://slidepdf.com/reader/full/california-county-health-status-profiles-2004 31/85
California Department of Health Services County Health Status Profiles 200424
TABLE 11
DEATHS DUE TO CEREBROVASCULAR DISEASE
RANKED BY THREE-YEAR AVERAGE AGE-ADJUSTED DEATH RATE
CALIFORNIA COUNTIES, 2000-2002
2000-2002
RANK 2001 DEATHS CRUDE AGE-ADJUSTED 95% CONFIDENCE LIMITS
ORDER COUNTY POPULATION (AVERAGE) DEATH RATE DEATH RATE LOWER UPPER
1 ALPINE 1,268 0.0 0.0 + 0.0 + - -
2 SIERRA 3,465 1.3 38.5 * 23.0 * 0.0 62.9
3 COLUSA 22,012 6.7 30.3 * 28.9 * 6.9 51.0
4 PLUMAS 21,044 11.3 53.9 * 35.4 * 14.7 56.1
5 LASSEN 36,759 12.7 34.5 * 38.3 * 17.2 59.4
6 DEL NORTE 31,801 14.3 45.1 * 38.4 * 18.4 58.4
7 MARIPOSA 17,218 10.3 60.0 * 39.5 * 15.0 64.0
8 MONO 11,081 3.3 30.1 * 41.2 * 0.0 86.7
9 EL DORADO 168,912 69.0 40.8 42.3 32.3 52.4
10 SANTA CRUZ 264,525 115.0 43.5 45.5 37.2 53.9
11 TUOLUMNE 57,497 37.7 65.5 46.2 31.3 61.0
12 SAN BENITO 53,577 21.3 39.8 47.2 27.2 67.3
13 MADERA 131,052 58.3 44.5 47.3 35.2 59.5
HEALTHY PEOPLE 2010 NATIONAL OBJECTIVE: 48.0
14 GLENN 30,291 16.0 52.8 * 48.6 * 24.7 72.6
15 CALAVERAS 43,392 30.7 70.7 48.7 31.3 66.1
16 IMPERIAL 161,177 61.3 38.1 49.0 36.7 61.3
17 SAN LUIS OBISPO 262,123 160.7 61.3 49.7 42.0 57.418 MODOC 10,589 8.0 75.6 * 51.3 * 15.5 87.0
19 AMADOR 35,242 28.3 80.4 51.9 32.5 71.3
20 INYO 18,510 16.3 88.2 * 53.7 * 27.5 80.0
21 TEHAMA 57,642 42.7 74.0 54.1 37.7 70.4
22 RIVERSIDE 1,626,134 924.3 56.8 54.6 51.1 58.2
23 SISKIYOU 45,624 34.0 74.5 54.7 36.1 73.3
24 LOS ANGELES 9,925,413 4,279.3 43.1 55.1 53.4 56.7
25 SAN FRANCISCO 794,342 562.3 70.8 55.1 50.5 59.7
26 KERN 694,749 321.3 46.3 55.4 49.4 61.5
27 TRINITY 13,605 10.0 73.5 * 56.0 * 21.1 90.9
28 BUTTE 213,040 181.3 85.1 56.1 47.9 64.4
29 KINGS 129,375 47.0 36.3 56.3 40.1 72.4
30 SANTA CLARA 1,795,132 718.7 40.0 56.3 52.1 60.5
31 LAKE 62,080 61.0 98.3 56.8 42.3 71.4
32 SHASTA 179,892 120.7 67.1 57.5 47.2 67.833 SANTA BARBARA 417,331 249.0 59.7 58.1 50.9 65.3
34 SAN DIEGO 3,005,038 1,551.0 51.6 58.4 55.5 61.4
35 SAN MATEO 759,313 449.3 59.2 58.5 53.1 63.9
36 SAN BERNARDINO 1,771,707 707.7 39.9 58.5 54.2 62.9
CALIFORNIA 35,233,335 17,906.3 50.8 58.9 58.0 59.7
37 VENTURA 763,586 371.0 48.6 59.6 53.5 65.7
38 SUTTER 83,999 53.3 63.5 60.2 44.0 76.5
39 NEVADA 99,670 91.0 91.3 60.3 47.8 72.8
40 STANISLAUS 472,096 249.0 52.7 60.7 53.1 68.2
41 MONTEREY 409,511 197.0 48.1 61.0 52.4 69.5
42 TULARE 388,730 205.7 52.9 62.6 54.0 71.2
43 FRESNO 825,365 434.3 52.6 63.0 57.1 68.9
44 ALAMEDA 1,492,004 823.7 55.2 64.0 59.6 68.3
45 ORANGE 2,872,632 1,333.3 46.4 64.0 60.5 67.4
46 YOLO 167,259 89.3 53.4 64.0 50.7 77.347 HUMBOLDT 129,211 85.3 66.0 64.1 50.5 77.8
48 MENDOCINO 91,963 67.7 73.6 65.2 49.6 80.7
49 MERCED 219,936 107.3 48.8 65.8 53.4 78.3
50 SONOMA 468,682 346.0 73.8 66.1 59.1 73.0
51 CONTRA COSTA 942,662 603.3 64.0 67.4 62.0 72.8
52 MARIN 249,634 177.3 71.0 67.5 57.6 77.5
53 PLACER 252,688 164.0 64.9 67.6 57.2 78.0
54 SAN JOAQUIN 593,538 386.3 65.1 69.0 62.1 75.9
55 SACRAMENTO 1,236,054 786.3 63.6 73.0 67.9 78.1
56 NAPA 129,130 131.3 101.7 74.3 61.5 87.2
57 YUBA 64,938 39.7 61.1 74.8 51.5 98.2
58 SOLANO 408,095 221.7 54.3 78.6 68.1 89.0
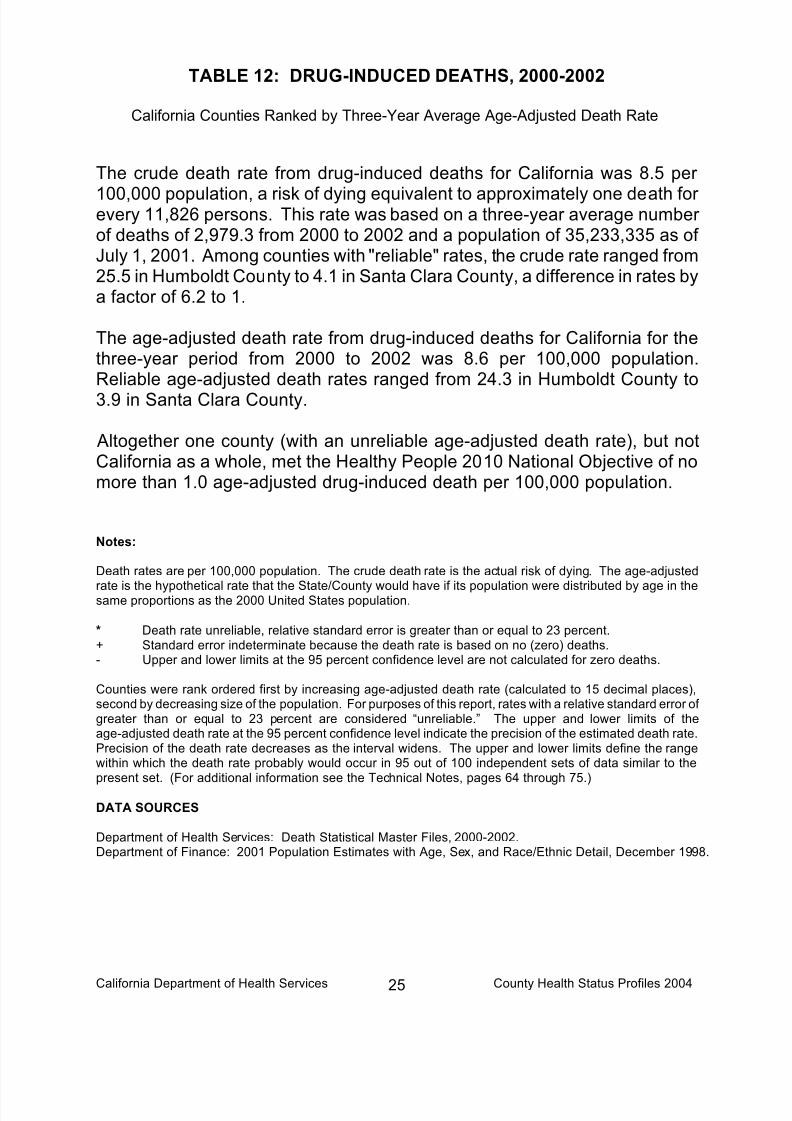
8/6/2019 California County Health Status Profiles 2004
http://slidepdf.com/reader/full/california-county-health-status-profiles-2004 32/85
California Department of Health Services County Health Status Profiles 200425
TABLE 12: DRUG-INDUCED DEATHS, 2000-2002
California Counties Ranked by Three-Year Average Age-Adjusted Death Rate
The crude death rate from drug-induced deaths for California was 8.5 per
100,000 population, a risk of dying equivalent to approximately one death for every 11,826 persons. This rate was based on a three-year average number of deaths of 2,979.3 from 2000 to 2002 and a population of 35,233,335 as of July 1, 2001. Among counties with "reliable" rates, the crude rate ranged from25.5 in Humboldt County to 4.1 in Santa Clara County, a difference in rates bya factor of 6.2 to 1.
The age-adjusted death rate from drug-induced deaths for California for thethree-year period from 2000 to 2002 was 8.6 per 100,000 population.Reliable age-adjusted death rates ranged from 24.3 in Humboldt County to3.9 in Santa Clara County.
Altogether one county (with an unreliable age-adjusted death rate), but notCalifornia as a whole, met the Healthy People 2010 National Objective of nomore than 1.0 age-adjusted drug-induced death per 100,000 population.
Notes:
Death rates are per 100,000 population. The crude death rate is the actual risk of dying. The age-adjusted
rate is the hypothetical rate that the State/County would have if its population were distributed by age in thesame proportions as the 2000 United States population.
* Death rate unreliable, relative standard error is greater than or equal to 23 percent.+ Standard error indeterminate because the death rate is based on no (zero) deaths.- Upper and lower limits at the 95 percent confidence level are not calculated for zero deaths.
Counties were rank ordered first by increasing age-adjusted death rate (calculated to 15 decimal places),second by decreasing size of the population. For purposes of this report, rates with a relative standard error of greater than or equal to 23 percent are considered “unreliable.” The upper and lower limits of theage-adjusted death rate at the 95 percent confidence level indicate the precision of the estimated death rate.Precision of the death rate decreases as the interval widens. The upper and lower limits define the rangewithin which the death rate probably would occur in 95 out of 100 independent sets of data similar to thepresent set. (For additional information see the Technical Notes, pages 64 through 75.)
DATA SOURCES
Department of Health Services: Death Statistical Master Files, 2000-2002.Department of Finance: 2001 Population Estimates with Age, Sex, and Race/Ethnic Detail, December 1998.

8/6/2019 California County Health Status Profiles 2004
http://slidepdf.com/reader/full/california-county-health-status-profiles-2004 33/85
California Department of Health Services County Health Status Profiles 200426
TABLE 12
DRUG-INDUCED DEATHS
RANKED BY THREE-YEAR AVERAGE AGE-ADJUSTED DEATH RATE
CALIFORNIA COUNTIES, 2000-2002
2000-2002
RANK 2001 DEATHS CRUDE AGE-ADJUSTED 95% CONFIDENCE LIMITS
ORDER COUNTY POPULATION (AVERAGE) DEATH RATE DEATH RATE LOWER UPPER
1 ALPINE 1,268 0.0 0.0 + 0.0 + - -
HEALTHY PEOPLE 2010 NATIONAL OBJECTIVE: 1.0
2 MONO 11,081 0.3 3.0 * 2.2 * 0.0 9.8
3 COLUSA 22,012 0.7 3.0 * 3.6 * 0.0 12.4
4 SANTA CLARA 1,795,132 74.0 4.1 3.9 3.0 4.8
5 INYO 18,510 0.7 3.6 * 4.2 * 0.0 14.5
6 SAN BENITO 53,577 2.3 4.4 * 4.8 * 0.0 10.9
7 PLACER 252,688 14.0 5.5 * 5.6 * 2.7 8.6
8 SAN MATEO 759,313 47.0 6.2 5.8 4.2 7.5
9 MARIPOSA 17,218 1.3 7.7 * 6.3 * 0.0 17.1
10 GLENN 30,291 1.7 5.5 * 6.4 * 0.0 16.0
11 YUBA 64,938 3.7 5.6 * 6.5 * 0.0 13.1
12 MERCED 219,936 12.3 5.6 * 6.6 * 2.9 10.3
13 SUTTER 83,999 5.3 6.3 * 6.7 * 1.0 12.4
14 IMPERIAL 161,177 9.7 6.0 * 6.8 * 2.4 11.1
15 SOLANO 408,095 29.0 7.1 7.1 4.5 9.8
16 ORANGE 2,872,632 206.0 7.2 7.3 6.3 8.3
17 LOS ANGELES 9,925,413 731.7 7.4 7.5 6.9 8.018 SIERRA 3,465 0.3 9.6 * 7.6 * 0.0 33.6
19 MADERA 131,052 9.3 7.1 * 7.7 * 2.7 12.7
20 CONTRA COSTA 942,662 75.0 8.0 7.7 6.0 9.5
21 KINGS 129,375 8.7 6.7 * 7.8 * 2.5 13.1
22 MONTEREY 409,511 30.3 7.4 7.9 5.1 10.8
23 AMADOR 35,242 3.0 8.5 * 8.4 * 0.0 18.0
24 PLUMAS 21,044 1.7 7.9 * 8.4 * 0.0 21.6
25 RIVERSIDE 1,626,134 130.7 8.0 8.6 7.1 10.1
CALIFORNIA 35,233,335 2,979.3 8.5 8.6 8.3 8.9
26 ALAMEDA 1,492,004 135.0 9.0 8.7 7.3 10.2
27 SACRAMENTO 1,236,054 108.7 8.8 8.8 7.2 10.5
28 NAPA 129,130 12.0 9.3 * 8.9 * 3.8 14.0
29 SAN BERNARDINO 1,771,707 150.3 8.5 9.0 7.6 10.5
30 FRESNO 825,365 68.0 8.2 9.2 7.0 11.4
31 VENTURA 763,586 69.7 9.1 9.3 7.1 11.532 TULARE 388,730 31.7 8.1 9.4 6.1 12.7
33 MARIN 249,634 25.3 10.1 9.5 5.8 13.2
34 SANTA BARBARA 417,331 40.0 9.6 9.7 6.7 12.8
35 EL DORADO 168,912 16.7 9.9 * 9.8 * 5.1 14.6
36 SAN DIEGO 3,005,038 267.3 8.9 9.8 8.6 11.0
37 TRINITY 13,605 1.0 7.4 * 10.1 * 0.0 29.8
38 SONOMA 468,682 50.7 10.8 10.2 7.4 13.1
39 SANTA CRUZ 264,525 28.3 10.7 10.3 6.5 14.2
40 TEHAMA 57,642 5.7 9.8 * 10.4 * 1.8 19.0
41 YOLO 167,259 14.3 8.6 * 10.8 * 5.1 16.4
42 LASSEN 36,759 4.3 11.8 * 11.7 * 0.5 22.8
43 SAN JOAQUIN 593,538 66.7 11.2 11.9 9.1 14.8
44 SAN LUIS OBISPO 262,123 28.0 10.7 12.0 7.5 16.5
45 TUOLUMNE 57,497 7.7 13.3 * 12.6 * 3.6 21.6
46 NEVADA 99,670 13.0 13.0 * 12.8 * 5.6 20.047 CALAVERAS 43,392 5.0 11.5 * 13.0 * 1.3 24.6
48 BUTTE 213,040 28.3 13.3 13.7 8.7 18.8
49 KERN 694,749 89.0 12.8 14.1 11.2 17.0
50 SISKIYOU 45,624 7.0 15.3 * 15.0 * 3.6 26.5
51 STANISLAUS 472,096 66.3 14.1 15.1 11.5 18.7
52 MENDOCINO 91,963 13.7 14.9 * 15.4 * 7.1 23.7
53 SAN FRANCISCO 794,342 140.0 17.6 15.6 13.0 18.3
54 MODOC 10,589 1.7 15.7 * 16.7 * 0.0 42.6
55 SHASTA 179,892 29.0 16.1 16.8 10.6 22.9
56 LAKE 62,080 13.3 21.5 * 23.0 * 10.3 35.6
57 HUMBOLDT 129,211 33.0 25.5 24.3 16.0 32.7
58 DEL NORTE 31,801 10.0 31.4 * 33.2 * 12.6 53.8
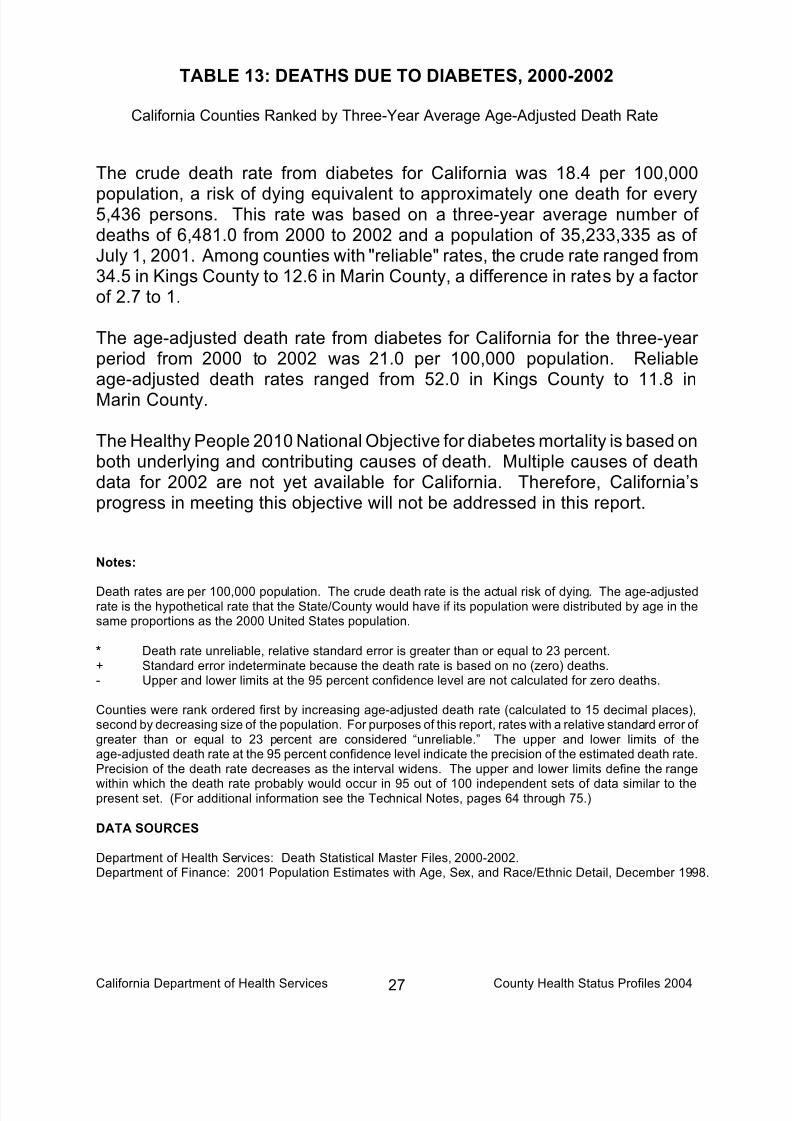
8/6/2019 California County Health Status Profiles 2004
http://slidepdf.com/reader/full/california-county-health-status-profiles-2004 34/85
California Department of Health Services County Health Status Profiles 200427
TABLE 13: DEATHS DUE TO DIABETES, 2000-2002
California Counties Ranked by Three-Year Average Age-Adjusted Death Rate
The crude death rate from diabetes for California was 18.4 per 100,000
population, a risk of dying equivalent to approximately one death for every5,436 persons. This rate was based on a three-year average number of deaths of 6,481.0 from 2000 to 2002 and a population of 35,233,335 as of July 1, 2001. Among counties with "reliable" rates, the crude rate ranged from34.5 in Kings County to 12.6 in Marin County, a difference in rates by a factor of 2.7 to 1.
The age-adjusted death rate from diabetes for California for the three-year period from 2000 to 2002 was 21.0 per 100,000 population. Reliableage-adjusted death rates ranged from 52.0 in Kings County to 11.8 inMarin County.
The Healthy People 2010 National Objective for diabetes mortality is based onboth underlying and contributing causes of death. Multiple causes of deathdata for 2002 are not yet available for California. Therefore, California’sprogress in meeting this objective will not be addressed in this report.
Notes:
Death rates are per 100,000 population. The crude death rate is the actual risk of dying. The age-adjustedrate is the hypothetical rate that the State/County would have if its population were distributed by age in thesame proportions as the 2000 United States population.
* Death rate unreliable, relative standard error is greater than or equal to 23 percent.+ Standard error indeterminate because the death rate is based on no (zero) deaths.- Upper and lower limits at the 95 percent confidence level are not calculated for zero deaths.
Counties were rank ordered first by increasing age-adjusted death rate (calculated to 15 decimal places),second by decreasing size of the population. For purposes of this report, rates with a relative standard error of greater than or equal to 23 percent are considered “unreliable.” The upper and lower limits of theage-adjusted death rate at the 95 percent confidence level indicate the precision of the estimated death rate.Precision of the death rate decreases as the interval widens. The upper and lower limits define the range
within which the death rate probably would occur in 95 out of 100 independent sets of data similar to thepresent set. (For additional information see the Technical Notes, pages 64 through 75.)
DATA SOURCES
Department of Health Services: Death Statistical Master Files, 2000-2002.Department of Finance: 2001 Population Estimates with Age, Sex, and Race/Ethnic Detail, December 1998.

8/6/2019 California County Health Status Profiles 2004
http://slidepdf.com/reader/full/california-county-health-status-profiles-2004 35/85
California Department of Health Services County Health Status Profiles 200428
TABLE 13
DEATHS DUE TO DIABETES
RANKED BY THREE-YEAR AVERAGE AGE-ADJUSTED DEATH RATE
CALIFORNIA COUNTIES, 2000-2002
2000-2002
RANK 2001 DEATHS CRUDE AGE-ADJUSTED 95% CONFIDENCE LIMITS
ORDER COUNTY POPULATION (AVERAGE) DEATH RATE DEATH RATE LOWER UPPER
HEALTHY PEOPLE 2010 NATIONAL OBJECTIVE: SEE COMMENT
1 ALPINE 1,268 0.0 0.0 + 0.0 + - -
2 MARIPOSA 17,218 2.3 13.6 * 8.7 * 0.0 20.03 CALAVERAS 43,392 5.7 13.1 * 8.8 * 1.5 16.2
4 COLUSA 22,012 2.0 9.1 * 9.0 * 0.0 21.5
5 PLUMAS 21,044 2.7 12.7 * 9.1 * 0.0 20.1
6 DEL NORTE 31,801 3.3 10.5 * 9.3 * 0.0 19.4
7 INYO 18,510 3.0 16.2 * 10.6 * 0.0 22.8
8 SAN BENITO 53,577 5.0 9.3 * 10.9 * 1.3 20.6
9 NEVADA 99,670 15.3 15.4 * 11.0 * 5.3 16.7
10 AMADOR 35,242 6.0 17.0 * 11.5 * 2.2 20.7
11 TUOLUMNE 57,497 8.7 15.1 * 11.5 * 3.8 19.3
12 MARIN 249,634 31.3 12.6 11.8 7.7 16.0
13 SAN MATEO 759,313 100.0 13.2 12.8 10.3 15.3
14 GLENN 30,291 4.3 14.3 * 13.0 * 0.7 25.4
15 LASSEN 36,759 4.3 11.8 * 13.4 * 0.8 26.0
16 SAN FRANCISCO 794,342 131.0 16.5 13.6 11.3 15.9
17 EL DORADO 168,912 23.3 13.8 13.6 8.1 19.218 SAN LUIS OBISPO 262,123 44.0 16.8 14.6 10.2 18.9
19 MODOC 10,589 2.3 22.0 * 15.3 * 0.0 35.0
20 SANTA CRUZ 264,525 38.7 14.6 15.8 10.8 20.8
21 PLACER 252,688 39.3 15.6 16.0 11.0 21.0
22 BUTTE 213,040 47.3 22.2 16.6 11.8 21.4
23 SANTA CLARA 1,795,132 235.0 13.1 16.8 14.6 19.0
24 SONOMA 468,682 84.3 18.0 16.8 13.2 20.4
25 SUTTER 83,999 14.7 17.5 * 16.9 * 8.2 25.6
26 RIVERSIDE 1,626,134 280.3 17.2 17.3 15.3 19.3
27 SIERRA 3,465 1.0 28.9 * 17.4 * 0.0 52.3
28 SANTA BARBARA 417,331 71.3 17.1 17.5 13.4 21.5
29 CONTRA COSTA 942,662 163.3 17.3 17.6 14.9 20.3
30 LAKE 62,080 17.3 27.9 * 17.9 * 9.2 26.5
31 ORANGE 2,872,632 414.0 14.4 18.4 16.6 20.2
32 SAN DIEGO 3,005,038 482.3 16.1 18.5 16.8 20.2
33 NAPA 129,130 29.7 23.0 18.8 12.0 25.6
34 MENDOCINO 91,963 19.3 21.0 19.1 10.5 27.6
35 SHASTA 179,892 39.7 22.1 19.2 13.2 25.2
36 TRINITY 13,605 3.3 24.5 * 19.2 * 0.0 40.5
37 MONO 11,081 1.7 15.0 * 19.3 * 0.0 49.6
38 SISKIYOU 45,624 11.3 24.8 * 19.8 * 8.0 31.6
39 SACRAMENTO 1,236,054 232.3 18.8 20.9 18.2 23.5
CALIFORNIA 35,233,335 6,481.0 18.4 21.0 20.5 21.5
40 ALAMEDA 1,492,004 279.3 18.7 21.3 18.8 23.8
41 MONTEREY 409,511 70.0 17.1 21.4 16.4 26.4
42 TEHAMA 57,642 16.7 28.9 * 21.6 * 11.1 32.1
43 YOLO 167,259 30.7 18.3 22.5 14.5 30.5
44 VENTURA 763,586 150.3 19.7 23.5 19.7 27.2
45 SOLANO 408,095 72.3 17.7 24.2 18.6 29.9
46 LOS ANGELES 9,925,413 1,963.7 19.8 24.7 23.6 25.8
47 IMPERIAL 161,177 32.0 19.9 25.4 16.6 34.3
48 STANISLAUS 472,096 104.3 22.1 25.6 20.7 30.6
49 KERN 694,749 150.0 21.6 25.9 21.7 30.0
50 FRESNO 825,365 182.3 22.1 26.8 22.9 30.7
51 SAN JOAQUIN 593,538 146.7 24.7 27.1 22.7 31.5
52 YUBA 64,938 14.7 22.6 * 27.3 * 13.3 41.3
53 MADERA 131,052 34.3 26.2 28.0 18.6 37.4
54 HUMBOLDT 129,211 37.7 29.2 29.1 19.8 38.4
55 TULARE 388,730 95.3 24.5 29.7 23.7 35.7
56 SAN BERNARDINO 1,771,707 379.0 21.4 29.7 26.7 32.7
57 MERCED 219,936 56.0 25.5 33.6 24.8 42.4
58 KINGS 129,375 44.7 34.5 52.0 36.6 67.3
Comment: HP2010 objective based on both underlying and contributing causes of death. This report excludes multiple/contributing causes of death.

8/6/2019 California County Health Status Profiles 2004
http://slidepdf.com/reader/full/california-county-health-status-profiles-2004 36/85
California Department of Health Services County Health Status Profiles 200429
TABLE 14: REPORTED INCIDENCE OF HEPATITIS C, 2000-2002
California Counties Ranked by Three-Year Average Crude Case Rate
The crude case rate of newly reported hepatitis C cases for California was
0.27 cases per 100,000 population or approximately one newly reportedhepatitis C case for every 365,757 persons. This rate was based on the2000 to 2002 average reported number of new cases of 96.33 and apopulation of 35,233,335 as of July 1, 2001. The only reliable crude case ratewas in Los Angeles County, 0.19 per 100,000 population; however 21counties reported no new incidence of hepatitis C during the three-year period.
Altogether 46 counties (1 with a reliable case rate) and California as a wholemet the Healthy People 2010 National Objective of 1.00 case per 100,000population.
The data in this table are not comparable to the hepatitis C data reported inCounty Health Status Profiles 2001 and 2002 reports. Data in those reportswere based on total number of reported cases, not new cases. As with other morbidity data, undercounts may occur in many counties.
Notes:
Case rates are per 100,000 population.
* Case rate unreliable, relative standard error is greater than or equal to 23 percent.+ Standard error indeterminate because the case rate is based on no (zero) cases.- Upper and lower limits at the 95 percent confidence level are not calculated for zero cases.
Counties were rank ordered first by increasing case rate (calculated to 15 decimal places), second bydecreasing size of the population. For purposes of this report, rates with a relative standard error of greater than or equal to 23 percent are considered “unreliable.” The upper and lower limits of the crude case rate atthe 95 percent confidence level indicate the precision of the estimated case rate. Precision of the case ratedecreases as the interval widens. The upper and lower limits define the range within which the crude caserate probably would occur in 95 out of 100 independent sets of data similar to the present set. (For additionalinformation see the Technical Notes, pages 64 through 75.)
DATA SOURCES
Department of Health Services: Disease Investigation and Surveillance Branch.Department of Finance: 2001 Population Estimates with Age, Sex, and Race/Ethnic Detail, December 1998.

8/6/2019 California County Health Status Profiles 2004
http://slidepdf.com/reader/full/california-county-health-status-profiles-2004 37/85
California Department of Health Services County Health Status Profiles 200430
TABLE 14
REPORTED INCIDENCE OF HEPATITIS C
RANKED BY THREE-YEAR AVERAGE CRUDE CASE RATE
CALIFORNIA COUNTIES, 2000-2002
2000-2002
RANK 2001 CASES CRUDE 95% CONFIDENCE LIMITS
ORDER COUNTY POPULATION (AVERAGE) CASE RATE LOWER UPPER
1 SAN DIEGO 3,005,038 0.00 0.00 + - -
2 KERN 694,749 0.00 0.00 + - -
3 SANTA BARBARA 417,331 0.00 0.00 + - -4 SOLANO 408,095 0.00 0.00 + - -
5 SANTA CRUZ 264,525 0.00 0.00 + - -
6 SAN LUIS OBISPO 262,123 0.00 0.00 + - -
7 YOLO 167,259 0.00 0.00 + - -
8 MADERA 131,052 0.00 0.00 + - -
9 NAPA 129,130 0.00 0.00 + - -
10 MENDOCINO 91,963 0.00 0.00 + - -
11 SISKIYOU 45,624 0.00 0.00 + - -
12 CALAVERAS 43,392 0.00 0.00 + - -
13 LASSEN 36,759 0.00 0.00 + - -
14 AMADOR 35,242 0.00 0.00 + - -
15 PLUMAS 21,044 0.00 0.00 + - -
16 INYO 18,510 0.00 0.00 + - -
17 MARIPOSA 17,218 0.00 0.00 + - -
18 MONO 11,081 0.00 0.00 + - -19 MODOC 10,589 0.00 0.00 + - -
20 SIERRA 3,465 0.00 0.00 + - -
21 ALPINE 1,268 0.00 0.00 + - -
22 CONTRA COSTA 942,662 0.33 0.04 * 0.00 0.16
23 VENTURA 763,586 0.33 0.04 * 0.00 0.19
24 SAN MATEO 759,313 0.33 0.04 * 0.00 0.19
25 SANTA CLARA 1,795,132 1.33 0.07 * 0.00 0.20
26 ALAMEDA 1,492,004 1.67 0.11 * 0.00 0.28
27 ORANGE 2,872,632 3.67 0.13 * 0.00 0.26
28 PLACER 252,688 0.33 0.13 * 0.00 0.58
29 MARIN 249,634 0.33 0.13 * 0.00 0.59
30 STANISLAUS 472,096 0.67 0.14 * 0.00 0.48
31 RIVERSIDE 1,626,134 2.33 0.14 * 0.00 0.33
32 MERCED 219,936 0.33 0.15 * 0.00 0.67
33 FRESNO 825,365 1.33 0.16 * 0.00 0.44
34 SAN JOAQUIN 593,538 1.00 0.17 * 0.00 0.50
35 SHASTA 179,892 0.33 0.19 * 0.00 0.81
36 LOS ANGELES 9,925,413 19.00 0.19 0.11 0.28
37 SAN BERNARDINO 1,771,707 4.00 0.23 * 0.00 0.45
38 KINGS 129,375 0.33 0.26 * 0.00 1.13
CALIFORNIA 35,233,335 96.33 0.27 0.22 0.33
39 SAN FRANCISCO 794,342 2.67 0.34 * 0.00 0.74
40 SUTTER 83,999 0.33 0.40 * 0.00 1.74
41 MONTEREY 409,511 1.67 0.41 * 0.00 1.02
42 IMPERIAL 161,177 0.67 0.41 * 0.00 1.41
43 SONOMA 468,682 2.33 0.50 * 0.00 1.14
44 SACRAMENTO 1,236,054 6.33 0.51 * 0.11 0.91
45 SAN BENITO 53,577 0.33 0.62 * 0.00 2.73
46 NEVADA 99,670 1.00 1.00 * 0.00 2.97
HEALTHY PEOPLE 2010 NATIONAL OBJECTIVE 1.00
47 DEL NORTE 31,801 0.33 1.05 * 0.00 4.61
48 LAKE 62,080 0.67 1.07 * 0.00 3.65
49 BUTTE 213,040 3.00 1.41 * 0.00 3.00
50 COLUSA 22,012 0.33 1.51 * 0.00 6.66
51 HUMBOLDT 129,211 2.33 1.81 * 0.00 4.12
52 TRINITY 13,605 0.33 2.45 * 0.00 10.77
53 TULARE 388,730 9.67 2.49 * 0.92 4.05
54 TUOLUMNE 57,497 1.67 2.90 * 0.00 7.30
55 EL DORADO 168,912 5.00 2.96 * 0.37 5.55
56 GLENN 30,291 1.00 3.30 * 0.00 9.77
57 TEHAMA 57,642 2.33 4.05 * 0.00 9.24
58 YUBA 64,938 16.67 25.67 * 13.34 37.99

8/6/2019 California County Health Status Profiles 2004
http://slidepdf.com/reader/full/california-county-health-status-profiles-2004 38/85
California Department of Health Services County Health Status Profiles 200431
TABLE 15: REPORTED INCIDENCE OF AIDSAMONG POPULATION AGES 13 YEARS AND OVER, 2000-2002
California Counties Ranked by Three-Year Average Crude Case Rate
The crude case rate of reported AIDS cases for Californians aged 13 yearsand older was 15.23 cases per 100,000 population aged 13 years and over or approximately one reported AIDS case for every 6,567 persons. This ratewas based on a 2000 to 2002 three-year average reported number of cases of 4,228.33 and a population of 27,766,460 as of July 1, 2001.
Among counties with "reliable" rates, the crude case rate ranged from 72.32 inSan Francisco County to 5.35 in Stanislaus County, a difference in rates by afactor of 13.5 to 1. Five counties reported no new incidence of AIDS duringthe three-year period for this age group.
Altogether 6 counties (none with reliable case rates), but not California as awhole, met the Healthy People 2010 National Objective of no more than 1.00case per 100,000 population aged 13 years and older.
Notes:
Case rates are per 100,000 population.
* Case rate unreliable, relative standard error is greater than or equal to 23 percent.+ Standard error indeterminate because the case rate is based on no (zero) cases.- Upper and lower limits at the 95 percent confidence level are not calculated for zero cases.
Counties were rank ordered first by increasing case rate (calculated to 15 decimal places), second bydecreasing size of the population. For purposes of this report, rates with a relative standard error of greater than or equal to 23 percent are considered “unreliable.” The upper and lower limits of the crude case rate atthe 95 percent confidence level indicate the precision of the estimated case rate. Precision of the case ratedecreases as the interval widens. The upper and lower limits define the range within which the crude caserate probably would occur in 95 out of 100 independent sets of data similar to the present set. (For additionalinformation see the Technical Notes, pages 64 through 75.)
DATA SOURCES
Department of Health Services: Office of AIDS, AIDS Case Registry.Department of Finance: 2001 Population Estimates with Age, Sex, and Race/Ethnic Detail, December 1998.

8/6/2019 California County Health Status Profiles 2004
http://slidepdf.com/reader/full/california-county-health-status-profiles-2004 39/85
California Department of Health Services County Health Status Profiles 200432
TABLE 15
REPORTED INCIDENCE OF AIDS AMONG POPULATION AGES 13 YEARS AND OVER
RANKED BY THREE-YEAR AVERAGE CRUDE CASE RATE
CALIFORNIA COUNTIES, 2000-2002
2001 2000-2002
RANK POPULATION CASES CRUDE 95% CONFIDENCE LIMITS
ORDER COUNTY AGED 13 AND OVER (AVERAGE) CASE RATE LOWER UPPER
1 COLUSA 17,307 0.00 0.00 + - -
2 INYO 15,483 0.00 0.00 + - -
3 MARIPOSA 14,722 0.00 0.00 + - -4 SIERRA 3,143 0.00 0.00 + - -
5 ALPINE 1,118 0.00 0.00 + - -
6 TEHAMA 47,325 0.33 0.70 * 0.00 3.10
HEALTHY PEOPLE 2010 NATIONAL OBJECTIVE 1.00
7 SUTTER 66,938 1.00 1.49 * 0.00 4.42
8 SHASTA 148,110 2.67 1.80 * 0.00 3.96
9 PLUMAS 18,396 0.33 1.81 * 0.00 7.96
10 NEVADA 85,559 2.33 2.73 * 0.00 6.23
11 TRINITY 11,720 0.33 2.84 * 0.00 12.50
12 PLACER 206,106 6.00 2.91 * 0.58 5.24
13 TUOLUMNE 49,911 1.67 3.34 * 0.00 8.41
14 CALAVERAS 36,890 1.33 3.61 * 0.00 9.75
15 MODOC 8,952 0.33 3.72 * 0.00 16.36
16 TULARE 292,644 11.00 3.76 * 1.54 5.98
17 SAN BENITO 41,882 1.67 3.98 * 0.00 10.0218 NAPA 107,733 4.33 4.02 * 0.24 7.81
19 EL DORADO 140,262 5.67 4.04 * 0.71 7.37
20 YUBA 49,390 2.00 4.05 * 0.00 9.66
21 SISKIYOU 38,752 1.67 4.30 * 0.00 10.83
22 BUTTE 177,078 8.00 4.52 * 1.39 7.65
23 LASSEN 31,618 1.67 5.27 * 0.00 13.27
24 STANISLAUS 367,603 19.67 5.35 2.99 7.71
25 AMADOR 30,912 1.67 5.39 * 0.00 13.58
26 GLENN 23,797 1.33 5.60 * 0.00 15.11
27 VENTURA 606,087 34.67 5.72 3.82 7.62
28 SANTA BARBARA 335,704 19.33 5.76 3.19 8.33
29 HUMBOLDT 107,882 6.33 5.87 * 1.30 10.44
30 IMPERIAL 122,503 7.67 6.26 * 1.83 10.69
31 MERCED 165,475 10.67 6.45 * 2.58 10.31
32 KINGS 99,793 7.33 7.35*
2.03 12.6733 YOLO 135,624 10.00 7.37 * 2.80 11.94
34 DEL NORTE 26,684 2.00 7.50 * 0.00 17.88
35 SANTA CRUZ 215,421 16.67 7.74 * 4.02 11.45
36 SAN MATEO 619,319 48.33 7.80 5.60 10.00
37 SANTA CLARA 1,441,271 119.00 8.26 6.77 9.74
38 MENDOCINO 76,101 6.33 8.32 * 1.84 14.80
39 FRESNO 628,401 54.00 8.59 6.30 10.89
40 MONTEREY 315,600 27.33 8.66 5.41 11.91
41 SAN BERNARDINO 1,346,903 120.67 8.96 7.36 10.56
42 LAKE 51,955 4.67 8.98 * 0.83 17.13
43 ORANGE 2,234,853 217.00 9.71 8.42 11.00
44 SAN JOAQUIN 464,896 45.67 9.82 6.97 12.67
45 SACRAMENTO 982,780 98.00 9.97 8.00 11.95
46 SAN LUIS OBISPO 221,475 22.67 10.23 6.02 14.45
47 SONOMA 387,929 40.00 10.31 7.12 13.51
48 CONTRA COSTA 770,709 80.33 10.42 8.14 12.7049 MONO 9,276 1.00 10.78 * 0.00 31.91
CALIFORNIA 27,766,460 4,228.33 15.23 14.77 15.69
50 MADERA 102,579 16.33 15.92 * 8.20 23.64
51 RIVERSIDE 1,267,928 207.67 16.38 14.15 18.61
52 SOLANO 325,387 56.33 17.31 12.79 21.83
53 KERN 531,807 92.67 17.42 13.88 20.97
54 ALAMEDA 1,199,341 220.67 18.40 15.97 20.83
55 SAN DIEGO 2,371,441 441.67 18.62 16.89 20.36
56 MARIN 211,884 42.67 20.14 14.09 26.18
57 LOS ANGELES 7,679,460 1,586.33 20.66 19.64 21.67
58 SAN FRANCISCO 676,641 489.33 72.32 65.91 78.73

8/6/2019 California County Health Status Profiles 2004
http://slidepdf.com/reader/full/california-county-health-status-profiles-2004 40/85
California Department of Health Services County Health Status Profiles 200433
TABLE 16: REPORTED INCIDENCE OF TUBERCULOSIS, 2000-2002
California Counties Ranked by Three-Year Average Crude Case Rate
The crude case rate of reported tuberculosis cases for California was 9.27
cases per 100,000 population or approximately one reported tuberculosiscase for every 10,788 persons. This rate was based on a 2000 to 2002 three-year average reported number of cases of 3,266.00 and a population of 35,233,335 as of July 1, 2001.
Among counties with "reliable" rates, the crude case rate ranged from 20.90 inSan Francisco County to 4.10 in Stanislaus County, a difference in rates by afactor of 5.1 to 1. Five counties reported no new incidence of tuberculosisduring the three-year period.
Altogether 10 counties (none with reliable case rates), but not California as awhole, met the Healthy People 2010 National Objective of no more than 1.00case per 100,000 population.
The Healthy People 2010 National Objective of 1.00 case per 100,000population reflects a decrease from the Healthy People 2000 NationalObjective of no more than 3.50 cases per 100,000 population.
Notes:
Case rates are per 100,000 population.
* Case rate unreliable, relative standard error is greater than or equal to 23 percent.+ Standard error indeterminate because the case rate is based on no (zero) cases.- Upper and lower limits at the 95 percent confidence level are not calculated for zero cases.
Counties were rank ordered first by increasing case rate (calculated to 15 decimal places), second bydecreasing size of the population. For purposes of this report, rates with a relative standard error of greater than or equal to 23 percent are considered “unreliable.” The upper and lower limits of the crude case rate atthe 95 percent confidence level indicate the precision of the estimated case rate. Precision of the case ratedecreases as the interval widens. The upper and lower limits define the range within which the crude caserate probably would occur in 95 out of 100 independent sets of data similar to the present set. (For additional
information see the Technical Notes, pages 64 through 75.)
DATA SOURCES
Department of Health Services: Division of Communicable Disease Control.Department of Finance: 2001 Population Estimates with Age, Sex, and Race/Ethnic Detail, December 1998.

8/6/2019 California County Health Status Profiles 2004
http://slidepdf.com/reader/full/california-county-health-status-profiles-2004 41/85
California Department of Health Services County Health Status Profiles 200434
TABLE 16
REPORTED INCIDENCE OF TUBERCULOSIS
RANKED BY THREE-YEAR AVERAGE CRUDE CASE RATE
CALIFORNIA COUNTIES, 2000-2002
2000-2002
RANK 2001 CASES CRUDE 95% CONFIDENCE LIMITS
ORDER COUNTY POPULATION (AVERAGE) CASE RATE LOWER UPPER
1 AMADOR 35,242 0.00 0.00 + - -
2 TRINITY 13,605 0.00 0.00 + - -
3 MONO 11,081 0.00 0.00 + - -4 SIERRA 3,465 0.00 0.00 + - -
5 ALPINE 1,268 0.00 0.00 + - -
6 NEVADA 99,670 0.67 0.67 * 0.00 2.27
7 SISKIYOU 45,624 0.33 0.73 * 0.00 3.21
8 CALAVERAS 43,392 0.33 0.77 * 0.00 3.38
9 LASSEN 36,759 0.33 0.91 * 0.00 3.99
10 PLACER 252,688 2.33 0.92 * 0.00 2.11
HEALTHY PEOPLE 2010 NATIONAL OBJECTIVE 1.00
11 DEL NORTE 31,801 0.33 1.05 * 0.00 4.61
12 GLENN 30,291 0.33 1.10 * 0.00 4.84
13 BUTTE 213,040 3.33 1.56 * 0.00 3.24
14 PLUMAS 21,044 0.33 1.58 * 0.00 6.96
15 TEHAMA 57,642 1.00 1.73 * 0.00 5.14
16 TUOLUMNE 57,497 1.00 1.74 * 0.00 5.15
17 SANTA CRUZ 264,525 5.67 2.14 * 0.38 3.9118 LAKE 62,080 1.33 2.15 * 0.00 5.79
19 EL DORADO 168,912 4.00 2.37 * 0.05 4.69
20 SHASTA 179,892 4.33 2.41 * 0.14 4.68
21 SONOMA 468,682 13.67 2.92 * 1.37 4.46
22 NAPA 129,130 4.00 3.10 * 0.06 6.13
23 SAN LUIS OBISPO 262,123 8.67 3.31 * 1.11 5.51
24 YOLO 167,259 6.00 3.59 * 0.72 6.46
25 INYO 18,510 0.67 3.60 * 0.00 12.25
26 MARIPOSA 17,218 0.67 3.87 * 0.00 13.17
27 STANISLAUS 472,096 19.33 4.10 2.27 5.92
28 RIVERSIDE 1,626,134 68.33 4.20 3.21 5.20
29 TULARE 388,730 17.00 4.37 * 2.29 6.45
30 COLUSA 22,012 1.00 4.54 * 0.00 13.45
31 SAN BERNARDINO 1,771,707 83.33 4.70 3.69 5.71
32 MENDOCINO 91,963 4.33 4.71*
0.28 9.1533 HUMBOLDT 129,211 6.33 4.90 * 1.08 8.72
34 MARIN 249,634 12.67 5.07 * 2.28 7.87
35 SANTA BARBARA 417,331 22.00 5.27 3.07 7.47
36 KINGS 129,375 8.00 6.18 * 1.90 10.47
37 MERCED 219,936 13.67 6.21 * 2.92 9.51
38 MODOC 10,589 0.67 6.30 * 0.00 21.41
39 SUTTER 83,999 5.33 6.35 * 0.96 11.74
40 SAN BENITO 53,577 3.67 6.84 * 0.00 13.85
41 VENTURA 763,586 54.00 7.07 5.19 8.96
42 SOLANO 408,095 29.33 7.19 4.59 9.79
43 KERN 694,749 51.67 7.44 5.41 9.46
44 MONTEREY 409,511 32.67 7.98 5.24 10.71
45 SAN MATEO 759,313 63.67 8.38 6.33 10.44
46 ORANGE 2,872,632 251.33 8.75 7.67 9.83
47 CONTRA COSTA 942,662 83.67 8.88 6.97 10.78
CALIFORNIA 35,233,335 3,266.00 9.27 8.95 9.5948 MADERA 131,052 12.33 9.41 * 4.16 14.66
49 SACRAMENTO 1,236,054 118.00 9.55 7.82 11.27
50 SAN JOAQUIN 593,538 58.33 9.83 7.31 12.35
51 SAN DIEGO 3,005,038 317.67 10.57 9.41 11.73
52 YUBA 64,938 7.00 10.78 * 2.79 18.77
53 LOS ANGELES 9,925,413 1,117.00 11.25 10.59 11.91
54 FRESNO 825,365 95.67 11.59 9.27 13.91
55 SANTA CLARA 1,795,132 234.67 13.07 11.40 14.74
56 ALAMEDA 1,492,004 221.33 14.83 12.88 16.79
57 IMPERIAL 161,177 26.67 16.54 10.27 22.82
58 SAN FRANCISCO 794,342 166.00 20.90 17.72 24.08

8/6/2019 California County Health Status Profiles 2004
http://slidepdf.com/reader/full/california-county-health-status-profiles-2004 42/85
California Department of Health Services County Health Status Profiles 200435
TABLE 17: REPORTED INCIDENCE OF CHLAMYDIA, 2000-2002
California Counties Ranked by Three-Year Average Crude Case Rate
The crude case rate of reported chlamydia cases for California was 291.09
cases per 100,000 population or approximately one reported chlamydia casefor every 344 persons. This rate was based on a 2000 to 2002 three-year average reported number of cases of 102,560.67 and a population of 35,233,335 as of July 1, 2001.
Among counties with "reliable" rates, the crude case rate ranged from 513.83in Fresno County to 58.38 in Calaveras County, a difference in rates by afactor of 8.8 to 1.
Prevalence data are not available in California to evaluate the Healthy People2010 National Objective of no more than 3 percent testing positive in thepopulation aged 15 to 24 years.
Notes:
Case rates are per 100,000 population.
* Case rate unreliable, relative standard error is greater than or equal to 23 percent.+ Standard error indeterminate because the case rate is based on no (zero) cases.- Upper and lower limits at the 95 percent confidence level are not calculated for zero cases.
Counties were rank ordered first by increasing case rate (calculated to 15 decimal places), second bydecreasing size of the population. For purposes of this report, rates with a relative standard error of greater than or equal to 23 percent are considered “unreliable.” The upper and lower limits of the crude case rate atthe 95 percent confidence level indicate the precision of the estimated case rate. Precision of the case ratedecreases as the interval widens. The upper and lower limits define the range within which the crude caserate probably would occur in 95 out of 100 independent sets of data similar to the present set. (For additionalinformation see the Technical Notes, pages 64 through 75.)
DATA SOURCES
Department of Health Services: Division of Communicable Disease Control.Department of Finance: 2001 Population Estimates with Age, Sex, and Race/Ethnic Detail, December 1998.

8/6/2019 California County Health Status Profiles 2004
http://slidepdf.com/reader/full/california-county-health-status-profiles-2004 43/85
California Department of Health Services County Health Status Profiles 200436
TABLE 17
REPORTED INCIDENCE OF CHLAMYDIA
RANKED BY THREE-YEAR AVERAGE CRUDE CASE RATE
CALIFORNIA COUNTIES, 2000-2002
2000-2002
RANK 2001 CASES CRUDE 95% CONFIDENCE LIMITS
ORDER COUNTY POPULATION (AVERAGE) CASE RATE LOWER UPPER
HEALTHY PEOPLE 2010 NATIONAL OBJECTIVE SEE COMMENT
1 TRINITY 13,605 6.67 49.00 * 11.80 86.20
2 ALPINE 1,268 0.67 52.58 * 0.00 178.793 PLUMAS 21,044 11.33 53.86 * 22.50 85.21
4 CALAVERAS 43,392 25.33 58.38 35.65 81.12
5 AMADOR 35,242 21.33 60.53 34.85 86.22
6 MARIPOSA 17,218 12.67 73.57 * 33.05 114.08
7 LASSEN 36,759 28.00 76.17 47.96 104.39
8 MODOC 10,589 8.67 81.85 * 27.35 136.34
9 EL DORADO 168,912 143.33 84.86 70.96 98.75
10 INYO 18,510 16.00 86.44 * 44.08 128.80
11 NEVADA 99,670 86.33 86.62 68.35 104.89
12 NAPA 129,130 117.00 90.61 74.19 107.02
13 PLACER 252,688 240.00 94.98 82.96 107.00
14 DEL NORTE 31,801 30.33 95.38 61.44 129.33
15 SIERRA 3,465 3.33 96.20 * 0.00 199.47
16 TUOLUMNE 57,497 62.00 107.83 80.99 134.67
17 MONO 11,081 12.00 108.29 * 47.02 169.5718 MARIN 249,634 291.67 116.84 103.43 130.25
19 LAKE 62,080 82.67 133.16 104.46 161.87
20 SONOMA 468,682 627.33 133.85 123.38 144.32
21 SAN LUIS OBISPO 262,123 361.33 137.85 123.64 152.06
22 GLENN 30,291 42.00 138.66 96.72 180.59
23 COLUSA 22,012 31.33 142.35 92.50 192.19
24 SISKIYOU 45,624 68.33 149.77 114.26 185.29
25 SAN BENITO 53,577 86.00 160.52 126.59 194.44
26 SAN MATEO 759,313 1,227.67 161.68 152.64 170.73
27 VENTURA 763,586 1,299.00 170.12 160.87 179.37
28 TEHAMA 57,642 99.33 172.33 138.44 206.22
29 BUTTE 213,040 369.00 173.21 155.53 190.88
30 YOLO 167,259 308.00 184.15 163.58 204.71
31 MENDOCINO 91,963 169.67 184.49 156.73 212.26
32 ORANGE 2,872,632 5,322.00 185.27
180.29 190.2433 SUTTER 83,999 155.67 185.32 156.21 214.43
34 SANTA CRUZ 264,525 547.00 206.79 189.46 224.12
35 SANTA BARBARA 417,331 888.67 212.94 198.94 226.94
36 RIVERSIDE 1,626,134 3,525.00 216.77 209.62 223.93
37 SHASTA 179,892 406.33 225.88 203.91 247.84
38 SANTA CLARA 1,795,132 4,125.00 229.79 222.78 236.80
39 CONTRA COSTA 942,662 2,191.67 232.50 222.76 242.23
40 MERCED 219,936 524.00 238.25 217.85 258.65
41 HUMBOLDT 129,211 327.33 253.33 225.89 280.78
42 STANISLAUS 472,096 1,204.00 255.03 240.63 269.44
43 YUBA 64,938 169.33 260.76 221.49 300.04
44 MADERA 131,052 357.00 272.41 244.15 300.67
45 IMPERIAL 161,177 443.33 275.06 249.46 300.66
46 MONTEREY 409,511 1,138.67 278.06 261.90 294.21
47 SOLANO 408,095 1,177.00 288.41 271.94 304.89
CALIFORNIA 35,233,335 102,560.67 291.09 289.31 292.8748 SAN DIEGO 3,005,038 9,314.00 309.95 303.65 316.24
49 SAN BERNARDINO 1,771,707 5,578.00 314.84 306.58 323.10
50 ALAMEDA 1,492,004 4,987.00 334.25 324.97 343.53
51 LOS ANGELES 9,925,413 35,486.33 357.53 353.81 361.25
52 SAN JOAQUIN 593,538 2,130.33 358.92 343.68 374.16
53 KINGS 129,375 480.00 371.01 337.82 404.21
54 SACRAMENTO 1,236,054 4,597.67 371.96 361.21 382.72
55 TULARE 388,730 1,467.33 377.47 358.15 396.78
56 KERN 694,749 2,730.00 392.95 378.21 407.69
57 SAN FRANCISCO 794,342 3,158.67 397.65 383.78 411.51
58 FRESNO 825,365 4,241.00 513.83 498.37 529.30
Comment: Prevalence data are not available in California.

8/6/2019 California County Health Status Profiles 2004
http://slidepdf.com/reader/full/california-county-health-status-profiles-2004 44/85
TABLE 18: REPORTED INCIDENCE OF PRIMARY ANDSECONDARY SYPHILIS, 2000-2002
RANKED BY THREE-YEAR AVERAGE CRUDE CASE RATECALIFORNIA COUNTIES, 2000-2002
24 TULARE 388,730 0.33 0.09 * 0.00 0.38
25 SAN LUIS OBISPO 262,123 0.33 0.13 * 0.00 0.56
26 BUTTE 213,040 0.33 0.16 * 0.00 0.69
27 VENTURA 763,586 1.33 0.17 * 0.00 0.47
28 EL DORADO 168,912 0.33 0.20 * 0.00 0.87
29 YOLO 167,259 0.33 0.20 * 0.00 0.88
0.20
30 MADERA 131,052 0.33 0.25 * 0.00 1.12
31 NAPA 129,130 0.33 0.26 * 0.00 1.13
32 NEVADA 99,670 0.33 0.33 * 0.00 1.47
33 SANTA BARBARA 417,331 1.67 0.40 * 0.00 1.01
34 SACRAMENTO 1,236,054 5.33 0.43 * 0.07 0.80
35 SAN BERNARDINO 1,771,707 7.67 0.43 * 0.13 0.74
36 FRESNO 825,365 3.67 0.44 * 0.00 0.90
37 SANTA CRUZ 264,525 1.33 0.50 * 0.00 1.36
38 YUBA 64,938 0.33 0.51 * 0.00 2.2639 PLACER 252,688 1.33 0.53 * 0.00 1.42
40 STANISLAUS 472,096 2.67 0.56 * 0.00 1.24
41 SOLANO 408,095 2.33 0.57 * 0.00 1.31
42 SAN JOAQUIN 593,538 3.67 0.62 * 0.00 1.25
43 MONTEREY 409,511 3.00 0.73 * 0.00 1.56
44 SANTA CLARA 1,795,132 14.00 0.78 * 0.37 1.19
45 CONTRA COSTA 942,662 8.00 0.85 * 0.26 1.44
46 SAN DIEGO 3,005,038 30.67 1.02 0.66 1.38
47 KINGS 129,375 1.33 1.03 * 0.00 2.78
48 ORANGE 2,872,632 32.00 1.11 0.73 1.50
49 SAN MATEO 759,313 8.67 1.14 * 0.38 1.90
50 KERN 694,749 8.00 1.15 * 0.35 1.95
51 SONOMA 468,682 6.33 1.35 * 0.30 2.40
52 MARIN 249,634 3.67 1.47 * 0.00 2.97
53 RIVERSIDE 1,626,134 26.67 1.64 1.02 2.26
CALIFORNIA 35,233,335 639.33 1.81 1.67 1.96
54 MARIPOSA 17,218 0.33 1.94 * 0.00 8.51
55 ALAMEDA 1,492,004 31.00 2.08 1.35 2.81
56 MERCED 219,936 5.00 2.27 * 0.28 4.27
57 LOS ANGELES 9,925,413 257.33 2.59 2.28 2.91
58 SAN FRANCISCO 794,342 169.33 21.32 18.11 24.53
HEALTHY PEOPLE 2010 NATIONAL O BJECTIVE:
CASE RATE LOWER UPPER(AVERAGE)
2000-2002
CASES CRUDE 95% CONFIDENCE LIMITSRANK
ORDER
2001
POPULATIONCOUNTY
The crude case rate of reported primary and secondary syphilis cases for California was1.81 cases per 100,000 population or approximately one reported syphilis case for every55,110 persons. Table 18 shows only those counties where at least one case wasreported. This rate was based on a 2000 to 2002 three-year average reported number of cases of 639.33 and a population of 35,233,335 as of July 1, 2001.
Among counties with "reliable" rates, the crude case rate ranged from 21.32 inSan Francisco County to 1.02 in San Diego County, a difference in rates by a factor of 20.9 to 1.
Altogether 29 counties (none with reliable case rates), but not California as a whole, metthe Healthy People 2010 National Objective of .20 cases per 100,000 population.Twenty-three counties (not shown on Table 18) had no reported cases during thethree-year period.
(See Table 16 for Notes and Data Sources footnote.)
California Department of Health Services County Health Status Profiles 200437

8/6/2019 California County Health Status Profiles 2004
http://slidepdf.com/reader/full/california-county-health-status-profiles-2004 45/85
TABLE 19: REPORTED INCIDENCE OF MEASLES, 2000-2002
RANKED BY THREE-YEAR AVERAGE CRUDE CASE RATECALIFORNIA COUNTIES, 2000-2002
0.00
45 SAN BERNARDINO 1,771,707 0.33 0.02 * 0.00 0.08
46 RIVERSIDE 1,626,134 0.33 0.02 * 0.00 0.09
47 SACRAMENTO 1,236,054 0.33 0.03 * 0.00 0.12
48 VENTURA 763,586 0.33 0.04 * 0.00 0.19
49 ALAMEDA 1,492,004 0.67 0.04 * 0.00 0.15
50 LOS ANGELES 9,925,413 5.33 0.05 * 0.01 0.10
CALIFORNIA 35,233,335 21.33 0.06 0.03 0.09
51 CONTRA COSTA 942,662 0.67 0.07 * 0.00 0.24
52 SAN DIEGO 3,005,038 2.33 0.08 * 0.00 0.18
53 MONTEREY 409,511 0.33 0.08 * 0.00 0.36
54 ORANGE 2,872,632 3.00 0.10 * 0.00 0.22
55 SAN MATEO 759,313 1.33 0.18 * 0.00 0.47
56 MARIN 249,634 0.67 0.27 * 0.00 0.91
57 SANTA CRUZ 264,525 1.33 0.50 * 0.00 1.36
58 SAN FRANCISCO 794,342 4.33 0.55 * 0.03 1.06
HEALTHY PEOPLE 2010 NATIONAL OBJECTIVE:
RANK
ORDER
2001
2000-2002
CASES
POPULATIONCOUNTY
CRUDE 95% CONFIDENCE LIMITS
(AVERAGE) CASE RATE LOWER UPPER
The crude case rate of reported measles cases for California was 0.06 cases per 100,000population or approximately one reported measles case for every 1,651,821 persons. Table19 shows only those counties where at least one case was reported. This rate was basedon a 2000 to 2002 three-year average reported number of cases of 21.33 and a populationof 35,233,335 as of July 1, 2001. Of the 58 counties, none had a "reliable" rate.
The Healthy People 2010 National Objective for incidence of reported measles cases iszero cases, which is equivalent to a case rate of 0.00 per 100,000 population.
Altogether 44 counties (not shown on Table 19) met the Healthy People 2010 NationalObjective of no reported cases of measles during the three-year period. Many of theremaining counties were so close to zero, that for all practical purposes, these countieshave met the Healthy People 2010 National Objective as well.
(See Table 16 for Notes and Data Sources footnote.)
California Department of Health Services County Health Status Profiles 200438

8/6/2019 California County Health Status Profiles 2004
http://slidepdf.com/reader/full/california-county-health-status-profiles-2004 46/85
California Department of Health Services County Health Status Profiles 200439
TABLE 20A: INFANT MORTALITY, ALL RACE/ETHNIC GROUPS,1999-2001
California Counties Ranked by Three-Year Average Birth Cohort Infant Death Rate
The birth cohort infant death rate for California was 5.5 deaths per 1,000 livebirths, a risk of dying equivalent to approximately one infant death for every183 births. This rate was based on the 2,875.7 infant deaths among525,635.7 live births, the three-year average for the years 1999-2001.
Among counties with "reliable" rates, the birth cohort infant death rate rangedfrom 7.7 in Stanislaus County to 4.1 in San Francisco County, a difference inrates by a factor of 1.9 to 1.
Altogether 17 counties (4 with reliable rates), but not California as a whole,met the Healthy People 2010 National Objective of no more than 4.5 infantdeaths per 1,000 birth cohort live births.
Notes:
Infant deaths are deaths that occurred during the first year of life. Birth cohort infant death rates are per 1,000live births. The birth cohort infant death rate is based upon births during a calendar year (a cohort) trackedindividually for 365 days to determine whether or not death occurred. Thus, the deaths in the numerator of abirth cohort infant death rate are the records of the same infants as the births in the denominator. Birth cohortinfant death rates, like population crude death rates, show the true risk of dying, and also, likeage-adjusted population death rates, allow direct comparisons between counties.
* Death rate unreliable, relative standard error is greater than or equal to 23 percent.+ Standard error indeterminate because the death rate is based on no (zero) deaths.- Upper and lower limits at the 95 percent confidence level are not calculated for zero deaths.
Counties were rank ordered first by increasing birth cohort death rate (calculated to 15 decimal places),second by decreasing size of the total number of live births. Infant mortality data by race/ethnicity is based onthe mother’s race/ethnicity reported on the birth record, and is grouped according to the methodology used bythe Demographic Research Unit of the Department of Finance to compile population estimates. For purposesof this report, rates with a relative standard error greater than or equal to 23 percent are considered“unreliable.” The upper and lower limits of the birth cohort death rate at the 95 percent confidence levelindicate the precision of the estimated death rate. Precision of the death rate decreases as the intervalwidens. The upper and lower limits define the range within which the death rate would probably occur in 95
out of 100 independent sets of data similar to the present set. (For additional information see the TechnicalNotes, pages 64 through 75.)
DATA SOURCES
Department of Health Services: Birth Cohort-Perinatal Outcome Files, 1999-2001.
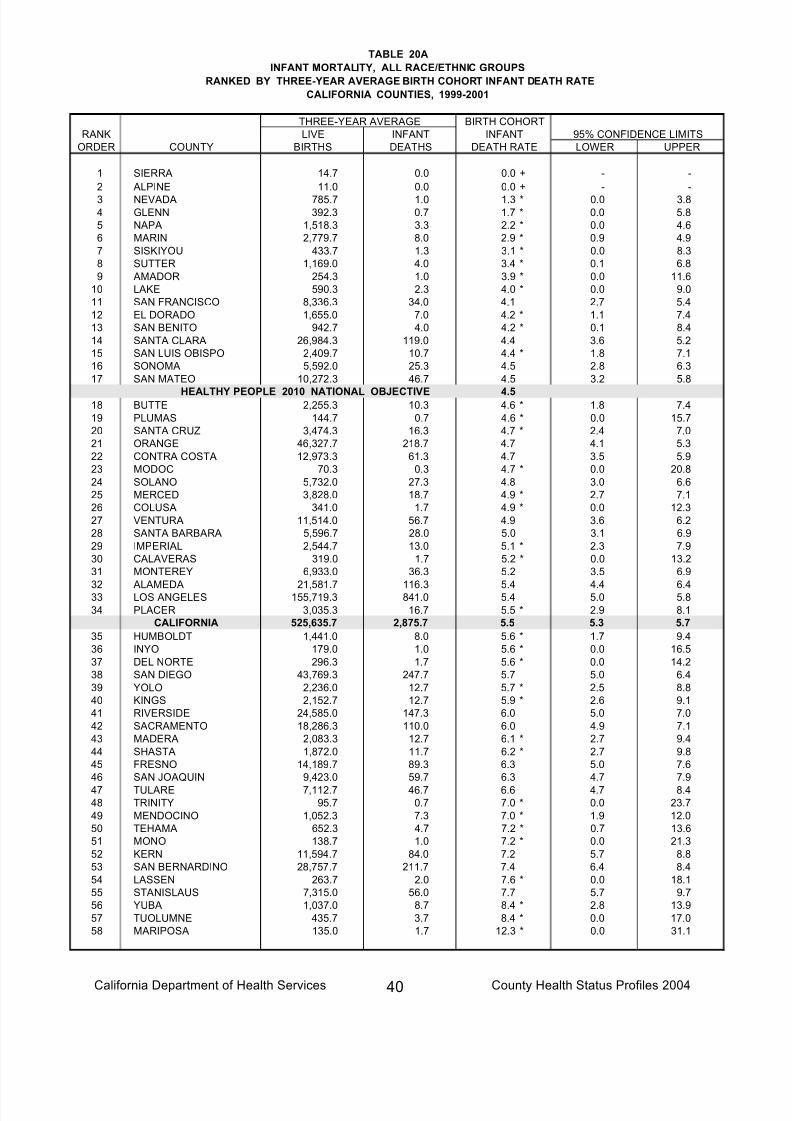
8/6/2019 California County Health Status Profiles 2004
http://slidepdf.com/reader/full/california-county-health-status-profiles-2004 47/85
California Department of Health Services County Health Status Profiles 200440
TABLE 20A
INFANT MORTALITY, ALL RACE/ETHNIC GROUPS
RANKED BY THREE-YEAR AVERAGE BIRTH COHORT INFANT DEATH RATE
CALIFORNIA COUNTIES, 1999-2001
THREE-YEAR AVERAGE BIRTH COHORT
RANK LIVE INFANT INFANT 95% CONFIDENCE LIMITS
ORDER COUNTY BIRTHS DEATHS DEATH RATE LOWER UPPER
1 SIERRA 14.7 0.0 0.0 + - -
2 ALPINE 11.0 0.0 0.0 + - -
3 NEVADA 785.7 1.0 1.3 * 0.0 3.84 GLENN 392.3 0.7 1.7 * 0.0 5.8
5 NAPA 1,518.3 3.3 2.2 * 0.0 4.6
6 MARIN 2,779.7 8.0 2.9 * 0.9 4.9
7 SISKIYOU 433.7 1.3 3.1 * 0.0 8.3
8 SUTTER 1,169.0 4.0 3.4 * 0.1 6.8
9 AMADOR 254.3 1.0 3.9 * 0.0 11.6
10 LAKE 590.3 2.3 4.0 * 0.0 9.0
11 SAN FRANCISCO 8,336.3 34.0 4.1 2.7 5.4
12 EL DORADO 1,655.0 7.0 4.2 * 1.1 7.4
13 SAN BENITO 942.7 4.0 4.2 * 0.1 8.4
14 SANTA CLARA 26,984.3 119.0 4.4 3.6 5.2
15 SAN LUIS OBISPO 2,409.7 10.7 4.4 * 1.8 7.1
16 SONOMA 5,592.0 25.3 4.5 2.8 6.3
17 SAN MATEO 10,272.3 46.7 4.5 3.2 5.8
HEALTHY PEOPLE 2010 NATIONAL OBJECTIVE 4.518 BUTTE 2,255.3 10.3 4.6 * 1.8 7.4
19 PLUMAS 144.7 0.7 4.6 * 0.0 15.7
20 SANTA CRUZ 3,474.3 16.3 4.7 * 2.4 7.0
21 ORANGE 46,327.7 218.7 4.7 4.1 5.3
22 CONTRA COSTA 12,973.3 61.3 4.7 3.5 5.9
23 MODOC 70.3 0.3 4.7 * 0.0 20.8
24 SOLANO 5,732.0 27.3 4.8 3.0 6.6
25 MERCED 3,828.0 18.7 4.9 * 2.7 7.1
26 COLUSA 341.0 1.7 4.9 * 0.0 12.3
27 VENTURA 11,514.0 56.7 4.9 3.6 6.2
28 SANTA BARBARA 5,596.7 28.0 5.0 3.1 6.9
29 IMPERIAL 2,544.7 13.0 5.1 * 2.3 7.9
30 CALAVERAS 319.0 1.7 5.2 * 0.0 13.2
31 MONTEREY 6,933.0 36.3 5.2 3.5 6.9
32 ALAMEDA 21,581.7 116.3 5.4 4.4 6.433 LOS ANGELES 155,719.3 841.0 5.4 5.0 5.8
34 PLACER 3,035.3 16.7 5.5 * 2.9 8.1
CALIFORNIA 525,635.7 2,875.7 5.5 5.3 5.7
35 HUMBOLDT 1,441.0 8.0 5.6 * 1.7 9.4
36 INYO 179.0 1.0 5.6 * 0.0 16.5
37 DEL NORTE 296.3 1.7 5.6 * 0.0 14.2
38 SAN DIEGO 43,769.3 247.7 5.7 5.0 6.4
39 YOLO 2,236.0 12.7 5.7 * 2.5 8.8
40 KINGS 2,152.7 12.7 5.9 * 2.6 9.1
41 RIVERSIDE 24,585.0 147.3 6.0 5.0 7.0
42 SACRAMENTO 18,286.3 110.0 6.0 4.9 7.1
43 MADERA 2,083.3 12.7 6.1 * 2.7 9.4
44 SHASTA 1,872.0 11.7 6.2 * 2.7 9.8
45 FRESNO 14,189.7 89.3 6.3 5.0 7.6
46 SAN JOAQUIN 9,423.0 59.7 6.3 4.7 7.9
47 TULARE 7,112.7 46.7 6.6 4.7 8.4
48 TRINITY 95.7 0.7 7.0 * 0.0 23.7
49 MENDOCINO 1,052.3 7.3 7.0 * 1.9 12.0
50 TEHAMA 652.3 4.7 7.2 * 0.7 13.6
51 MONO 138.7 1.0 7.2 * 0.0 21.3
52 KERN 11,594.7 84.0 7.2 5.7 8.8
53 SAN BERNARDINO 28,757.7 211.7 7.4 6.4 8.4
54 LASSEN 263.7 2.0 7.6 * 0.0 18.1
55 STANISLAUS 7,315.0 56.0 7.7 5.7 9.7
56 YUBA 1,037.0 8.7 8.4 * 2.8 13.9
57 TUOLUMNE 435.7 3.7 8.4 * 0.0 17.0
58 MARIPOSA 135.0 1.7 12.3 * 0.0 31.1

8/6/2019 California County Health Status Profiles 2004
http://slidepdf.com/reader/full/california-county-health-status-profiles-2004 48/85
California Department of Health Services County Health Status Profiles 200441
TABLE 20B: ASIAN/OTHER INFANT MORTALITY, 1999-2001
California Counties Ranked by Three-Year Average Birth Cohort Infant Death Rate
The Asian/Other birth cohort infant death rate for California was 4.7 deaths
per 1,000 live births, a risk of dying equivalent to approximately one infantdeath for every 214 births. This rate was based on the 293.7 infant deathsamong 62,770.0 live births, the three-year average for the years 1999-2001.
Among counties with "reliable" rates, the birth cohort infant death rate rangedfrom 5.4 in San Diego County to 3.3 in Santa Clara County, a difference inrates by a factor of 1.6 to 1.
A Healthy People 2010 National Objective for an Asian/Other birth cohortinfant death rate has not been established.
Notes:
Infant deaths are deaths that occurred during the first year of life. Birth cohort infant death rates are per 1,000live births. The birth cohort infant death rate is based upon births during a calendar year (a cohort) trackedindividually for 365 days to determine whether or not death occurred. Thus, the deaths in the numerator of abirth cohort infant death rate are the records of the same infants as the births in the denominator. Birth cohortinfant death rates, like population crude death rates, show the true risk of dying, and also, likeage-adjusted population death rates, allow direct comparisons between counties.
* Death rate unreliable, relative standard error is greater than or equal to 23 percent.
+ Standard error indeterminate because the death rate is based on no (zero) deaths.- Upper and lower limits at the 95 percent confidence level are not calculated for zero deaths.
Counties were rank ordered first by increasing birth cohort death rate (calculated to 15 decimal places),second by decreasing size of the total number of live births. Infant mortality data by race/ethnicity is based onthe mother’s race/ethnicity reported on the birth record, and is grouped according to the methodology used bythe Demographic Research Unit of the Department of Finance to compile population estimates. For purposesof this report, rates with a relative standard error greater than or equal to 23 percent are considered“unreliable.” The upper and lower limits of the birth cohort death rate at the 95 percent confidence levelindicate the precision of the estimated death rate. Precision of the death rate decreases as the intervalwidens. The upper and lower limits define the range within which the death rate would probably occur in 95out of 100 independent sets of data similar to the present set. (For additional information see the TechnicalNotes, pages 64 through 75.)
DATA SOURCES
Department of Health Services: Birth Cohort-Perinatal Outcome Files, 1999-2001.
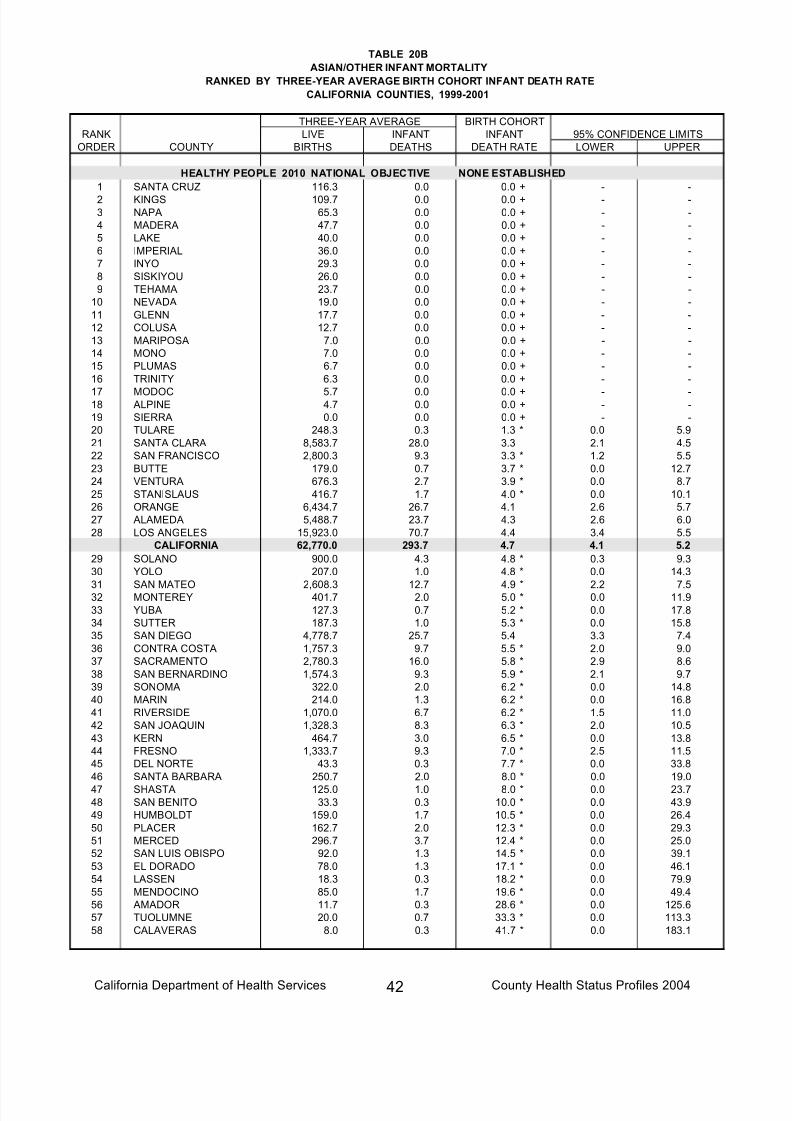
8/6/2019 California County Health Status Profiles 2004
http://slidepdf.com/reader/full/california-county-health-status-profiles-2004 49/85
California Department of Health Services County Health Status Profiles 200442
TABLE 20B
ASIAN/OTHER INFANT MORTALITY
RANKED BY THREE-YEAR AVERAGE BIRTH COHORT INFANT DEATH RATE
CALIFORNIA COUNTIES, 1999-2001
THREE-YEAR AVERAGE BIRTH COHORT
RANK LIVE INFANT INFANT 95% CONFIDENCE LIMITS
ORDER COUNTY BIRTHS DEATHS DEATH RATE LOWER UPPER
HEALTHY PEOPLE 2010 NATIONAL OBJECTIVE NONE ESTABLISHED
1 SANTA CRUZ 116.3 0.0 0.0 + - -
2 KINGS 109.7 0.0 0.0 + - -3 NAPA 65.3 0.0 0.0 + - -
4 MADERA 47.7 0.0 0.0 + - -
5 LAKE 40.0 0.0 0.0 + - -
6 IMPERIAL 36.0 0.0 0.0 + - -
7 INYO 29.3 0.0 0.0 + - -
8 SISKIYOU 26.0 0.0 0.0 + - -
9 TEHAMA 23.7 0.0 0.0 + - -
10 NEVADA 19.0 0.0 0.0 + - -
11 GLENN 17.7 0.0 0.0 + - -
12 COLUSA 12.7 0.0 0.0 + - -
13 MARIPOSA 7.0 0.0 0.0 + - -
14 MONO 7.0 0.0 0.0 + - -
15 PLUMAS 6.7 0.0 0.0 + - -
16 TRINITY 6.3 0.0 0.0 + - -
17 MODOC 5.7 0.0 0.0 + - -18 ALPINE 4.7 0.0 0.0 + - -
19 SIERRA 0.0 0.0 0.0 + - -
20 TULARE 248.3 0.3 1.3 * 0.0 5.9
21 SANTA CLARA 8,583.7 28.0 3.3 2.1 4.5
22 SAN FRANCISCO 2,800.3 9.3 3.3 * 1.2 5.5
23 BUTTE 179.0 0.7 3.7 * 0.0 12.7
24 VENTURA 676.3 2.7 3.9 * 0.0 8.7
25 STANISLAUS 416.7 1.7 4.0 * 0.0 10.1
26 ORANGE 6,434.7 26.7 4.1 2.6 5.7
27 ALAMEDA 5,488.7 23.7 4.3 2.6 6.0
28 LOS ANGELES 15,923.0 70.7 4.4 3.4 5.5
CALIFORNIA 62,770.0 293.7 4.7 4.1 5.2
29 SOLANO 900.0 4.3 4.8 * 0.3 9.3
30 YOLO 207.0 1.0 4.8 * 0.0 14.3
31 SAN MATEO 2,608.3 12.7 4.9 * 2.2 7.532 MONTEREY 401.7 2.0 5.0 * 0.0 11.9
33 YUBA 127.3 0.7 5.2 * 0.0 17.8
34 SUTTER 187.3 1.0 5.3 * 0.0 15.8
35 SAN DIEGO 4,778.7 25.7 5.4 3.3 7.4
36 CONTRA COSTA 1,757.3 9.7 5.5 * 2.0 9.0
37 SACRAMENTO 2,780.3 16.0 5.8 * 2.9 8.6
38 SAN BERNARDINO 1,574.3 9.3 5.9 * 2.1 9.7
39 SONOMA 322.0 2.0 6.2 * 0.0 14.8
40 MARIN 214.0 1.3 6.2 * 0.0 16.8
41 RIVERSIDE 1,070.0 6.7 6.2 * 1.5 11.0
42 SAN JOAQUIN 1,328.3 8.3 6.3 * 2.0 10.5
43 KERN 464.7 3.0 6.5 * 0.0 13.8
44 FRESNO 1,333.7 9.3 7.0 * 2.5 11.5
45 DEL NORTE 43.3 0.3 7.7 * 0.0 33.8
46 SANTA BARBARA 250.7 2.0 8.0 * 0.0 19.0
47 SHASTA 125.0 1.0 8.0 * 0.0 23.748 SAN BENITO 33.3 0.3 10.0 * 0.0 43.9
49 HUMBOLDT 159.0 1.7 10.5 * 0.0 26.4
50 PLACER 162.7 2.0 12.3 * 0.0 29.3
51 MERCED 296.7 3.7 12.4 * 0.0 25.0
52 SAN LUIS OBISPO 92.0 1.3 14.5 * 0.0 39.1
53 EL DORADO 78.0 1.3 17.1 * 0.0 46.1
54 LASSEN 18.3 0.3 18.2 * 0.0 79.9
55 MENDOCINO 85.0 1.7 19.6 * 0.0 49.4
56 AMADOR 11.7 0.3 28.6 * 0.0 125.6
57 TUOLUMNE 20.0 0.7 33.3 * 0.0 113.3
58 CALAVERAS 8.0 0.3 41.7 * 0.0 183.1

8/6/2019 California County Health Status Profiles 2004
http://slidepdf.com/reader/full/california-county-health-status-profiles-2004 50/85
California Department of Health Services County Health Status Profiles 200443
TABLE 20C: BLACK INFANT MORTALITY, 1999-2001
California Counties Ranked by Three-Year Average Birth Cohort Infant Death Rate
The Black birth cohort infant death rate for California was 11.9 deaths per
1,000 live births, a risk of dying equivalent to approximately one infant deathfor every 84 births. This rate was based on the 399.3 deaths among the33,462.0 live births, the three-year average for the years 1999-2001.
Among counties with "reliable" rates, the birth cohort infant death rate for Blacks ranged from 14.5 in San Bernardino County to 11.3 in
Alameda County, a difference in rates by a factor of 1.3 to 1.
A Healthy People 2010 National Objective for a Black birth cohort infant deathrate has not been established.
Notes:
Infant deaths are deaths that occurred during the first year of life. Birth cohort infant death rates are per 1,000live births. The birth cohort infant death rate is based upon births during a calendar year (a cohort) trackedindividually for 365 days to determine whether or not death occurred. Thus, the deaths in the numerator of abirth cohort infant death rate are the records of the same infants as the births in the denominator. Birth cohortinfant death rates, like population crude death rates, show the true risk of dying, and also, likeage-adjusted population death rates, allow direct comparisons between counties.
* Death rate unreliable, relative standard error is greater than or equal to 23 percent.
+ Standard error indeterminate because the death rate is based on no (zero) deaths.- Upper and lower limits at the 95 percent confidence level are not calculated for zero deaths.
Counties were rank ordered first by increasing birth cohort death rate (calculated to 15 decimal places),second by decreasing size of the total number of live births. Infant mortality data by race/ethnicity is based onthe mother’s race/ethnicity reported on the birth record, and is grouped according to the methodology used bythe Demographic Research Unit of the Department of Finance to compile population estimates. For purposesof this report, rates with a relative standard error greater than or equal to 23 percent are considered“unreliable.” The upper and lower limits of the birth cohort death rate at the 95 percent confidence levelindicate the precision of the estimated death rate. Precision of the death rate decreases as the intervalwidens. The upper and lower limits define the range within which the death rate would probably occur in 95out of 100 independent sets of data similar to the present set. (For additional information see the TechnicalNotes, pages 64 through 75.)
DATA SOURCES
Department of Health Services: Birth Cohort-Perinatal Outcome Files, 1999-2001.

8/6/2019 California County Health Status Profiles 2004
http://slidepdf.com/reader/full/california-county-health-status-profiles-2004 51/85
California Department of Health Services County Health Status Profiles 200444
TABLE 20C
BLACK INFANT MORTALITY
RANKED BY THREE-YEAR AVERAGE BIRTH COHORT INFANT DEATH RATE
CALIFORNIA COUNTIES, 1999-2001
THREE-YEAR AVERAGE BIRTH COHORT
RANK LIVE INFANT INFANT 95% CONFIDENCE LIMITS
ORDER COUNTY BIRTHS DEATHS DEATH RATE LOWER UPPER
HEALTHY PEOPLE 2010 NATIONAL OBJECTIVE NONE ESTABLISHED
1 SANTA BARBARA 84.7 0.0 0.0 + - -
2 MADERA 47.0 0.0 0.0 + - -
3 SHASTA 23.0 0.0 0.0 + - -
4 SAN LUIS OBISPO 22.0 0.0 0.0 + - -
5 SUTTER 21.0 0.0 0.0 + - -
6 LAKE 12.3 0.0 0.0 + - -
7 EL DORADO 9.7 0.0 0.0 + - -
8 SAN BENITO 5.7 0.0 0.0 + - -
9 LASSEN 4.3 0.0 0.0 + - -
10 SISKIYOU 4.3 0.0 0.0 + - -
11 MENDOCINO 3.7 0.0 0.0 + - -
12 TEHAMA 3.7 0.0 0.0 + - -
13 AMADOR 2.0 0.0 0.0 + - -
14 CALAVERAS 2.0 0.0 0.0 + - -
15 DEL NORTE 1.7 0.0 0.0 + - -
16 GLENN 1.0 0.0 0.0 + - -
17 MARIPOSA 1.0 0.0 0.0 + - -18 NEVADA 1.0 0.0 0.0 + - -
19 INYO 0.7 0.0 0.0 + - -
20 TRINITY 0.7 0.0 0.0 + - -
21 TUOLUMNE 0.7 0.0 0.0 + - -
22 COLUSA 0.3 0.0 0.0 + - -
23 MONO 0.3 0.0 0.0 + - -
24 PLUMAS 0.3 0.0 0.0 + - -
25 ALPINE 0.0 0.0 0.0 + - -
26 MODOC 0.0 0.0 0.0 + - -
27 SIERRA 0.0 0.0 0.0 + - -
28 SANTA CLARA 602.3 2.3 3.9 * 0.0 8.8
29 VENTURA 177.3 1.0 5.6 * 0.0 16.7
30 SAN MATEO 266.3 1.7 6.3 * 0.0 15.8
31 MARIN 51.7 0.3 6.5 * 0.0 28.4
32 SOLANO 869.3 6.7 7.7 * 1.8 13.533 BUTTE 40.7 0.3 8.2 * 0.0 36.0
34 CONTRA COSTA 1,346.0 13.3 9.9 * 4.6 15.2
35 ALAMEDA 3,270.7 37.0 11.3 7.7 15.0
36 MERCED 117.0 1.3 11.4 * 0.0 30.7
37 LOS ANGELES 13,293.7 151.7 11.4 9.6 13.2
38 SAN JOAQUIN 728.3 8.3 11.4 * 3.7 19.2
39 TULARE 87.3 1.0 11.5 * 0.0 33.9
40 SAN FRANCISCO 745.0 8.7 11.6 * 3.9 19.4
CALIFORNIA 33,462.0 399.3 11.9 10.8 13.1
41 SACRAMENTO 2,127.3 26.3 12.4 7.7 17.1
42 SONOMA 80.0 1.0 12.5 * 0.0 37.0
43 RIVERSIDE 1,452.3 19.3 13.3 7.4 19.2
44 PLACER 24.0 0.3 13.9 * 0.0 61.0
45 FRESNO 786.3 11.0 14.0 * 5.7 22.3
46 IMPERIAL 23.7 0.3 14.1 * 0.0 61.9
47 SAN DIEGO 2,615.3 37.0 14.1 9.6 18.7
48 MONTEREY 139.0 2.0 14.4 * 0.0 34.3
49 SAN BERNARDINO 2,687.0 39.0 14.5 10.0 19.1
50 STANISLAUS 182.3 2.7 14.6 * 0.0 32.2
51 YOLO 44.3 0.7 15.0 * 0.0 51.1
52 ORANGE 597.0 9.0 15.1 * 5.2 24.9
53 KINGS 110.3 1.7 15.1 * 0.0 38.0
54 KERN 667.3 13.3 20.0 * 9.3 30.7
55 YUBA 32.3 0.7 20.6 * 0.0 70.1
56 HUMBOLDT 13.0 0.3 25.6 * 0.0 112.7
57 SANTA CRUZ 21.7 0.7 30.8 * 0.0 104.6
58 NAPA 10.0 0.3 33.3 * 0.0 146.5
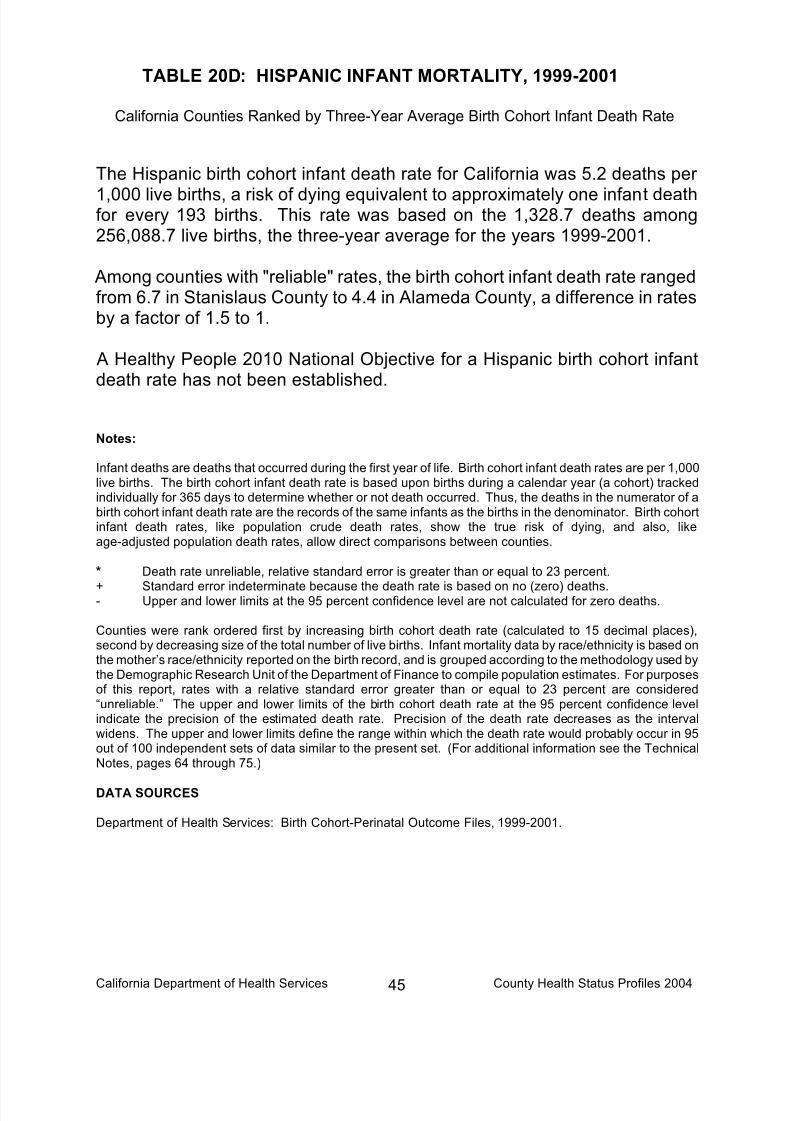
8/6/2019 California County Health Status Profiles 2004
http://slidepdf.com/reader/full/california-county-health-status-profiles-2004 52/85
California Department of Health Services County Health Status Profiles 200445
TABLE 20D: HISPANIC INFANT MORTALITY, 1999-2001
California Counties Ranked by Three-Year Average Birth Cohort Infant Death Rate
The Hispanic birth cohort infant death rate for California was 5.2 deaths per
1,000 live births, a risk of dying equivalent to approximately one infant deathfor every 193 births. This rate was based on the 1,328.7 deaths among256,088.7 live births, the three-year average for the years 1999-2001.
Among counties with "reliable" rates, the birth cohort infant death rate rangedfrom 6.7 in Stanislaus County to 4.4 in Alameda County, a difference in ratesby a factor of 1.5 to 1.
A Healthy People 2010 National Objective for a Hispanic birth cohort infantdeath rate has not been established.
Notes:
Infant deaths are deaths that occurred during the first year of life. Birth cohort infant death rates are per 1,000live births. The birth cohort infant death rate is based upon births during a calendar year (a cohort) trackedindividually for 365 days to determine whether or not death occurred. Thus, the deaths in the numerator of abirth cohort infant death rate are the records of the same infants as the births in the denominator. Birth cohortinfant death rates, like population crude death rates, show the true risk of dying, and also, likeage-adjusted population death rates, allow direct comparisons between counties.
* Death rate unreliable, relative standard error is greater than or equal to 23 percent.
+ Standard error indeterminate because the death rate is based on no (zero) deaths.- Upper and lower limits at the 95 percent confidence level are not calculated for zero deaths.
Counties were rank ordered first by increasing birth cohort death rate (calculated to 15 decimal places),second by decreasing size of the total number of live births. Infant mortality data by race/ethnicity is based onthe mother’s race/ethnicity reported on the birth record, and is grouped according to the methodology used bythe Demographic Research Unit of the Department of Finance to compile population estimates. For purposesof this report, rates with a relative standard error greater than or equal to 23 percent are considered“unreliable.” The upper and lower limits of the birth cohort death rate at the 95 percent confidence levelindicate the precision of the estimated death rate. Precision of the death rate decreases as the intervalwidens. The upper and lower limits define the range within which the death rate would probably occur in 95out of 100 independent sets of data similar to the present set. (For additional information see the TechnicalNotes, pages 64 through 75.)
DATA SOURCES
Department of Health Services: Birth Cohort-Perinatal Outcome Files, 1999-2001.
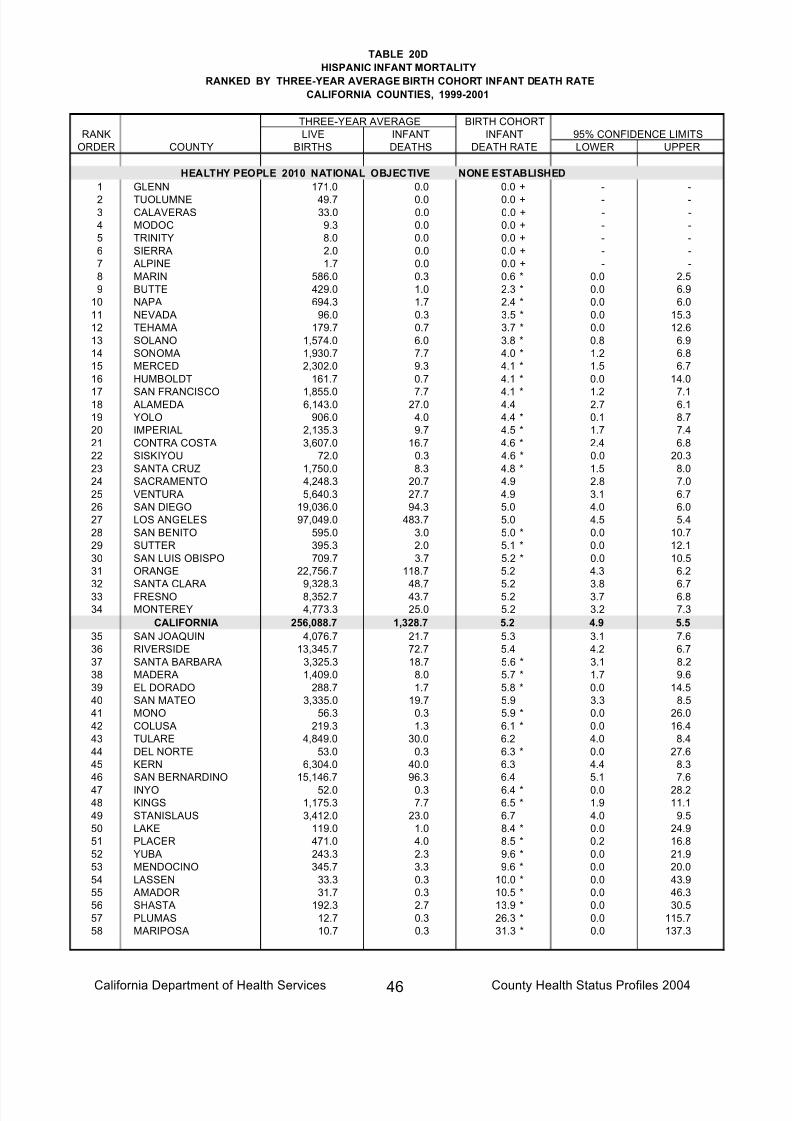
8/6/2019 California County Health Status Profiles 2004
http://slidepdf.com/reader/full/california-county-health-status-profiles-2004 53/85
California Department of Health Services County Health Status Profiles 200446
TABLE 20D
HISPANIC INFANT MORTALITY
RANKED BY THREE-YEAR AVERAGE BIRTH COHORT INFANT DEATH RATE
CALIFORNIA COUNTIES, 1999-2001
THREE-YEAR AVERAGE BIRTH COHORT
RANK LIVE INFANT INFANT 95% CONFIDENCE LIMITS
ORDER COUNTY BIRTHS DEATHS DEATH RATE LOWER UPPER
HEALTHY PEOPLE 2010 NATIONAL OBJECTIVE NONE ESTABLISHED
1 GLENN 171.0 0.0 0.0 + - -
2 TUOLUMNE 49.7 0.0 0.0 + - -3 CALAVERAS 33.0 0.0 0.0 + - -
4 MODOC 9.3 0.0 0.0 + - -
5 TRINITY 8.0 0.0 0.0 + - -
6 SIERRA 2.0 0.0 0.0 + - -
7 ALPINE 1.7 0.0 0.0 + - -
8 MARIN 586.0 0.3 0.6 * 0.0 2.5
9 BUTTE 429.0 1.0 2.3 * 0.0 6.9
10 NAPA 694.3 1.7 2.4 * 0.0 6.0
11 NEVADA 96.0 0.3 3.5 * 0.0 15.3
12 TEHAMA 179.7 0.7 3.7 * 0.0 12.6
13 SOLANO 1,574.0 6.0 3.8 * 0.8 6.9
14 SONOMA 1,930.7 7.7 4.0 * 1.2 6.8
15 MERCED 2,302.0 9.3 4.1 * 1.5 6.7
16 HUMBOLDT 161.7 0.7 4.1 * 0.0 14.0
17 SAN FRANCISCO 1,855.0 7.7 4.1 * 1.2 7.118 ALAMEDA 6,143.0 27.0 4.4 2.7 6.1
19 YOLO 906.0 4.0 4.4 * 0.1 8.7
20 IMPERIAL 2,135.3 9.7 4.5 * 1.7 7.4
21 CONTRA COSTA 3,607.0 16.7 4.6 * 2.4 6.8
22 SISKIYOU 72.0 0.3 4.6 * 0.0 20.3
23 SANTA CRUZ 1,750.0 8.3 4.8 * 1.5 8.0
24 SACRAMENTO 4,248.3 20.7 4.9 2.8 7.0
25 VENTURA 5,640.3 27.7 4.9 3.1 6.7
26 SAN DIEGO 19,036.0 94.3 5.0 4.0 6.0
27 LOS ANGELES 97,049.0 483.7 5.0 4.5 5.4
28 SAN BENITO 595.0 3.0 5.0 * 0.0 10.7
29 SUTTER 395.3 2.0 5.1 * 0.0 12.1
30 SAN LUIS OBISPO 709.7 3.7 5.2 * 0.0 10.5
31 ORANGE 22,756.7 118.7 5.2 4.3 6.2
32 SANTA CLARA 9,328.3 48.7 5.2 3.8 6.733 FRESNO 8,352.7 43.7 5.2 3.7 6.8
34 MONTEREY 4,773.3 25.0 5.2 3.2 7.3
CALIFORNIA 256,088.7 1,328.7 5.2 4.9 5.5
35 SAN JOAQUIN 4,076.7 21.7 5.3 3.1 7.6
36 RIVERSIDE 13,345.7 72.7 5.4 4.2 6.7
37 SANTA BARBARA 3,325.3 18.7 5.6 * 3.1 8.2
38 MADERA 1,409.0 8.0 5.7 * 1.7 9.6
39 EL DORADO 288.7 1.7 5.8 * 0.0 14.5
40 SAN MATEO 3,335.0 19.7 5.9 3.3 8.5
41 MONO 56.3 0.3 5.9 * 0.0 26.0
42 COLUSA 219.3 1.3 6.1 * 0.0 16.4
43 TULARE 4,849.0 30.0 6.2 4.0 8.4
44 DEL NORTE 53.0 0.3 6.3 * 0.0 27.6
45 KERN 6,304.0 40.0 6.3 4.4 8.3
46 SAN BERNARDINO 15,146.7 96.3 6.4 5.1 7.6
47 INYO 52.0 0.3 6.4 * 0.0 28.2
48 KINGS 1,175.3 7.7 6.5 * 1.9 11.1
49 STANISLAUS 3,412.0 23.0 6.7 4.0 9.5
50 LAKE 119.0 1.0 8.4 * 0.0 24.9
51 PLACER 471.0 4.0 8.5 * 0.2 16.8
52 YUBA 243.3 2.3 9.6 * 0.0 21.9
53 MENDOCINO 345.7 3.3 9.6 * 0.0 20.0
54 LASSEN 33.3 0.3 10.0 * 0.0 43.9
55 AMADOR 31.7 0.3 10.5 * 0.0 46.3
56 SHASTA 192.3 2.7 13.9 * 0.0 30.5
57 PLUMAS 12.7 0.3 26.3 * 0.0 115.7
58 MARIPOSA 10.7 0.3 31.3 * 0.0 137.3

8/6/2019 California County Health Status Profiles 2004
http://slidepdf.com/reader/full/california-county-health-status-profiles-2004 54/85
California Department of Health Services County Health Status Profiles 200447
TABLE 20E: WHITE INFANT MORTALITY, 1999-2001
California Counties Ranked by Three-Year Average Birth Cohort Infant Death Rate
The White birth cohort infant death rate for California was 4.9 deaths per
1,000 live births, a risk of dying equivalent to approximately one infant deathfor every 203 births. This rate was based on the 854.0 deaths among173,315.0 live births, the three-year average for the years 1999-2001.
Among counties with "reliable" rates, the birth cohort infant death rate rangedfrom 8.7 in Stanislaus County to 3.5 in Contra Costa County, a difference inrates by a factor of 2.5 to 1.
A Healthy People 2010 National Objective for a White birth cohort infant deathrate has not been established.
Notes:
Infant deaths are deaths that occurred during the first year of life. Birth cohort infant death rates are per 1,000live births. The birth cohort infant death rate is based upon births during a calendar year (a cohort) trackedindividually for 365 days to determine whether or not death occurred. Thus, the deaths in the numerator of abirth cohort infant death rate are the records of the same infants as the births in the denominator. Birth cohortinfant death rates, like population crude death rates, show the true risk of dying, and also, likeage-adjusted population death rates, allow direct comparisons between counties.
* Death rate unreliable, relative standard error is greater than or equal to 23 percent.
+ Standard error indeterminate because the death rate is based on no (zero) deaths.- Upper and lower limits at the 95 percent confidence level are not calculated for zero deaths.
Counties were rank ordered first by increasing birth cohort death rate (calculated to 15 decimal places),second by decreasing size of the total number of live births. Infant mortality data by race/ethnicity is based onthe mother’s race/ethnicity reported on the birth record, and is grouped according to the methodology used bythe Demographic Research Unit of the Department of Finance to compile population estimates. For purposesof this report, rates with a relative standard error greater than or equal to 23 percent are considered“unreliable.” The upper and lower limits of the birth cohort death rate at the 95 percent confidence levelindicate the precision of the estimated death rate. Precision of the death rate decreases as the intervalwidens. The upper and lower limits define the range within which the death rate would probably occur in 95out of 100 independent sets of data similar to the present set. (For additional information see the TechnicalNotes, pages 64 through 75.)
DATA SOURCES
Department of Health Services: Birth Cohort-Perinatal Outcome Files, 1999-2001.

8/6/2019 California County Health Status Profiles 2004
http://slidepdf.com/reader/full/california-county-health-status-profiles-2004 55/85
California Department of Health Services County Health Status Profiles 200448
TABLE 20E
WHITE INFANT MORTALITY
RANKED BY THREE-YEAR AVERAGE BIRTH COHORT INFANT DEATH RATE
CALIFORNIA COUNTIES, 1999-2001
THREE-YEAR AVERAGE BIRTH COHORT
RANK LIVE INFANT INFANT 95% CONFIDENCE LIMITS
ORDER COUNTY BIRTHS DEATHS DEATH RATE LOWER UPPER
HEALTHY PEOPLE 2010 NATIONAL OBJECTIVE NONE ESTABLISHED
1 SIERRA 12.7 0.0 0.0 + - -
2 ALPINE 4.7 0.0 0.0 + - -3 NEVADA 669.7 0.7 1.0 * 0.0 3.4
4 AMADOR 209.0 0.3 1.6 * 0.0 7.0
5 SUTTER 565.3 1.0 1.8 * 0.0 5.2
6 NAPA 748.7 1.3 1.8 * 0.0 4.8
7 SAN BENITO 308.7 0.7 2.2 * 0.0 7.3
8 PLUMAS 125.0 0.3 2.7 * 0.0 11.7
9 SAN FRANCISCO 2,936.0 8.3 2.8 * 0.9 4.8
10 SISKIYOU 331.3 1.0 3.0 * 0.0 8.9
11 COLUSA 108.7 0.3 3.1 * 0.0 13.5
12 MARIN 1,928.0 6.0 3.1 * 0.6 5.6
13 SAN MATEO 4,062.7 12.7 3.1 * 1.4 4.8
14 EL DORADO 1,278.7 4.0 3.1 * 0.1 6.2
15 LAKE 419.0 1.3 3.2 * 0.0 8.6
16 GLENN 202.7 0.7 3.3 * 0.0 11.2
17 CONTRA COSTA 6,263.0 21.7 3.5 2.0 4.918 SAN LUIS OBISPO 1,586.0 5.7 3.6 * 0.6 6.5
19 MENDOCINO 618.0 2.3 3.8 * 0.0 8.6
20 SANTA BARBARA 1,936.0 7.3 3.8 * 1.0 6.5
21 ORANGE 16,539.3 64.3 3.9 2.9 4.8
22 MERCED 1,112.3 4.3 3.9 * 0.2 7.6
23 ALAMEDA 6,679.3 28.7 4.3 2.7 5.9
24 SOLANO 2,388.7 10.3 4.3 * 1.7 7.0
25 PLACER 2,377.7 10.3 4.3 * 1.7 7.0
26 KINGS 757.3 3.3 4.4 * 0.0 9.1
27 SONOMA 3,259.3 14.7 4.5 * 2.2 6.8
28 MONTEREY 1,619.0 7.3 4.5 * 1.3 7.8
29 LOS ANGELES 29,453.7 135.0 4.6 3.8 5.4
30 SANTA CRUZ 1,586.3 7.3 4.6 * 1.3 8.0
31 SANTA CLARA 8,470.0 40.0 4.7 3.3 6.2
32 HUMBOLDT 1,107.3 5.3 4.8 * 0.7 8.933 CALAVERAS 276.0 1.3 4.8 * 0.0 13.0
CALIFORNIA 173,315.0 854.0 4.9 4.6 5.3
34 DEL NORTE 198.3 1.0 5.0 * 0.0 14.9
35 VENTURA 5,020.0 25.3 5.0 3.1 7.0
36 SACRAMENTO 9,130.3 47.0 5.1 3.7 6.6
37 BUTTE 1,606.7 8.3 5.2 * 1.7 8.7
38 SHASTA 1,531.7 8.0 5.2 * 1.6 8.8
39 SAN DIEGO 17,339.3 90.7 5.2 4.2 6.3
40 RIVERSIDE 8,717.0 48.7 5.6 4.0 7.2
41 MODOC 55.3 0.3 6.0 * 0.0 26.5
42 LASSEN 207.7 1.3 6.4 * 0.0 17.3
43 SAN JOAQUIN 3,289.7 21.3 6.5 3.7 9.2
44 YOLO 1,078.7 7.0 6.5 * 1.7 11.3
45 KERN 4,158.7 27.7 6.7 4.2 9.1
46 FRESNO 3,717.0 25.3 6.8 4.2 9.5
47 INYO 97.0 0.7 6.9 * 0.0 23.448 SAN BERNARDINO 9,349.7 67.0 7.2 5.5 8.9
49 YUBA 634.0 5.0 7.9 * 1.0 14.8
50 TULARE 1,928.0 15.3 8.0 * 4.0 11.9
51 MADERA 579.7 4.7 8.1 * 0.7 15.4
52 TUOLUMNE 365.3 3.0 8.2 * 0.0 17.5
53 TRINITY 80.7 0.7 8.3 * 0.0 28.1
54 IMPERIAL 349.7 3.0 8.6 * 0.0 18.3
55 STANISLAUS 3,304.0 28.7 8.7 5.5 11.9
56 MONO 75.0 0.7 8.9 * 0.0 30.2
57 TEHAMA 445.3 4.0 9.0 * 0.2 17.8
58 MARIPOSA 116.3 1.3 11.5 * 0.0 30.9

8/6/2019 California County Health Status Profiles 2004
http://slidepdf.com/reader/full/california-county-health-status-profiles-2004 56/85
California Department of Health Services County Health Status Profiles 200449
TABLE 21: LOW BIRTHWEIGHT INFANTS, 2000-2002
California Counties Ranked by Percentage of Three-Year Average Low Birthweight Infants
The percentage of low birthweight infants for California was 6.3 per 100 live
births, a percent equivalent to one in 16 live births. This percentage wasbased on a three-year average number of low birthweight infants of 33,302.7and a three-year average total number of live births of 529,293.0 from2000 to 2002.
Among counties with "reliable" percentages, the percent of low birthweightinfants ranged from 8.0 in Siskiyou County to 4.6 in Mendocino County, adifference in percentage by a factor of 1.7 to 1.
Altogether 8 counties (2 with reliable percentages), but not California as awhole, met the Healthy People 2010 National Objective of an incidence of nomore than 5.0 percent low birthweight infants.
Notes:
Low birthweight includes infants less than 2500 grams at birth. The average number of live births excludesthose births of unknown birthweight.
* Percentage unreliable, relative standard error is greater than or equal to 23 percent.+ Standard error indeterminate because the percentage is based on no (zero) low birthweight infants.
- Upper and lower limits at the 95 percent confidence level are not calculated for no (zero) lowbirthweight infants.
Counties were rank ordered first by increasing percentage of low birthweight infants (calculated to 15 decimalplaces), second by decreasing size of the total number of live births. For purposes of this report, percentageswith a relative standard error greater than or equal to 23 percent are considered “unreliable.” The upper andlower limits of the percent of births at the 95 percent confidence level indicate the precision of the estimatedpercentage. Precision of the percentage decreases as the interval widens. The upper and lower limits definethe range within which the percentage would probably occur in 95 out of 100 independent sets of data similar to the present set. (For additional information see the Technical Notes, pages 64 through 75.)
DATA SOURCES
Department of Health Services: Birth Statistical Master Files, 2000-2002.

8/6/2019 California County Health Status Profiles 2004
http://slidepdf.com/reader/full/california-county-health-status-profiles-2004 57/85
California Department of Health Services County Health Status Profiles 200450
TABLE 21
LOW BIRTHWEIGHT INFANTS
RANKED BY THREE-YEAR AVERAGE LOW BIRTHWEIGHT PERCENTAGE
CALIFORNIA COUNTIES, 2000-2002
2000-2002 LIVE BIRTHS (AVERAGE)
RANK LIVE LOW BIRTHWEIGHT 95% CONFIDENCE LIMITS
ORDER COUNTY BIRTHS NUMBER PERCENT LOWER UPPER
1 ALPINE 10.7 0.0 0.0 + - -
2 COLUSA 331.7 12.0 3.6 * 1.6 5.7
3 MENDOCINO 1,074.0 49.3 4.6 3.3 5.94 CALAVERAS 323.0 15.0 4.6 * 2.3 7.0
5 PLUMAS 160.0 7.7 4.8 * 1.4 8.2
6 SIERRA 20.7 1.0 4.8 * 0.0 14.3
7 SAN BENITO 924.7 46.0 5.0 3.5 6.4
8 INYO 173.3 8.7 5.0 * 1.7 8.3
HEALTHY PEOPLE 2010 NATIONAL OBJECTIVE 5.0
9 IMPERIAL 2,610.3 133.3 5.1 4.2 6.0
10 DEL NORTE 293.0 15.0 5.1 * 2.5 7.7
11 TUOLUMNE 436.0 22.3 5.1 3.0 7.2
12 AMADOR 253.0 13.0 5.1 * 2.3 7.9
13 NEVADA 803.3 41.7 5.2 3.6 6.8
14 SONOMA 5,678.7 297.3 5.2 4.6 5.8
15 MODOC 70.0 3.7 5.2 * 0.0 10.6
16 SANTA CRUZ 3,436.3 180.0 5.2 4.5 6.0
17 HUMBOLDT 1,430.3 76.7 5.4 4.2 6.618 TEHAMA 677.7 36.3 5.4 3.6 7.1
19 SAN LUIS OBISPO 2,413.0 131.7 5.5 4.5 6.4
20 BUTTE 2,259.3 124.3 5.5 4.5 6.5
21 NAPA 1,544.3 85.3 5.5 4.4 6.7
22 GLENN 399.7 22.7 5.7 3.3 8.0
23 TULARE 7,329.3 416.3 5.7 5.1 6.2
24 PLACER 3,211.3 183.0 5.7 4.9 6.5
25 YOLO 2,315.7 132.0 5.7 4.7 6.7
26 MONTEREY 7,064.3 403.7 5.7 5.2 6.3
27 SHASTA 1,911.0 109.7 5.7 4.7 6.8
28 ORANGE 45,756.0 2,651.0 5.8 5.6 6.0
29 EL DORADO 1,697.0 99.7 5.9 4.7 7.0
30 LAKE 609.3 36.0 5.9 4.0 7.8
31 KINGS 2,206.3 131.0 5.9 4.9 7.0
32 TRINITY 101.0 6.0 5.9 * 1.2 10.733 VENTURA 11,567.7 687.3 5.9 5.5 6.4
34 LASSEN 269.0 16.0 5.9 * 3.0 8.9
35 MADERA 2,146.7 128.3 6.0 4.9 7.0
36 SANTA BARBARA 5,664.0 339.3 6.0 5.4 6.6
37 MARIN 2,820.3 169.0 6.0 5.1 6.9
38 RIVERSIDE 25,635.0 1,541.0 6.0 5.7 6.3
39 SUTTER 1,214.0 73.3 6.0 4.7 7.4
40 SAN DIEGO 43,993.7 2,664.7 6.1 5.8 6.3
41 SAN MATEO 10,264.3 622.7 6.1 5.6 6.5
42 SANTA CLARA 27,249.0 1,671.3 6.1 5.8 6.4
43 MERCED 3,952.0 243.0 6.1 5.4 6.9
44 STANISLAUS 7,585.3 471.7 6.2 5.7 6.8
CALIFORNIA 529,293.0 33,302.7 6.3 6.2 6.4
45 MONO 145.0 9.3 6.4 * 2.3 10.6
46 CONTRA COSTA 13,215.0 850.7 6.4 6.0 6.9
47 SAN JOAQUIN 9,858.3 636.3 6.5 6.0 7.0
48 KERN 11,871.0 769.3 6.5 6.0 6.9
49 SACRAMENTO 18,785.3 1,229.7 6.5 6.2 6.9
50 FRESNO 14,439.0 948.3 6.6 6.1 7.0
51 LOS ANGELES 154,024.3 10,171.7 6.6 6.5 6.7
52 SAN BERNARDINO 29,188.7 1,969.7 6.7 6.5 7.0
53 ALAMEDA 21,998.0 1,500.0 6.8 6.5 7.2
54 SAN FRANCISCO 8,417.0 574.3 6.8 6.3 7.4
55 SOLANO 5,835.0 399.3 6.8 6.2 7.5
56 MARIPOSA 136.3 9.3 6.8 * 2.5 11.2
57 YUBA 1,078.0 82.3 7.6 6.0 9.3
58 SISKIYOU 416.7 33.3 8.0 5.3 10.7

8/6/2019 California County Health Status Profiles 2004
http://slidepdf.com/reader/full/california-county-health-status-profiles-2004 58/85
California Department of Health Services County Health Status Profiles 200451
TABLE 22: BIRTHS TO ADOLESCENT MOTHERS, 15 TO 19 YEARS OLD,2000-2002
California Counties Ranked by Three-Year Average Age-Specific Birth Rate
The age-specific birth rate to adolescents, aged 15 to 19, in California was45.0 per 1,000 female population, a rate equivalent to approximately one birthfor every 22 adolescent females. This rate was based on the 2000 to 2002average of 52,846.7 births and a female population for the same age group of 1,175,476 as of July 1, 2001.
Among counties with "reliable" rates, the age-specific rate ranged from 77.2 inTulare County to 11.7 in Marin County, a difference in rates by a factor of 6.6 to 1.
A Healthy People 2010 National Objective for births to adolescents' aged15 to 19 has not been established.
Notes:
* Age-specific rate unreliable, relative standard error is greater than or equal to 23 percent.
Counties were rank ordered first by increasing age-specific birth rate (calculated to 15 decimal places), secondby decreasing size of the population. For purposes of this report, rates with a relative standard error greater than or equal to 23 percent are considered “unreliable.” The upper and lower limits of the age-specific birth
rate at the 95 percent confidence level indicate the precision of the estimated birth rate. Precision of the birthrate decreases as the interval widens. The upper and lower limits define the range within which the birth rateprobably would occur in 95 out of 100 independent sets of data similar to the present set. (For additionalinformation see the Technical Notes, pages 64 through 75.)
DATA SOURCES
Department of Health Services: Birth Statistical Master Files, 2000-2002.Department of Finance: 2001 Population Estimates with Age, Sex, and Race/Ethnic Detail, December 1998.
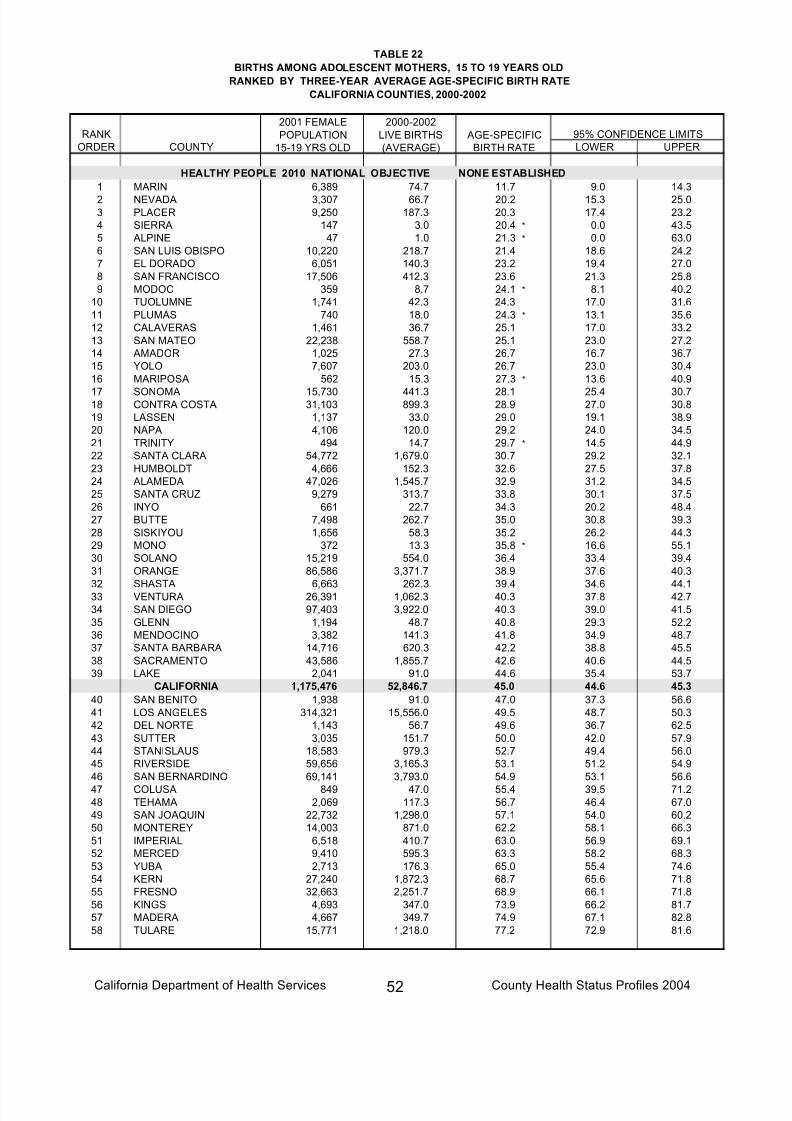
8/6/2019 California County Health Status Profiles 2004
http://slidepdf.com/reader/full/california-county-health-status-profiles-2004 59/85
California Department of Health Services County Health Status Profiles 200452
TABLE 22
BIRTHS AMONG ADOLESCENT MOTHERS, 15 TO 19 YEARS OLD
RANKED BY THREE-YEAR AVERAGE AGE-SPECIFIC BIRTH RATE
CALIFORNIA COUNTIES, 2000-2002
2001 FEMALE
POPULATION
15-19 YRS OLD
2000-2002
LIVE BIRTHS
(AVERAGE)
AGE-SPECIFIC
BIRTH RATE
RANK 95% CONFIDENCE LIMITS
ORDER COUNTY LOWER UPPER
HEALTHY PEOPLE 2010 NATIONAL OBJECTIVE NONE ESTABLISHED
1 MARIN 6,389 74.7 11.7 9.0 14.3
2 NEVADA 3,307 66.7 20.2 15.3 25.03 PLACER 9,250 187.3 20.3 17.4 23.2
4 SIERRA 147 3.0 20.4 * 0.0 43.5
5 ALPINE 47 1.0 21.3 * 0.0 63.0
6 SAN LUIS OBISPO 10,220 218.7 21.4 18.6 24.2
7 EL DORADO 6,051 140.3 23.2 19.4 27.0
8 SAN FRANCISCO 17,506 412.3 23.6 21.3 25.8
9 MODOC 359 8.7 24.1 * 8.1 40.2
10 TUOLUMNE 1,741 42.3 24.3 17.0 31.6
11 PLUMAS 740 18.0 24.3 * 13.1 35.6
12 CALAVERAS 1,461 36.7 25.1 17.0 33.2
13 SAN MATEO 22,238 558.7 25.1 23.0 27.2
14 AMADOR 1,025 27.3 26.7 16.7 36.7
15 YOLO 7,607 203.0 26.7 23.0 30.4
16 MARIPOSA 562 15.3 27.3 * 13.6 40.9
17 SONOMA 15,730 441.3 28.1 25.4 30.718 CONTRA COSTA 31,103 899.3 28.9 27.0 30.8
19 LASSEN 1,137 33.0 29.0 19.1 38.9
20 NAPA 4,106 120.0 29.2 24.0 34.5
21 TRINITY 494 14.7 29.7 * 14.5 44.9
22 SANTA CLARA 54,772 1,679.0 30.7 29.2 32.1
23 HUMBOLDT 4,666 152.3 32.6 27.5 37.8
24 ALAMEDA 47,026 1,545.7 32.9 31.2 34.5
25 SANTA CRUZ 9,279 313.7 33.8 30.1 37.5
26 INYO 661 22.7 34.3 20.2 48.4
27 BUTTE 7,498 262.7 35.0 30.8 39.3
28 SISKIYOU 1,656 58.3 35.2 26.2 44.3
29 MONO 372 13.3 35.8 * 16.6 55.1
30 SOLANO 15,219 554.0 36.4 33.4 39.4
31 ORANGE 86,586 3,371.7 38.9 37.6 40.3
32 SHASTA 6,663 262.3 39.4
34.6 44.133 VENTURA 26,391 1,062.3 40.3 37.8 42.7
34 SAN DIEGO 97,403 3,922.0 40.3 39.0 41.5
35 GLENN 1,194 48.7 40.8 29.3 52.2
36 MENDOCINO 3,382 141.3 41.8 34.9 48.7
37 SANTA BARBARA 14,716 620.3 42.2 38.8 45.5
38 SACRAMENTO 43,586 1,855.7 42.6 40.6 44.5
39 LAKE 2,041 91.0 44.6 35.4 53.7
CALIFORNIA 1,175,476 52,846.7 45.0 44.6 45.3
40 SAN BENITO 1,938 91.0 47.0 37.3 56.6
41 LOS ANGELES 314,321 15,556.0 49.5 48.7 50.3
42 DEL NORTE 1,143 56.7 49.6 36.7 62.5
43 SUTTER 3,035 151.7 50.0 42.0 57.9
44 STANISLAUS 18,583 979.3 52.7 49.4 56.0
45 RIVERSIDE 59,656 3,165.3 53.1 51.2 54.9
46 SAN BERNARDINO 69,141 3,793.0 54.9 53.1 56.6
47 COLUSA 849 47.0 55.4 39.5 71.248 TEHAMA 2,069 117.3 56.7 46.4 67.0
49 SAN JOAQUIN 22,732 1,298.0 57.1 54.0 60.2
50 MONTEREY 14,003 871.0 62.2 58.1 66.3
51 IMPERIAL 6,518 410.7 63.0 56.9 69.1
52 MERCED 9,410 595.3 63.3 58.2 68.3
53 YUBA 2,713 176.3 65.0 55.4 74.6
54 KERN 27,240 1,872.3 68.7 65.6 71.8
55 FRESNO 32,663 2,251.7 68.9 66.1 71.8
56 KINGS 4,693 347.0 73.9 66.2 81.7
57 MADERA 4,667 349.7 74.9 67.1 82.8
58 TULARE 15,771 1,218.0 77.2 72.9 81.6

8/6/2019 California County Health Status Profiles 2004
http://slidepdf.com/reader/full/california-county-health-status-profiles-2004 60/85
California Department of Health Services County Health Status Profiles 200453
TABLE 23A: PRENATAL CARE NOT BEGUN DURING THE FIRSTTRIMESTER OF PREGNANCY, 2000-2002
California Counties Ranked by Percentage of Three-Year Average Late/No Prenatal Care
The percentage of births to mothers with late or no prenatal care for Californiawas 14.5 per 100 live births. This percentage was based on a three-year average number of births to mothers with late or no prenatal care of 75,683.0and a three-year average total number of live births of 520,217.7 from2000 to 2002.
Among counties with "reliable" percentages, the percent of births to motherswith late or no prenatal care ranged from 39.4 in Mendocino County to 9.2 inSanta Cruz County, a difference in percentage by a factor of 4.3 to 1.
Altogether 3 counties with reliable percentages, but not California as a whole,met the Healthy People 2010 National Objective of not more than10.0 percent of live births to mothers with late or no prenatal care.
Notes:
The average number of live births excludes those births with unknown prenatal care.
* Percentage unreliable, relative standard error is greater than or equal to 23 percent.
Counties were rank ordered first by increasing percentage of births to mothers with late or no prenatal care(calculated to 15 decimal places), second by decreasing size of the total number of live births. For purposesof this report, percentages with a relative standard error greater than or equal to 23 percent are considered“unreliable.” The upper and lower limits of the percent of births at the 95 percent confidence level indicate theprecision of the estimated percentage. Precision of the percentage decreases as the interval widens. Theupper and lower limits define the range within which the percentage would probably occur in 95 out of 100independent sets of data similar to the present set. (For additional information see the Technical Notes, pages64 through 75.)
DATA SOURCES
Department of Health Services: Birth Statistical Master Files, 2000-2002.

8/6/2019 California County Health Status Profiles 2004
http://slidepdf.com/reader/full/california-county-health-status-profiles-2004 61/85
California Department of Health Services County Health Status Profiles 200454
TABLE 23A
PRENATAL CARE NOT BEGUN DURING THE FIRST TRIMESTER OF PREGNANCY
RANKED BY THREE-YEAR AVERAGE LATE / NO PRENATAL CARE
CALIFORNIA COUNTIES, 2000-2002
2000-2002 LIVE BIRTHS (AVERAGE)
RANK TOTAL LATE/NO PRENATAL CARE 95% CONFIDENCE LIMITS
ORDER COUNTY NUMBER NUMBER PERCENT LOWER UPPER
1 SANTA CRUZ 3,419.7 315.3 9.2 8.2 10.2
2 ALAMEDA 21,644.0 2,094.0 9.7 9.3 10.1
3 VENTURA 11,547.0 1,127.7 9.8 9.2 10.3HEALTHY PEOPLE 2010 NATIONAL OBJECTIVE 10.0
4 MARIN 2,802.0 285.0 10.2 9.0 11.4
5 CONTRA COSTA 13,150.0 1,346.7 10.2 9.7 10.8
6 ORANGE 45,589.3 4,679.7 10.3 10.0 10.6
7 TUOLUMNE 435.7 48.0 11.0 7.9 14.1
8 PLACER 3,195.3 366.0 11.5 10.3 12.6
9 LOS ANGELES 150,966.0 17,424.3 11.5 11.4 11.7
10 SHASTA 1,902.7 229.0 12.0 10.5 13.6
11 EL DORADO 1,688.0 209.7 12.4 10.7 14.1
12 AMADOR 251.3 31.3 12.5 8.1 16.8
13 SAN FRANCISCO 8,352.7 1,061.7 12.7 11.9 13.5
14 SONOMA 5,553.3 716.3 12.9 12.0 13.8
15 SANTA CLARA 26,849.3 3,623.0 13.5 13.1 13.9
16 SAN MATEO 10,246.0 1,389.3 13.6 12.8 14.3
CALIFORNIA 520,217.7 75,683.0 14.5 14.4 14.717 FRESNO 14,351.0 2,153.3 15.0 14.4 15.6
18 SAN DIEGO 43,074.7 6,508.0 15.1 14.7 15.5
19 CALAVERAS 321.0 51.3 16.0 11.6 20.4
20 TRINITY 100.7 16.3 16.2 * 8.4 24.1
21 STANISLAUS 7,462.7 1,263.7 16.9 16.0 17.9
22 KERN 10,671.7 1,808.3 16.9 16.2 17.7
23 NEVADA 801.7 138.0 17.2 14.3 20.1
24 MONTEREY 6,969.3 1,204.0 17.3 16.3 18.3
25 RIVERSIDE 25,323.7 4,550.3 18.0 17.4 18.5
26 SAN BENITO 913.7 164.3 18.0 15.2 20.7
27 TEHAMA 676.0 122.7 18.1 14.9 21.4
28 SAN LUIS OBISPO 2,394.0 435.3 18.2 16.5 19.9
29 LASSEN 267.7 49.3 18.4 13.3 23.6
30 PLUMAS 160.0 29.7 18.5 11.9 25.2
31 HUMBOLDT 1,408.3 262.7 18.7 16.4 20.932 SAN BERNARDINO 28,568.3 5,432.0 19.0 18.5 19.5
33 TULARE 7,138.0 1,360.0 19.1 18.0 20.1
34 SACRAMENTO 18,590.7 3,557.7 19.1 18.5 19.8
35 SIERRA 20.7 4.0 19.4 * 0.4 38.3
36 SISKIYOU 409.3 81.0 19.8 15.5 24.1
37 MODOC 67.3 13.3 19.8 * 9.2 30.4
38 DEL NORTE 291.0 57.7 19.8 14.7 24.9
39 MADERA 2,127.7 430.3 20.2 18.3 22.1
40 SANTA BARBARA 5,633.3 1,170.0 20.8 19.6 22.0
41 MONO 143.7 33.7 23.4 15.5 31.3
42 IMPERIAL 2,563.7 603.0 23.5 21.6 25.4
43 NAPA 1,476.0 357.0 24.2 21.7 26.7
44 SOLANO 5,471.0 1,347.3 24.6 23.3 25.9
45 KINGS 2,201.0 553.0 25.1 23.0 27.2
46 BUTTE 2,255.3 570.3 25.3 23.2 27.4
47 YOLO 2,299.7 600.7 26.1 24.0 28.248 SAN JOAQUIN 9,655.7 2,639.0 27.3 26.3 28.4
49 LAKE 603.3 169.0 28.0 23.8 32.2
50 MARIPOSA 132.0 39.0 29.5 20.3 38.8
51 GLENN 397.3 123.0 31.0 25.5 36.4
52 COLUSA 330.7 104.0 31.5 25.4 37.5
53 INYO 173.0 56.3 32.6 24.1 41.1
54 SUTTER 1,212.0 401.3 33.1 29.9 36.4
55 YUBA 1,076.0 382.0 35.5 31.9 39.1
56 MERCED 3,818.0 1,470.7 38.5 36.6 40.5
57 MENDOCINO 1,064.0 419.0 39.4 35.6 43.2
58 ALPINE 10.7 4.3 40.6 * 2.4 78.9

8/6/2019 California County Health Status Profiles 2004
http://slidepdf.com/reader/full/california-county-health-status-profiles-2004 62/85
California Department of Health Services County Health Status Profiles 200455
TABLE 23B: "ADEQUATE/ADEQUATE PLUS" PRENATAL CARE(ADEQUACY OF PRENATAL CARE UTILIZATION INDEX),
2000-2002
California Counties Ranked By Percentage of Three-Year Average “Adequate/AdequatePlus” Prenatal Care
The percentage of births to mothers with "adequate/adequate plus" prenatalcare for California was 76.9 per 100 live births. This percentage was basedon a three-year average number of births to mothers with "adequate/adequateplus" prenatal care of 392,955.0 and a three-year average total number of livebirths of 511,090.0 from 2000 to 2002.
Among counties with "reliable" percentages, the percent of births to motherswith "adequate/adequate plus" prenatal care ranged from 85.9 in
Marin County to 55.4 in Merced County, a difference in percentage by a factor of 1.6 to 1.
None of the 58 counties, irrespective of the “reliability” of their percentages,nor California as a whole, met the Healthy People 2010 National Objective of at least 90.0 percent of all live births to mothers who received“adequate/adequate plus” prenatal care according to the Adequacy of Prenatal Care Utilization Index.
Notes:
The average total number of live births excludes “unknown” adequacy of prenatal care. The definition of "adequate/adequate plus" prenatal care includes mothers who initiated prenatal care by the fourth month of pregnancy and had greater than or equal to 80 percent of the expected number of prenatal care visitsrecommended by the American College of Obstetricians and Gynecologists.
* Percentage unreliable, relative standard error is greater than or equal to 23 percent.
Counties were rank ordered first by decreasing percentage of births to mothers with "adequate/adequate plus"prenatal care (calculated to 15 decimal places), second by decreasing size of the total number of live births.For purposes of this report, percentages with a relative standard error greater than or equal to 23 percent are
considered “unreliable.” The upper and lower limits of the percent of births at the 95 percent confidence levelindicate the precision of the estimated percentage. Precision of the percentage decreases as the intervalwidens. The upper and lower limits define the range within which the percentage would probably occur in 95out of 100 independent sets of data similar to the present set. (For additional information see the TechnicalNotes, pages 64 through 75.)
DATA SOURCES
Department of Health Services: Birth Statistical Master Files, 2000-2002.

8/6/2019 California County Health Status Profiles 2004
http://slidepdf.com/reader/full/california-county-health-status-profiles-2004 63/85
California Department of Health Services County Health Status Profiles 200456
TABLE 23B
"ADEQUATE/ADEQUATE PLUS" PRENATAL CARE (ADEQUACY OF PRENATAL CARE UTILIZATION INDEX)
RANKED BY PERCENTAGE OF THREE-YEAR AVERAGE "ADEQUATE/ADEQUATE PLUS" PRENATAL CARE
CALIFORNIA COUNTIES, 2000-2002
2000-2002 LIVE BIRTHS (AVERAGE)
RANK TOTAL ADEQUATE/ADEQUATE PLUS CARE 95% CONFIDENCE LIMITS
ORDER COUNTY NUMBER NUMBER PERCENT LOWER UPPER
HEALTHY PEOPLE 2010 NATIONAL OBJECTIVE 90.0
1 MARIN 2,794.7 2,402.0 85.9 82.5 89.4
2 FRESNO 14,314.7 12,030.0 84.0 82.5 85.53 VENTURA 11,513.3 9,666.3 84.0 82.3 85.6
4 LASSEN 267.3 220.0 82.3 71.4 93.2
5 ORANGE 45,286.3 37,040.7 81.8 81.0 82.6
6 SAN MATEO 10,242.0 8,342.3 81.5 79.7 83.2
7 ALAMEDA 21,349.0 17,227.3 80.7 79.5 81.9
8 LOS ANGELES 146,896.3 117,896.0 80.3 79.8 80.7
9 PLACER 3,137.7 2,507.0 79.9 76.8 83.0
10 GLENN 393.7 312.7 79.4 70.6 88.2
11 SAN LUIS OBISPO 2,381.3 1,891.0 79.4 75.8 83.0
12 CONTRA COSTA 13,099.7 10,359.7 79.1 77.6 80.6
13 SHASTA 1,898.7 1,498.3 78.9 74.9 82.9
14 SAN FRANCISCO 8,281.3 6,480.7 78.3 76.4 80.2
15 ALPINE 10.7 8.3 78.1 * 25.1 100.0
16 DEL NORTE 290.3 226.3 78.0 67.8 88.1
17 SANTA CRUZ 3,410.7 2,645.0 77.6 74.6 80.518 SIERRA 20.7 16.0 77.4 * 39.5 100.0
19 TEHAMA 675.3 520.0 77.0 70.4 83.6
CALIFORNIA 511,090.0 392,955.0 76.9 76.6 77.1
20 KERN 9,295.7 7,111.7 76.5 74.7 78.3
21 MONO 143.3 109.3 76.3 62.0 90.6
22 BUTTE 2,248.7 1,694.3 75.3 71.8 78.9
23 SANTA BARBARA 5,621.3 4,231.0 75.3 73.0 77.5
24 MONTEREY 6,884.7 5,181.3 75.3 73.2 77.3
25 SACRAMENTO 18,331.7 13,628.3 74.3 73.1 75.6
26 SANTA CLARA 26,818.3 19,936.0 74.3 73.3 75.4
27 SAN BERNARDINO 27,625.3 20,412.7 73.9 72.9 74.9
28 EL DORADO 1,671.0 1,232.7 73.8 69.7 77.9
29 RIVERSIDE 25,218.3 18,343.0 72.7 71.7 73.8
30 CALAVERAS 320.0 232.0 72.5 63.2 81.8
31 SUTTER 1,209.7 877.0 72.5 67.7 77.332 TUOLUMNE 435.7 315.0 72.3 64.3 80.3
33 MADERA 2,124.7 1,530.0 72.0 68.4 75.6
34 SAN DIEGO 42,594.3 30,646.7 72.0 71.1 72.8
35 KINGS 2,196.7 1,573.7 71.6 68.1 75.2
36 COLUSA 330.7 234.3 70.9 61.8 79.9
37 SONOMA 5,278.3 3,716.0 70.4 68.1 72.7
38 SOLANO 5,444.3 3,822.7 70.2 68.0 72.4
39 TULARE 7,118.7 4,973.0 69.9 67.9 71.8
40 NAPA 1,458.3 1,018.3 69.8 65.5 74.1
41 NEVADA 800.0 556.0 69.5 63.7 75.3
42 INYO 172.7 119.7 69.3 56.9 81.7
43 HUMBOLDT 1,399.0 969.3 69.3 64.9 73.6
44 SISKIYOU 397.3 274.3 69.0 60.9 77.2
45 AMADOR 250.7 171.3 68.4 58.1 78.6
46 YUBA 1,075.0 734.3 68.3 63.4 73.3
47 IMPERIAL 2,398.0 1,592.0 66.4 63.1 69.648 STANISLAUS 7,293.0 4,831.7 66.3 64.4 68.1
49 LAKE 593.7 393.0 66.2 59.7 72.7
50 YOLO 2,283.7 1,485.3 65.0 61.7 68.3
51 MODOC 67.0 43.0 64.2 45.0 83.4
52 SAN JOAQUIN 9,568.0 6,128.7 64.1 62.5 65.7
53 PLUMAS 160.0 102.0 63.8 51.4 76.1
54 MENDOCINO 1,057.3 657.0 62.1 57.4 66.9
55 MARIPOSA 131.3 79.3 60.4 47.1 73.7
56 SAN BENITO 911.3 546.0 59.9 54.9 64.9
57 TRINITY 100.3 57.3 57.1 42.4 71.9
58 MERCED 3,798.3 2,106.0 55.4 53.1 57.8
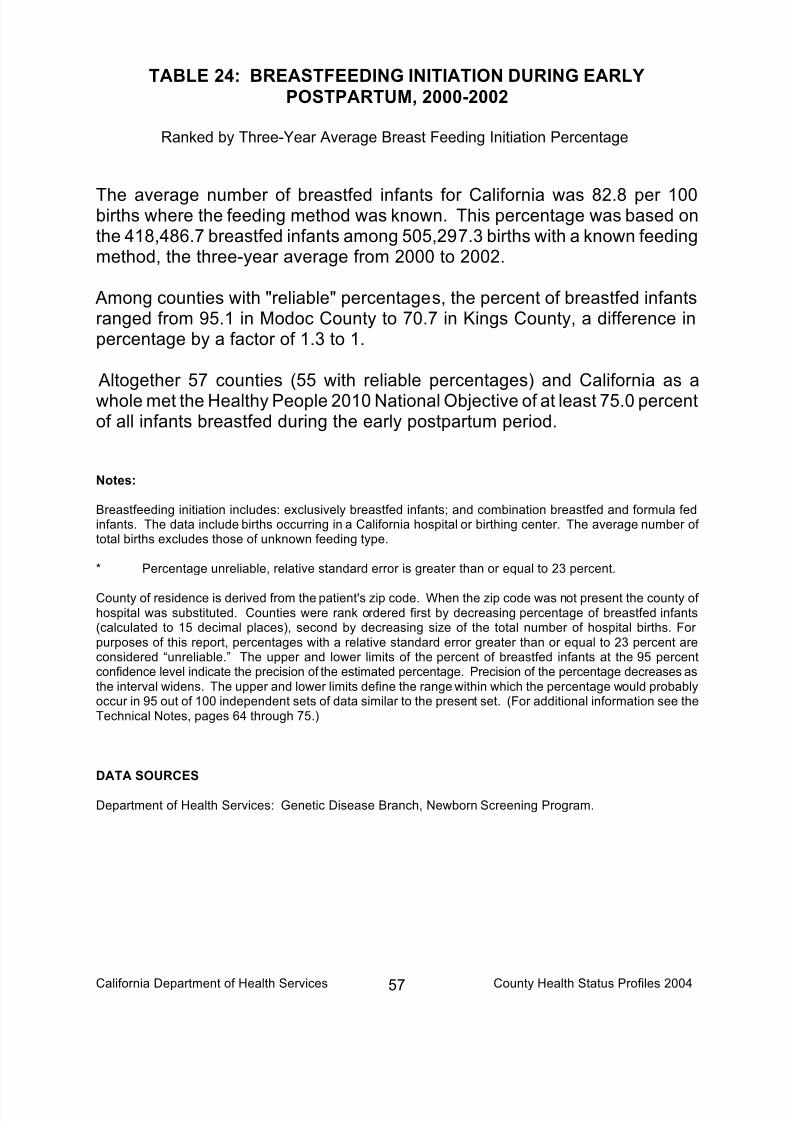
8/6/2019 California County Health Status Profiles 2004
http://slidepdf.com/reader/full/california-county-health-status-profiles-2004 64/85
California Department of Health Services County Health Status Profiles 200457
TABLE 24: BREASTFEEDING INITIATION DURING EARLYPOSTPARTUM, 2000-2002
Ranked by Three-Year Average Breast Feeding Initiation Percentage
The average number of breastfed infants for California was 82.8 per 100births where the feeding method was known. This percentage was based onthe 418,486.7 breastfed infants among 505,297.3 births with a known feedingmethod, the three-year average from 2000 to 2002.
Among counties with "reliable" percentages, the percent of breastfed infantsranged from 95.1 in Modoc County to 70.7 in Kings County, a difference inpercentage by a factor of 1.3 to 1.
Altogether 57 counties (55 with reliable percentages) and California as awhole met the Healthy People 2010 National Objective of at least 75.0 percentof all infants breastfed during the early postpartum period.
Notes:
Breastfeeding initiation includes: exclusively breastfed infants; and combination breastfed and formula fedinfants. The data include births occurring in a California hospital or birthing center. The average number of total births excludes those of unknown feeding type.
* Percentage unreliable, relative standard error is greater than or equal to 23 percent.
County of residence is derived from the patient's zip code. When the zip code was not present the county of hospital was substituted. Counties were rank ordered first by decreasing percentage of breastfed infants(calculated to 15 decimal places), second by decreasing size of the total number of hospital births. For purposes of this report, percentages with a relative standard error greater than or equal to 23 percent areconsidered “unreliable.” The upper and lower limits of the percent of breastfed infants at the 95 percentconfidence level indicate the precision of the estimated percentage. Precision of the percentage decreases asthe interval widens. The upper and lower limits define the range within which the percentage would probablyoccur in 95 out of 100 independent sets of data similar to the present set. (For additional information see theTechnical Notes, pages 64 through 75.)
DATA SOURCES
Department of Health Services: Genetic Disease Branch, Newborn Screening Program.

8/6/2019 California County Health Status Profiles 2004
http://slidepdf.com/reader/full/california-county-health-status-profiles-2004 65/85
California Department of Health Services County Health Status Profiles 200458
TABLE 24
BREASTFEEDING INITIATION DURING EARLY POSTPARTUM
RANKED BY THREE-YEAR AVERAGE BREASTFEEDING INITIATION PERCENTAGE
CALIFORNIA COUNTIES, 2000-2002
2000-2002 BIRTHS (AVERAGE)
WITH KNOWN FEEDING METHOD
RANK TOTAL BREASTFED 95% CONFIDENCE LIMITS
ORDER COUNTY NUMBER NUMBER PERCENT LOWER UPPER
1 ALPINE 11.7 11.3 97.1 * 40.6 100.0
2 MODOC 48.0 45.7 95.1 67.5 100.03 MARIN 2,788.0 2,622.0 94.0 90.4 97.6
4 SANTA CRUZ 3,549.7 3,319.0 93.5 90.3 96.7
5 PLUMAS 134.0 124.3 92.8 76.5 100.0
6 SAN LUIS OBISPO 2,319.7 2,144.7 92.5 88.5 96.4
7 SAN MATEO 9,937.3 9,187.0 92.4 90.6 94.3
8 SONOMA 5,311.7 4,897.7 92.2 89.6 94.8
9 NEVADA 741.7 681.0 91.8 84.9 98.7
10 MONTEREY 6,586.0 6,027.0 91.5 89.2 93.8
11 DEL NORTE 305.0 277.0 90.8 80.1 100.0
12 SANTA BARBARA 5,482.3 4,978.7 90.8 88.3 93.3
13 NAPA 1,446.7 1,311.0 90.6 85.7 95.5
14 SANTA CLARA 26,819.3 24,276.3 90.5 89.4 91.7
15 TRINITY 93.0 84.0 90.3 71.0 100.0
16 SHASTA 1,813.3 1,637.3 90.3 85.9 94.7
17 MONO 141.0 126.7 89.8 74.2 100.018 EL DORADO 1,715.3 1,539.0 89.7 85.2 94.2
19 HUMBOLDT 1,354.3 1,213.0 89.6 84.5 94.6
20 PLACER 2,682.3 2,402.3 89.6 86.0 93.1
21 SISKIYOU 282.0 251.3 89.1 78.1 100.0
22 INYO 182.3 161.7 88.7 75.0 100.0
23 LASSEN 198.3 175.7 88.6 75.5 100.0
24 MENDOCINO 1,052.3 932.0 88.6 82.9 94.3
25 CONTRA COSTA 12,956.3 11,443.0 88.3 86.7 89.9
26 SAN DIEGO 38,811.7 34,231.3 88.2 87.3 89.1
27 TUOLUMNE 440.0 385.0 87.5 78.8 96.2
28 ALAMEDA 21,567.3 18,863.3 87.5 86.2 88.7
29 YOLO 2,237.7 1,956.3 87.4 83.6 91.3
30 VENTURA 11,216.3 9,791.3 87.3 85.6 89.0
31 SAN FRANCISCO 8,343.0 7,268.0 87.1 85.1 89.1
32 MARIPOSA 129.0 112.3 87.1 71.0 100.0
33 SAN BENITO 869.3 755.3 86.9 80.7 93.1
34 GLENN 379.3 327.7 86.4 77.0 95.7
35 SIERRA 16.7 14.3 86.0 * 41.5 100.0
36 CALAVERAS 312.3 268.0 85.8 75.5 96.1
37 TEHAMA 621.0 531.7 85.6 78.3 92.9
38 BUTTE 2,166.0 1,853.0 85.5 81.7 89.4
39 AMADOR 247.0 211.0 85.4 73.9 97.0
40 ORANGE 44,570.0 37,597.3 84.4 83.5 85.2
41 SOLANO 5,670.7 4,783.0 84.3 82.0 86.7
42 COLUSA 313.3 261.3 83.4 73.3 93.5
CALIFORNIA 505,297.3 418,486.7 82.8 82.6 83.1
43 LAKE 569.3 471.0 82.7 75.3 90.2
44 SUTTER 1,092.0 885.7 81.1 75.8 86.4
45 FRESNO 13,915.0 11,245.3 80.8 79.3 82.3
46 MERCED 3,670.3 2,950.7 80.4 77.5 83.3
47 STANISLAUS 7,314.7 5,869.0 80.2 78.2 82.348 SACRAMENTO 17,741.3 14,192.3 80.0 78.7 81.3
49 MADERA 2,094.7 1,668.0 79.6 75.8 83.5
50 SAN JOAQUIN 9,124.0 7,223.7 79.2 77.3 81.0
51 LOS ANGELES 149,387.7 117,886.7 78.9 78.5 79.4
52 TULARE 6,919.0 5,409.3 78.2 76.1 80.3
53 KERN 11,322.0 8,797.7 77.7 76.1 79.3
54 RIVERSIDE 24,116.7 18,692.0 77.5 76.4 78.6
55 IMPERIAL 2,533.0 1,962.3 77.5 74.0 80.9
56 YUBA 934.7 702.7 75.2 69.6 80.7
57 SAN BERNARDINO 26,915.3 20,189.0 75.0 74.0 76.0
HEALTHY PEOPLE 2010 NATIONAL OBJECTIV 75.0
58 KINGS 1,785.3 1,262.3 70.7 66.8 74.6
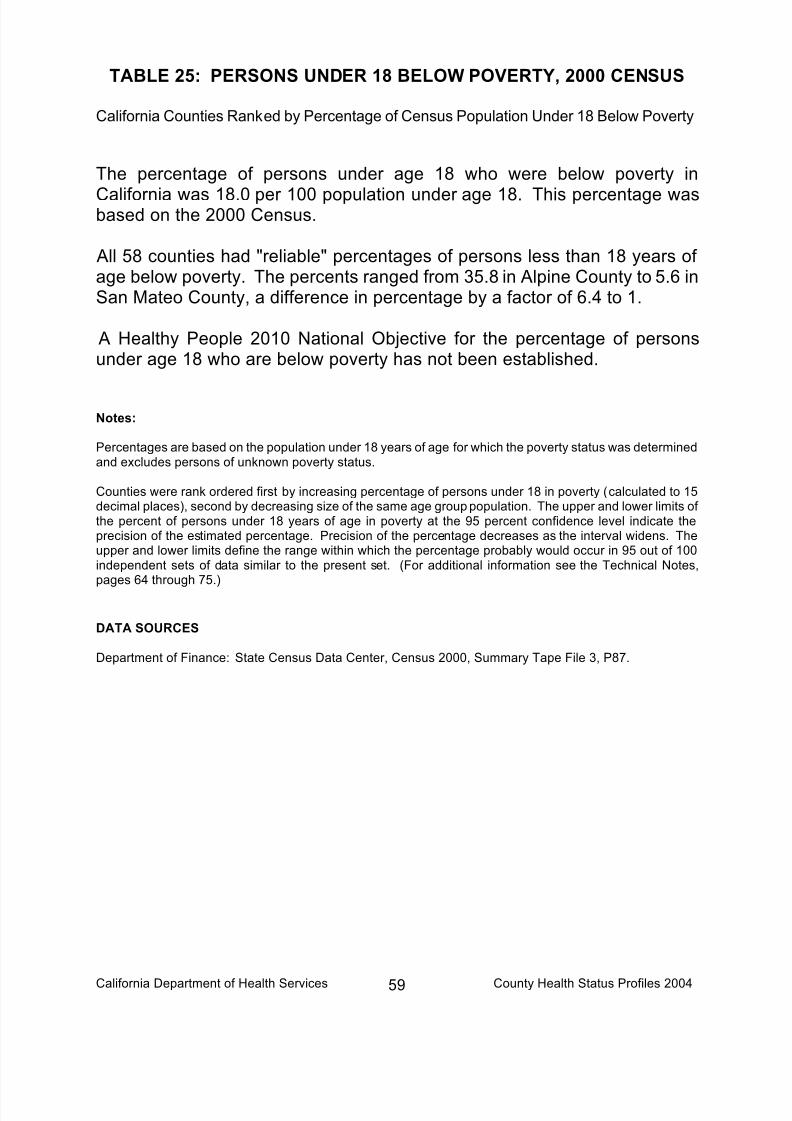
8/6/2019 California County Health Status Profiles 2004
http://slidepdf.com/reader/full/california-county-health-status-profiles-2004 66/85
California Department of Health Services County Health Status Profiles 200459
TABLE 25: PERSONS UNDER 18 BELOW POVERTY, 2000 CENSUS
California Counties Ranked by Percentage of Census Population Under 18 Below Poverty
The percentage of persons under age 18 who were below poverty in
California was 18.0 per 100 population under age 18. This percentage wasbased on the 2000 Census.
All 58 counties had "reliable" percentages of persons less than 18 years of age below poverty. The percents ranged from 35.8 in Alpine County to 5.6 inSan Mateo County, a difference in percentage by a factor of 6.4 to 1.
A Healthy People 2010 National Objective for the percentage of personsunder age 18 who are below poverty has not been established.
Notes:
Percentages are based on the population under 18 years of age for which the poverty status was determinedand excludes persons of unknown poverty status.
Counties were rank ordered first by increasing percentage of persons under 18 in poverty (calculated to 15decimal places), second by decreasing size of the same age group population. The upper and lower limits of the percent of persons under 18 years of age in poverty at the 95 percent confidence level indicate theprecision of the estimated percentage. Precision of the percentage decreases as the interval widens. Theupper and lower limits define the range within which the percentage probably would occur in 95 out of 100independent sets of data similar to the present set. (For additional information see the Technical Notes,pages 64 through 75.)
DATA SOURCES
Department of Finance: State Census Data Center, Census 2000, Summary Tape File 3, P87.

8/6/2019 California County Health Status Profiles 2004
http://slidepdf.com/reader/full/california-county-health-status-profiles-2004 67/85
California Department of Health Services County Health Status Profiles 200460
TABLE 25
PERSONS UNDER 18 BELOW POVERTY
RANKED BY PERCENTAGE OF CENSUS POPULATION UNDER 18 BELOW POVERTY
CALIFORNIA COUNTIES, 2000
UNDER 18
RANK 2000 IN POVERTY 95% CONFIDENCE LIMITS
ORDER COUNTY POPULATION NUMBER PERCENT LOWER UPPER
HEALTHY PEOPLE 2010 NATIONAL OBJECTIVE NONE ESTABLISHED
1 SAN MATEO 183,896 10,285 5.6 5.5 5.7
2 PLACER 63,529 4,317 6.8 6.6 7.03 MARIN 51,290 3,714 7.2 7.0 7.5
4 SANTA CLARA 461,564 36,548 7.9 7.8 8.0
5 EL DORADO 40,159 3,209 8.0 7.7 8.3
6 SONOMA 112,216 9,762 8.7 8.5 8.9
7 SAN FRANCISCO 153,294 15,443 10.1 9.9 10.2
8 SOLANO 113,770 11,852 10.4 10.2 10.6
9 NEVADA 20,613 2,166 10.5 10.1 11.0
10 CONTRA COSTA 236,579 25,104 10.6 10.5 10.7
11 SAN LUIS OBISPO 56,461 6,212 11.0 10.7 11.3
12 NAPA 29,542 3,321 11.2 10.9 11.6
13 SANTA CRUZ 65,771 7,871 12.0 11.7 12.2
14 VENTURA 210,062 25,407 12.1 11.9 12.2
15 ALAMEDA 386,413 48,221 12.5 12.4 12.6
16 ORANGE 807,247 102,002 12.6 12.6 12.7
17 SAN BENITO 15,163 2,014 13.3 12.7 13.918 MONO 2,597 365 14.1 12.6 15.5
19 SAN DIEGO 813,326 119,704 14.7 14.6 14.8
20 AMADOR 6,420 969 15.1 14.1 16.0
21 SANTA BARBARA 107,047 16,319 15.2 15.0 15.5
22 CALAVERAS 9,401 1,462 15.6 14.8 16.3
23 INYO 4,356 705 16.2 15.0 17.4
24 MONTEREY 121,883 19,775 16.2 16.0 16.5
25 YOLO 42,113 6,900 16.4 16.0 16.8
26 LASSEN 7,323 1,204 16.4 15.5 17.4
27 TUOLUMNE 10,982 1,864 17.0 16.2 17.7
28 MARIPOSA 3,553 624 17.6 16.2 18.9
CALIFORNIA 9,770,687 1,757,100 18.0 18.0 18.0
29 SIERRA 656 122 18.6 15.3 21.9
30 RIVERSIDE 467,627 87,083 18.6 18.5 18.7
31 PLUMAS 4,230 801 18.9 17.6 20.232 COLUSA 6,124 1,168 19.1 18.0 20.2
33 SACRAMENTO 338,525 67,728 20.0 19.9 20.2
34 SHASTA 44,996 9,082 20.2 19.8 20.6
35 SAN BERNARDINO 558,958 113,695 20.3 20.2 20.5
36 STANISLAUS 140,157 28,547 20.4 20.1 20.6
37 SUTTER 23,029 4,818 20.9 20.3 21.5
38 MENDOCINO 22,527 4,775 21.2 20.6 21.8
39 HUMBOLDT 30,815 6,618 21.5 21.0 22.0
40 LOS ANGELES 2,892,852 640,145 22.1 22.1 22.2
41 LAKE 14,013 3,202 22.9 22.1 23.6
42 BUTTE 50,224 11,547 23.0 22.6 23.4
43 YUBA 21,270 5,038 23.7 23.0 24.3
44 SAN JOAQUIN 173,323 41,186 23.8 23.5 24.0
45 GLENN 8,672 2,116 24.4 23.4 25.4
46 DEL NORTE 7,307 1,818 24.9 23.7 26.0
47 KINGS 38,767 9,705 25.0 24.5 25.548 TEHAMA 14,376 3,670 25.5 24.7 26.4
49 IMPERIAL 49,477 12,769 25.8 25.4 26.3
50 TRINITY 2,894 771 26.6 24.8 28.5
51 KERN 214,591 58,213 27.1 26.9 27.3
52 SISKIYOU 10,243 2,825 27.6 26.6 28.6
53 MERCED 72,846 20,423 28.0 27.7 28.4
54 MADERA 36,659 10,333 28.2 27.6 28.7
55 MODOC 2,380 710 29.8 27.6 32.0
56 FRESNO 260,941 80,504 30.9 30.6 31.1
57 TULARE 125,420 40,271 32.1 31.8 32.4
58 ALPINE 218 78 35.8 27.8 43.7

8/6/2019 California County Health Status Profiles 2004
http://slidepdf.com/reader/full/california-county-health-status-profiles-2004 68/85
California Department of Health Services County Health Status Profiles 200461
TABLE 26
A COMPARISON OF THREE-YEAR AVERAGE RATES AND PERCENTAGES
AMONG SELECTED HEALTH STATUS INDICATORS
CALIFORNIA COUNTIES, 1997-1999 and 2000-2002
AGE-ADJUSTED DEATH RATES MORBIDITY RATE MORBIDITY RATE
ALL CAUSES REPORTED INCIDENCE TUBERCULOSIS
COUNTY OF DEATH OF AIDS (AGES 13 AND OVER) CRUDE RATES
(THREE-YEAR AVERAGES)1, 1A
(THREE-YEAR AVERAGES)2
(THREE-YEAR AVERAGES)2
1997-1999 2000-2002 1997-1999 2000-2002 1997-1999 2000-2002
CALIFORNIA 791.5 745.0 20.2 15.2 11.5 9.3 ALAMEDA 794.1 735.9 24.4 18.4 16.0
ALPINE 791.4 * 507.3 * 0.0 + 0.0 + 0.0 + 0.0 +
AMADOR 744.1 726.9 12.7 * 5.4 * 2.0 *
BUTTE 816.1 764.9 6.5 * 4.5 * 3.5 * 1.6 *
CALAVERAS 775.2 664.5 5.1 * 3.6 * 0.9 * 0.8 *
COLUSA 779.1 628.0 0.0 + 0.0 + 5.4 * 4.5 *
CONTRA COSTA 780.7 746.4 12.0 10.4 11.1 8.9
DEL NORTE 867.5 751.2 4.3 * 7.5 * 1.2 * 1.0 *
EL DORADO 756.2 685.9 4.8 * 4.0 * 1.6 * 2.4 *
FRESNO 828.5 799.3 11.6 8.6 13.0 11.6
GLENN 792.7 743.9 0.0 + 5.6 * 1.2 * 1.1 *
HUMBOLDT 942.0 938.1 8.0 * 5.9 * 8.2 * 4.9 *
IMPERIAL 745.8 655.3 4.5 * 6.3 * 27.0 16.5
INYO 779.3 764.0 2.2 * 0.0 + 0.0 + 3.6 *
KERN 866.2 822.3 17.4 17.4 9.0 7.4
KINGS 822.0 802.8 16.8 * 7.3 * 11.5 * 6.2 *
LAKE 877.3 849.8 16.7 * 9.0 * 4.2 * 2.1 *
LASSEN 701.9 617.6 19.6 * 5.3 * 1.0 * 0.9 *
LOS ANGELES 790.9 739.5 26.1 20.7 14.2 11.3
MADERA 770.1 728.2 10.0 * 15.9 * 7.6 * 9.4 *
MARIN 746.9 705.6 23.7 20.1 5.7 * 5.1 *
MARIPOSA 785.3 644.2 2.4 * 0.0 + 0.0 + 3.9 *
MENDOCINO 872.8 821.6 8.5 * 8.3 * 2.7 * 4.7 *
MERCED 913.8 815.6 5.4 * 6.4 * 4.7 * 6.2 *
MODOC 875.6 680.7 0.0 + 3.7 * 0.0 + 6.3 *
MONO 496.4 545.0 0.0 + 10.8 * 0.0 + 0.0 +
MONTEREY 747.1 720.3 13.1 8.7 12.2 8.0
NAPA 815.8 769.1 6.9 * 4.0 * 3.0 * 3.1 *
NEVADA 687.3 649.4 6.1 * 2.7 * 1.1 * 0.7 *
ORANGE 789.8 757.2 13.6 9.7 10.5 8.7
PLACER 802.2 814.2 2.9 * 2.9 * 1.8 * 0.9 *PLUMAS 770.6 666.9 3.8 * 1.8 * 1.6 * 1.6 *
RIVERSIDE 794.2 757.9 23.6 16.4 5.0 4.2
SACRAMENTO 877.0 841.0 16.8 10.0 10.0 9.5
SAN BENITO 631.0 581.8 8.0 * 4.0 * 7.7 * 6.8 *
SAN BERNARDINO 923.5 885.4 11.0 9.0 7.0 4.7
SAN DIEGO 778.5 739.9 22.9 18.6 11.4 10.6
SAN FRANCISCO 719.9 658.4 103.4 72.3 28.9 20.9
SAN JOAQUIN 843.0 798.3 13.4 9.8 12.3 9.8
SAN LUIS OBISPO 743.5 664.3 11.3 10.2 4.3 * 3.3 *
SAN MATEO 686.6 610.2 13.1 7.8 10.5 8.4
SANTA BARBARA 713.9 696.4 7.8 5.8 7.7 5.3
SANTA CLARA 721.7 636.8 11.0 8.3 14.8 13.1
SANTA CRUZ 710.2 659.5 13.1 7.7 * 5.5 * 2.1 *
SHASTA 946.2 870.2 2.7 * 1.8 * 3.8 * 2.4 *
SIERRA 702.8 680.1 0.0 + 0.0 + 0.0 + 0.0 +
SISKIYOU 854.8 832.1 6.3 * 4.3 * 2.3 * 0.7 *
SOLANO 868.2 841.6 23.8 17.3 11.0 7.2
SONOMA 799.3 754.8 13.1 10.3 3.5 * 2.9 *
STANISLAUS 909.4 859.9 9.3 5.3 7.2 4.1
SUTTER 831.3 793.2 6.6 * 1.5 * 9.1 * 6.3 *
TEHAMA 843.2 826.6 2.2 * 0.7 * 4.2 * 1.7 *
TRINITY 981.7 823.6 0.0 + 2.8 * 0.0 + 0.0 +
TULARE 848.5 807.1 6.0 * 3.8 * 6.7 4.4 *
TUOLUMNE 794.5 785.3 8.0 * 3.3 * 5.7 * 1.7 *
VENTURA 757.7 736.8 8.2 5.7 8.9 7.1
YOLO 841.3 811.1 5.0 * 7.4 * 6.8 * 3.6 *
YUBA 1,078.7 968.9 6.6 * 4.0 * 8.8 * 10.8 *

8/6/2019 California County Health Status Profiles 2004
http://slidepdf.com/reader/full/california-county-health-status-profiles-2004 69/85
California Department of Health Services County Health Status Profiles 200462
TABLE 26 (continued)
A COMPARISON OF THREE-YEAR AVERAGE RATES AND PERCENTAGES
AMONG SELECTED HEALTH STATUS INDICATORS
CALIFORNIA COUNTIES, 1995-1997, 1997-1999, and 2000-2002
PERCENT MORTALITY RATE PERCENT
ADEQUATE/ADEQUATE PLUS INFANT MORTALITY, LOW BIRTHWEIGHT
COUNTY PRENATAL CARE ALL RACE/ETHNIC GROUPS INFANTS
(THREE-YEAR AVERAGES)3
(THREE-YEAR AVERAGES)4
(THREE-YEAR AVERAGES)3
1997-1999 2000-2002 1995-1997 1999-2001 1997-1999 2000-2002
CALIFORNIA 75.0 76.9 6.1 5.5 6.2 6.3
ALAMEDA 79.8 80.7 5.6 5.4 6.9
ALPINE 73.5 * 78.1 * 0.0 + 0.0 + 0.0 + 0.0 +
AMADOR 76.7 68.4 3.7 * 3.9 * 5.9 *
BUTTE 73.2 75.3 8.0 4.6 * 4.9 5.5
CALAVERAS 73.9 72.5 5.8 * 5.2 * 4.9 * 4.6 *
COLUSA 61.0 70.9 8.6 * 4.9 * 5.9 * 3.6 *
CONTRA COSTA 75.8 79.1 5.7 4.7 6.3 6.4
DEL NORTE 77.4 78.0 10.3 * 5.6 * 5.4 * 5.1 *
EL DORADO 80.2 73.8 4.0 * 4.2 * 5.6 5.9
FRESNO 82.3 84.0 8.0 6.3 6.5 6.6
GLENN 75.3 79.4 3.8 * 1.7 * 4.4 * 5.7
HUMBOLDT 59.6 69.3 6.4 * 5.6 * 4.4 5.4
IMPERIAL 66.3 66.4 5.1 * 5.1 * 5.6 5.1
INYO 74.7 69.3 10.7 * 5.6 * 5.3 * 5.0 *
KERN 72.2 76.5 8.8 7.2 6.1 6.5
KINGS 77.2 71.6 8.5 * 5.9 * 5.9 5.9LAKE 62.3 66.2 7.1 * 4.0 * 5.6 5.9
LASSEN 80.9 82.3 5.4 * 7.6 * 4.3 * 5.9 *
LOS ANGELES 77.4 80.3 6.2 5.4 6.5 6.6
MADERA 71.8 72.0 5.8 * 6.1 * 5.2 6.0
MARIN 79.6 85.9 3.7 * 2.9 * 5.2 6.0
MARIPOSA 63.2 60.4 6.8 * 12.3 * 6.8 * 6.8 *
MENDOCINO 61.0 62.1 7.9 * 7.0 * 4.7 4.6
MERCED 61.4 55.4 7.0 4.9 * 6.0 6.1
MODOC 65.1 64.2 15.0 * 4.7 * 5.7 * 5.2 *
MONO 78.4 76.3 0.0 + 7.2 * 6.5 * 6.4 *
MONTEREY 72.1 75.3 5.9 5.2 5.6 5.7
NAPA 69.7 69.8 4.2 * 2.2 * 4.9 5.5
NEVADA 69.3 69.5 7.4 * 1.3 * 5.5 5.2
ORANGE 78.2 81.8 4.8 4.7 5.4 5.8
PLACER 81.1 79.9 4.7 * 5.5 * 4.8 5.7PLUMAS 72.5 63.8 4.2 * 4.6 * 2.1 * 4.8 *
RIVERSIDE 68.9 72.7 6.7 6.0 6.2 6.0
SACRAMENTO 73.8 74.3 7.1 6.0 6.7 6.5
SAN BENITO 56.6 59.9 5.6 * 4.2 * 4.6 5.0
SAN BERNARDINO 70.6 73.9 7.7 7.4 6.4 6.7
SAN DIEGO 72.2 72.0 5.5 5.7 5.9 6.1
SAN FRANCISCO 78.9 78.3 4.4 4.1 6.8 6.8
SAN JOAQUIN 64.2 64.1 7.1 6.3 6.2 6.5
SAN LUIS OBISPO 83.8 79.4 5.0 * 4.4 * 5.0 5.5
SAN MATEO 79.0 81.5 4.8 4.5 6.1 6.1
SANTA BARBARA 75.6 75.3 4.8 5.0 5.8 6.0
SANTA CLARA 73.2 74.3 5.4 4.4 6.0 6.1
SANTA CRUZ 73.3 77.6 4.7 * 4.7 * 5.3 5.2
SHASTA 69.5 78.9 6.7 * 6.2 * 5.1 5.7
SIERRA 69.8 * 77.4 * 0.0 + 0.0 + 2.3 * 4.8 *
SISKIYOU 72.2 69.0 6.9 * 3.1 * 5.3 8.0SOLANO 65.7 70.2 6.0 4.8 6.6 6.8
SONOMA 73.9 70.4 4.2 4.5 5.2 5.2
STANISLAUS 65.2 66.3 6.6 7.7 6.3 6.2
SUTTER 67.0 72.5 7.1 * 3.4 * 6.3 6.0
TEHAMA 75.9 77.0 4.9 * 7.2 * 4.4 5.4
TRINITY 54.8 57.1 8.2 * 7.0 * 7.1 * 5.9 *
TULARE 70.4 69.9 6.2 6.6 5.5 5.7
TUOLUMNE 80.9 72.3 8.4 * 8.4 * 5.8 5.1
VENTURA 83.7 84.0 6.1 4.9 5.6 5.9
YOLO 66.1 65.0 6.7 * 5.7 * 5.5 5.7
YUBA 62.2 68.3 8.1 * 8.4 * 7.3 7.6

8/6/2019 California County Health Status Profiles 2004
http://slidepdf.com/reader/full/california-county-health-status-profiles-2004 70/85
California Department of Health Services County Health Status Profiles 200463
TABLE 26 (continued)
A COMPARISON OF THREE-YEAR AVERAGE RATES AND PERCENTAGES
AMONG SELECTED HEALTH STATUS INDICATORS
CALIFORNIA COUNTIES, 1997-1999 and 2000-2002
AGE-SPECIFIC BIRTH RATE PERCENT BREASTFED
BIRTHS AMONG ADOLESCENT BIRTHS WITH
COUNTY MOTHERS, 15 TO 19 YEARS OLD KNOWN FEEDING METHOD
(THREE-YEAR AVERAGES) (THREE-YEAR AVERAGES)
1997-1999 2000-2002 1997-1999 2000-2002
CALIFORNIA 53.6 45.0 79.9 82.8
ALAMEDA 39.9 32.9 83.4 87.5
ALPINE 25.0 * 21.3 * 83.3 * 97.1 * AMADOR 28.5 26.7 85.0 85.4
BUTTE 47.1 35.0 83.4 85.5
CALAVERAS 26.9 25.1 82.7 85.8
COLUSA 57.8 55.4 80.1 83.4
CONTRA COSTA 33.8 28.9 85.7 88.3
DEL NORTE 60.6 49.6 87.6 90.8
EL DORADO 27.5 23.2 89.2 89.7
FRESNO 79.5 68.9 75.0 80.8
GLENN 53.4 40.8 83.5 86.4
HUMBOLDT 40.0 32.6 88.7 89.6
IMPERIAL 62.5 63.0 73.6 77.5
INYO 48.9 34.3 87.4 88.7
KERN 78.9 68.7 73.1 77.7
KINGS 82.6 73.9 69.3 70.7
LAKE 51.6 44.6 81.4 82.7
LASSEN 40.8 29.0 89.5 88.6
LOS ANGELES 59.9 49.5 76.4 78.9
MADERA 81.5 74.9 75.2 79.6MARIN 15.6 11.7 92.2 94.0
MARIPOSA 37.7 27.3 * 85.7 87.1
MENDOCINO 45.7 41.8 87.7 88.6
MERCED 70.2 63.3 72.9 80.4
MODOC 35.1 * 24.1 * 86.2 95.1
MONO 31.5 * 35.8 * 91.0 89.8
MONTEREY 71.1 62.2 90.8 91.5
NAPA 34.0 29.2 90.3 90.6
NEVADA 24.6 20.2 92.0 91.8
ORANGE 46.8 38.9 80.7 84.4
PLACER 24.4 20.3 88.7 89.6
PLUMAS 21.2 * 24.3 * 89.3 92.8
RIVERSIDE 61.2 53.1 73.5 77.5
SACRAMENTO 51.0 42.6 78.0 80.0
SAN BENITO 61.4 47.0 85.4 86.9
SAN BERNARDINO 65.5 54.9 70.9 75.0
SAN DIEGO 49.8 40.3 85.7 88.2SAN FRANCISCO 30.2 23.6 83.8 87.1
SAN JOAQUIN 62.3 57.1 77.5 79.2
SAN LUIS OBISPO 30.3 21.4 91.9 92.5
SAN MATEO 32.9 25.1 90.4 92.4
SANTA BARBARA 52.7 42.2 88.0 90.8
SANTA CLARA 40.3 30.7 88.3 90.5
SANTA CRUZ 42.9 33.8 92.1 93.5
SHASTA 50.1 39.4 86.7 90.3
SIERRA 11.6 * 20.4 * 97.2 * 86.0 *
SISKIYOU 43.1 35.2 87.7 89.1
SOLANO 44.4 36.4 80.2 84.3
SONOMA 34.9 28.1 90.6 92.2
STANISLAUS 57.1 52.7 74.3 80.2
SUTTER 50.3 50.0 78.2 81.1
TEHAMA 56.2 56.7 83.9 85.6
TRINITY 39.9 29.7 * 92.1 90.3
TULARE 83.3 77.2 76.9 78.2
TUOLUMNE 34.2 24.3 86.5 87.5
VENTURA 42.6 40.3 86.0 87.3
YOLO 37.9 26.7 86.3 87.4
YUBA 67.7 65.0 69.3 75.2
1Age-adjusted death rates are per 100,000 population.
3Low birthweight and prenatal care percentages are per 100 live births.
1AAge-adjusted death rates for years 1997-1999 were calculated using the 2000
4Birth cohort rates are per 1,000 live births.
Population Standard; thus, rates may not be consistent with previous * Rate or percent unreliable; relative standard error greater than
"Profiles" reports. or equal to 23 percent.2
Crude case rates are per 100,000 population. + Standard error indeterminate; rate or percent based on no (zero) events.
Sources: Department of Health Services, Center for Health Statistics: Birth and Death Statistical Master Files, 1997-2002;
and Birth Cohort Files, 1995-1997, 1999-2001
Department of Health Services, Office of AIDS, AIDS Case Registry, Genetic Disease Branch, Maternal and Child Health Branch.
Department of Finance: Intercensal Estimates of California Population, July 1997; 2002 Race/Ethnic Population by County with Age and
Sex Detail, December 1998.

8/6/2019 California County Health Status Profiles 2004
http://slidepdf.com/reader/full/california-county-health-status-profiles-2004 71/85
California Department of Health Services County Health Status Profiles 200464
TECHNICAL NOTES
DATA SOURCES
The California Department of Health Services, Center for Health Statistics, Office of VitalRecords, was the source for the birth and death data that appear in this report. Data weretabulated from the Birth and Death Statistical Master Files for the years 1997 through 1999and 2000 through 2002, and from the linked births-deaths in the Birth Cohort-PerinatalOutcome Files for the years 1995 through 1997 and 1999 through 2001, which are basedon the Statistical Master Files.
The California Department of Health Services, Division of Communicable Disease Control,Office of Statistics and Surveillance, was the source for the reported case incidence of measles, tuberculosis, hepatitis C, chlamydia, and primary and secondary syphilis. TheCalifornia Department of Health Services, Office of AIDS, AIDS Case Registry providedincidence data of diagnosed AIDS cases. The California Department of Health Services,Genetic Disease Branch, Newborn Screening Program provided breast feeding incidence
data.
The population data are provided on the Internet Website of the California Department of Finance, Demographic Research Unit and Census Data Center, and are the same datareferenced in other Center for Health Statistics reports. Population series are referenced inthe table footnotes.
Vital event and case data received late or registered after the cutoff date for creation of thedata files used in this report may result in small undercounts.
DATA DEFINITIONS
Mortality (Tables 1-13):
A consistent use of the consensus set of health status indicators has been facilitated byreference to the causes of mortality coded according to the International Classification of Diseases, Tenth Revision (ICD-10). Cause of death coding using ICD-10 began with 1999mortality data in the 2001 County Health Status Profiles report. "Profiles" reports from 1993through 2001 used the International Classification of Diseases, Ninth Revision(ICD-9) for coding cause of death. The change to ICD-10 follows a worldwide standardcreated by the World Health Organization. In the United States, the National Center for Health Statistics sets the standards for implementation of the ICD-10.
Due to these changes, readers and users of these data are cautioned that mortality tablesincluding data prior to 1999 are not necessarily comparable to those including 1999forward, and should not be used to create trend data.
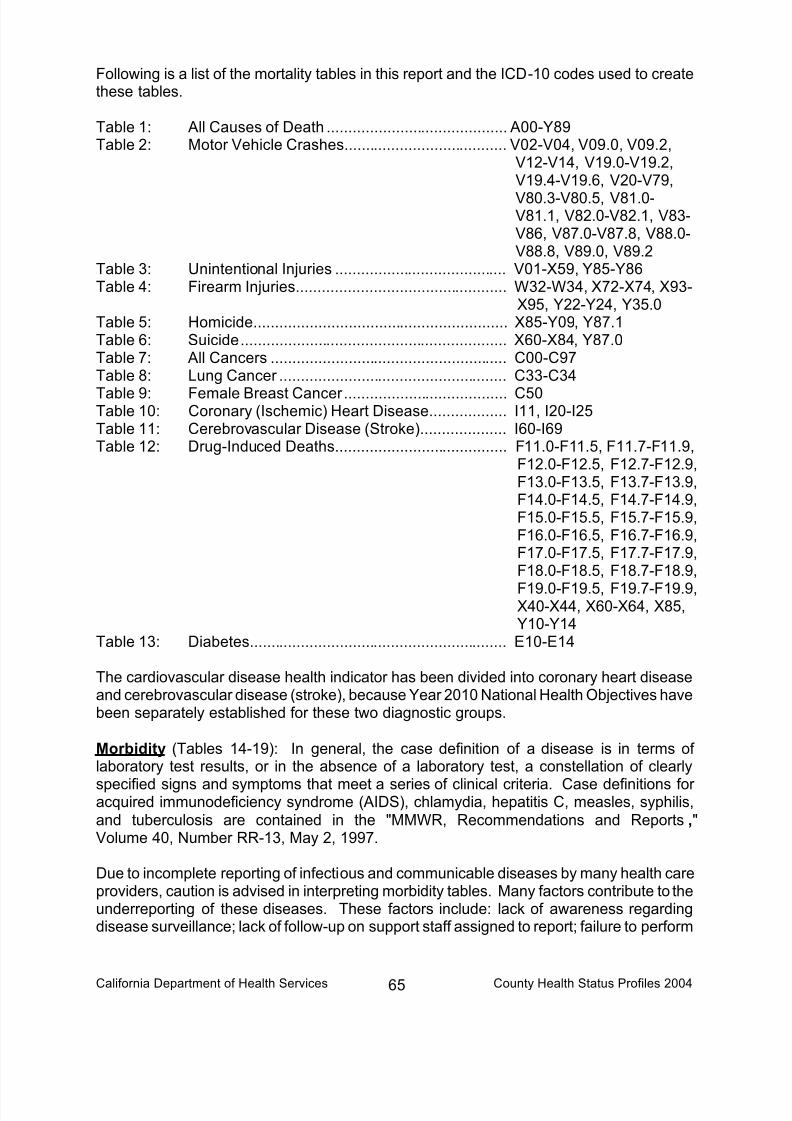
8/6/2019 California County Health Status Profiles 2004
http://slidepdf.com/reader/full/california-county-health-status-profiles-2004 72/85
California Department of Health Services County Health Status Profiles 200465
Following is a list of the mortality tables in this report and the ICD-10 codes used to createthese tables.
Table 1: All Causes of Death .......................................... A00-Y89Table 2: Motor Vehicle Crashes...................................... V02-V04, V09.0, V09.2,
V12-V14, V19.0-V19.2,V19.4-V19.6, V20-V79,
V80.3-V80.5, V81.0-V81.1, V82.0-V82.1, V83-V86, V87.0-V87.8, V88.0-V88.8, V89.0, V89.2
Table 3: Unintentional Injuries ........................................ V01-X59, Y85-Y86Table 4: Firearm Injuries................................................. W32-W34, X72-X74, X93-
X95, Y22-Y24, Y35.0Table 5: Homicide........................................................... X85-Y09, Y87.1Table 6: Suicide.............................................................. X60-X84, Y87.0Table 7: All Cancers ....................................................... C00-C97Table 8: Lung Cancer ..................................................... C33-C34
Table 9: Female Breast Cancer...................................... C50Table 10: Coronary (Ischemic) Heart Disease.................. I11, I20-I25Table 11: Cerebrovascular Disease (Stroke).................... I60-I69Table 12: Drug-Induced Deaths........................................ F11.0-F11.5, F11.7-F11.9,
F12.0-F12.5, F12.7-F12.9,F13.0-F13.5, F13.7-F13.9,F14.0-F14.5, F14.7-F14.9,F15.0-F15.5, F15.7-F15.9,F16.0-F16.5, F16.7-F16.9,F17.0-F17.5, F17.7-F17.9,F18.0-F18.5, F18.7-F18.9,
F19.0-F19.5, F19.7-F19.9,X40-X44, X60-X64, X85,Y10-Y14
Table 13: Diabetes............................................................ E10-E14
The cardiovascular disease health indicator has been divided into coronary heart diseaseand cerebrovascular disease (stroke), because Year 2010 National Health Objectives havebeen separately established for these two diagnostic groups.
Morbidity (Tables 14-19): In general, the case definition of a disease is in terms of laboratory test results, or in the absence of a laboratory test, a constellation of clearly
specified signs and symptoms that meet a series of clinical criteria. Case definitions for acquired immunodeficiency syndrome (AIDS), chlamydia, hepatitis C, measles, syphilis,and tuberculosis are contained in the "MMWR, Recommendations and Reports,"Volume 40, Number RR-13, May 2, 1997.
Due to incomplete reporting of infectious and communicable diseases by many health careproviders, caution is advised in interpreting morbidity tables. Many factors contribute to theunderreporting of these diseases. These factors include: lack of awareness regardingdisease surveillance; lack of follow-up on support staff assigned to report; failure to perform

8/6/2019 California County Health Status Profiles 2004
http://slidepdf.com/reader/full/california-county-health-status-profiles-2004 73/85
California Department of Health Services County Health Status Profiles 200466
diagnostic lab tests to confirm or rule out infectious etiology; concern for anonymity of theclient; or expedited treatment in lieu of waiting for laboratory results because of time or costconstraints.
All vital events are subject to the vagaries of reporting. This fact forms the basis for theargument supporting the concept of sampling error in vital statistics. The problem of theuncertainty of reporting all events can be especially true for morbidity data. Therefore, the
headings of the tables on AIDS, measles, tuberculosis, hepatitis C, chlamydia, and syphilisemphasize that the data show only reported number of cases. For more complete andtechnical definitions of types of morbidity, contact the Division of Communicable DiseaseControl or the Office of AIDS.
Birth Cohort Infant Mortality (Tables 20A-20E): The infant mortality rate is the number of deaths among infants under one year of age per 1,000 live births. It is a universallyaccepted and easily understood indicator, which represents the overall health status of acommunity.
Studies of infant mortality that are based on information from death certificates alone have
been found to underestimate infant death rates for infants of all race/ethnic groups andespecially for certain race/ethnic groups. Infant mortality rates in this report are based onlinked birth and infant death records in the Birth Cohort-Perinatal Outcome Files, whichgenerate more accurate estimates of the total number of infant deaths as well as moreaccurate race-specific infant mortality rates. The race used on the race-specific infantmortality tables is the race of the mother, thus both the numerator and the denominator used for rate calculations reflect the mother’s race only.
Due to staffing shortages within the Center for Health Statistics, a birth cohort file was notcreated for 1998. Therefore, three-year birth cohort averages were created using years1995 through 1997 and 1999 through 2001. Caution should be exercised when using this
three-year average infant mortality rate for trend analysis.
Since delayed birth and death certificate data are included in the Birth Cohort-PerinatalOutcome Files after the Birth and Death Statistical Master Files have been closed to further processing, cohort files cannot be as timely as the Statistical Master Files. However, theBirth Cohort-Perinatal Outcome Files are more complete.
Race/Ethnicity (Tables 20A-20E): The four groups, based on mother's race/ethnicity, aremutually exclusive and all inclusive categories. They are also consistent for the most partwith those that were used by the State Census Data Center, Department of Finance, for compiling the 2001 population estimates used in this report.
The mother's Hispanic origin is determined first, irrespective of race, and then second, therace categories for the remaining non-Hispanics are determined. The White categoryincludes the following groups: White, Other (Specified), Not Stated, and Unknown. TheWhite race/ethnic group is non-Hispanic. The Black category only includesnon-Hispanic Blacks. The Asian/Other category includes the following groups: Aleut,
American Indian, Asian Indian, Asian (specified/unspecified), Cambodian, Chinese,Eskimo, Filipino, Guamanian, Hawaiian, Japanese, Korean, Laotian, Other Pacific Islander,

8/6/2019 California County Health Status Profiles 2004
http://slidepdf.com/reader/full/california-county-health-status-profiles-2004 74/85
California Department of Health Services County Health Status Profiles 200467
Samoan, Thai, and Vietnamese. The Asian/Other race/ethnic group is also non-Hispanic.This composition is somewhat different from the Asian/Pacific Islander category specifiedby United States Public Health Services (USPHS) in Healthy People 2010, primarilybecause of inclusion of Aleut, American Indian, and Eskimo groups. The Hispanic ethnicgroup includes any race, but is made up primarily of the White race.
Effective with the 2000 data year, this state began collecting up to three races on birth and
death certificates. In order to permit use of the 2000 and 2001 Cohort file along withanalysis of race from earlier files, the mother’s first listed race was used. This is consistentwith methodology used by the National Center for Health Statistics for “bridging” betweenmultiple and single race categories. First listed race is also used in some other Center for Health Statistics reports.
Natality (Tables 21-23B): The natality data were obtained from the Birth Statistical Master Files from 2000 through 2002. Records with unknown birthweight were excluded from thetotal number of live births shown in Table 21. Also, records with unknown prenatal carewere excluded from the total number of live births shown in Table 23A, and records withunknown adequacy of prenatal care were excluded from the total number of live births
shown in Table 23B.
Low birthweight has been associated with negative birth outcomes, and as an indicator of access problems and/or need for prenatal care services. Prevalence of low birthweight isdefined as the percentage of live births weighing less than 2,500 grams (approximately5.5 pounds). Birth rates to adolescents are also an indicator for other high-risk pregnancyfactors. It is defined as the number of births to mothers 15-19 years of age per 1,000female population 15-19 years of age.
The prenatal care indicator, Month Prenatal Care Began, has been associated with accessto care. Late prenatal care is defined as the percentage of mothers who did not begin
prenatal care in the first trimester. However, the percentage of births in which the mother'sprenatal care began in the first trimester, as a health indicator, does not readily permit anunambiguous interpretation. According to some researchers, it fails to document whether or not prenatal care actually continues for the course of the pregnancy. Therefore, inaddition to Prenatal Care Not Begun First Trimester of Pregnancy, this Profiles includesadequacy of prenatal care based on the Adequacy of Prenatal Care Utilization Index.
In "Profiles" reports published in 1995 through 1998, the Kessner Index was used tomeasure the adequacy of prenatal care. The Kessner Index was replaced in the 1999report by the Adequacy of Prenatal Care Utilization Index, which is the methodologyspecified in "Healthy People 2010 Objectives." The Adequacy of Prenatal Care Utilization
Index developed by Milton Kottlechuck attempts to characterize prenatal care utilization ontwo independent and distinctive dimensions: Adequacy of Initiation of Prenatal Care and
Adequacy of Received Services (once prenatal care has begun). The initial dimension, Adequacy of Initiation of Prenatal Care, characterizes the adequacy of the timing of initiation of care (month prenatal care began). The second dimension, Adequacy of Received Services, characterizes the adequacy of prenatal care visits (number of visits)received during the time the mother was actually in prenatal care (from initiation until thedelivery). The adequacy of prenatal visits is based on the recommendations established bythe American College of Obstetricians and Gynecologists. These two

8/6/2019 California County Health Status Profiles 2004
http://slidepdf.com/reader/full/california-county-health-status-profiles-2004 75/85
California Department of Health Services County Health Status Profiles 200468
dimensions are then combined into a single summary prenatal care utilization index, whichcontains the following five categories for adequacy of prenatal care:
(1) Adequate Plus: Prenatal care begun by the fourth month and 110 percent or moreof the recommended visits received.
(2) Adequate: Prenatal care begun by the fourth month and 80 to 109 percent of therecommended visits received.
(3) Intermediate: Prenatal care begun by the fourth month and 50 to 79 percent of therecommended visits received.
(4) Inadequate: Prenatal care begun after the fourth month or less than 50 percent of the recommended visits received.
(5) Missing Information: Unknown adequacy of prenatal care.
Only “adequate and adequate plus” prenatal care are used in Table 23B to measure theadequacy of prenatal care utilization. Also, please note the two-factor index does notassess the quality of the prenatal care that was delivered, but simply its utilization. For further information on the Adequacy of Prenatal Care Utilization Index, see the "AmericanJournal of Public Health" article by Kottlechuck listed in the bibliography.
Breastfeeding Initiation During Early Postpartum (Table 24): Extensive research,especially in recent years, demonstrates the diverse and compelling advantages to infants,mothers, families, and society from breastfeeding and the use of human milk for infantfeeding. Breastfeeding provides advantages with regard to the general health, growth, anddevelopment of infants, while significantly decreasing their risk for a large number of acuteand chronic diseases. There are also a number of studies that indicate possible healthbenefits for mothers such as less postpartum bleeding, rapid uterine involution, andreduced risk of ovarian cancer and post-menopausal breast cancer. In addition toindividual health benefits, breastfeeding provides significant social and economic benefitsto the nation, including reduced health care costs and reduced employee absenteeism for
care attributable to child illness.
The breastfeeding initiation data presented in this report were obtained from the GeneticDisease Branch, Newborn Screening Program. The Newborn Screening Program collectsfeeding data from all mothers who gave birth in a California hospital, usually within 24 hoursof birth.
Data on births that occurred outside of California, at home, or in-transit were not collectedthrough this Program and are not represented in Table 24. These births, however,accounted for less than 1.0 percent of the total resident live births in California.
The feeding data captured by the Newborn Screening Program were compiled into thefollowing four categories:
(1) Breastfed: Exclusively breastfed.(2) Combination: Both breastfed and formula fed.(3) Non-Breastfed: Formula fed and other (e.g., line fed).(4) Unknown: Feeding choice unknown at the time of hospital discharge.
The breastfeeding initiation data presented in Table 24 are a composite of both “breastfed”and “combination” fed births. Records that were of “unknown” feeding type were excludedfrom the analyses.

8/6/2019 California County Health Status Profiles 2004
http://slidepdf.com/reader/full/california-county-health-status-profiles-2004 76/85
California Department of Health Services County Health Status Profiles 200469
The infant feeding data collected on the Newborn Screening form reflect the intentions of the mother at that time, and no follow-up survey is conducted to validate the accuracy of the information after the mother is discharged from the hospital. Caution should also betaken when analyzing breastfeeding initiation data alone because breastfeeding duration isnot taken into consideration. Examination of breastfeeding initiation data along withduration data is recommended to thoroughly measure the effects of breastfeeding. Sinceappropriate data are not currently available, breastfeeding duration data are not presented
in this report.
Childhood Poverty (Table 25): Children under the age of 18 living in families at or belowthe poverty level define the category of the population under 18 below poverty. Thepercent of children under 18 in this category is an indicator of global risk factors that haveimplications for the accessibility to health services.
CRUDE RATES AND AGE-ADJUSTED RATES
The numerator data used to compute rates and percentages were three-year averagescompiled by county of residence of the decedent for the mortality tables; county of
residence of the mother for birth data (including linked birth-death data for infant mortality);and county of occurrence for morbidity data, except for AIDS, which was compiled bycounty of residence. Three-year averages tend to reduce the year-to-year fluctuations andincrease the stability of estimates of vital events compared with data from single years.
The non-standardized rate (or "crude rate") is calculated in dividing the total number of vitalevents (e.g., deaths) by the total population at risk, then multiplying by some convenientbase (e.g., 100,000). Subpopulations (such as counties) with varying age compositionscan have highly disparate death rates, since the risk of dying is primarily a function of age.Therefore, counties with a large component of elderly tend to have a high death rate. Anyunwanted effect of different age compositions among counties can be removed from the
county death rates by the process of "age-adjustment." By removing the effect of differentage compositions, counties with age-adjusted rates are directly comparable with theHealthy People 2010 National Objectives.
Age-adjusted death rates are hypothetical rates obtained by calculating age-specific ratesfor each county and multiplying these rates by proportions of the same age categories ina "standard population," then summing the apportioned specific rates to a county total. The"standard population" used in the age-adjusted death rates in this report is the 2000 UnitedStates (U.S.) Standard Population. The age-adjusted rates put all counties on the samefooting with respect to the effect of age and permit direct comparisons among counties. Itis important to understand that age-adjusted death rates should be viewed as constructs or
index numbers rather than as actual measures of the risk of mortality. Crude death rates,which include the effect of age, are the rates that should be applied when measuring theactual risk of dying in a specific population. For further information onage-adjusted rates, see the National Center for Health Statistics (NCHS) report by Curtinand Klein on "Direct Standardization," listed in the bibliography.
National objectives established for "Healthy People 2010" use the 2000 U.S. population for age adjusting rates. Therefore, the 2000 U.S. population was used as the "standardpopulation" beginning with the 2001 "Profiles" report. The use of an agreed upon standardpopulation permits direct comparison with both national data and the Healthy People 2010Objectives.

8/6/2019 California County Health Status Profiles 2004
http://slidepdf.com/reader/full/california-county-health-status-profiles-2004 77/85
California Department of Health Services County Health Status Profiles 200470
Readers are cautioned that age-adjusted rates in "Profiles" reports from 1993 through 2000used the 1940 Standard Population and cannot be compared with theage-adjusted rates in "Profiles" reports from 2001 forward. For example, the age-adjusteddeath rate from all causes averaged over the three-year period, 2000 through 2002, usingthe 2000 Standard Population for California was 745.0. If one were to use the 1940Standard Population to create the same age-adjusted rate, the result is 390.3. See
Appendix A, at the end of these Technical Notes, for county specific comparisons of the
age-adjusted death rate averaged over the same period using the 1940 and 2000 StandardPopulations.
Data for the morbidity tables were not age-adjusted due to the unavailability of themorbidity data by age. Hence, only crude rates were calculated. Although age and agingdo affect morbidity, the effect is not as prominent as its effect on mortality.
Birth cohort infant death rates are not age-adjusted. Since the deaths are linked to thebirths on a record-by-record basis, these rates are based on a numerator (deaths) and adenominator (births) from the same record. Age adjusting is not applicable to these data.Comparisons among counties reflect the actual risk of dying within the one year of birth in
the cohort of births, and at the same time, are unaffected by confounding of different agecompositions because the cohorts are all of the same age (under one year).
RELIABILITY OF RATES
All vital statistics rates, including morbidity rates, are subject to random variation. Thisvariation is inversely related to the number of events (e.g., death) used to calculate therate. Small frequency in the occurrence of an event results in the greater the likelihood thatrandom fluctuations will be found within a specified time period. Rare events are relativelyless stable in their occurrence from observation to observation. Even present daystatewide crude death rates may be interpreted as "rare" events occurring on the average
of less than one death in 152 persons in the course of a year. (See Table 1: Deaths Dueto All Causes, which shows 656.9 deaths per 100,000 population statewide.)
As a consequence, counties with only a few deaths, or a few cases of morbidity, can havehighly unstable rates from year to year. The observation and enumeration of rare events isbeset with uncertainty. The observation of no vital events is especially hazardous,regardless of the size of the population. This report reduces some year-to-year fluctuationin the occurrence of rare events by basing some rates on three-year average number of vital events (e.g., 2000-2002), divided by the population in the middle year (e.g. 2001). The"standard error" of a death rate and "coefficient of variation" (or relative standard error)provide a rational basis for determining which rates may be considered “unreliable.”
Although reliability of a rate is not either-or/on-off, in this report, counties with a relativestandard error of greater than or equal to 23 percent of the rate or percent are marked withan asterisk (*). This criterion conforms to the standard used by the National Center for Health Statistics in determining the reliability cut-off for rates and percents. In addition,rates of zero, based on no events, are denoted with a plus sign (+), because the standarderror cannot be calculated and is indeterminate. Furthermore, whenever the standard error is indeterminate, the confidence limits are not calculated, and a dash (-) denotes theseconfidence limits.

8/6/2019 California County Health Status Profiles 2004
http://slidepdf.com/reader/full/california-county-health-status-profiles-2004 78/85
California Department of Health Services County Health Status Profiles 200471
The 95 percent confidence limits depict the region within which (if data similar to thepresent set were independently acquired on 100 separate occasions) the rate wouldprobably occur in 95 of those sets of data. In 5 of those 100 data sets, the rate or percentwould fall outside the limits.
Finally, for appropriate statistical methodologies in comparing independent rates or percentages, please see the NCHS reports listed in the bibliography by Curtin and Klein on
“Direct Standardization” and by Kleinman on “Infant Mortality.”
RANKING OF COUNTIES
Data on each health indicator, except adequacy of prenatal care (Table 23B) and incidenceof breastfeeding (Table 24), are displayed with the counties in rank order by increasingrates or percentages (calculated to 15 decimal places); lower rates or percentages are near the top of the table and higher rates or percentages are near the bottom of the table. Datafor adequacy of prenatal care and incidence of breastfeeding are displayed with thecounties in rank order by decreasing percentages (calculated to 15 decimal places); higher percentages are near the top of the table and lower percentages are near the bottom of the
table. For all health indicators, counties with identical rates or percentages are ranked bysize of population, with larger counties ahead of smaller counties.

8/6/2019 California County Health Status Profiles 2004
http://slidepdf.com/reader/full/california-county-health-status-profiles-2004 79/85
FORMULAS USED IN THIS REPORT
BNpop
DCDR
n
BNpop
DW ADR
a
ana
BNpop
D ASDR
a
an
D
CDRSE
nx
SE
W ASDR
Dy
a
n a
2
RSESE
CDR100x
x
RSESE
ADR100y
y
Lower 95% CL = ADR – (1.96 x SEy) Upper 95% CL = ADR + (1.96 x SEy)
Where: CDR = Crude Death Rate ADR = Age-Adjusted Death Rate ASDR = Age-Specific Death Rate
nD = Number of DeathsNpop = Population Size
nDa = Number of Deaths in an Age Group
Npopa = Population Size in Same Age Group
B = Base (100,000)Wa = Age-Specific Weight (Standard Population Proportion)
SEx = Standard Error of a Crude Death Rate
RSEx = Relative Standard Error of a Crude Death Rate
SEy = Standard Error of an Age-Adjusted Death Rate
RSEy = Relative Standard Error of an Age-Adjusted Death RateCL = Confidence Limit
California Department of Health Services County Health Status Profiles 200472

8/6/2019 California County Health Status Profiles 2004
http://slidepdf.com/reader/full/california-county-health-status-profiles-2004 80/85
California Department of Health Services County Health Status Profiles 200473
PROCEDURE FOR CALCULATING AGE-ADJUSTED RATES BY THEDIRECT METHOD
Age-adjusted rates calculated in this report follow the procedure that was used to set theYear 2010 National Objectives. The standard population was the year 2000 United Statespopulation. The data below were taken from Table 1: Deaths Due to All Causes,
2000-2002 for Alameda County.
ALAMEDA COUNTY
2000 U.S.
2000-2002 STANDARD WEIGHTED
AGE DEATHS 2001 AGE-SPECIFIC MILLION RATE
GROUPS (AVERAGE) POPULATION RATE/100,000 PROPORTIONS FACTORS
(A) (B) (C) (D) (E)
TOTAL 9,710.7 1,492,004 650.8
Unknown 3.3
<1 109.0 21,344 510.7 0.013818 7.1
1-4 16.7 87,901 19.0 0.055317 1.0
5-14 30.3 224,310 13.5 0.145565 2.0
15-24 119.0 187,287 63.5 0.138646 8.8
25-34 186.0 206,060 90.3 0.135573 12.2
35-44 407.3 257,254 158.3 0.162613 25.7
45-54 799.0 223,254 357.9 0.134834 48.3
55-64 1,041.3 129,700 802.9 0.087247 70.0
65-74 1,556.3 79,850 1,949.1 0.066037 128.7
75-84 2,772.7 54,911 5,049.4 0.044842 226.4>84 2,669.7 20,133 13,260.2 0.015508 205.6
AGE-ADJUSTED RATE------------------------------------------------------ 735.9

8/6/2019 California County Health Status Profiles 2004
http://slidepdf.com/reader/full/california-county-health-status-profiles-2004 81/85
California Department of Health Services County Health Status Profiles 200474
STEP 1: Array the data of three-year average number of deaths and population for 11 agegroups in columns A and B.
STEP 2: Calculate age-specific rates by dividing the number of deaths in column A(numerator) by the population in column B (denominator). Multiply the result(quotient) by the base of 100,000 to obtain the rates in column C.
STEP 3: Multiply each age-specific rate in column C by the corresponding 2000U.S. Standard Million proportion in column D and enter the result in column E.
STEP 4: The values for each age group in column E are summed to obtain the Age-Adjusted Death Rate for Alameda County of 762.6 per 100,000 population.
STEP 5: Repeat Steps 1 through 4 for each county and the statewide total. Note that the2000 U.S. Standard Million proportions remain the same for each county and thestate.
STEP 6: Direct comparisons can now be made among the counties, with the removal of the effect that varying county age compositions may have on death rates.

8/6/2019 California County Health Status Profiles 2004
http://slidepdf.com/reader/full/california-county-health-status-profiles-2004 82/85
APPENDIX A
AGE-ADJUSTEDCOUNTY
CALIFORNIA 35,233,335 231,439.0 656.9 745.0 390.3
ALAMEDA 1,492,004 9,710.7 650.8 735.9 384.
ALPINE 1,268 5.7 446.9 * 507.3 * 269.5 *
AMADOR 35,242 380.7 1,080.2 726.9 405
BUTTE 213,040 2,209.0 1,036.9 764.9 432.0
CALAVERAS 43,392 390.3 899.6 664.5 384.4
COLUSA 22,012 141.3 642.1 628.0 352.3
CONTRA COSTA 942,662 6,843.7 726.0 746.4 376.6
DEL NORTE 31,801 264.0 830.2 751.2 455.4
EL DORADO 168,912 1,151.0 681.4 685.9 354.7
FRESNO 825,365 5,575.7 675.5 799.3 438.0
GLENN 30,291 237.0 782.4 743.9 424.6
HUMBOLDT 129,211 1,236.7 957.1 938.1 524.9
IMPERIAL 161,177 860.7 534.0 655.3 382.1
INYO 18,510 206.7 1,116.5 764.0 419.7
KERN 694,749 4,863.0 700.0 822.3 466.7
KINGS 129,375 714.0 551.9 802.8 439.1
LAKE 62,080 782.3 1,260.2 849.8 529.2LASSEN 36,759 204.7 556.8 617.6 363.7
LOS ANGELES 9,925,413 59,464.0 599.1 739.5 388.3
MADERA 131,052 898.3 685.5 728.2 413.7
MARIN 249,634 1,850.7 741.4 705.6 341.2
MARIPOSA 17,218 158.7 921.5 644.2 398.0
MENDOCINO 91,963 830.0 902.5 821.6 448.9
MERCED 219,936 1,385.0 629.7 815.6 446.3
MODOC 10,589 96.7 912.9 680.7 386.6
MONO 11,081 49.0 442.2 545.0 312.0
MONTEREY 409,511 2,399.0 585.8 720.3 369.8
NAPA 129,130 1,276.3 988.4 769.1 379.8
NEVADA 99,670 917.0 920.0 649.4 341.6
ORANGE 2,872,632 16,679.3 580.6 757.2 356.2
PLACER 252,688 2,006.0 793.9 814.2 401.5
PLUMAS 21,044 203.3 966.2 666.9 384.0
RIVERSIDE 1,626,134 12,543.3 771.4 757.9 421.2SACRAMENTO 1,236,054 9,314.0 753.5 841.0 451.5
SAN BENITO 53,577 269.3 502.7 581.8 306.2
SAN BERNARDINO 1,771,707 11,369.0 641.7 885.4 482.4
SAN DIEGO 3,005,038 19,616.0 652.8 739.9 385.6
SAN FRANCISCO 794,342 6,412.7 807.3 658.4 367.2
SAN JOAQUIN 593,538 4,420.7 744.8 798.3 454.8
SAN LUIS OBISPO 262,123 2,009.3 766.6 664.3 348.1
SAN MATEO 759,313 4,716.0 621.1 610.2 299.8
SANTA BARBARA 417,331 2,917.0 699.0 696.4 349.1
SANTA CLARA 1,795,132 8,736.3 486.7 636.8 301.0
SANTA CRUZ 264,525 1,666.3 629.9 659.5 334.5
SHASTA 179,892 1,782.0 990.6 870.2 469.8
SIERRA 3,465 36.3 1,048.6 680.1 389.2
SISKIYOU 45,624 496.3 1,087.9 832.1 453.9
SOLANO 408,095 2,563.3 628.1 841.6 433.7
SONOMA 468,682 3,857.0 822.9 754.8 383.3
STANISLAUS 472,096 3,568.3 755.8 859.9 470.9
SUTTER 83,999 698.3 831.4 793.2 440.4
TEHAMA 57,642 616.0 1,068.7 826.6 469.9
TRINITY 13,605 141.7 1,041.3 823.6 491.8
TULARE 388,730 2,676.0 688.4 807.1 454.6
TUOLUMNE 57,497 597.3 1,038.9 785.3 435.3
VENTURA 763,586 4,775.0 625.3 736.8 361.7
YOLO 167,259 1,125.3 672.8 811.1 428.6
YUBA 64,938 525.7 809.5 968.9 577.0
DEATH RATE
* Death rate unreliable (relative standard error is greater than or equal to 23 percent).
POPULATION (AVERAGE) DEATH RATE DEATH RATE2001 DEATHS CRUDE AGE-ADJUSTED
COMPARISON OF 1940 AND 2000 STANDARD POPULATION AGE-ADJUSTED RATES
DEATHS DUE TO ALL CAUSES
CALIFORNIA COUNTIES, 2000-2002
2000-2002 YEAR 2000 YEAR 1940
California Department of Health Services County Health Status Profiles 200475

8/6/2019 California County Health Status Profiles 2004
http://slidepdf.com/reader/full/california-county-health-status-profiles-2004 83/85
California Department of Health Services County Health Status Profiles 200476
BIBLIOGRAPHY
American Academy of Pediatrics. Breastfeeding and the Use of Human Milk (RE9729).Pediatrics, Vol. 100, No. 6, December 1997: pp. 1035-1039.
Armitage P, Berry G. Statistical Methods in Medical Research, second edition. Boston:Blackwell Scientific Publication, 1987.
Curtin LR, Klein RJ. Direct Standardization (Age-Adjusted Death Rates), Healthy People2000 Statistical Notes. National Center for Health Statistics, DHHS Pub. No. (PHS)95-1237, March 1995; No. 6-Revised.
Fleiss JL. Statistical Methods for Rates and Proportions, second edition. New York: JohnWiley and Sons, 1981.
Foster JE. Using Natality Data in Health Planning. Statistical Notes for Health Planners.National Center for Health Statistics, DHHS Pub. No. (PHS) 81-1237, November 1980;No. 12.
Freedman MA. Health Status Indicators for the Year 2000. Healthy People 2000Statistical Notes. National Center for Health Statistics, DHHS Pub. No. (PHS) 92-1237, Fall1991; Vol. 1, No. 1.
Institute for Medicine. The Future of Public Health. Washington, D.C.: National Academy of Science Press, 1988; pp. 13-15.
Klein RJ, Schoenborn, CA. Healthy People 2010 Statistical Notes: Age Adjustment Using the 2000 Projected U.S. Population. National Center for Health Statistics, DHHSPublication, Number 20, January 2001.
Kleinman JC. Mortality. Statistical Notes for Health Planners. National Center for HealthStatistics, DHHS Pub. No. (HRA) 77-1237, February 1977; No. 3.
Kottlechuck M. An Evaluation of the Kessner Adequacy of Prenatal Care Index and aProposed Adequacy of Prenatal Care Utilization Index. American Journal of Public Health,Vol. 84, No. 9, September 1994: pp. 1414-1420.
Lilienfeld AM, Lilienfeld DE. Foundations of Epidemiology, second edition. New York:Oxford University Press, 1980.
Tashiro M. A Description of the California Birth Cohort Perinatal File. Data Matters #83-11078. Center for Health Statistics, California Department of Health Services,
February 1984.
U. S. Department of Health and Human Services. Healthy People 2000: National HealthPromotion and Disease Prevention Objectives for the Nation. Washington, D.C.: PublicHealth Service, DHHS Pub. No. (PHS) 91-50212, 1991.
U. S. Department of Health and Human Services. Healthy People 2010 Objectives(Conference Edition, in Two Volumes). Washington, D.C., January 2000.
World Health Organization. Manual of the International Classification of Diseases,Injuries, and Causes of Death, tenth revision. Geneva: World Health Organization, 1992.

8/6/2019 California County Health Status Profiles 2004
http://slidepdf.com/reader/full/california-county-health-status-profiles-2004 84/85
TO ORDER ADDITIONAL COPIES OF COUNTY HEALTH STATUS PROFILES
Additional Copies, at $10.00 per copy, of the 2004 report may be ordered from:
California Department of Health ServicesCenter for Health Statistics
1616 Capitol Avenue
MS 5103P. O. Box 997410
Sacramento, CA 95899-7410Telephone (916) 552-8095
FAX (916) 650-6889
Make checks payable to: Department of Health Services. Prior year reports from 1993 through 2003may also be ordered, as long as the supply lasts. Please call or contact the Center for Health Statisticsbefore placing an order for back issues to determine availability.
Number of Copies Total Remittance
______ 2004 County Health Status Profiles @ $10.00/copy: $ _____ . _____
______ 2003 County Health Status Profiles @ $10.00/copy: $ _____ . _____
______ 2002 County Health Status Profiles @ $10.00/copy: $ _____ . _____
______ 2001 County Health Status Profiles @ $10.00/copy: $ _____ . _____
______ 2000 County Health Status Profiles @ $10.00/copy: $ _____ . _____
______ 1999 County Health Status Profiles @ $10.00/copy: $ _____ . _____
______ 1998 County Health Status Profiles @ $10.00/copy: $ _____ . _____
______ 1997 County Health Status Profiles @ $10.00/copy: $ _____ . _____
______ 1996 County Health Status Profiles @ $10.00/copy: $ _____ . _____
______ 1995 County Health Status Profiles @ $10.00/copy: $ _____ . _____
______ 1994 County Health Status Profiles @ $10.00/copy: $ _____ . _____
______ 1993 County Health Status Profiles @ $10.00/copy: $ _____ . _____
Total: $ _____ . _____
Name: ______________________________________________________________
Organization: ________________________________________________________
Address: ____________________________________________________________
P. O. Box: ___________________________________________________________
City, State & Zip: _____________________________________________________
Telephone: (_____) ______ - _________
California Department of Health Services County Health Status Profiles 200477

8/6/2019 California County Health Status Profiles 2004
http://slidepdf.com/reader/full/california-county-health-status-profiles-2004 85/85
NOTES (blank page)