Embed Size (px)
Citation preview

PUBLIC HEARING
MAY 2, 2016
Caldwell-West Caldwell School District
2016-17 School Budget

Agenda for Public Hearing
The Objectives and Context of the 2016-17 Budget
What is contained in the 2016-17 Budget
Highlights of the 2016-17 Budget
Sources of Funding
Expenditures by Type
Impact on the Local Taxpayer
Some Interesting Facts
Cost Containment & Revenue Generation
Impact on the Students

Objectives
To apprise parents and members of the public of developments concerning the 2016-17 School Year Budget
To provide an opportunity for parents and community members to ask questions and give feedback about the proposed budget

Context: Budgetary Goals
Maintain quality programs and appropriate staffing levels
Meet state and federal requirements, while exercising due diligence in the expenditure of public funds
Continue facilities maintenance and improvements
Provide students and staff with educationally appropriate technology

Context: Budget Considerations
Maintain existing programs at current level of service Continue updating curricula to comply with the Common
Core Standards Anticipate out-of district special education placements Anticipate fixed cost increases Continue state initiative for evaluation & staff training Anticipate additional costs associated with PARCC
testing Maintain basic facility upkeep and repairs, including
health/safety maintenance, security, alarms, etc. Continue shared services and other revenue generation
and cost containment initiatives

Context: Funding the Operating Budget
Current NJ School Funding Law
o Tax levy increase limited to 2%
o Limited adjustments to cap spending (banked cap, enrollment growth, health insurance and certain small pension-related increases)
School District Funding 2016-17
o 2015-16 operating budget= $42,362,398
o 2015-16 operating budget tax levy = $40,210,804
o 2% of 2015-16 tax levy = $804,216
o Banked cap & waivers available = $626,312
o Maximum allowable tax levy increase = $1,430,528 0r 3.56%
o 2016-17 operating budget tax levy increase = $1,407,384 or 3.50%
o $23,144 of unused banked cap expires in 2016-17
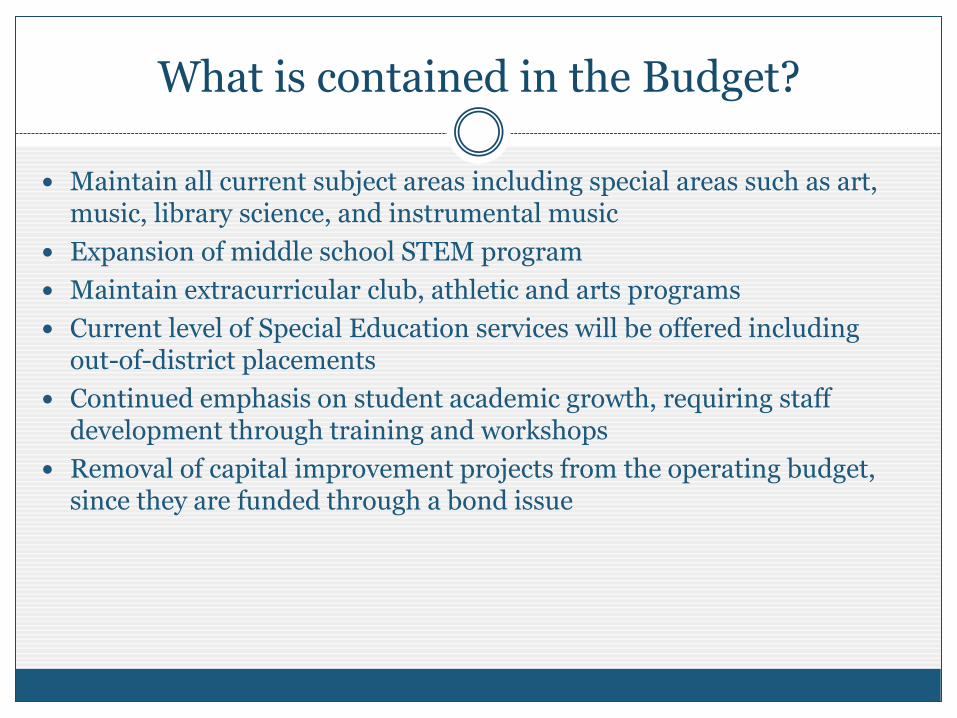
What is contained in the Budget?
Maintain all current subject areas including special areas such as art, music, library science, and instrumental music
Expansion of middle school STEM program
Maintain extracurricular club, athletic and arts programs
Current level of Special Education services will be offered including out-of-district placements
Continued emphasis on student academic growth, requiring staff development through training and workshops
Removal of capital improvement projects from the operating budget, since they are funded through a bond issue

Sources of Funding
Revenue Description 2015-16 2016-17 $ Change % Change
Local Tax Levy 40,210,804 41,618,188 1,407,384 3.50%
Budgeted Fund Balance 451,178 300,000 (151,178) (33.51%)
State Aid 1,213,340 1,424,261 210,921 17.38%
Miscellaneous Revenue* 161,971 167,505 5,534 3.42%
Total Withdrawals From Cap Reserve 0 0 0
Medicaid Reimbursement 20,129 24,154 4,025 20.00%
Prior Year Encumbrances 304,976 0 (304,976) (100.00%)
Total Operating Budget 42,362,398 43,534,108 1,171,710 2.77%
Grants and Entitlements 1,364,781 899,977 (464,804) (34.06%)
Debt Service Tax Levy 1,365,293 1,942,691 577,398 42.29%
State Debt Service Aid 398,424 865,538 467,114 117.24%
Debt Service Fund Balance, Interest 71,907 19,950 (51,957) (72.26%)
Total Repayment of Debt 1,835,624 2,828,179 992,555 54.07%
TOTAL REVENUE/SOURCES 45,562,803 47,262,264 1,699,461 3.73%
* Tuition, rental of facility, athletics, play, dance receipts, bank interest, misc.

Sources of Funding
Sources of Revenue
Local Tax Levy 92.94%
Total State Aid 4.90%
Grants 1.91% Other
0.25%

Expenditures by Type The 2016-17 school budget is comprised of the following categories:
Expenditures Budget
Description 2015-2016 2016-2017 $ Change % Change % of Total
Regular Instruction 1 12,749,152 13,062,427 313,275 2.5% 27.7%
Benefits 7,105,917 7,501,716 395,799 5.6% 15.9%
Special Ed Instruction & Related 2 5,552,924 5,642,541 89,617 1.6% 11.9%
Out-of-District Tuition & Services 3,711,682 4,288,644 576,962 15.5% 9.1%
Facilities / Maintenance / Custodial 4,302,966 4,178,326 (124,640) -2.9% 8.8%
Administration 3 2,958,926 2,949,201 (9,725) -0.3% 6.2%
Debt Service 1,835,624 2,808,179 972,555 53.0% 5.9%
Support Services4 1,993,345 1,871,540 (121,805) -6.1% 4.0%
Transportation 1,447,283 1,608,562 161,279 11.1% 3.4%
Co-Curricular / Athletics 1,153,642 1,159,586 5,944 0.5% 2.5%
Special Revenue / Grants 1,364,781 899,977 (158,827) -34.1% 1.9%
Technology 5 726,967 775,130 48,163 6.6% 1.6%
Curriculum / Staff Development 395,934 399,006 3,072 0.8% 0.8%
Rec / Continuing Ed / Use of Facilities 76,725 76,725 0 0.0% 0.2%
Capital Outlay 196,936 5,677 (191,259) (97.1%) 0.0%
1 – includes Instructional Technology 3 – School Admin, General Admin, Business Office
2 – Special Ed, Basic, ESL, Speech, PT, OT, CST 4 – Library, Guidance, Nursing, Attendance
5 – Technology Infrastructure, Software & Support

Expenditures by Type
2016-17 Operating Budget
Salaries 54%
Benefits 17%
Out-of-District Tuition & Services
11%
Facilities 5%
Transportation 2%
Everything Else 10%
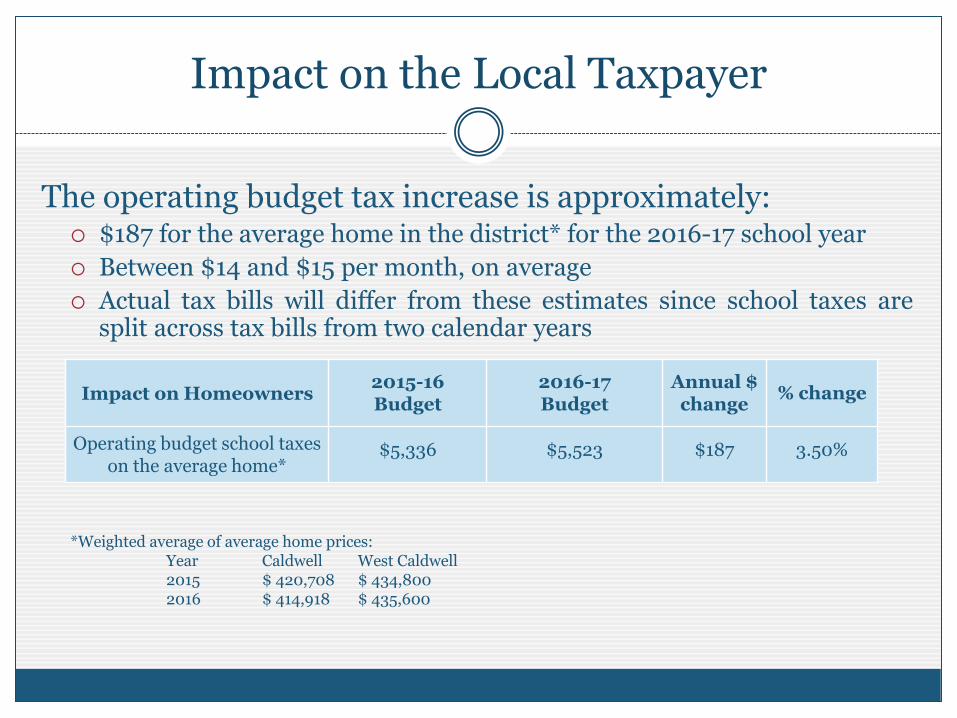
Impact on the Local Taxpayer
Impact on Homeowners
2015-16 Budget
2016-17 Budget
Annual $ change
% change
Operating budget school taxes on the average home*
$5,336
$5,523
$187
3.50%
The operating budget tax increase is approximately: $187 for the average home in the district* for the 2016-17 school year
Between $14 and $15 per month, on average
Actual tax bills will differ from these estimates since school taxes are split across tax bills from two calendar years
*Weighted average of average home prices: Year Caldwell West Caldwell 2015 $ 420,708 $ 434,800 2016 $ 414,918 $ 435,600

Some Interesting Facts: Tax Levy Growth Rate
• The compounded annual growth rate of the tax levy averages a modest 2.02%* from 2010-11 to 2016-17
• Recent increases due to banked cap were to “catch up” from cuts of previous years
* Formula: $ 36,921,252 in 2010-11 x (1.0202)6 ≈ $ 41,618,188
Operating Budget Tax Levy
Year $ Amount $ Change
2010-11 36,921,252
2011-12 36,939,862 18,610
2012-13 36,712,440 (227,422)
2013-14 37,446,765 734,325
2014-15 38,851,019 1,404,254
2015-16 40,210,804 1,359,785
2016-17 41,618,188 1,407,384
Cumulative Change: $ 4,696,936

Some Interesting Facts: Employee Contributions to Health Benefits
• Compounded annual growth rate of the operating budget has been a modest 2.52%** since 2011-12
• Budgets have been carried by increases in employee contributions to health care from $0 to over $1.2 million annually over the past 6 years
• With health contributions leveling off at an average of 20% of health costs, districts are finding trouble finding “new” revenue
**Formula: $38,996,691 in 11-12 x (1.0223)5 ≈ $43,534,108 in 16-17
Employee Contributions
to Health Benefits
(estimated)* Year $ Contribution
2009-10 0
2010-11 50,000
2011-12 137,500
2012-13 340,378
2013-14 581,393
2014-15 935,687
2015-16 1,211,000
2016-17 1,250,000
Cumulative
Contribution: $ 4,505,958
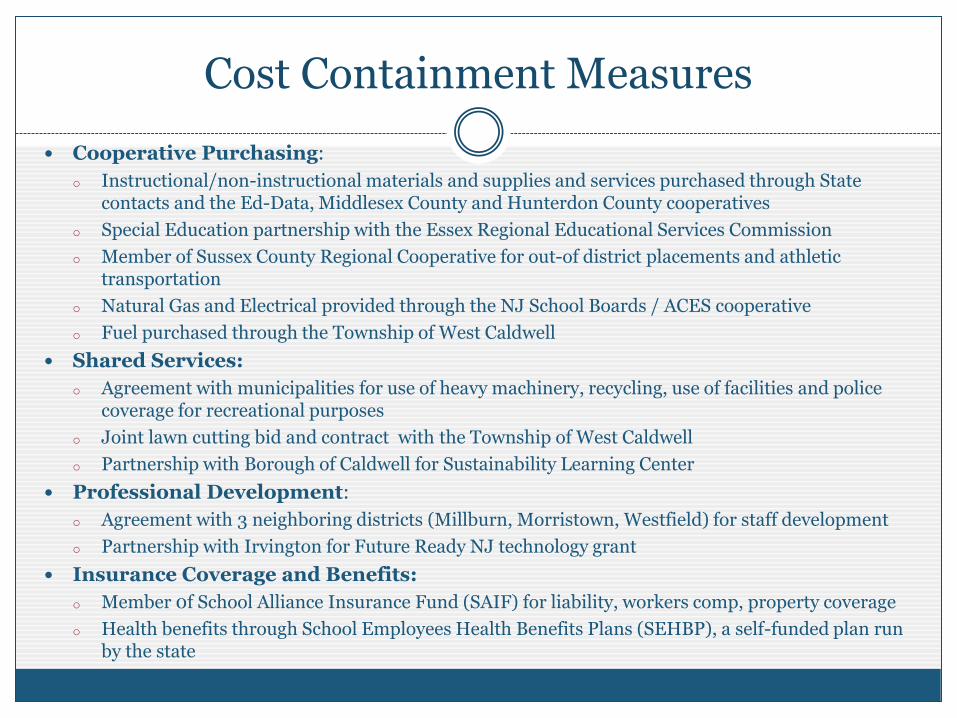
Cost Containment Measures
Cooperative Purchasing:
o Instructional/non-instructional materials and supplies and services purchased through State contacts and the Ed-Data, Middlesex County and Hunterdon County cooperatives
o Special Education partnership with the Essex Regional Educational Services Commission
o Member of Sussex County Regional Cooperative for out-of district placements and athletic transportation
o Natural Gas and Electrical provided through the NJ School Boards / ACES cooperative
o Fuel purchased through the Township of West Caldwell
Shared Services:
o Agreement with municipalities for use of heavy machinery, recycling, use of facilities and police coverage for recreational purposes
o Joint lawn cutting bid and contract with the Township of West Caldwell
o Partnership with Borough of Caldwell for Sustainability Learning Center
Professional Development:
o Agreement with 3 neighboring districts (Millburn, Morristown, Westfield) for staff development
o Partnership with Irvington for Future Ready NJ technology grant
Insurance Coverage and Benefits:
o Member 0f School Alliance Insurance Fund (SAIF) for liability, workers comp, property coverage
o Health benefits through School Employees Health Benefits Plans (SEHBP), a self-funded plan run by the state

Revenue Generation Initiatives
Website Advertising o Have received advertising revenue on the district’s website for several years
Bank Interest o Changing banks increased interest from zero to 0.30% on most accounts, and 0.50% on bond
referendum funds
o Total interest between $40,000 and $50,000 in 2015-16
Field Advertising o Upon culmination of field renovations, will solicit donations for displaying signage at Bonnel Field
Demand Response o About $12,000 in revenue from EnerNOC, a demand response firm, for sharing our electrical
utilities capacity in cases of emergency, and for several hours one day each August for testing

Revenue Generation Initiatives: Competitive Grants
State/Federal Grants Description $ Amount
Achievement Coaches Professional development $40,500
Improvement in Instructional
Services Professional development $114,306
Elementary & Secondary School
Counselors On-site counselors in conjunction with The Bridge $253,000
Sustainable Jersey Joint effort with Borough of Caldwell to create a
Sustainable Learning Center $10,000+
Future Ready New Jersey Partnership with Irvington BOE for technology professional
development & devices $93,000
Safe Routes to School (applying) Refurbish sidewalks Several hundred
thousand
Various corporate/foundation grants
(BASF, Novartis, Special Olympics,
others )
Mainly middle school and high school science &
technology Tens of thousands
Local Grants Description $ Amount
CWC Education Foundation Various supplies, equipment and programs, particularly
chromebooks for GCMS $100,000+
CWC Home School Associations Various supplies, equipment and programs Tens of thousands
Kiwanis / Rotary Steelcase desks / GCMS STEM Tens of thousands
Booster Clubs Support of athletics and music programs Thousands
Various individuals Science, theater, music, extracurricular, etc. Thousands

Some Interesting Facts: Comparative Spending Snapshot
Taxpayers' Guide to Education Spending 2016 Budgetary Cost Per Pupil
District 2011-12 2012-13 2013-14 2014-15 2015-16 County Rank
(Low to High)
Belleville $11,336 $19,107 $10,868 $11,218 $11,540 1
Bloomfield $11,848 $12,321 $12,803 $12,802 $13,108 2
Verona $12,272 $12,527 $13,084 $13,043 $13,131 3
Nutley $12,389 $12,909 $13,479 $13,980 $13,702 4
Caldwell-West Caldwell $12,988 $13,484 $13,801 $13,868 $14,290 5
Glen Ridge $12,917 $13,177 $13,887 $14,377 $14,583 6
Cedar Grove $13,376 $13,229 $13,713 $14,280 $14,626 7
South Orange-Maplewood $14,344 $14,397 $14,418 $14,432 $14,642 8
Livingston $13,948 $14,464 $14,791 $14,852 $15,282 9
Montclair $14,440 $14,965 $15,298 $15,627 $15,312 10
Millburn $13,857 $14,458 $15,329 $15,439 $15,680 11
Newark $18,231 $17,296 $16,403 $17,318 $15,799 12
Orange $15,442 $16,129 $15,782 $15,962 $15,871 13
Irvington $15,944 $16,273 $16,825 $16,589 $16,270 14
Roseland $13,706 $16,475 $15,176 $16,408 $16,441 15
Fairfield $14,039 $15,093 $15,003 $16,082 $16,646 16
North Caldwell $14,254 $15,262 $16,497 $17,144 $16,922 17
West Orange $15,981 $16,380 $16,660 $17,472 $17,666 18
West Essex $16,730 $16,626 $17,404 $17,945 $18,229 19
Essex Co Vc-Tech $16,817 $16,250 $18,175 $18,023 $18,279 20
East Orange $19,129 $19,740 $17,922 $19,691 $19,609 21
Essex Fells $18,560 $18,874 $19,769 $20,733 $20,662 22
• 5th lowest operating budget per pupil of 22 district in the county
• 2016-17 budget at $14,840
• 2016 State Average: • Over $16,000 for 571
districts • Over $15,000 for 221
K-12 districts

Some Interesting Facts: Comparative Spending Snapshot
Taxpayers' Guide to Education Spending 2016 Administrative Cost Per Pupil
District 2011-12 2012-13 2013-14 2014-15 2015-16 County Rank
(Low to High)
Irvington $1,615 $1,502 $1,431 $1,378 $1,377 1
Montclair $1,251 $1,366 $1,265 $1,441 $1,382 2
Millburn $1,351 $1,400 $1,483 $1,515 $1,499 3
Belleville $1,439 $2,553 $1,358 $1,556 $1,543 4
South Orange-Maplewood $1,465 $1,557 $1,574 $1,557 $1,550 5
Verona $1,512 $1,557 $1,505 $1,601 $1,600 6
Caldwell-West Caldwell $1,565 $1,654 $1,663 $1,624 $1,657 7
Livingston $1,626 $1,627 $1,633 $1,645 $1,644 8
Roseland $1,447 $1,940 $1,649 $1,682 $1,670 9
Bloomfield $1,558 $1,629 $1,736 $1,704 $1,673 10
Nutley $1,512 $1,570 $1,697 $1,727 $1,713 11
Newark $1,757 $1,963 $1,936 $2,052 $1,734 12
East Orange $1,783 $1,848 $1,670 $1,835 $1,803 13
Fairfield $1,566 $1,719 $1,767 $1,862 $1,855 14
West Orange $1,580 $1,665 $1,810 $1,919 $1,876 15
Cedar Grove $1,635 $1,841 $1,956 $2,001 $1,950 16
Orange $1,935 $2,108 $1,978 $2,090 $2,061 17
North Caldwell $1,662 $1,722 $2,033 $2,156 $2,064 18
Essex Fells $1,904 $2,108 $2,035 $2,182 $2,085 19
Glen Ridge $1,788 $1,851 $2,015 $2,096 $2,085 20
West Essex $1,846 $1,861 $2,035 $2,139 $2,086 21
Essex Co Vo-Tech $3,008 $2,750 $2,891 $3,369 $3,151 22
• 7th lowest admin spending per pupil of 22 district in county (8th last year)
• Budgeted to be $1,657 in
2016-17
• If not for an increase in technology infrastructure spending – considered administrative – it would have decreased

Impact on the Students
The Caldwell-West Caldwell school budget is the financial plan to accomplish educational objectives:
Students continue to enjoy learning in a safe, clean, and high performing District
Students benefit from a wide range of extracurricular opportunities in the arts, athletics, and academics
Restructuring of technology department has allowed the District to upgrade and maintain the infrastructure and educational hardware, delivering reliable support
The elementary school music program will continue to foster an appreciation of the fine arts in our district at a young age. After school clubs will continue to be encouraged
We will continue to provide small group instruction for the enrichment program, basic skills program and the special education programs

Looking Beyond 2016-17
Continue to evaluate the allocation of spacing in our buildings
Continue to negotiate stable contracts with bargaining units
Provide ongoing professional development and curriculum development
Ongoing investment in technology infrastructure, devices, training and support
Continue to monitor out-of-district placements, explore more programs to keep children in-district for as long as possible
Continue to implement shared services with the towns and other school districts
Analyze health care claims experience regularly to capture savings, if possible

Thank You!
It is no secret that CWC students receive outstanding and balanced opportunities to do well in our schools-even during a time when school budgets are in the news
The Board of Education has built a budget that speaks to the continuing needs of our students. Thank you for your dedication and service to the children of the community:
Marie Lanfrank, President Thomas Adams, Vice-President
Daniel Cipoletti John King
Chris D’Ambola
Thank you to the district administrators, directors and staff who worked cooperatively to develop this budget plan in alignment with the district’s educational programs.