Embed Size (px)
Citation preview

Cal Hospital Compare Board of Directors
February 10, 2021
10:00am-12:00pm Pacific Time
Webinar link: https://zoom.us/j/4437895416
Phone: 1-669-900-6833
Access code: 443 789 5416
Passcode: cyno#

Cal Hospital Compare
Board of Directors Meeting Agenda Wednesday, February 10, 2021
10:00am – 12:00pm PT
Webinar Information Webinar link: https://zoom.us/j/4437895416
Phone: 1-669-900-6833 Access code: Code: 443 789 5416
Passcode: cyno#
Time Agenda Item Presenters and Documents 10:00-10:05
5 min. Welcome and call to order - Approval of past meeting summary
- Ken Stuart Board Chair
- Bruce Spurlock Executive Director, CHC
10:05-10:20 15 min.
Organizational updates − Q4 website data refresh – complete − Planned hospital COVID-10 study − Reboot Cal Quality Care Website
- Alex Stack Director, CHC
10:20 – 10:35 15 min.
2020 Patient Safety Honor Roll − Used 2019 methodology − 2020 results − Comparing 2019 vs 2020 results
- Mahil Senathirajah Senior Director, IBM Watson Health
10:35 – 10:55 20 min.
2021 Patient Safety Poor Performer Report - Used 2020 methodology - 2021 results - Comparing 2020 to 2021 results
- Mahil Senathirajah Senior Director, IBM Watson Health
10:55– 11:25 30 min.
Cal Hospital Compare Analytics - High level historical trends – maternity measures as
an example - BOD feedback on moving forward
- Mahil Senathirajah Senior Director, IBM Watson Health
11:25-11:40 15 min.
Business plan − Financial report
- Bruce Spurlock Executive Director, CHC
11:40-11:45 5 min.
Wrap-up Adjourn
− Next meeting: Wednesday, April 14, 10:00am - 12:00pm PST (Zoom Call)
- Ken Stuart Board Chair

Proposed Agenda
Welcome & call to order
Organizational updates
2020 Patient Safety Honor Roll
2021 Patient Safety Poor Performer Report
Cal Hospital Compare Analytics
Business plan
Wrap Up
2

Board of Directors
Page 1 of 1 Revised 10/20
Ashrith Amarnath, MD Medical Director Plan Management Covered CA [email protected] Seth Glickman, MD Chief Medical Officer Blue Shield of California [email protected] David Hopkins Senior Advisor Consultant to the Consumer-Purchaser Alliance Pacific Business Group on Health [email protected] Libby Hoy Founder and CEO PFCC Partners [email protected] Robert Imhoff President Hospital Quality Institute [email protected] Christopher Krawczyk, PhD Chief Analytics Officer Healthcare Analytics Branch OSHPD [email protected] Julia Logan, MD Chief Medical Officer CalPERS [email protected] Helen Macfie Vice President, Performance Improvement Memorial Care Hospital [email protected] Joan Maxwell Patient and Family Advisor John Muir Health [email protected]
Bruce Spurlock, MD Executive Director Cal Hospital Compare, Cynosure Health [email protected] Kristof Stremikis Director, Market Analysis and Insight California Health Care Foundation [email protected] Ken Stuart Chair, CHC Board of Directors California Health Care Coalition [email protected] Kevin Worth Executive Director, Risk Mgmt. & Patient Safety Kaiser Permanente Northern California Region [email protected] Other Contributors Tracy Fisk Executive Assistant Cynosure Health [email protected] Parker Lewis Senior Client Servies Manager IBM Watson Health [email protected] Mahil Senathirajah Senior Director IBM Watson Health [email protected] Alex Stack Director, Programs & Strategic Initiatives, Cal Hospital Compare Independent Consultant Cynosure Health [email protected] Frank Yoon Senior Statistician IBM Watson Health [email protected]

Cal Hospital Compare
Board of Directors Meeting Summary Wednesday, December 16, 2020
9:00am – 11:00am PST via Zoom Webinar Attendees: David Hopkins, Libby Hoy, Andy Krackov, Chris Krawczyk, Parker Lewis, Julia Logan, Helen Macfie, Elliott Main, Joan Maxwell, Mahil Senathirajah, Bruce Spurlock, Kristof Stremikis, Ken Stuart, Tracy Fisk Summary of Discussion: Agenda Items Discussion Welcome & call to order
• The meeting formally commenced at 9:03am Pacific Time. • The meeting summary of October 29, 2020 was motioned, seconded, and
approved as submitted. •
Organizational Updates
• Alex Stack welcomed a daughter on November 26th and anticipates returning in mid-January.
• Q4 2020 data refresh is currently in progress. • The SNF-COVID study issue brief was released on December 1st. Bruce is
facilitating a legislative briefing to discuss the data and findings. • A joint press release with CHHS and CHC recognizing the Maternity Care and
Opioid Care Honor Rolls was published today. Results of the Patient Safety Honor Roll will be released in January.
• CMS Hospital Compare data has been suspended for January and April 2021 and is expected to resume in July.
Measure Analyses & Price Transparency
• Mahil provided an overview of the proposed in-depth measure analyses, price transparency and value, and short stay SNF measure analyses. Pricing data is expected to be published on each hospital’s respective website on January 1, 2021.
• David Hopkins suggested reaching out to the health plans to request funding. • Ken Stuart recommended connecting with the CA Association Health Plan. • Libby and Joan voiced potential limitations that could affect the consumer. • Kristof is interested in the value of exploratory work for policy makers. • Helen emphasized the importance of assisting the consumer with navigating
access to the price transparency data. • The health plans expressed an interest in SNF cost utilization. • The Board collectively supported conducting further measure analyses with a
specific customer in mind.
Patient Activation Proposal
• Andy and Alex held additional key stakeholder interviews from a total of 14 organizations.
• Andy reviewed the proposed strategies for this work including marketing partnerships and integrating a widget tool on relevant websites.
• The goal is to pilot this approach by the end of 2021.

• Libby recommended evaluating schedule of patient interviews – where they
are being conducted and encouraged holding both focus groups and interviews. She also suggested expanding partnerships to patient family and community in addition to the payers.
• Elliott recommended changing the column title “Rating” on the CHC website to “Performance” and adding other resources to enhance interpretation – i.e. Adding link of 2-minute video on My Birth Matters.
• Helen recommended collecting feedback from hospital patient family advisory councils when conducting interviews and focus groups.
2021 Maternity Honor Roll
• Elliott Main presented on the proposed honor roll for 2021. The Healthy People 2030 NTSV C-section target was proposed at 23.6%. COVID and an increased focus on patient safety will directly impact 2020 data.
• The Board agreed to move the target to 23.6%.
Next Meeting/Meeting Adjournment
• The next Board of Directors meeting is scheduled on February 10, 2021 at 10:00am PST via Zoom. The meeting formally adjourned at 10:33am PST.

Cal Hospital Compare Executive Session Summary Wednesday, December 16, 2020
Attendees: Bruce Spurlock, Ken Stuart, Joan Maxwell, Helen Macfie, Tracy Fisk Agenda Items Discussion • The Executive Session commenced immediately following the Board of
Directors Meeting. Action Items • Due to time constraints, a number of the Board members were not available to
attend the Executive Session. The four remaining Board members proposed the following actions:
1. Endorse and ratify the Data Use Fee schedule for 2021 with the following
caveats: a. The fees will not be raised at a minimum for two years b. A clear explanation of added value and services will be
incorporated into what funding health plans will receive 2. Adopt the straw recommendation from staff on how to budget for 2021:
a. Authorize up to $42,000 for Patient Activation/Outreach as presented at the meeting
b. Create an RFP in Q1 2021 for reinstituting Cal Quality Care and provide Long Term Care results, including a possible Nursing Home Honor Roll
c. Authorize $30,000 for additional trend analysis by IBM Watson in Lieu of 2 quarters of CMS updates. Additional funds may be available depending on the results and costs of the RFP
3. Request Board members review and, if agreeable, ratify these actions • An e-mail vote occurred after the meeting and the Board of Directors action
was ratified unanimously as of December 23, 2020.

Organizational Updates
3

Q4 2020 Website Data Refresh Complete
Updated measures include:
•CMS, CDPH, OSHPD, & maternity measures
•Retired CJRR measures•No new measures
4

2021-2022 Reporting Timeline
Patient Safety Honor Roll (2020)• February 2021
Patient Safety Poor Performers (2021)• February 2021
Maternity Honor Roll (2021)• July 2021
Opioid Care Honor Roll (2021)• Winter 2022
Patient Safety Honor Roll (2021)• Winter 2022
5

Hospital COVID-19 Study
6

Cal Quality Care Website Reboot
7

Proposal Timeline
Deliverable DateRequest for Proposal Release February 1, 2021Letter of Intent due February 12, 20121Submission of questions due February 15, 2021Responses to questions February 22, 2021Proposals due March 1, 2021Evaluation March 2021Outreach for additional questions (if necessary)
April 1, 2021
Award Notification April 15, 2021Start of Contract June 1, 2021
8

Patient Safety Honor Roll2020 Performance Report
9

Honor Roll Criteria
10
• Tier 1: Met Algorithmic andLeapfrog Criteria
• Tier 2: Met Algorithmic orLeapfrog Criteria
LeapfrogGrades for Fall 2019,
Spring 2020, Fall 2020 Three As
AlgorithmBenchmark
2/3 of measure results above 50th percentile
Failure No measure results below
10th percentile

Summary of Results
11
2020 Patient Safety Honor RollTotal CalHospitalCompare Hospitals = 329
Eligible HospitalsAlgorithmic Leap Frog Tier 1 (AND) Tier 2 (OR)
Algorithmic Leap Frog Both305 233 229 36 54 17 56
2019 Patient Safety Honor RollTotal CalHospitalCompare Hospitals = 326
Eligible HospitalsAlgorithmic Leap Frog Tier 1 (AND) Tier 2 (OR)
Algorithmic Leap Frog Both301 242 242 45 49 17 60
Note: Number of Tier 2 Hospitals excludes those meeting Tier 1 criteria

PSHR Summary of Changes: 2019 vs 2020
Tier 1, 2020 = 17 Hospitals
Tier 2, 2020 = 56 Hospitals
12
Same Tier in 2020 and 2019 34
Switch Tiers: Tier 1 in 2019 to Tier 2 in 2020 6
Switch Tiers: Tier 2 in 2019 to Tier 1 in 2020 6
New: Tier 1 in 2020 (no Honor Roll in 2019) 4
New: Tier 2 in 2020 (no Honor Roll in 2019) 23
Removed: Tier 1 in 2019 (no Honor Roll in 2020) 4
Removed: Tier 2 in 2019 (no Honor Roll in 2020) 27

Tier 1 PSHR Hospitals (17) Adventist Health Ukiah Valley Alhambra Hospital Medical Center Dominican Hospital Hoag Memorial Hospital Presbyterian John Muir Medical Center - Walnut Creek Campus Kaiser Permanente Fontana Medical Center Kaiser Permanente Ontario Vineyard Medical Center Kaiser Permanente Orange County - Anaheim Medical Center Kaiser Permanente Orange County - Irvine Medical Center Kaiser Permanente Riverside Medical Center Kaiser Permanente South San Francisco Medical Center Kaiser Permanente Vallejo Medical Center Natividad Medical Center Providence Little Company of Mary Medical Center Torrance Salinas Valley Memorial Healthcare System San Dimas Community Hospital Sherman Oaks Hospital and Health Center
13

Tier 2 PSHR Hospitals (56) Adventist Health Bakersfield
Adventist Health Glendale
Adventist Health Hanford
Adventist Health Howard Memorial
Adventist Health Simi Valley
Alvarado Hospital Medical Center
Banner Lassen Medical Center
Centinela Hospital Medical Center
Community Memorial Hospital
Desert Valley Hospital
Doctors Medical Center of Modesto
El Camino Hospital
El Camino Hospital Los Gatos
Enloe Medical Center - Esplanade Campus
French Hospital Medical Center
Garden Grove Hospital and Medical Center
Hoag Hospital Irvine
Hoag Orthopedic Institute
Kaiser Permanente Downey Medical Center
Kaiser Permanente Fresno Medical Center
Kaiser Permanente Manteca Medical Center
Kaiser Permanente Redwood City Medical Center
Kaiser Permanente Roseville Medical Center
Kaiser Permanente Santa Clara Medical Center
Kaiser Permanente Santa Rosa Medical Center
Kaiser Permanente South Bay Medical Center
Keck Hospital of USC
Lakewood Regional Medical Center
Loma Linda University Medical Center
Los Robles Hospital & Medical Center
Mad River Community Hospital
Marian Regional Medical Center
Marshall Medical Center
Mercy Medical Center Mount Shasta
Mills-Peninsula Medical Center
PIH Health Hospital - Whittier
Providence Little Company of Mary Medical Center San Pedro
Providence Tarzana Medical Center
Redlands Community Hospital
Scripps Green Hospital
14

…Tier 2 PSHR Hospitals (56) Seton Medical Center
Sharp Chula Vista Medical Center
Sharp Coronado Hospital and Healthcare Center
Sharp Memorial Hospital
Sierra Vista Regional Medical Center
St. Elizabeth Community Hospital
St. Joseph's Medical Center - Stockton
Stanford Health Care
Sutter Amador Hospital
Sutter Auburn Faith Hospital
Sutter Lakeside Hospital
Sutter Santa Rosa Regional Hospital
UC Irvine Health
UC San Diego Health - Hillcrest, UC San Diego Medical Center
UC San Diego Health - LA Jolla, Jacobs Medical Center and Sulpizio Cardiovascular Center
UCLA Medical Center - Santa Monica15

Patient Safety Poor PerformersFinalize 2021 Performance Report
16

Poor Performer Criteria
17
• Tier 1: Met Algorithmic andLeapfrog Criteria
• Tier 2: Met Algorithmic orLeapfrog Criteria
LeapfrogAverage GPA < 2.67
Across Last 3 Reporting Periods
AlgorithmBenchmark
2/3 of measure results below 40th percentile
Failure None

Making Healthcare Safer for All Californians Healthcare-Associated Infections in California Hospitals Annual Report | January to December 2019
Report to the Legislature and the People of California by the Healthcare-Associated Infections Program,
Center for Health Care Quality, California Department of Public Health | October 2020

17 | Making Healthcare Safer for All Californians: Healthcare-Associated Infections in California Hospitals, Annual Report | 2019
Table 5. Hospitals with HAI Incidence Worse than National Baselines or Pooled Statewide Average Rate in 2019 for Multiple Infection Types or in Consecutive Years
Hospital Name County HAI Type Worse than 2015 National Baseline
Clovis Community Medical Center Fresno SSI 2018, 2019 Ridgecrest Regional Hospital Kern SSI 2018, 2019 Children's Hospital Los Angeles Los Angeles CDI 2017, 2018, 2019 City of Hope Helford Clinical Research Hospital Los Angeles CDI 2016, 2017, 2018, 2019 City of Hope Helford Clinical Research Hospital Los Angeles VRE BSI 2015, 2016, 2017, 2018, 2019 Hollywood Presbyterian Medical Center Los Angeles CLABSI 2018, 2019 Monterey Park Hospital Los Angeles CDI 2019 Monterey Park Hospital Los Angeles SSI 2018, 2019 Pacifica Hospital of the Valley Los Angeles CLABSI 2018, 2019 Palmdale Regional Medical Center Los Angeles SSI 2018, 2019 Ronald Reagan UCLA Medical Center Los Angeles VRE BSI 2015, 2016, 2017, 2018, 2019 Saint Vincent Medical Center Los Angeles CLABSI 2018, 2019 USC Kenneth Norris Jr. Cancer Hospital Los Angeles CLABSI 2019 USC Kenneth Norris Jr. Cancer Hospital Los Angeles MRSA BSI 2019 USC Kenneth Norris Jr. Cancer Hospital Los Angeles VRE BSI 2019 Huntington Beach Hospital Orange CDI 2018, 2019 Huntington Beach Hospital Orange SSI 2019 Methodist Hospital of Sacramento Sacramento MRSA BSI 2019 Methodist Hospital of Sacramento Sacramento SSI 2019 Loma Linda University Medical Center San Bernardino VRE BSI 2016, 2017, 2018, 2019 Scripps Memorial Hospital, Encinitas San Diego SSI 2018, 2019 Sharp Chula Vista Medical Center San Diego CLABSI 2018, 2019 UCSF Medical Center San Francisco CDI 2015, 2016, 2017, 2018, 2019 Twin Cities Community Hospital San Luis Obispo SSI 2018, 2019 Stanford Health Care Santa Clara VRE BSI 2015, 2016, 2017, 2018, 2019 Kaiser Foundation Hospital, Vacaville Solano SSI 2018, 2019

Summary of Results
18
2021 Patient Safety Poor Performer ReportTotal CalHospitalCompare Hospitals = 329
Eligible HospitalsAlgorithmic Leap
FrogTier 1 (AND) Tier 2 (OR) Honor Roll Criteria (for hospitals meeting Minimum
Measures)Algorithmic Leap Frog
305 233 67 29 15 81Algorithmic:At least 2/3 of measure results below 40th percentile. Leapfrog: Average GPA < 2.67
2020 Patient Safety Poor Performer ReportTotal CalHospitalCompare Hospitals = 326
Eligible HospitalsAlgorithmic Leap
FrogTier 1 (AND) Tier 2 (OR) Honor Roll Criteria (for hospitals meeting Minimum
Measures)Algorithmic Leap Frog
301 242 30 39 13 56Algorithmic:At least 2/3 of measure results below 40th percentile. Leapfrog: Average GPA < 2.67

Other Signals
Payment Reduction Determined by CMS HAC Reduction Program
CMS will release FY 2021 HAC Reduction Program information for each hospital on Hospital Compare in early 2021
CDPH Annual HAI Report (2019) - Hospitals with HAI Incidence Worse than National Baselines in 2019 for Multiple Infection Types or in Consecutive Years
19

CalHospitalCompare AnalyticsInitial examples
20

CalHospitalCompare Analytics Goal of Comprehensive Measure Analysis
To examine longitudinal trends in both the measure set and performance to provide actionable insights
Review measure set and methodology and consider enhancements to improve consumer reporting
In depth examination of CalHospitalCompare’s performance history Changes in the measure set over time; migrating from process to outcome measures,
including impact of specification changes and rebasing
Examine the absolute changes in performance over time
Examine hospital and/or demographic factors that are associated with the most improved/worsened performance. Hospital size, system ownership, urban vs rural, occupancy, payer mix, financial performance,
staffing etc
Could also include sociodemographic information in the hospitals geographic area
Multivariate regression can be run to more precisely quantify the factors driving both 1) performance differences across hospitals and 2) changes in performance over time
21

Number of Measures Reported on CalHospitalCompare
Domain Number of Measures Number of Measure with Performance Category
Patient Experience 10 1Mother & Baby 6 4Hip and Knee 5 3Patient Safety 6 6Healthcare Associated Infections 28 25Cancer Surgery Volumes 11 0Emergency Department (ED) Care 4 2Heart and Lung Conditions 12 10Stroke 1 1Other Surgeries/Conditions 7 4Total 90 56
22

Initial ExampleMaternity – Historical Trends
23
0
5
10
15
20
25
30
Q4 Q1 Q2 Q3 Q1 Q2 Q1 Q2 Q3 Q4 Q2 Q3 Q4 Q1 Q2 Q3 Q4 Q1 Q2 Q3 Q4 Q1 Q2 Q3 Q4
2013 2014 2015 2016 2017 2018 2019 2020
CSECT_NTSV NTSV C-Section RateEPISIOTOMY EpisiotomyRateVBAC VBAC Rate

C-Section – Change in Distributions
24
As desired, distribution narrows and shifts to left
N AVG SD MIN P10 P25 P50 P75 P90 MAXNTSV C-Section 2013 239 27.7% 8.5% 13.0% 18.3% 22.2% 26.8% 31.6% 36.2% 83.3%NTSV C-Section 2020 239 23.0% 5.3% 0.0% 17.8% 20.0% 22.5% 25.7% 28.4% 44.4%

C-Section – Distribution of Change
25
N AVG SD MIN P10 P25 P50 P75 P90 MAX239 ( 4.2%) 7.5% (43.6%) (12.2%) ( 7.8%) ( 4.0%) 0.5% 4.0% 17.1%
As desired, most hospitals had decreases from 2013 to 2020
However, some hospital rates increased

Top 10 Decreased C-section Rate
26
Name City2013 2020
DifferenceDenom Rate Denom Rate
Hi-Desert Medical Center Joshua Tree 166 54.4 103 27.2 -27.1
East Los Angeles Doctors Hospital Los Angeles 179 59.9 219 34.2 -25.7
Memorial Hospital Los Banos Los Banos 182 35.6 162 13.6 -22.0
Banner Lassen Medical Center Susanville 78 33.7 80 12.5 -21.2
Hemet Valley Medical Center Hemet 346 35.4 169 15.4 -20.0
Monterey Park Hospital Monterey Park 398 50.4 301 30.6 -19.7
Community Hospital of San Bernardino San Bernardino 513 42.3 580 22.6 -19.7
UCLA Medical Center - Santa Monica Santa Monica 684 38.0 708 20.2 -17.8
Sutter Lakeside Hospital Lakeport 117 36.9 96 19.8 -17.1
Doctors Hospital of Manteca Manteca 224 33.5 134 16.4 -17.1
Rightmost “outliers” moving into body of distribution

Top 10 Increased C-section Rate
27
Name City
2013 2020
DifferenceDenom Rate Denom Rate
San Dimas Community Hospital San Dimas 154 25.9 179 43.0 17.1
Fairchild Medical Center Yreka 46 28.3 45 44.4 16.1
Redwood Memorial Hospital Fortuna 126 17.5 79 31.6 14.1
San Gorgonio Memorial Hospital Banning 117 30.9 61 44.3 13.4
Palo Verde Hospital Blythe 38 24.1 29 34.5 10.4
Sierra Nevada Memorial Hospital Grass Valley 173 20.7 120 30.8 10.1
Tahoe Forest Hospital Truckee 164 15.8 125 25.6 9.8
St. Joseph Hospital, Eureka Eureka 193 19.8 143 28.0 8.2
Sierra Vista Regional Medical Center San Luis Obispo 404 24.0 357 31.9 7.9
French Hospital Medical Center San Luis Obispo 251 19.8 260 27.3 7.5
Note: Hospital-level trend between 2013 and 2020 to be examined

NTSV C-Section: Variation and Change by Ownership
Distribution: 2020 Q4Hospital Characteristic N Pop Mean Avg Score Min P25 P50 P75 Max
District 16 23.1 24.9 16.5 20.0 24.6 27.5 44.3Investor - Partnership 7 24.8 25.9 20.7 21.9 24.3 30.6 34.2Investor - LLC 6 25.3 25.2 15.4 17.4 24.1 27.2 43.0Investor - Corporation 21 24.9 23.8 16.4 19.4 23.1 26.8 35.7Non-Profit Corporation 145 23.0 23.0 10.3 20.2 22.6 25.4 44.4University of California 6 21.7 22.4 19.0 20.2 22.4 23.2 27.0City or County 18 20.2 20.1 12.2 17.9 19.5 21.7 28.7
28
Change: 2020 Q4 - 2013 Q4Hospital Characteristic N Pop Mean Avg
Score Min P25 P50 P90 Max
District 15 50.6 -1.4 -19.4 -7.4 -2.3 12.7 16.1Investor - Partnership 7 50.4 -10.0 -25.6 -15.9 -9.1 -0.8 -0.8Investor - LLC 6 49.3 -8.1 -18.7 -12.0 -8.5 6.0 6.0Investor - Corporation 19 45.4 -3.6 -11.7 -7.8 -2.7 0.8 8.2Non-Profit Corporation 137 83.2 -3.4 -20.5 -7.0 -2.6 3.4 20.5University of California 6 7.0 -1.8 -9.6 -3.9 -0.6 3.2 3.2City or County 18 36.3 -3.7 -11.3 -6.8 -4.1 3.4 4.1

NTSV C-Section: Distribution by Ownership, 2020 Q4
29
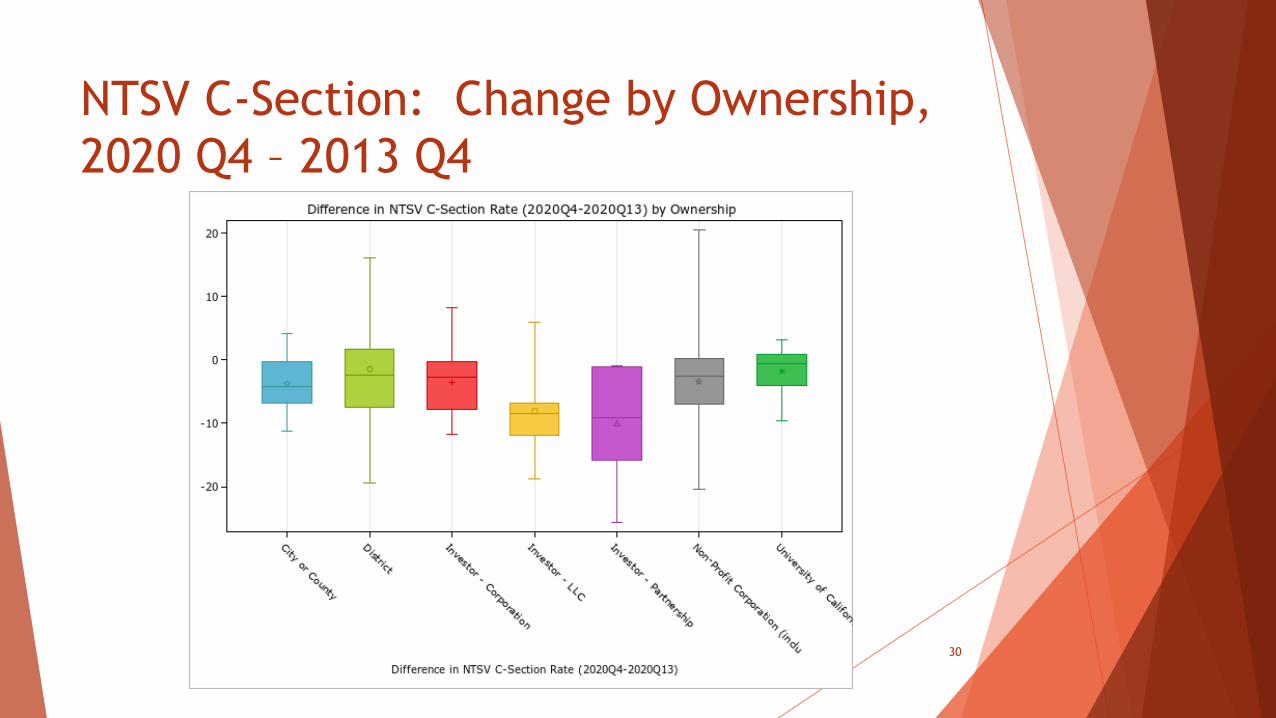
NTSV C-Section: Change by Ownership, 2020 Q4 – 2013 Q4
30

Wrap Up
32

2021 BOD Call Schedule (all times are Pacific Time Zone)
Wednesday, April 14, 2021 10:00am to 12:00pm
Wednesday, June 9, 2021 10:00am to 12:00pm
Wednesday, August 4, 2021 10:00am to 12:00pm
Wednesday, September 29, 2021 10:00am to 12:00pm
Wednesday, December 1, 2021 10:00am to 12:00pm

Thank you!
34