Embed Size (px)
Citation preview
CAIR+ and Public HealthCAIR+ and Public HealthMonetized public health benefits of Monetized public health benefits of
additional EGU controlsadditional EGU controls
IyadIyad KheirbekKheirbek, NH DES, and, NH DES, andGary Kleiman Gary Kleiman
OTC Board MeetingOTC Board MeetingArlington, VA Arlington, VA ●● November 14, 2007November 14, 2007
Celebrating 40 Years in Support of Clean Air for the NortheastCelebrating 40 Years in Support of Clean Air for the Northeast
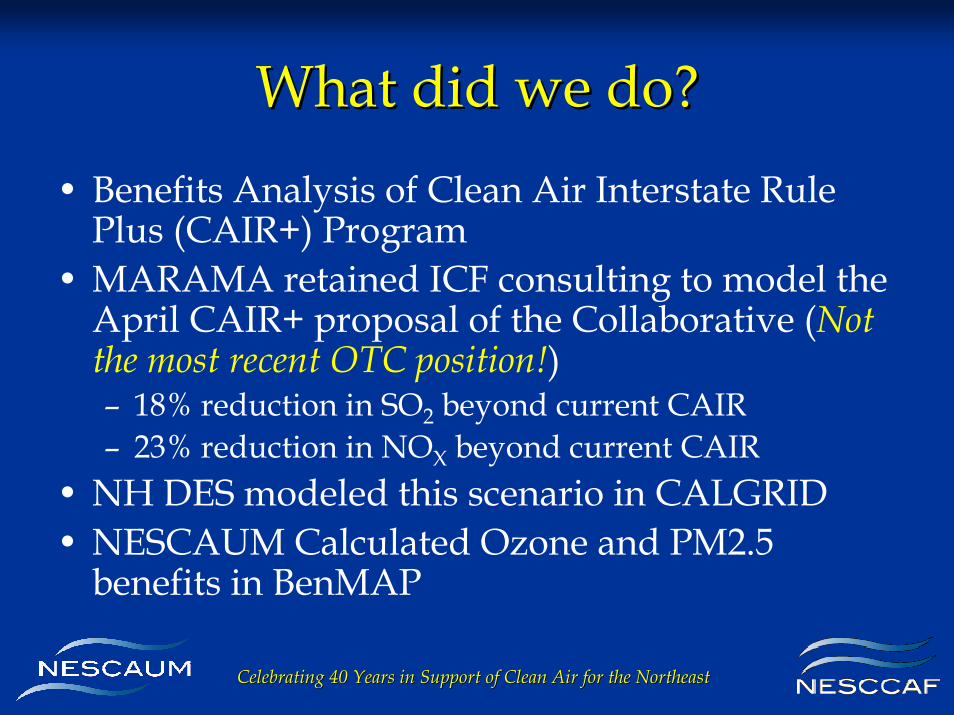
What did we do?What did we do?• Benefits Analysis of Clean Air Interstate Rule
Plus (CAIR+) Program• MARAMA retained ICF consulting to model the
April CAIR+ proposal of the Collaborative (Not the most recent OTC position!)– 18% reduction in SO2 beyond current CAIR– 23% reduction in NOX beyond current CAIR
• NH DES modeled this scenario in CALGRID• NESCAUM Calculated Ozone and PM2.5
benefits in BenMAP
Celebrating 40 Years in Support of Clean Air for the NortheastCelebrating 40 Years in Support of Clean Air for the Northeast
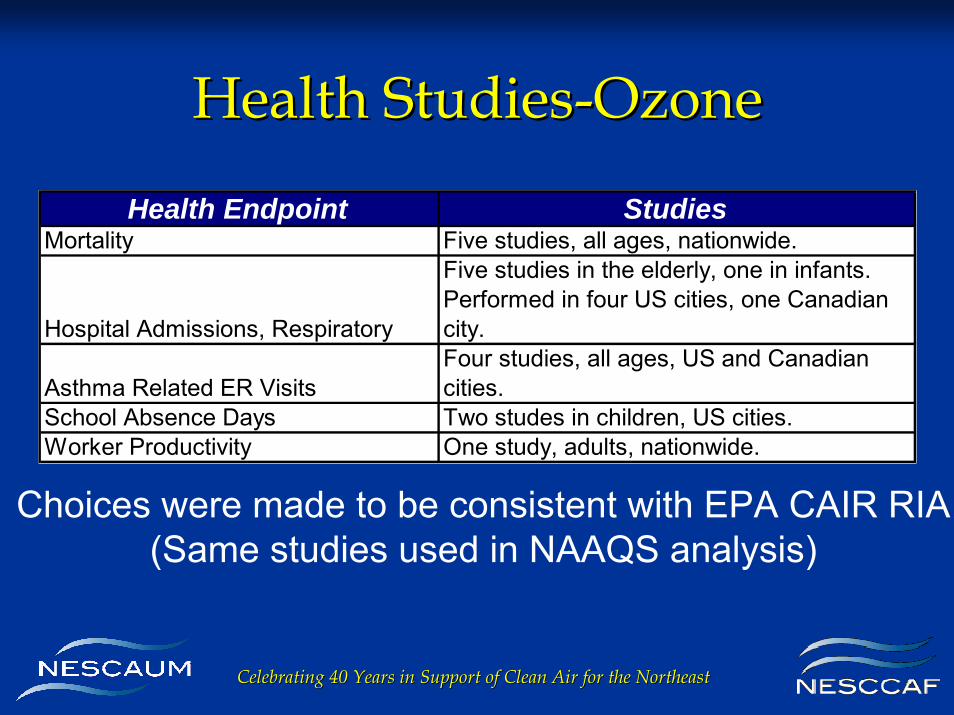
Health StudiesHealth Studies--OzoneOzone
Health Endpoint StudiesMortality Five studies, all ages, nationwide.
Hospital Admissions, Respiratory
Five studies in the elderly, one in infants. Performed in four US cities, one Canadian city.
Asthma Related ER VisitsFour studies, all ages, US and Canadian cities.
School Absence Days Two studes in children, US cities.Worker Productivity One study, adults, nationwide.
Choices were made to be consistent with EPA CAIR RIA(Same studies used in NAAQS analysis)
Celebrating 40 Years in Support of Clean Air for the NortheastCelebrating 40 Years in Support of Clean Air for the Northeast
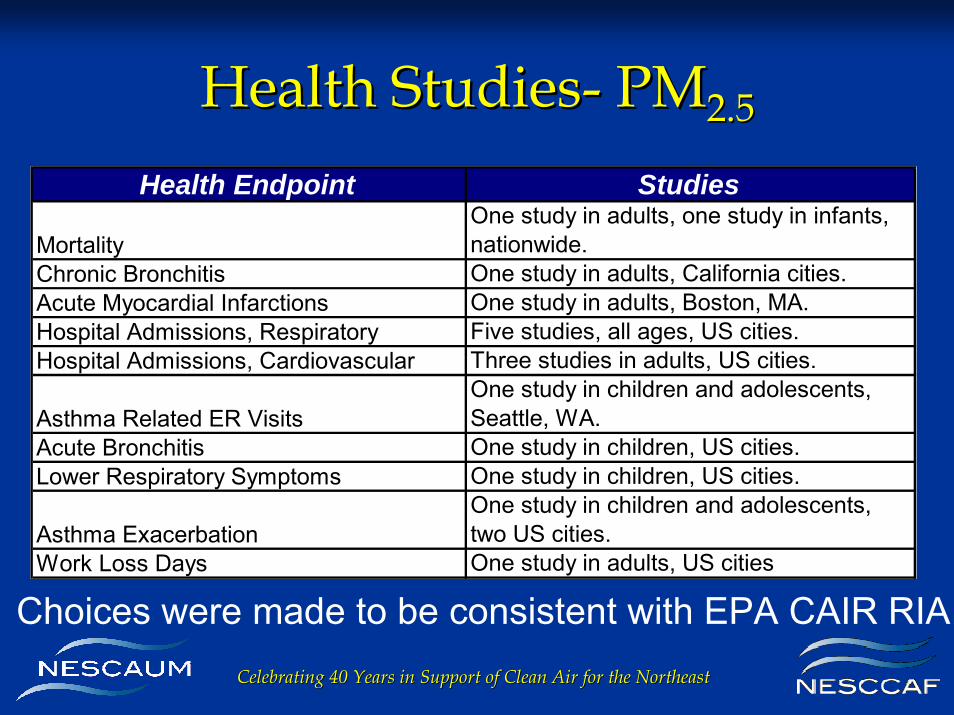
Health StudiesHealth Studies-- PMPM2.52.5
Health Endpoint Studies
MortalityOne study in adults, one study in infants, nationwide.
Chronic Bronchitis One study in adults, California cities.Acute Myocardial Infarctions One study in adults, Boston, MA.Hospital Admissions, Respiratory Five studies, all ages, US cities.Hospital Admissions, Cardiovascular Three studies in adults, US cities.
Asthma Related ER VisitsOne study in children and adolescents, Seattle, WA.
Acute Bronchitis One study in children, US cities.Lower Respiratory Symptoms One study in children, US cities.
Asthma ExacerbationOne study in children and adolescents, two US cities.
Work Loss Days One study in adults, US cities
Choices were made to be consistent with EPA CAIR RIA
Celebrating 40 Years in Support of Clean Air for the NortheastCelebrating 40 Years in Support of Clean Air for the Northeast
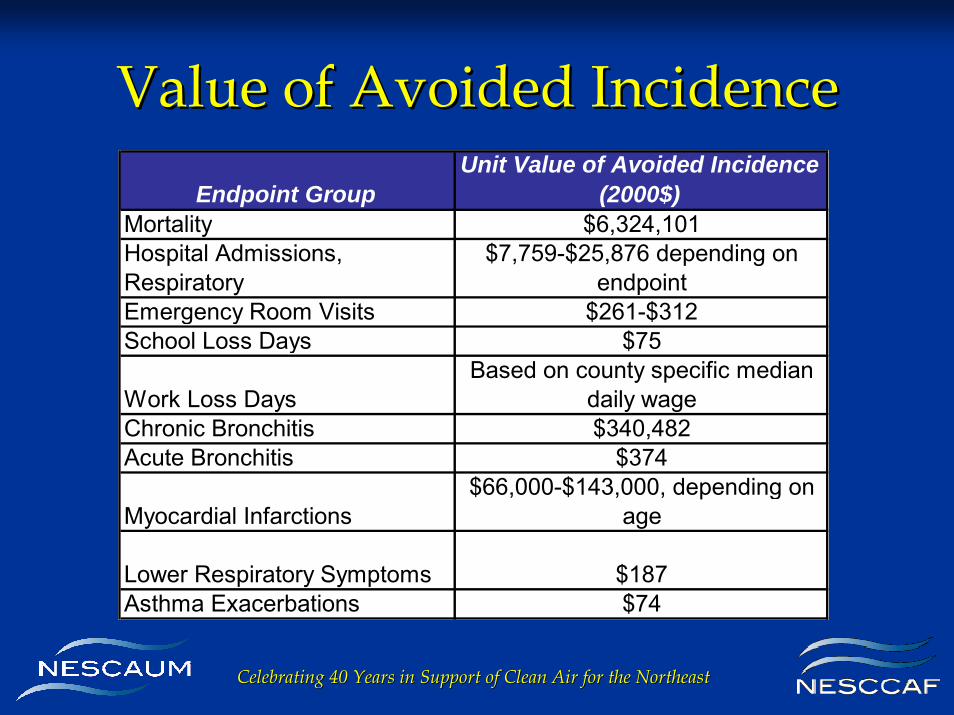
Value of Avoided IncidenceValue of Avoided IncidenceEndpoint Group
Unit Value of Avoided Incidence (2000$)
Mortality $6,324,101 Hospital Admissions, Respiratory
$7,759-$25,876 depending on endpoint
Emergency Room Visits $261-$312School Loss Days $75
Work Loss DaysBased on county specific median
daily wageChronic Bronchitis $340,482 Acute Bronchitis $374
Myocardial Infarctions$66,000-$143,000, depending on
age
Lower Respiratory Symptoms $187 Asthma Exacerbations $74
Celebrating 40 Years in Support of Clean Air for the NortheastCelebrating 40 Years in Support of Clean Air for the Northeast
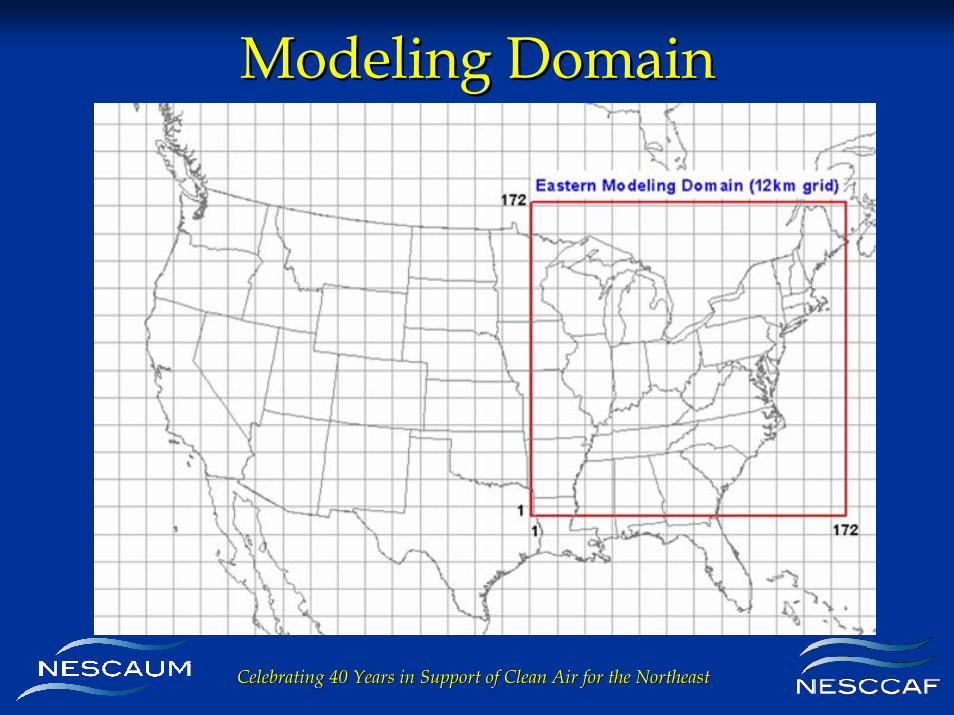
Modeling DomainModeling Domain
Celebrating 40 Years in Support of Clean Air for the NortheastCelebrating 40 Years in Support of Clean Air for the Northeast
CAIR+ Ozone BenefitsCAIR+ Ozone Benefits
Celebrating 40 Years in Support of Clean Air for the NortheastCelebrating 40 Years in Support of Clean Air for the Northeast
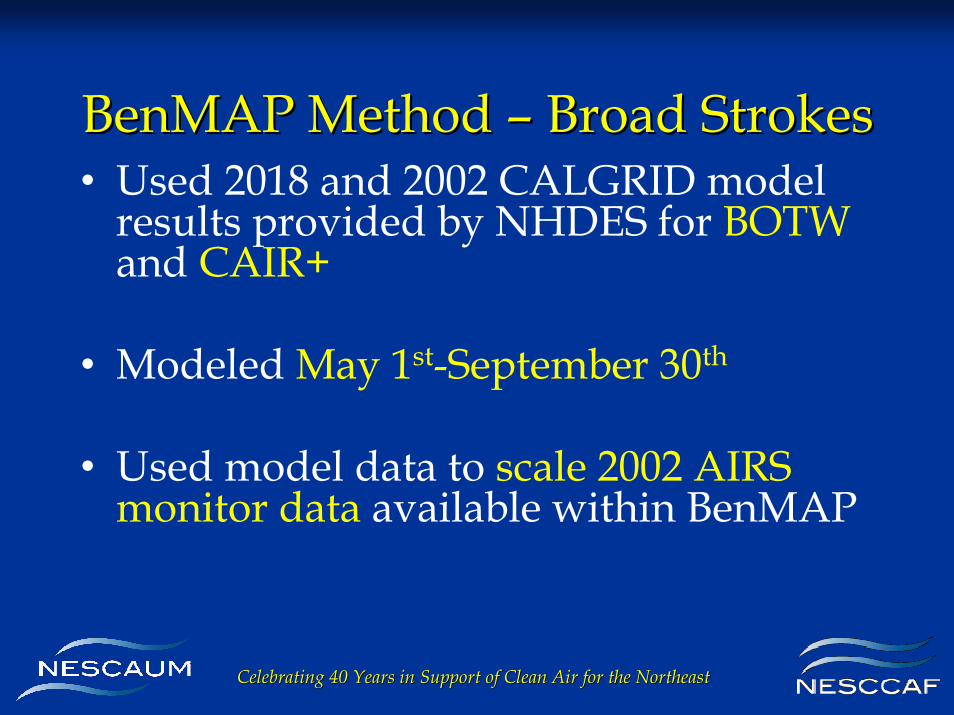
BenMAPBenMAP Method Method –– Broad StrokesBroad Strokes• Used 2018 and 2002 CALGRID model
results provided by NHDES for BOTWand CAIR+
• Modeled May 1st-September 30th
• Used model data to scale 2002 AIRS monitor data available within BenMAP
Celebrating 40 Years in Support of Clean Air for the NortheastCelebrating 40 Years in Support of Clean Air for the Northeast
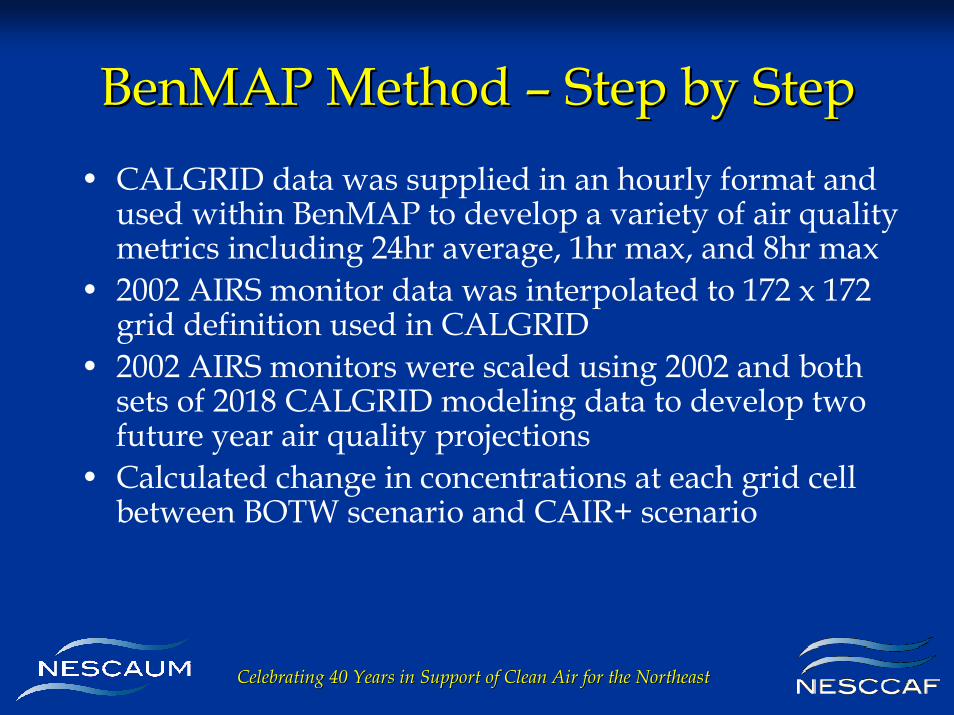
BenMAP Method BenMAP Method –– Step by StepStep by Step• CALGRID data was supplied in an hourly format and
used within BenMAP to develop a variety of air quality metrics including 24hr average, 1hr max, and 8hr max
• 2002 AIRS monitor data was interpolated to 172 x 172 grid definition used in CALGRID
• 2002 AIRS monitors were scaled using 2002 and both sets of 2018 CALGRID modeling data to develop two future year air quality projections
• Calculated change in concentrations at each grid cell between BOTW scenario and CAIR+ scenario
Celebrating 40 Years in Support of Clean Air for the NortheastCelebrating 40 Years in Support of Clean Air for the Northeast
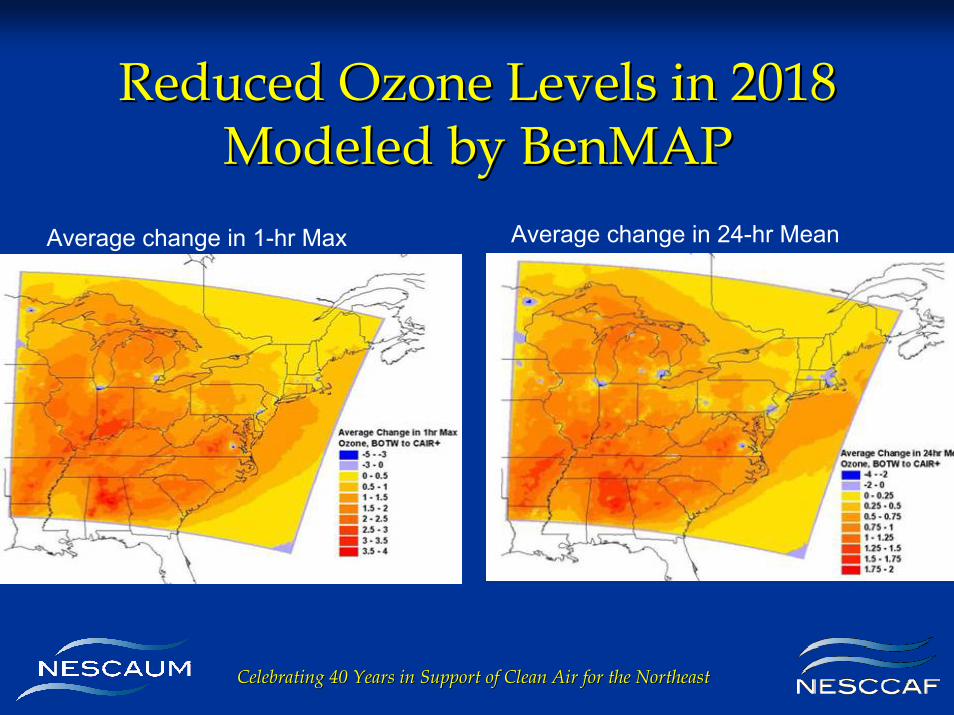
Reduced Ozone Levels in 2018 Reduced Ozone Levels in 2018 Modeled by Modeled by BenMAPBenMAP
Average change in 1-hr Max Average change in 24-hr Mean
Celebrating 40 Years in Support of Clean Air for the NortheastCelebrating 40 Years in Support of Clean Air for the Northeast
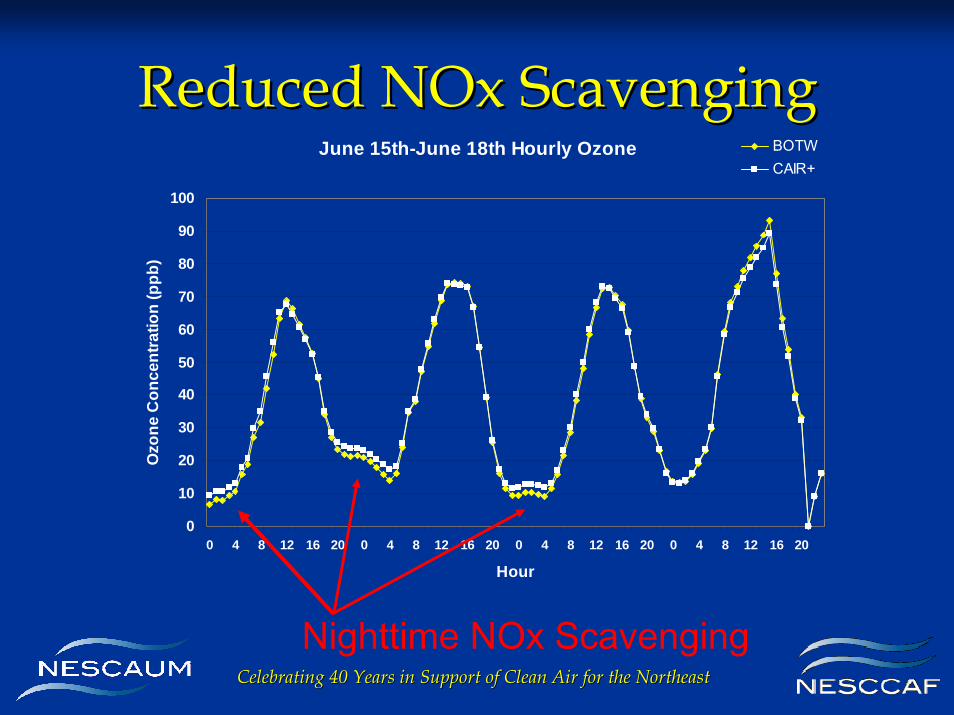
June 15th-June 18th Hourly Ozone
0
10
20
30
40
50
60
70
80
90
100
1 5 9 13 17 21 25 29 33 37 41 45 49 53 57 61 65 69 73 77 81 85 89 93
Hour
Ozo
ne C
once
ntra
tion
(ppb
)BOTWJune 15th-June 18th Hourly Ozone
0
10
20
30
40
50
60
70
80
90
100
0 4 8 12 16 20 0 4 8 12 16 20 0 4 8 12 16 20 0 4 8 12 16 20
Hour
Ozo
ne C
once
ntra
tion
(ppb
)BOTWCAIR+
Reduced Reduced NOxNOx ScavengingScavenging
Nighttime NOx Scavenging
Celebrating 40 Years in Support of Clean Air for the NortheastCelebrating 40 Years in Support of Clean Air for the Northeast
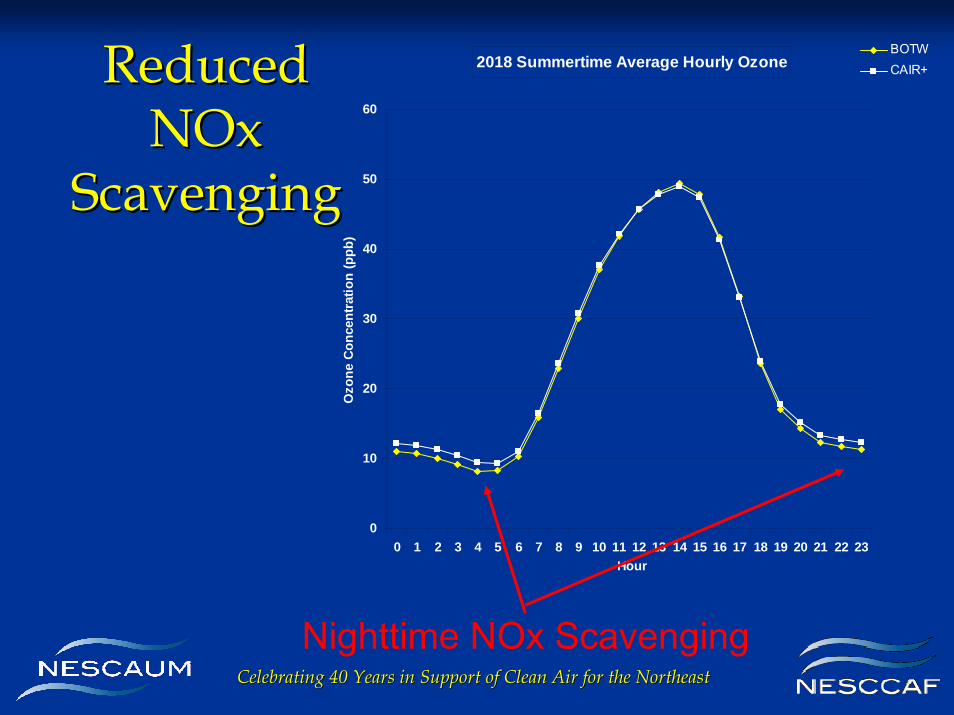
2018 Summertime Average Hourly Ozone
0
10
20
30
40
50
60
0 1 2 3 4 5 6 7 8 9 10 11 12 13 14 15 16 17 18 19 20 21 22 23Hour
Ozo
ne C
once
ntra
tion
(ppb
)
BOTWCAIR+Reduced Reduced
NOxNOxScavengingScavenging
Nighttime NOx Scavenging
Celebrating 40 Years in Support of Clean Air for the NortheastCelebrating 40 Years in Support of Clean Air for the Northeast
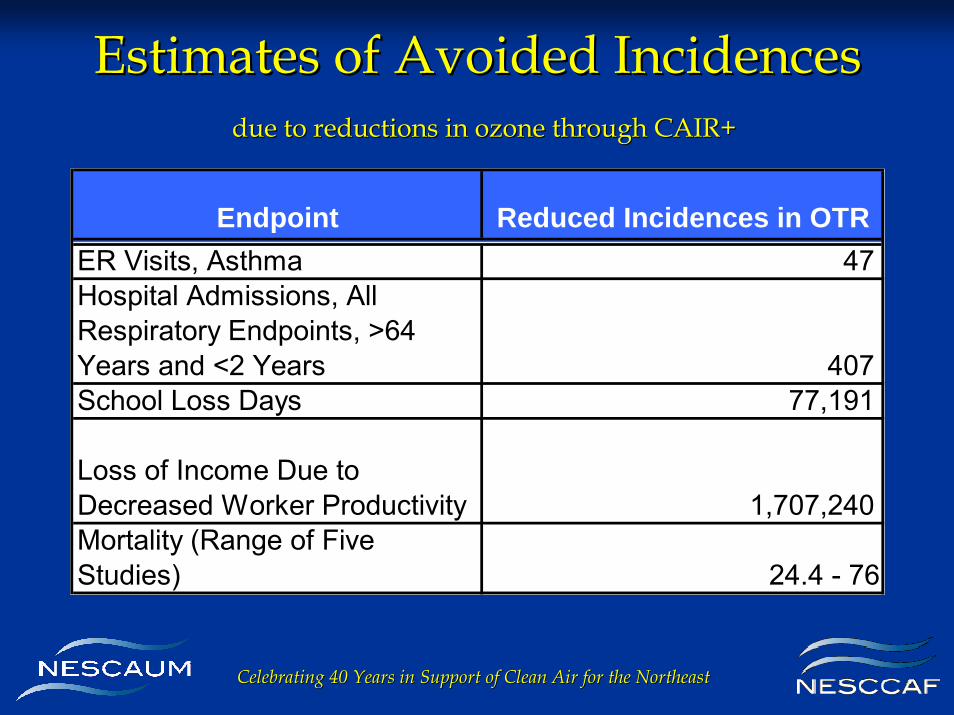
Estimates of Avoided IncidencesEstimates of Avoided Incidencesdue to reductions in ozone through CAIR+due to reductions in ozone through CAIR+
Endpoint Reduced Incidences in OTRER Visits, Asthma 47 Hospital Admissions, All Respiratory Endpoints, >64 Years and <2 Years 407 School Loss Days 77,191
Loss of Income Due to Decreased Worker Productivity 1,707,240 Mortality (Range of Five Studies) 24.4 - 76
Celebrating 40 Years in Support of Clean Air for the NortheastCelebrating 40 Years in Support of Clean Air for the Northeast
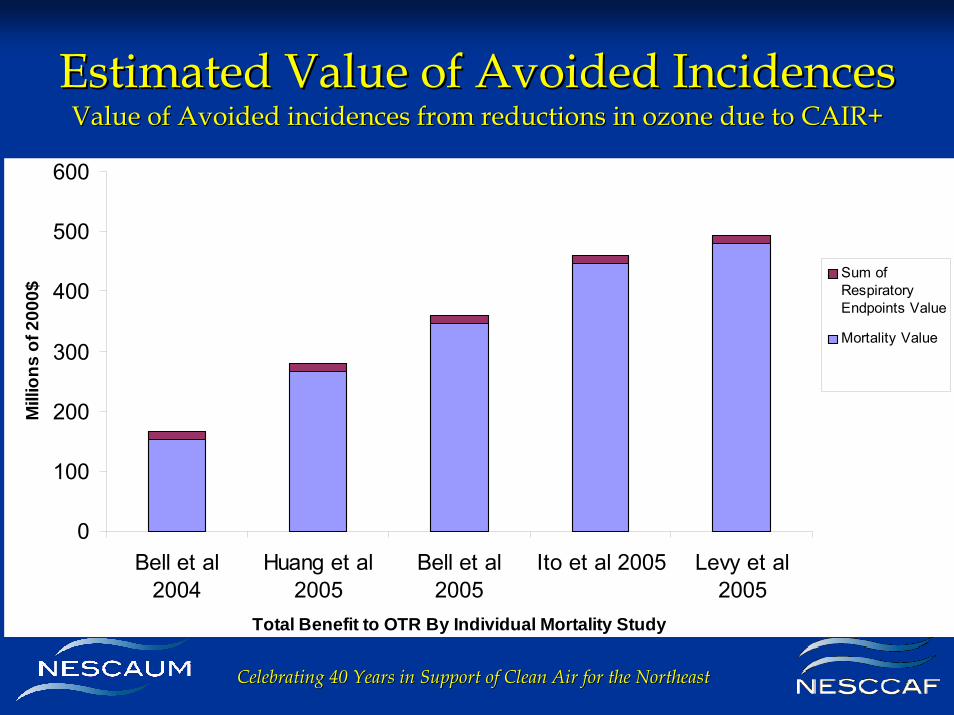
Estimated Value of Avoided IncidencesEstimated Value of Avoided IncidencesValue of Avoided incidences from reductions in ozone due to CAIRValue of Avoided incidences from reductions in ozone due to CAIR++
0
100
200
300
400
500
600
Bell et al2004
Huang et al2005
Bell et al2005
Ito et al 2005 Levy et al2005
Total Benefit to OTR By Individual Mortality Study
Mill
ions
of 2
000$
Sum ofRespiratoryEndpoints Value
Mortality Value
Celebrating 40 Years in Support of Clean Air for the NortheastCelebrating 40 Years in Support of Clean Air for the Northeast
CAIR+ PMCAIR+ PM2.52.5 BenefitsBenefits
Celebrating 40 Years in Support of Clean Air for the NortheastCelebrating 40 Years in Support of Clean Air for the Northeast
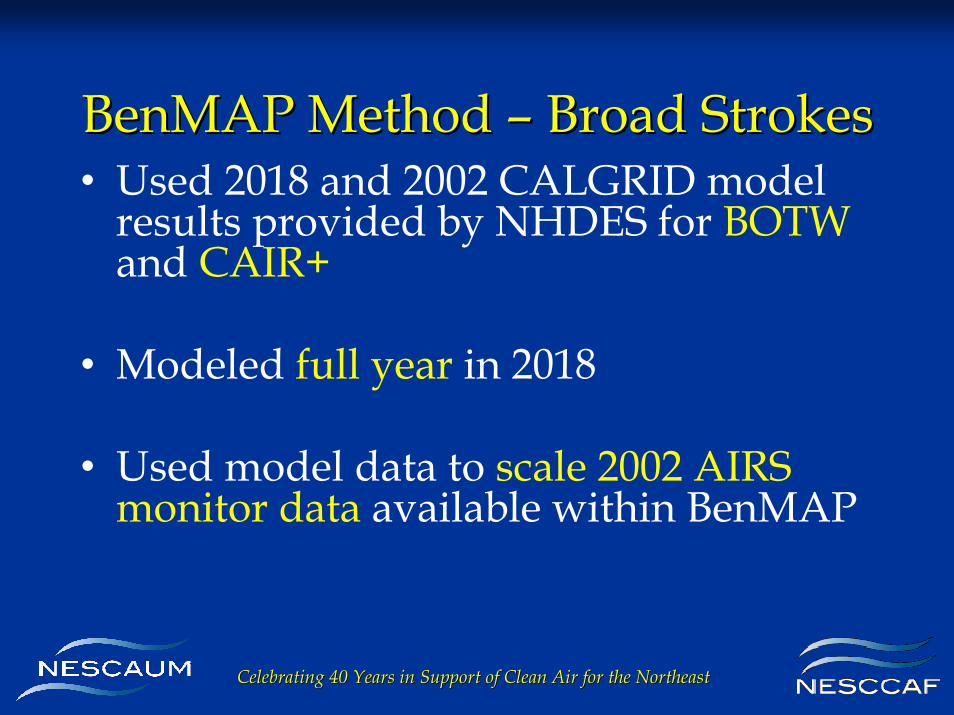
BenMAPBenMAP Method Method –– Broad StrokesBroad Strokes• Used 2018 and 2002 CALGRID model
results provided by NHDES for BOTWand CAIR+
• Modeled full year in 2018
• Used model data to scale 2002 AIRS monitor data available within BenMAP
Celebrating 40 Years in Support of Clean Air for the NortheastCelebrating 40 Years in Support of Clean Air for the Northeast
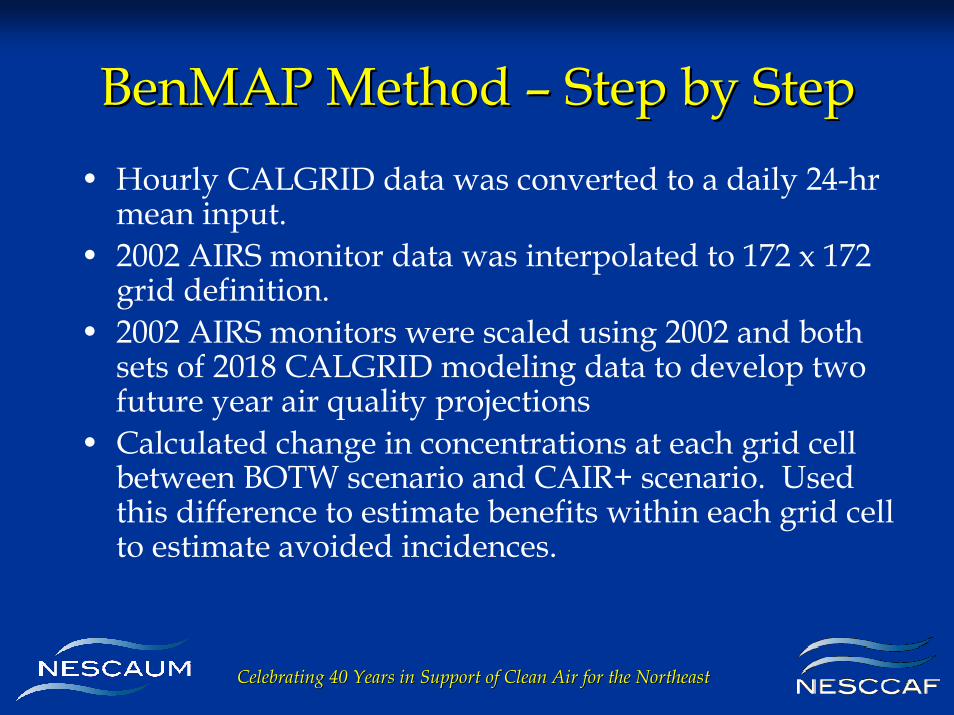
BenMAP Method BenMAP Method –– Step by StepStep by Step• Hourly CALGRID data was converted to a daily 24-hr
mean input.• 2002 AIRS monitor data was interpolated to 172 x 172
grid definition.• 2002 AIRS monitors were scaled using 2002 and both
sets of 2018 CALGRID modeling data to develop two future year air quality projections
• Calculated change in concentrations at each grid cell between BOTW scenario and CAIR+ scenario. Used this difference to estimate benefits within each grid cell to estimate avoided incidences.
Celebrating 40 Years in Support of Clean Air for the NortheastCelebrating 40 Years in Support of Clean Air for the Northeast
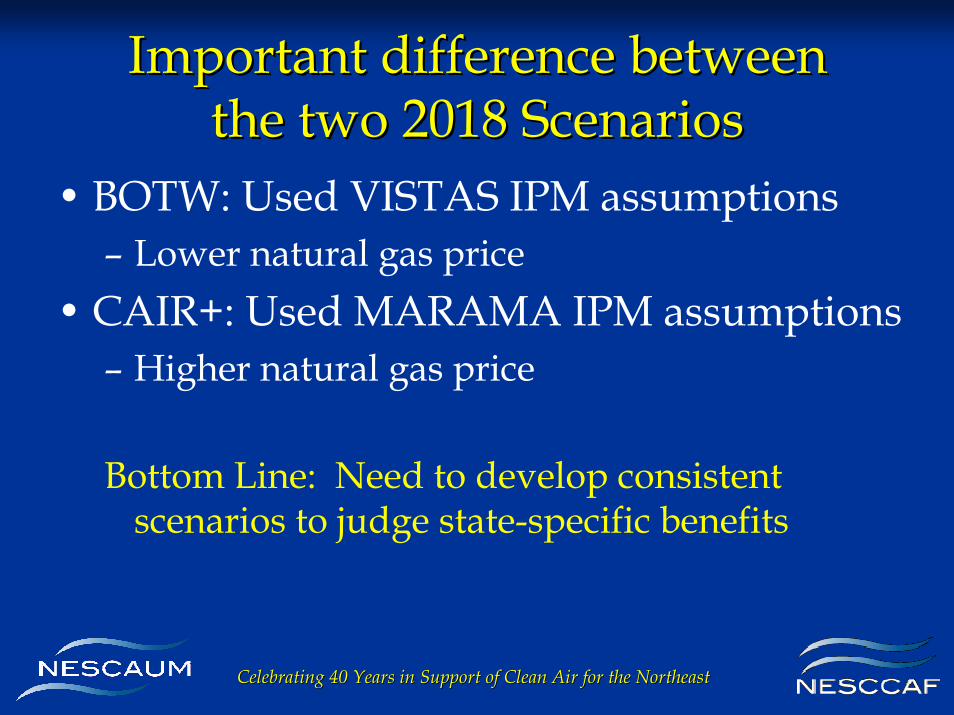
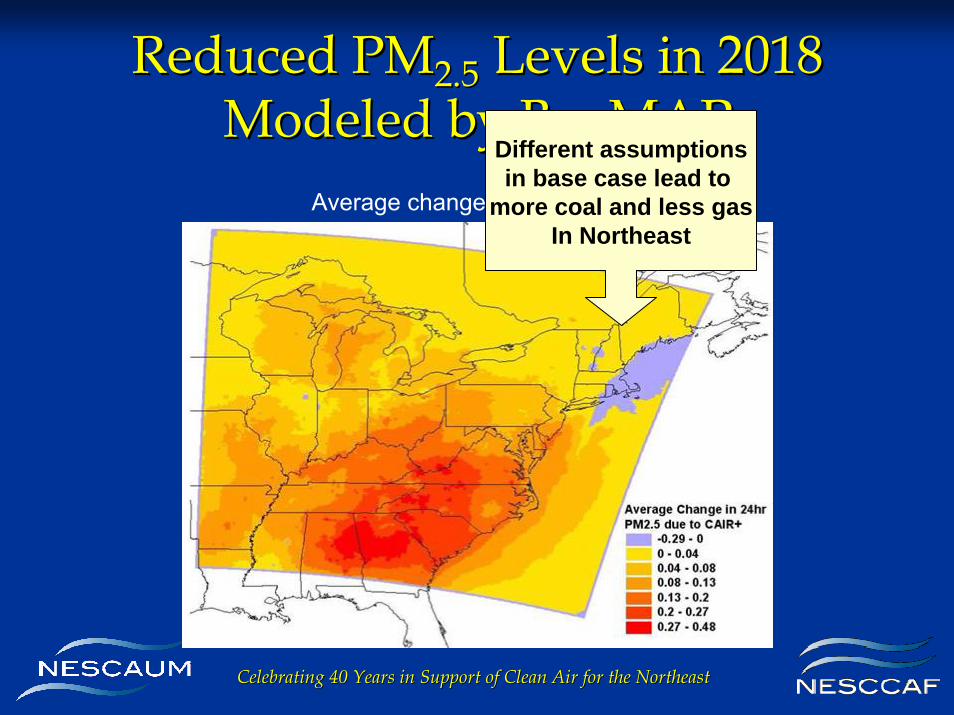
Important difference between Important difference between the two 2018 Scenariosthe two 2018 Scenarios
• BOTW: Used VISTAS IPM assumptions– Lower natural gas price
• CAIR+: Used MARAMA IPM assumptions– Higher natural gas price
Bottom Line: Need to develop consistent scenarios to judge state-specific benefits
Celebrating 40 Years in Support of Clean Air for the NortheastCelebrating 40 Years in Support of Clean Air for the Northeast
Reduced PMReduced PM2.52.5 Levels in 2018 Levels in 2018 Modeled by Modeled by BenMAPBenMAP
Average change in 24-hr Mean
Different assumptionsin base case lead to
more coal and less gasIn Northeast
Celebrating 40 Years in Support of Clean Air for the NortheastCelebrating 40 Years in Support of Clean Air for the Northeast
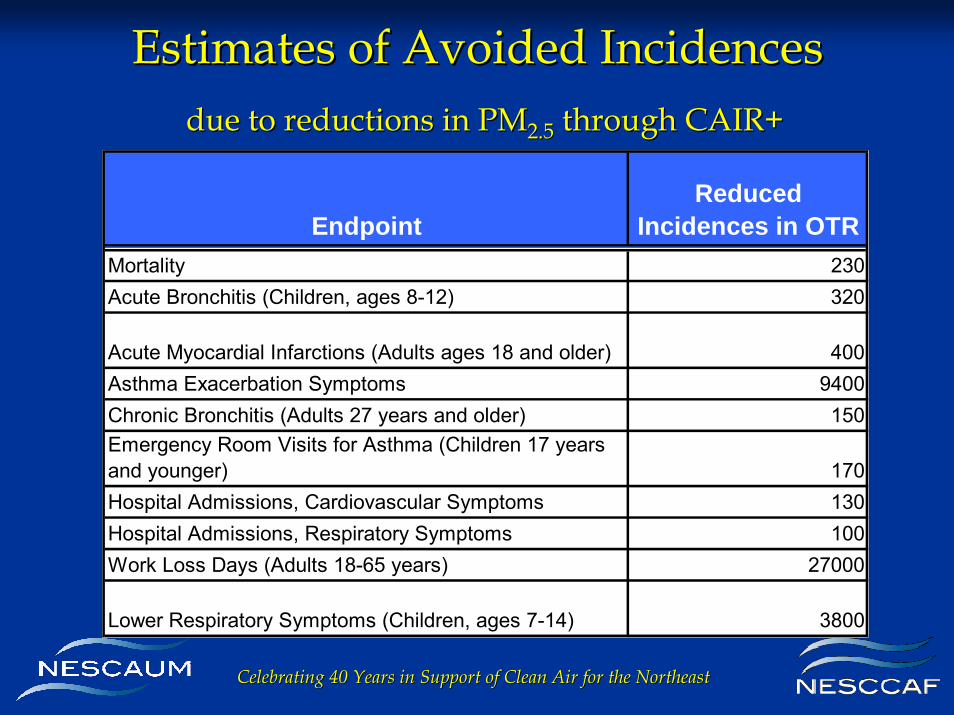
Estimates of Avoided IncidencesEstimates of Avoided Incidencesdue to reductions in PMdue to reductions in PM2.52.5 through CAIR+through CAIR+
EndpointReduced
Incidences in OTRMortality 230Acute Bronchitis (Children, ages 8-12) 320
Acute Myocardial Infarctions (Adults ages 18 and older) 400Asthma Exacerbation Symptoms 9400Chronic Bronchitis (Adults 27 years and older) 150Emergency Room Visits for Asthma (Children 17 years and younger) 170Hospital Admissions, Cardiovascular Symptoms 130Hospital Admissions, Respiratory Symptoms 100Work Loss Days (Adults 18-65 years) 27000
Lower Respiratory Symptoms (Children, ages 7-14) 3800
Celebrating 40 Years in Support of Clean Air for the NortheastCelebrating 40 Years in Support of Clean Air for the Northeast
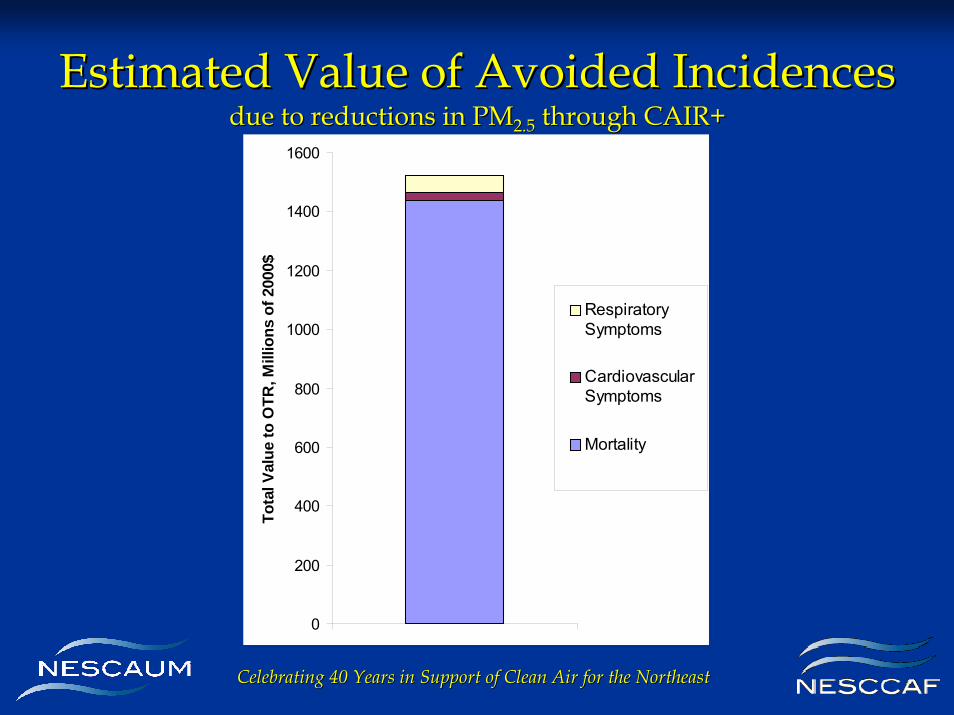
Estimated Value of Avoided IncidencesEstimated Value of Avoided Incidencesdue to reductions in PMdue to reductions in PM2.52.5 through CAIR+through CAIR+
0
200
400
600
800
1000
1200
1400
1600
Tota
l Val
ue to
OTR
, Mill
ions
of 2
000$
RespiratorySymptoms
CardiovascularSymptoms
Mortality
Celebrating 40 Years in Support of Clean Air for the NortheastCelebrating 40 Years in Support of Clean Air for the Northeast
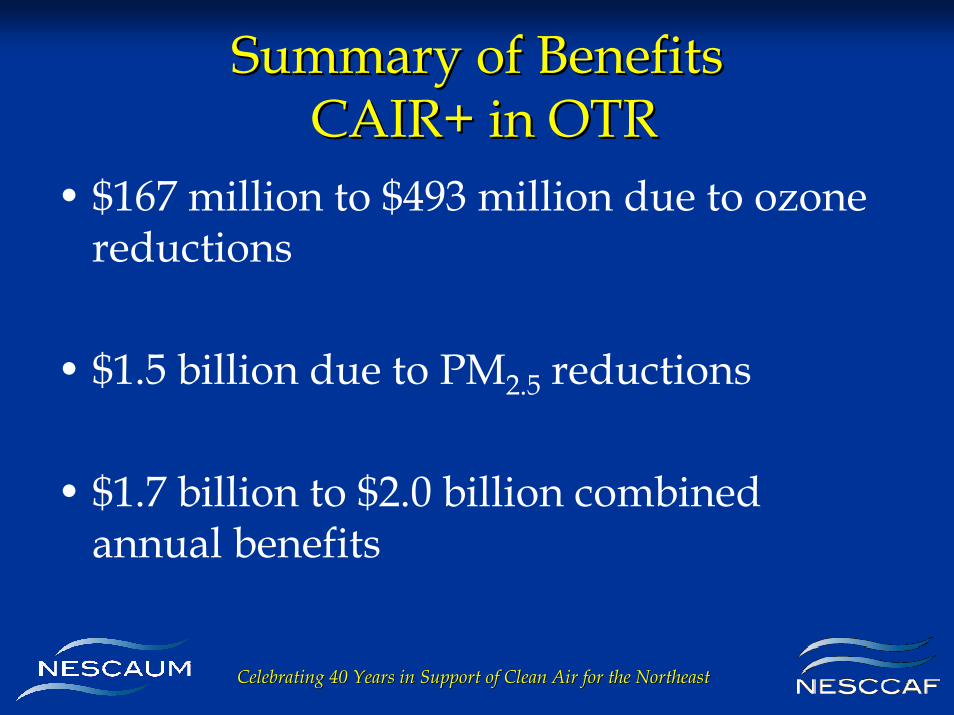
Summary of BenefitsSummary of BenefitsCAIR+ in OTRCAIR+ in OTR
• $167 million to $493 million due to ozone reductions
• $1.5 billion due to PM2.5 reductions
• $1.7 billion to $2.0 billion combined annual benefits
Celebrating 40 Years in Support of Clean Air for the NortheastCelebrating 40 Years in Support of Clean Air for the Northeast
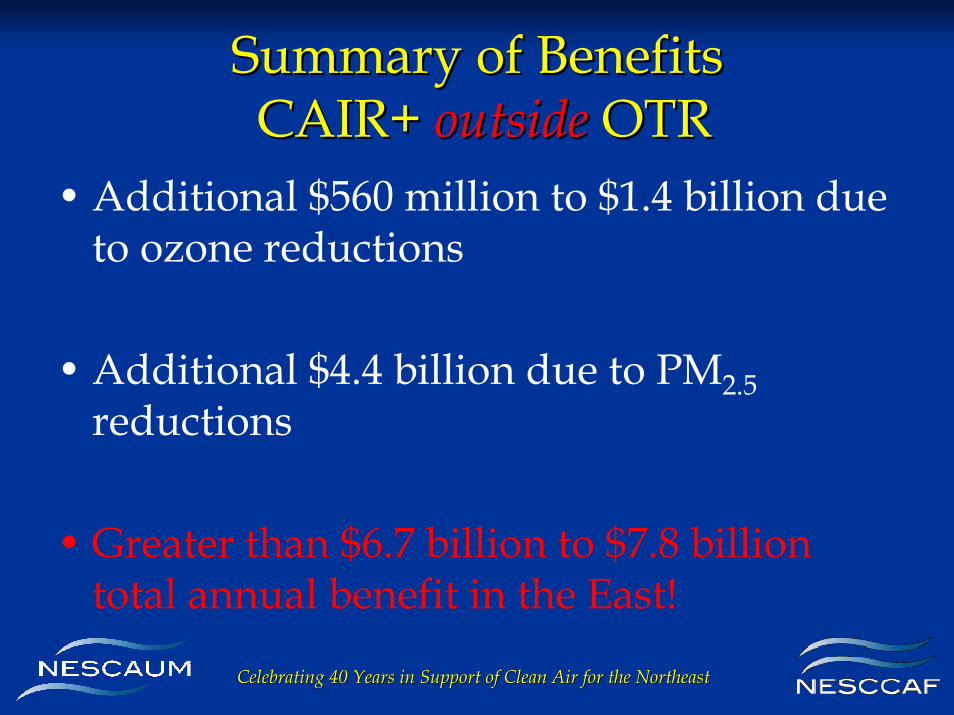
Summary of BenefitsSummary of BenefitsCAIR+ CAIR+ outsideoutside OTROTR
• Additional $560 million to $1.4 billion due to ozone reductions
• Additional $4.4 billion due to PM2.5reductions
• Greater than $6.7 billion to $7.8 billion total annual benefit in the East!
Celebrating 40 Years in Support of Clean Air for the NortheastCelebrating 40 Years in Support of Clean Air for the Northeast
The Clean Air Association of the Northeast States
Thank You!Thank You!
Harmonizing environmental, public health, economic and societal goals