Embed Size (px)
Citation preview

CADSTAR FPGA TRAINING
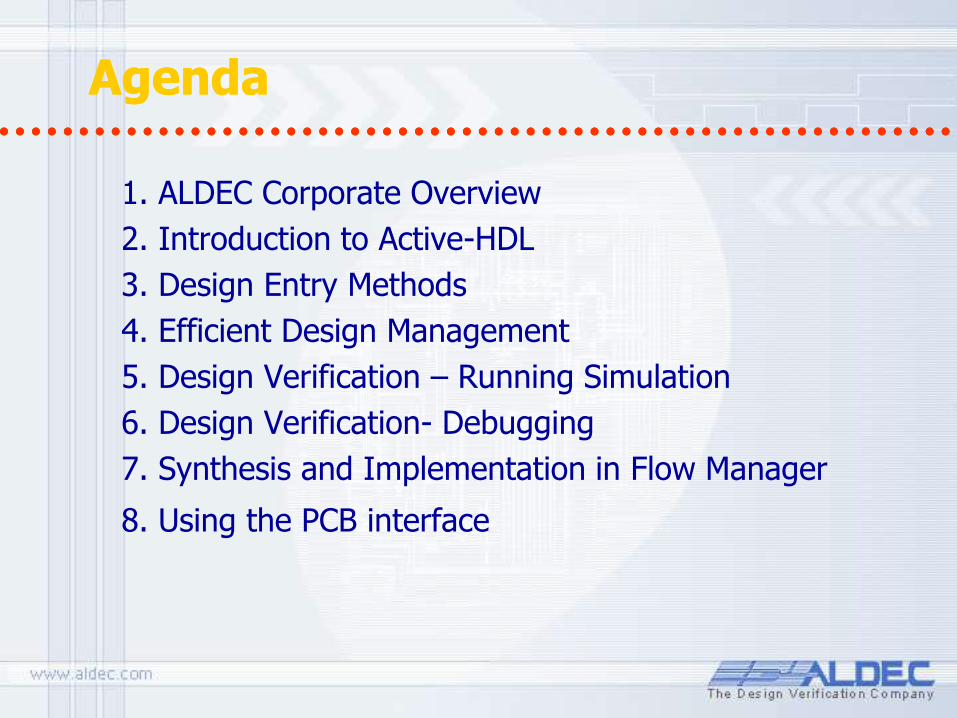
Agenda Agenda
1. ALDEC Corporate Overview
2. Introduction to Active-HDL
3. Design Entry Methods
4. Efficient Design Management
5. Design Verification – Running Simulation
6. Design Verification- Debugging
7. Synthesis and Implementation in Flow Manager
8. Using the PCB interface

Corporate Overview

Aldec Focus - Background
• Founded 1984 – Dr. Stanley Hyduke • Privately held, profitable and 100%
product revenue funded • Leading EDA Technology
– VHDL and Verilog Simulation – SystemVerilog – SystemC Co-Verification – Server Farm Manager – IP Cores – Hardware assisted Acceleration/Emulation
and Prototyping
• Over 30,000 active licenses worldwide • Several key Patents in Verification
Technology • Office Locations:
– Direct Sales and Support • United States • Japan • Canada • France • ROW – Distribution Channel
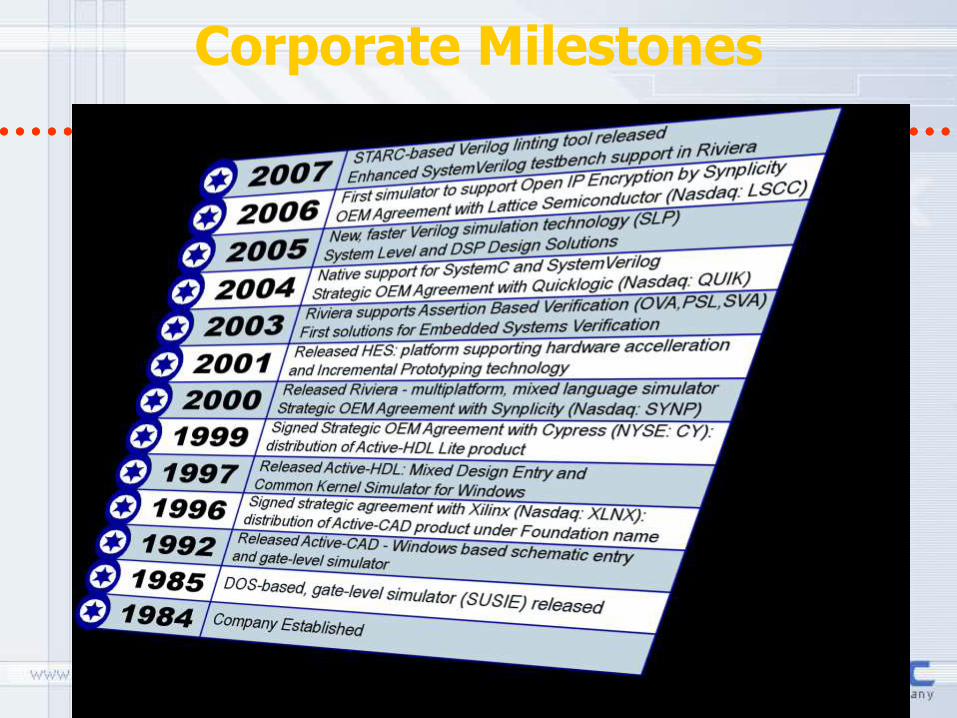
Corporate Milestones
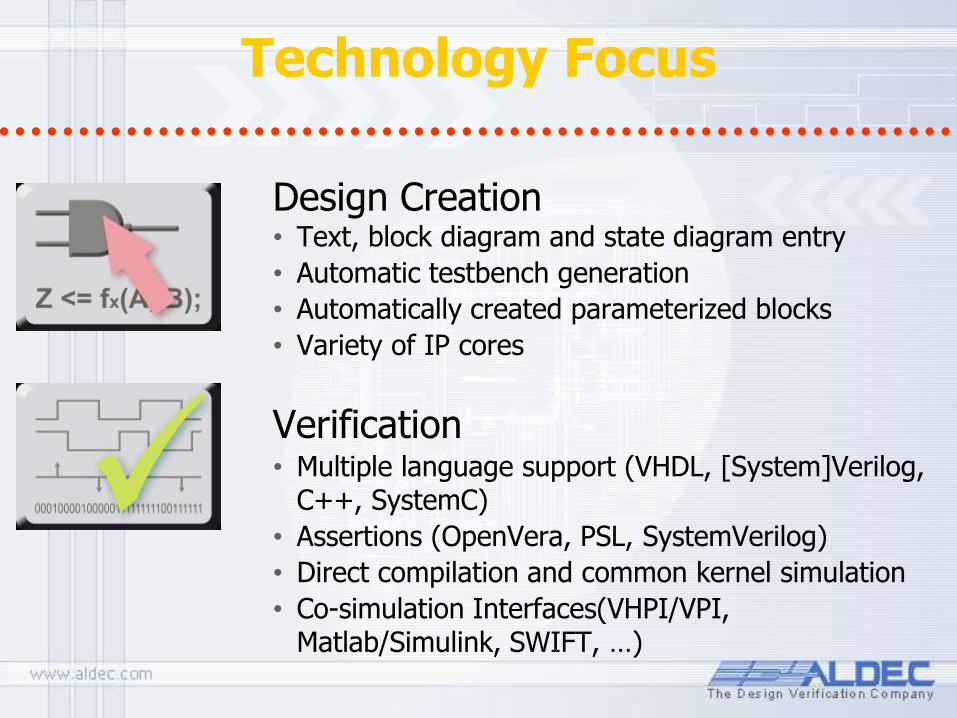
Technology Focus
Design Creation • Text, block diagram and state diagram entry
• Automatic testbench generation
• Automatically created parameterized blocks
• Variety of IP cores
Verification • Multiple language support (VHDL, [System]Verilog,
C++, SystemC)
• Assertions (OpenVera, PSL, SystemVerilog)
• Direct compilation and common kernel simulation
• Co-simulation Interfaces(VHPI/VPI, Matlab/Simulink, SWIFT, …)
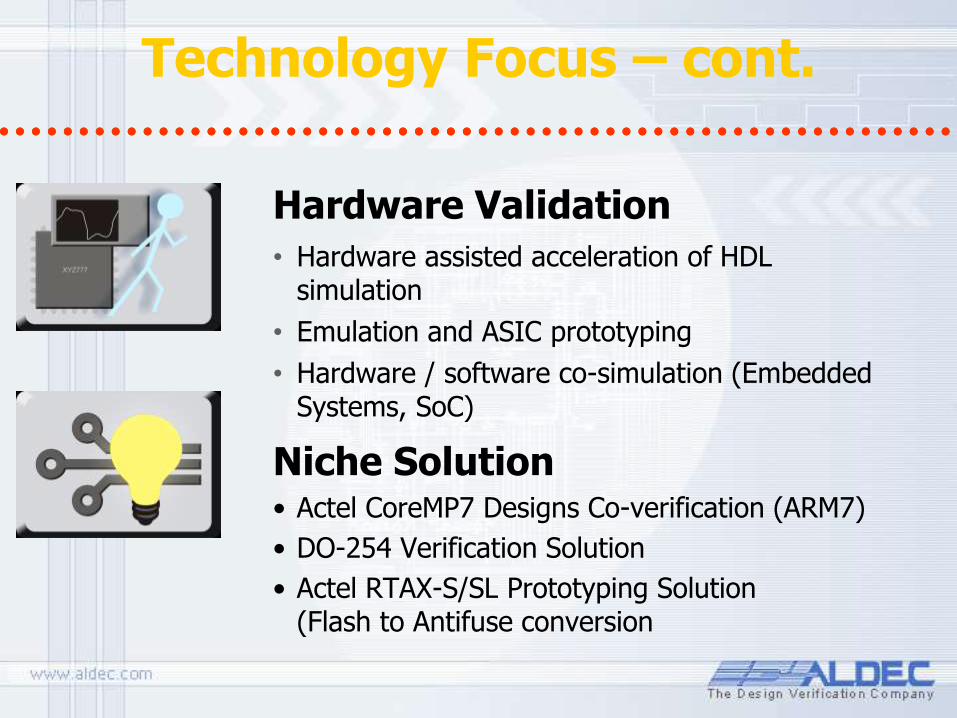
Technology Focus – cont.
Hardware Validation
• Hardware assisted acceleration of HDL simulation
• Emulation and ASIC prototyping
• Hardware / software co-simulation (Embedded Systems, SoC)
Niche Solution • Actel CoreMP7 Designs Co-verification (ARM7)
• DO-254 Verification Solution
• Actel RTAX-S/SL Prototyping Solution (Flash to Antifuse conversion

Aldec Partners

Product Definition
• Active-HDL – Target FPGA Market – Windows Only – Graphical Entry and Documentation – Mixed Language Simulation
• Riviera-Pro – Target ASIC/FPGA Market – Linux, Solaris and Windows (32/64 bit) – Mixed Language Simulation/Debugging
• SFM – Server Farm Manager – Manage 100’s of HDL Simulation from central location
HES – Hardware based Debugging Acceleration
(FPGA based board with software – PCI-Express interface) – Acceleration, Emulation and Prototyping Support – Patents
• Automatic ASIC to FPGA Clock Conversion • Smart ClockTM used in Hardware/Software Co-Verification • “Hardware-In-The-Loop” Technology
• ALINT • - Comprehensive RTL design checker
- Based on STARC design rules, best practices for Verilog - The pre-packaged set of STARC rules allows designers to easily check HDL code for
synthesizability, testability, and reusability – Dynamic Control – Synthesis Emulation Engine – Chip-Level Netlist Checks

EE Times 2006 EDA Study
76%
72%
67%
67%
64%
54%
39%
38%
38%
73%
66%
44%
71%
63%
46%
49%
46%
30%
Synplicity
Xilinx
Aldec
Altera
Mentor Graphics
Cadence Design Systems
Synopsys
Actel
Lattice Semiconductor
2006 North America (n=106)
2005 NA (n=63)
Satisfaction with vendor support
North America
2006 vs 2005 scores

Introduction to Active-HDL SETTING THE STANDARD IN • PERFORMANCE • ACCURACY • INTEGRATION
Introduction to Active-HDL SETTING THE STANDARD IN • PERFORMANCE • ACCURACY • INTEGRATION
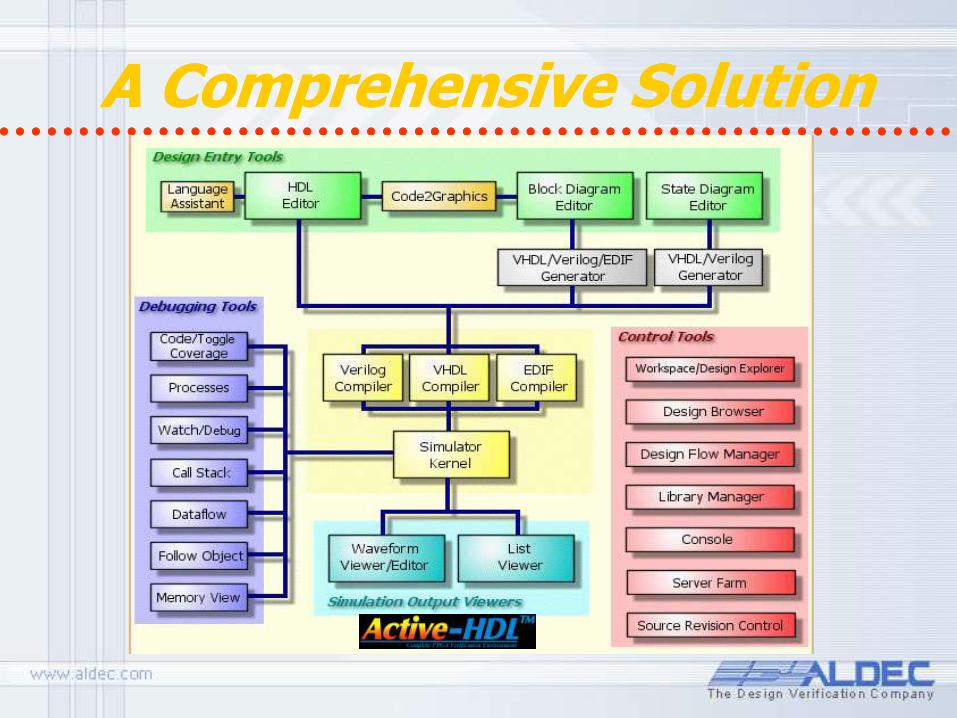
A Comprehensive Solution A Comprehensive Solution

Design Flow Manager Design Flow Manager
• Design Flow Manager
interfaces to 87 different
3rd party tools
• Manages the HDL, C and
Physical Synthesis Tools
• Runs the implementation for
any FPGA vendor
• Generates TCL scripts for
advanced automation
• Runs the simulation at all
stages of design
• Invokes external analysis tools provided by silicon vendors

Advanced HDL Editor Advanced HDL Editor
• Keyword and Template auto-completion
• Automatic structure generation of enhanced
legibility
• Built-in customizable language
assistant
• Source code auto-formatting
• Advanced Find, Find in Files and
replace, Column Selection
• Presentation of simulation values
• Navigation Bookmarks
• Ability to interface to third party text
editors
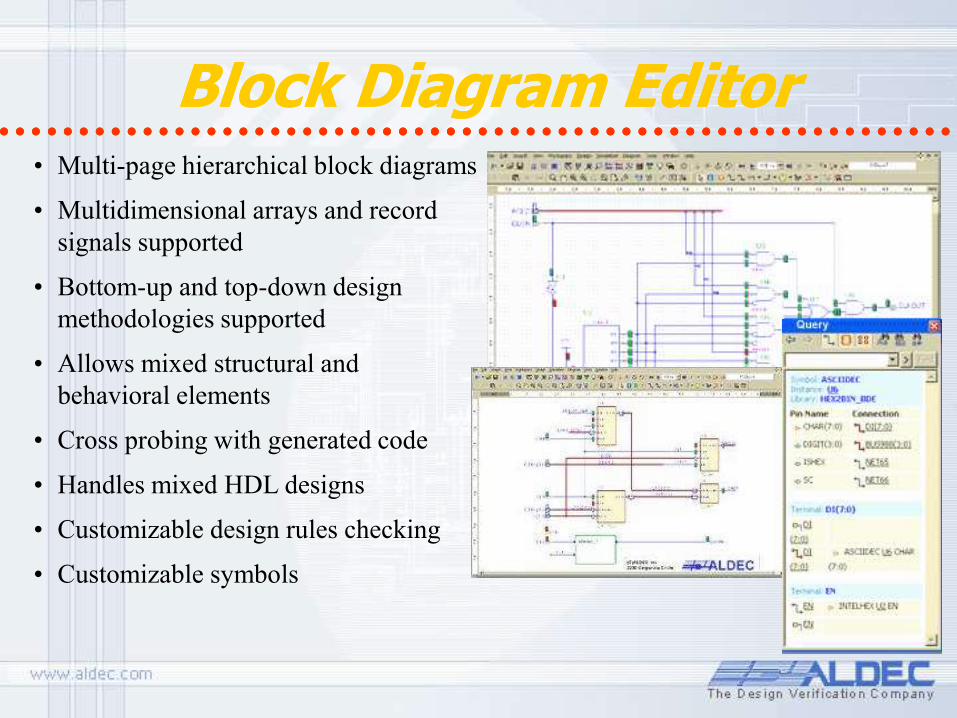
Block Diagram Editor Block Diagram Editor • Multi-page hierarchical block diagrams
• Multidimensional arrays and record
signals supported
• Bottom-up and top-down design
methodologies supported
• Allows mixed structural and
behavioral elements
• Cross probing with generated code
• Handles mixed HDL designs
• Customizable design rules checking
• Customizable symbols
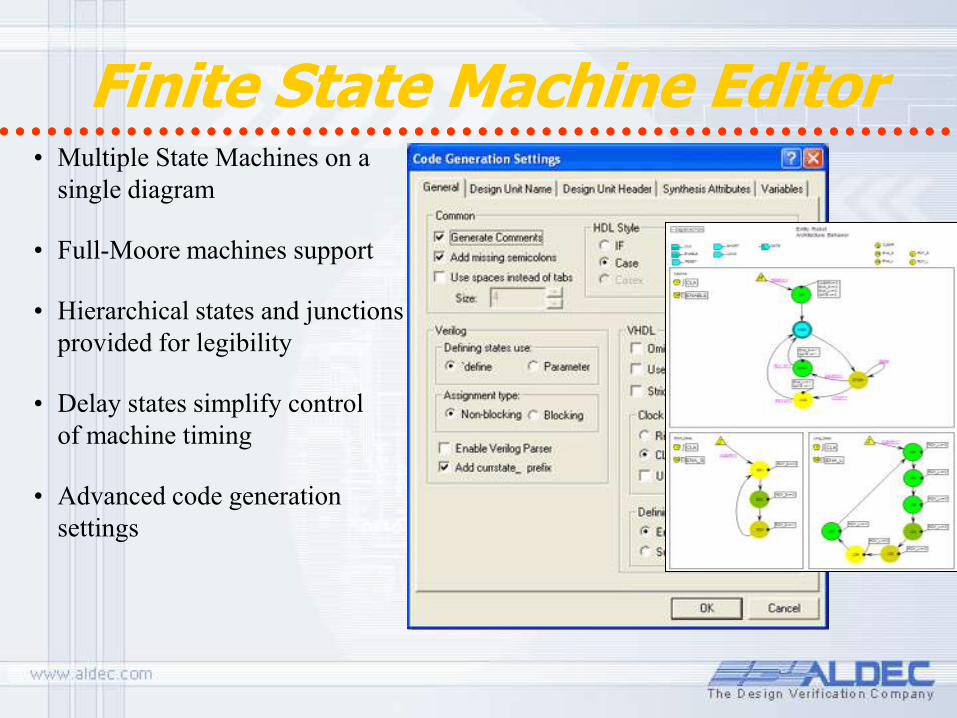
Finite State Machine Editor Finite State Machine Editor • Multiple State Machines on a
single diagram
• Full-Moore machines support
• Hierarchical states and junctions
provided for legibility
• Delay states simplify control
of machine timing
• Advanced code generation
settings

Debugging Tools Debugging Tools • View simulation results in
• Waveform Viewer
• List Viewer
• Watch
• Trace code execution with
• Processes
• Call Stack
• Breakpoint Manager
• Code Breakpoint
• Signal Breakpoint
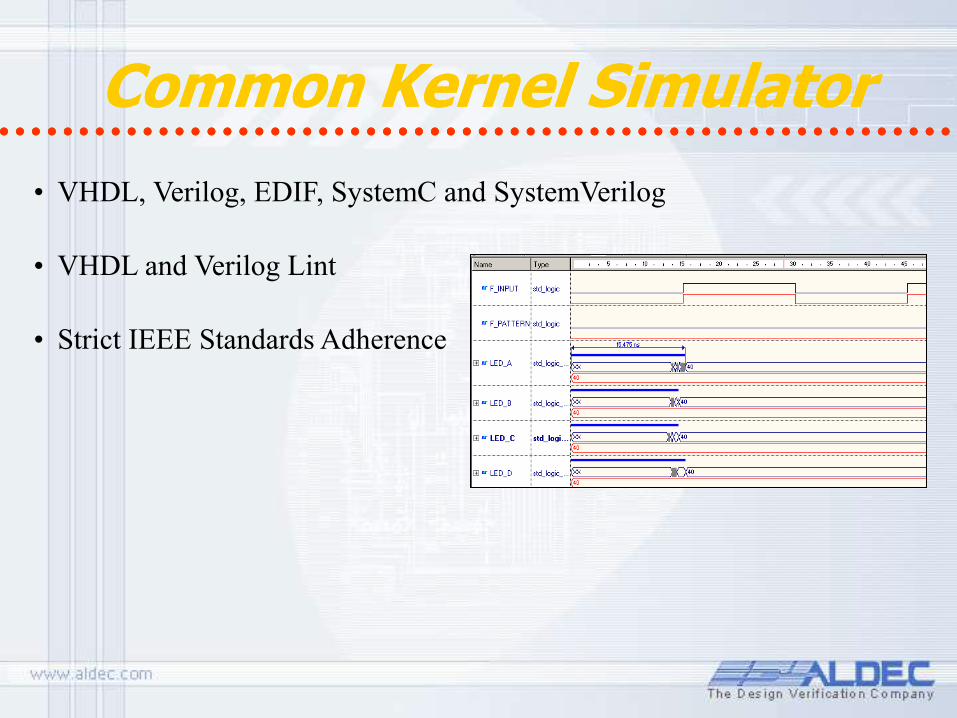
Common Kernel Simulator Common Kernel Simulator
• VHDL, Verilog, EDIF, SystemC and SystemVerilog
• VHDL and Verilog Lint
• Strict IEEE Standards Adherence
Design Entry Methods
Creating HDL Text Modules
Part 1
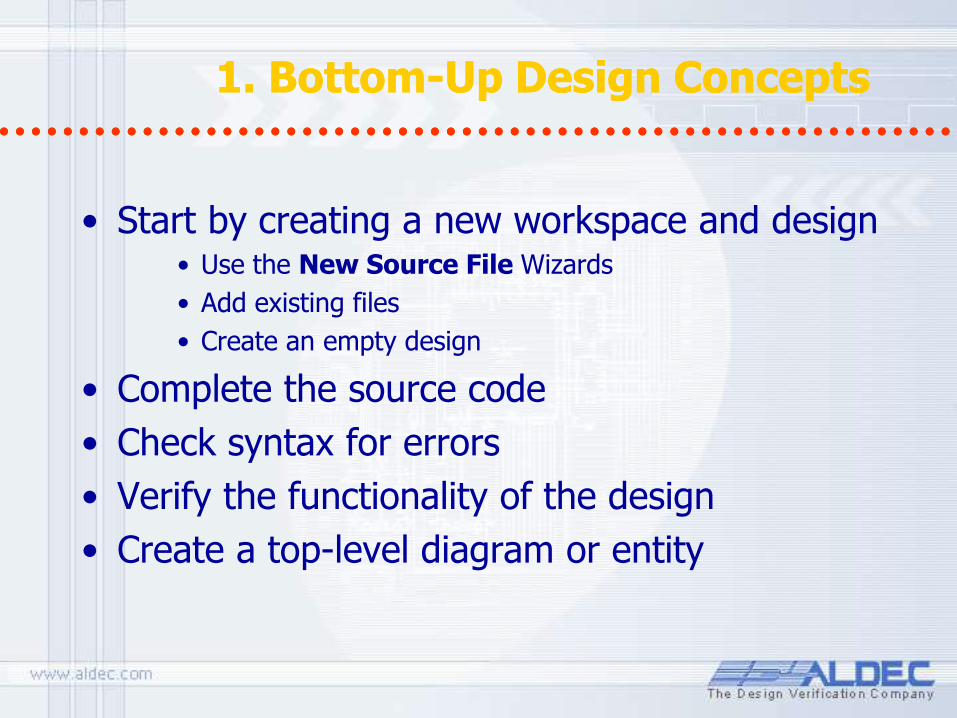
1. Bottom-Up Design Concepts 1. Bottom-Up Design Concepts
• Start by creating a new workspace and design • Use the New Source File Wizards
• Add existing files
• Create an empty design
• Complete the source code
• Check syntax for errors
• Verify the functionality of the design
• Create a top-level diagram or entity
1.1 Creating Bottom-Up Design 1.1 Creating Bottom-Up Design
• First, create a new workspace (File | New Workspace). You will be asked to specify its name. To set up a new design, you can also select the Design option in the File| New menu.
• In the New Design Wizard window, you can choose the design entry method:
– To add existing files, check the Add existing resource files option. Select the source files in the Open window and finish the design creation by clicking the Finish button.
– To import a design from Active-CAD, check the Import a design from Active-CAD option.
– To create an empty design, check the Create an empty design option.
• Type the name of the design, for example BottomUp and click the Next button.
See 1.1 ref. A for more details

1.1 Ref. A The Design Wizards 1.1 Ref. A The Design Wizards
The Design Wizard simplifies the process that guides you through initial stages of design development. By using the Design Wizard, you will create a new design.
• Check the Create an empty design option and click Next.
1.1 Ref. B The Design Wizards 1.1 Ref. B The Design Wizards
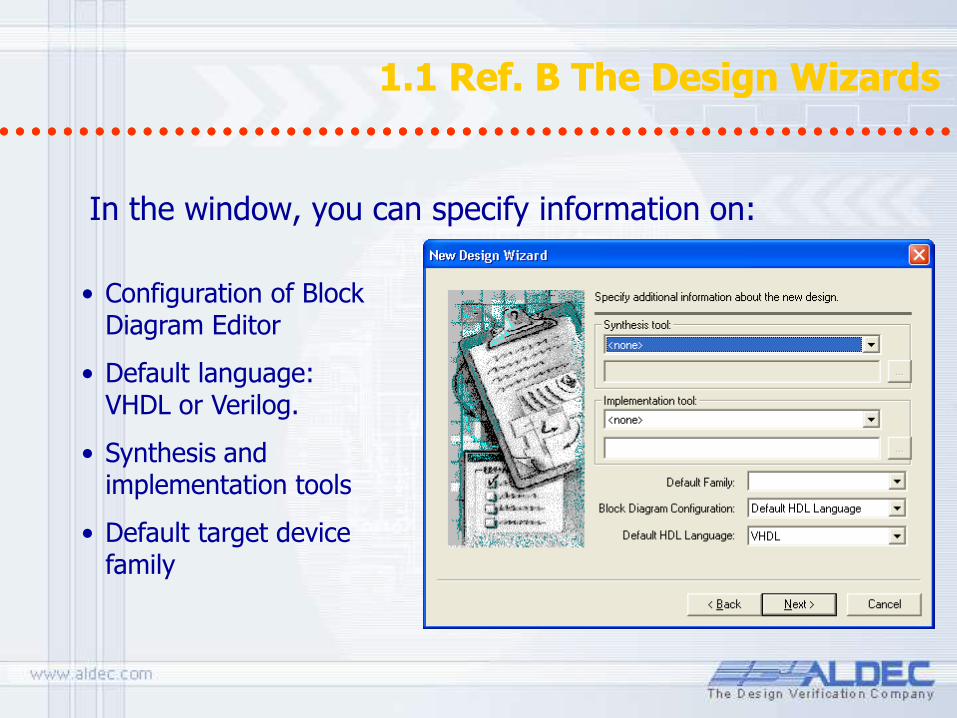
In the window, you can specify information on:
• Configuration of Block Diagram Editor
• Default language: VHDL or Verilog.
• Synthesis and implementation tools
• Default target device family
1.1 Ref. C The Design Wizards 1.1 Ref. C The Design Wizards
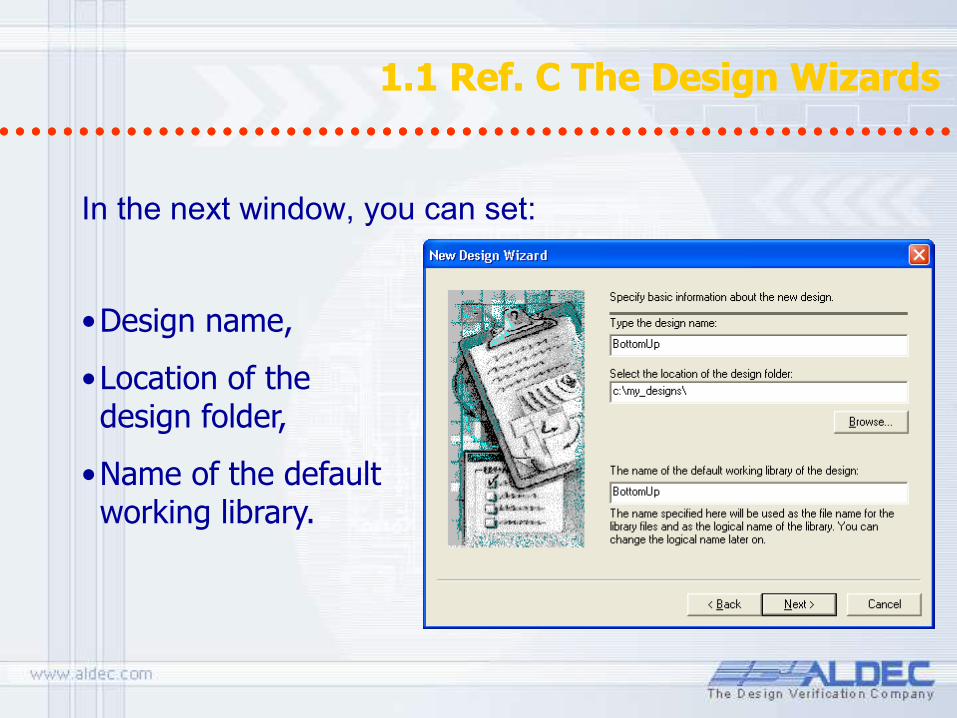
In the next window, you can set:
•Design name,
•Location of the design folder,
•Name of the default working library.
1.1 Ref. D The Design Wizards 1.1 Ref. D The Design Wizards
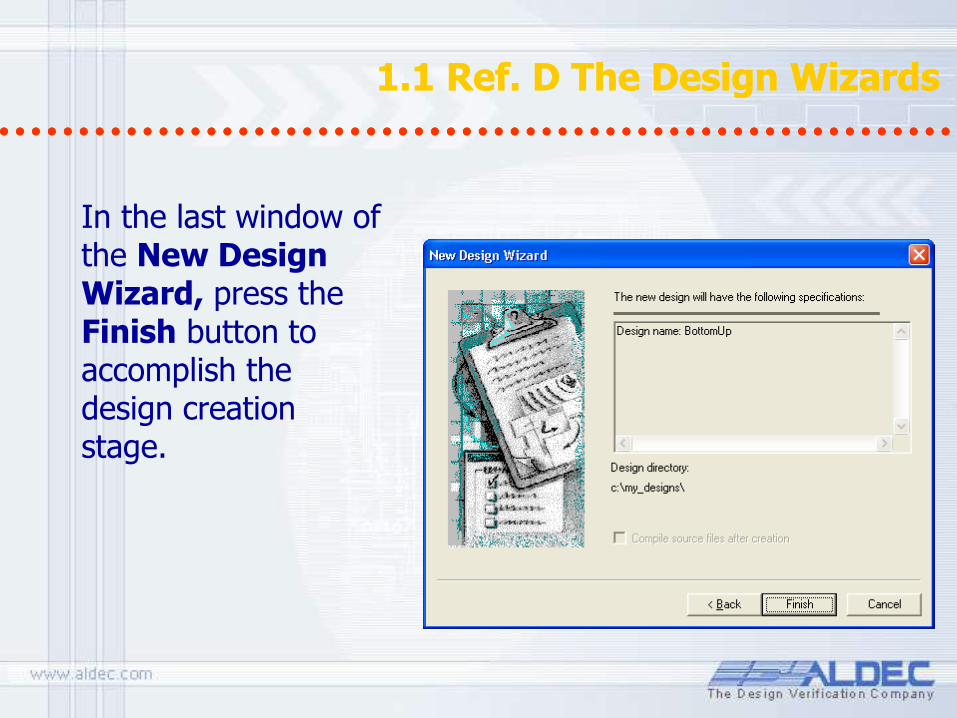
In the last window of the New Design Wizard, press the Finish button to accomplish the design creation stage.
1.2 Creating Bottom-Up Design 1.2 Creating Bottom-Up Design
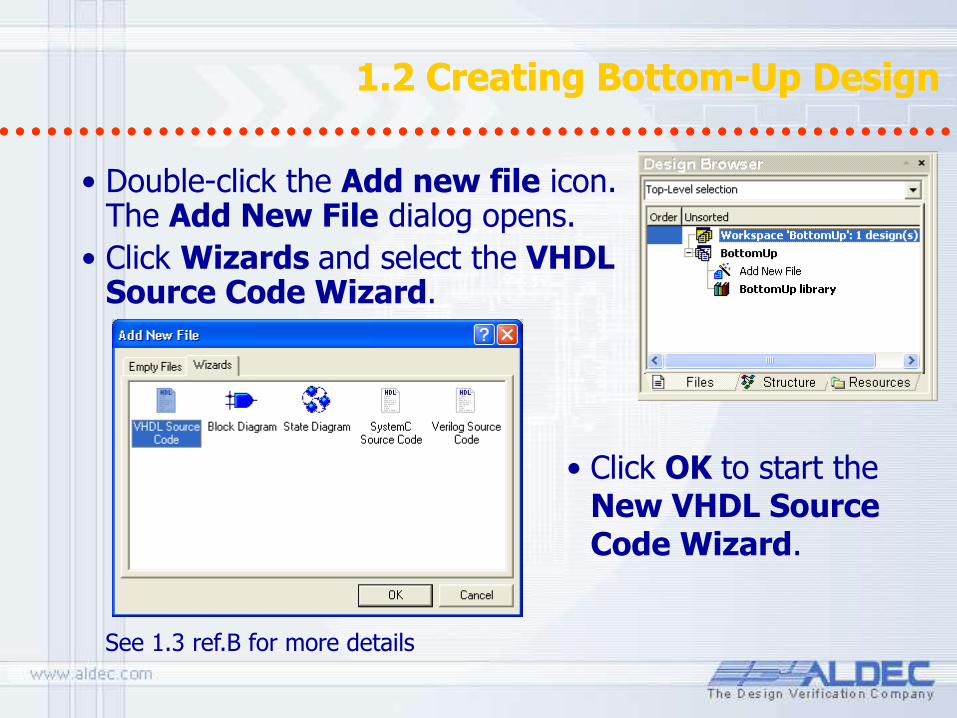
• Double-click the Add new file icon. The Add New File dialog opens.
• Click Wizards and select the VHDL Source Code Wizard.
See 1.3 ref.B for more details
• Click OK to start the New VHDL Source Code Wizard.

1.3 Creating Bottom-Up Design 1.3 Creating Bottom-Up Design
• Check Add the generated file to the design option and advance by clicking the Next button. Type the name of the file: counter. You can also use the Browse button to add an existing file at this stage.
• Define the following ports: Input Ports: - CLK
- RESET
Output Port: - Q [3:0]
• Click the Finish button.
1.3 Ref. B Design Wizard - Ports 1.3 Ref. B Design Wizard - Ports
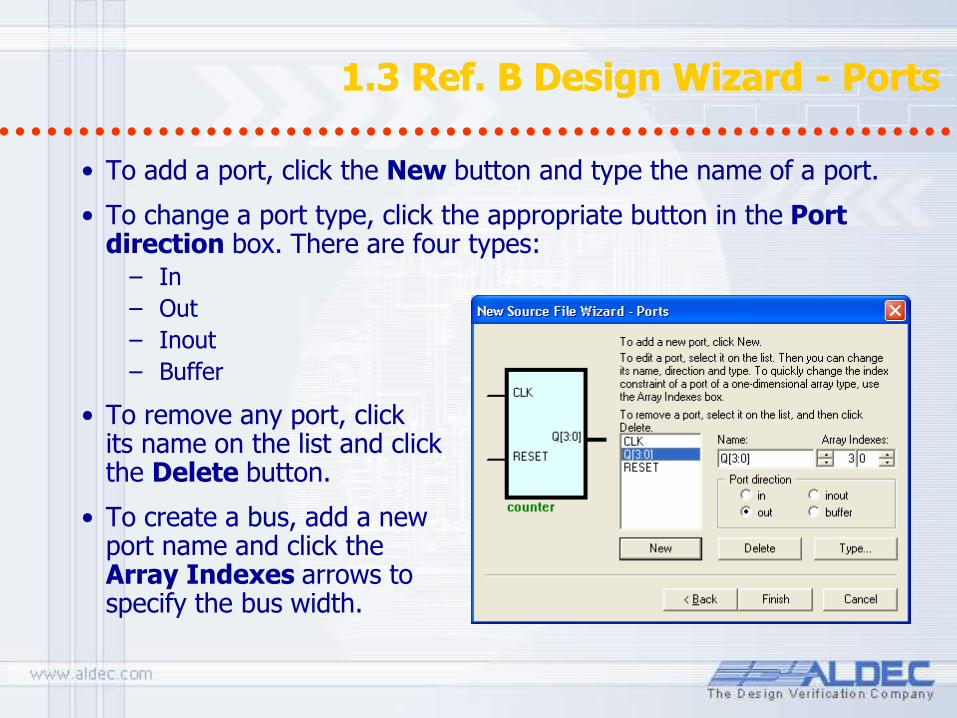
• To add a port, click the New button and type the name of a port.
• To change a port type, click the appropriate button in the Port direction box. There are four types:
– In
– Out
– Inout
– Buffer
• To remove any port, click its name on the list and click the Delete button.
• To create a bus, add a new port name and click the Array Indexes arrows to specify the bus width.

1.4 Creating Bottom-Up Design 1.4 Creating Bottom-Up Design
• HDL Editor window contains the skeleton of the counter.
• Click the icon to open the Language Assistant window.
• Open the Tutorial branch and select the Counter template.
• Drag the Counter template to the HDL Editor window and drop it after the: --Enter your statements here line.
1.4 Ref. A Language Assistant 1.4 Ref. A Language Assistant
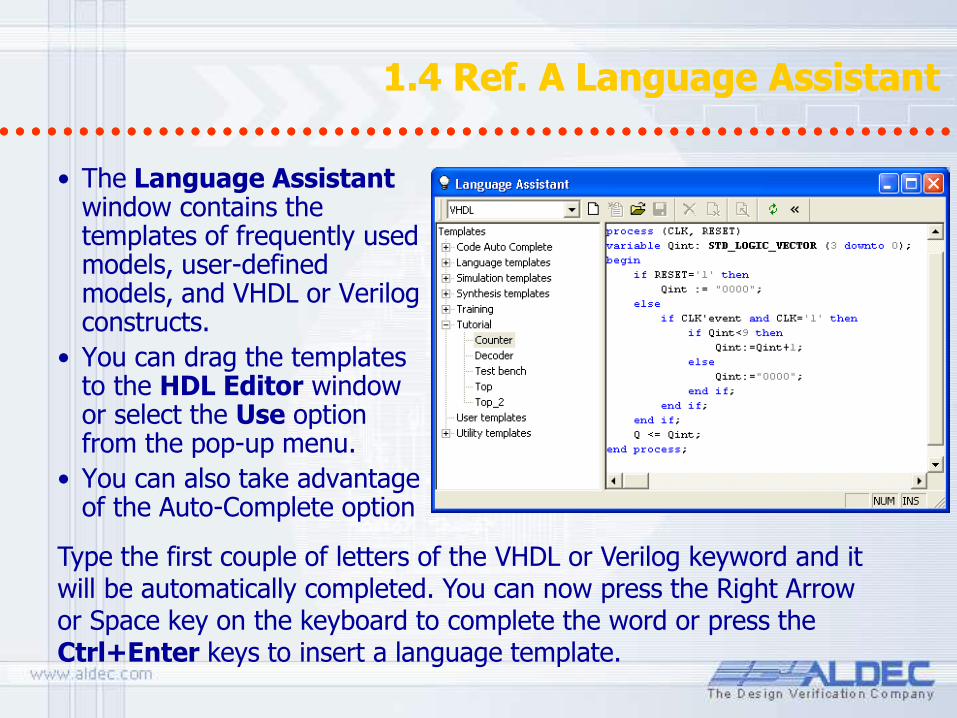
• The Language Assistant window contains the templates of frequently used models, user-defined models, and VHDL or Verilog constructs.
• You can drag the templates to the HDL Editor window or select the Use option from the pop-up menu.
• You can also take advantage of the Auto-Complete option
Type the first couple of letters of the VHDL or Verilog keyword and it will be automatically completed. You can now press the Right Arrow or Space key on the keyboard to complete the word or press the Ctrl+Enter keys to insert a language template.
1.5 Creating Bottom-Up Design 1.5 Creating Bottom-Up Design
The HDL Editor offers ways to efficiently manage the code by performing the following operations:
• Enables keyword coloring for VHDL, Verilog, and C/C++/Handel-C
• Increases indentation of selected blocks
• Comments selected part of code
• Creates groups out of highlighted blocks
• Automatically creates the structure for the source code
• Auto-formats the source code
• Sets bookmarks in the code for easy navigation
• Highlights incorrect constructs after compilation
• Finds and replaces given strings
Note: Most of the above functions also have counteractions.
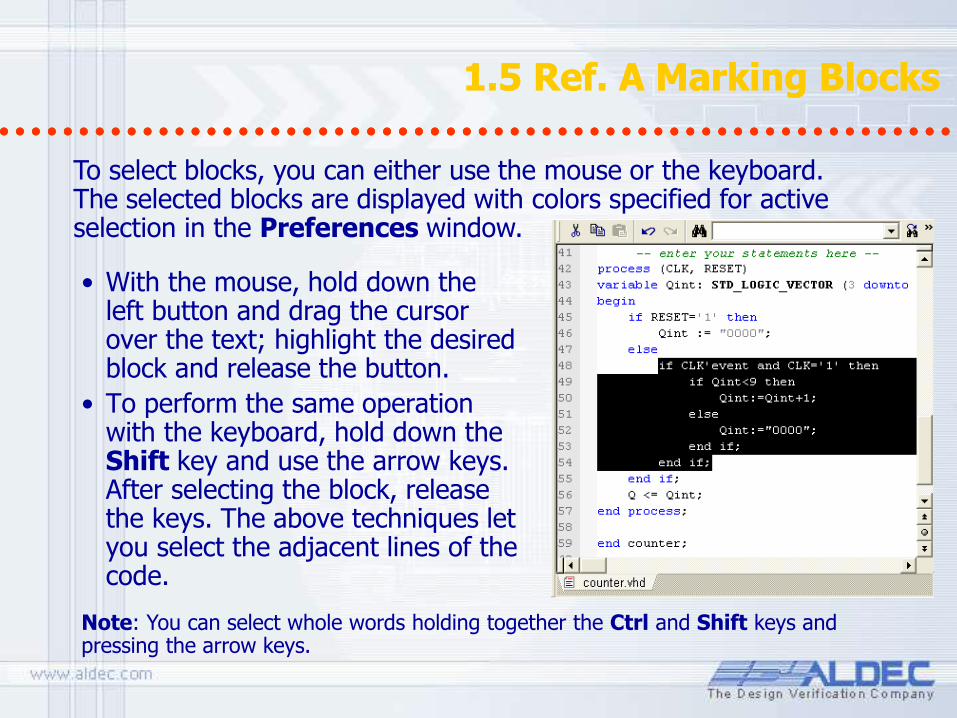
1.5 Ref. A Marking Blocks 1.5 Ref. A Marking Blocks
• With the mouse, hold down the left button and drag the cursor over the text; highlight the desired block and release the button.
• To perform the same operation with the keyboard, hold down the Shift key and use the arrow keys. After selecting the block, release the keys. The above techniques let you select the adjacent lines of the code.
To select blocks, you can either use the mouse or the keyboard. The selected blocks are displayed with colors specified for active selection in the Preferences window.
Note: You can select whole words holding together the Ctrl and Shift keys and pressing the arrow keys.

1.5 Ref. B Marking Columns 1.5 Ref. B Marking Columns
• Hold down the Alt key and move the mouse pointer while pressing its left button. Release the mouse button after selecting the desired section of code.
• Click the column selection button or press Alt+C combination and then use the Shift key and the Arrows to select a rectangular block. To disable column selection use either the button or keystroke combination again.
To select columns, you can either use the mouse or the keyboard. The selected blocks are displayed with colors specified for active selection in the Preferences window.
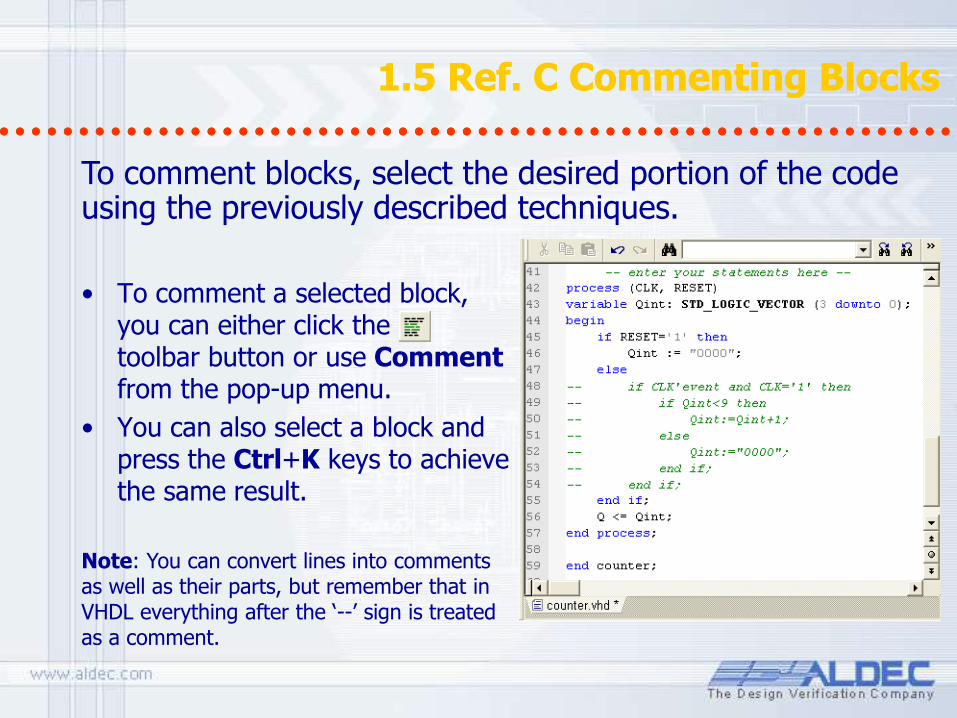
1.5 Ref. C Commenting Blocks 1.5 Ref. C Commenting Blocks
• To comment a selected block, you can either click the toolbar button or use Comment from the pop-up menu.
• You can also select a block and press the Ctrl+K keys to achieve the same result.
To comment blocks, select the desired portion of the code using the previously described techniques.
Note: You can convert lines into comments as well as their parts, but remember that in VHDL everything after the ‘--’ sign is treated as a comment.
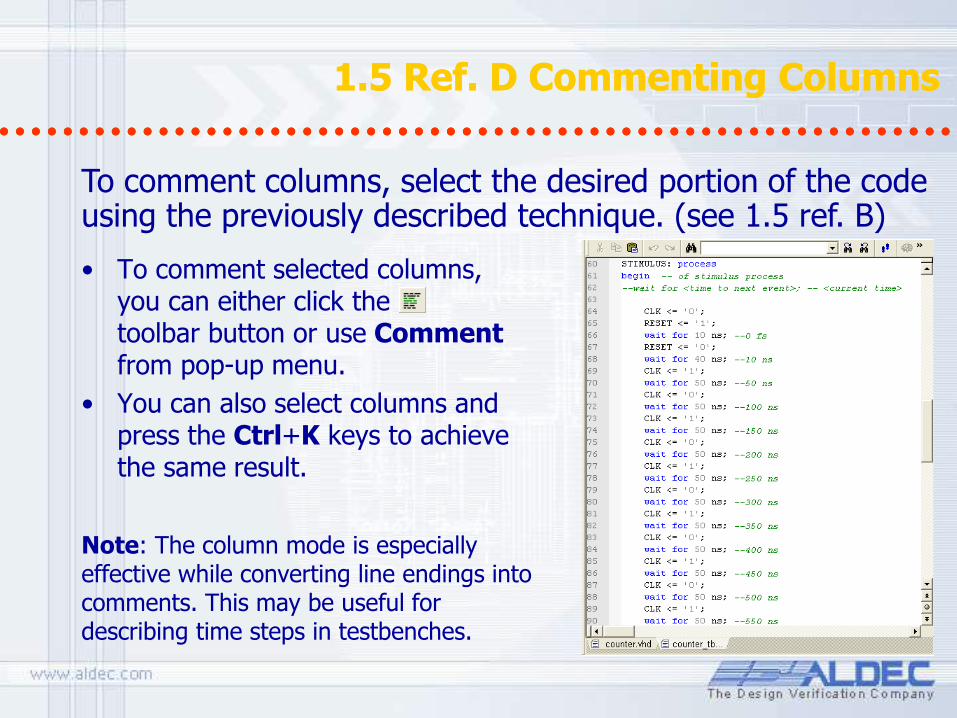
1.5 Ref. D Commenting Columns 1.5 Ref. D Commenting Columns
• To comment selected columns, you can either click the toolbar button or use Comment from pop-up menu.
• You can also select columns and press the Ctrl+K keys to achieve the same result.
To comment columns, select the desired portion of the code using the previously described technique. (see 1.5 ref. B)
Note: The column mode is especially effective while converting line endings into comments. This may be useful for describing time steps in testbenches.
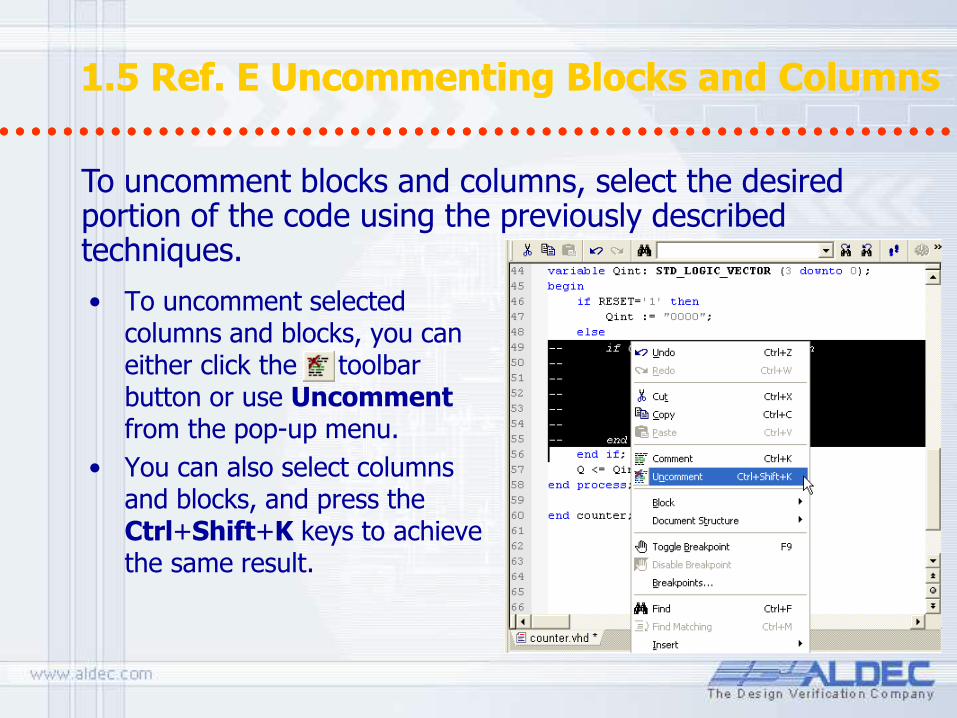
• To uncomment selected columns and blocks, you can either click the toolbar button or use Uncomment from the pop-up menu.
• You can also select columns and blocks, and press the Ctrl+Shift+K keys to achieve the same result.
1.5 Ref. E Uncommenting Blocks and Columns 1.5 Ref. E Uncommenting Blocks and Columns
To uncomment blocks and columns, select the desired portion of the code using the previously described techniques.
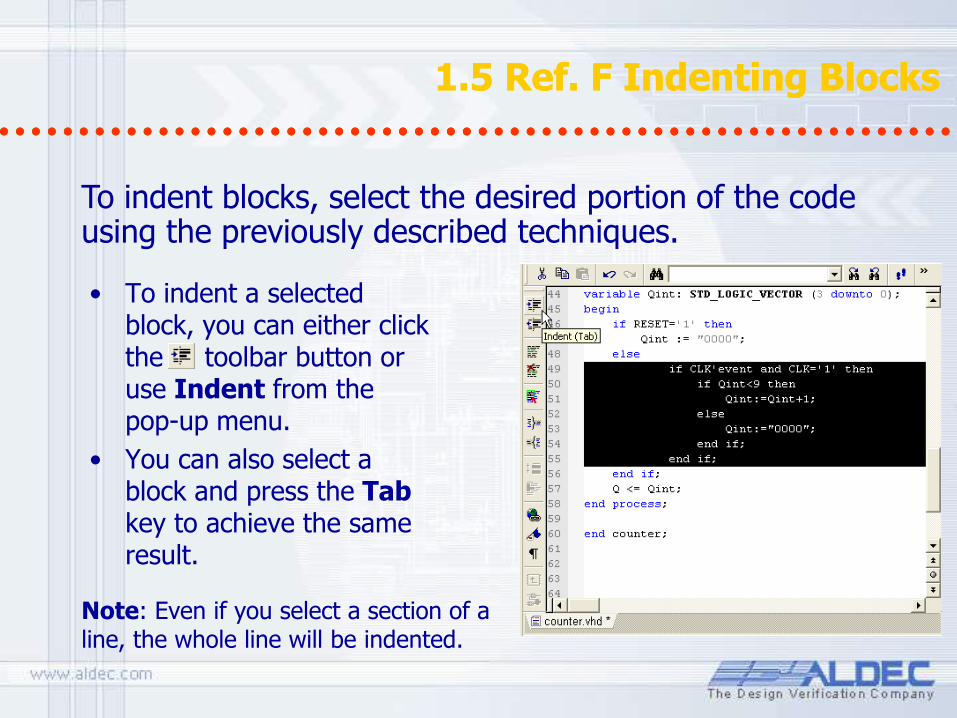
1.5 Ref. F Indenting Blocks 1.5 Ref. F Indenting Blocks
• To indent a selected block, you can either click the toolbar button or use Indent from the pop-up menu.
• You can also select a block and press the Tab key to achieve the same result.
To indent blocks, select the desired portion of the code using the previously described techniques.
Note: Even if you select a section of a line, the whole line will be indented.
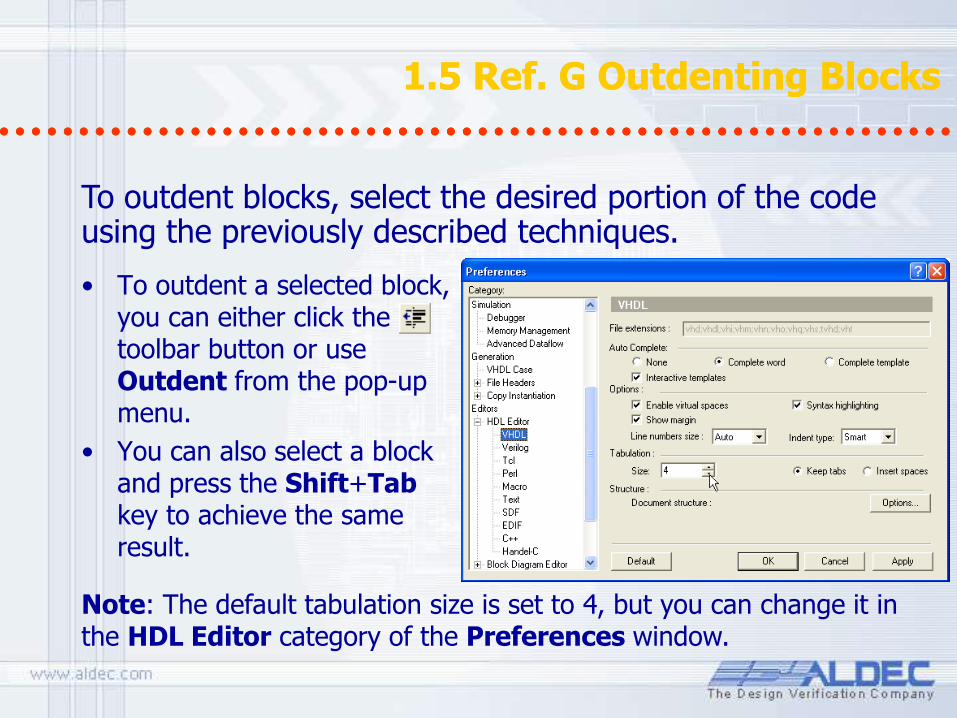
1.5 Ref. G Outdenting Blocks 1.5 Ref. G Outdenting Blocks
• To outdent a selected block, you can either click the toolbar button or use Outdent from the pop-up menu.
• You can also select a block and press the Shift+Tab key to achieve the same result.
To outdent blocks, select the desired portion of the code using the previously described techniques.
Note: The default tabulation size is set to 4, but you can change it in the HDL Editor category of the Preferences window.

1.5 Ref. H Improved Auto Complete 1.5 Ref. H Improved Auto Complete
• The HDL Editor automatically completes VHDL, Verilog keywords based on the initial letters that you type. Similar keywords can be exchanged with the TAB key. The Auto-Complete feature can automatically complete both words and the whole HDL templates.
• The Interactive templates option allows users to invoke a dialog window before a template is created. In the dialog you can enter, for example, the name of the identifier for an entity, architecture, module, etc.
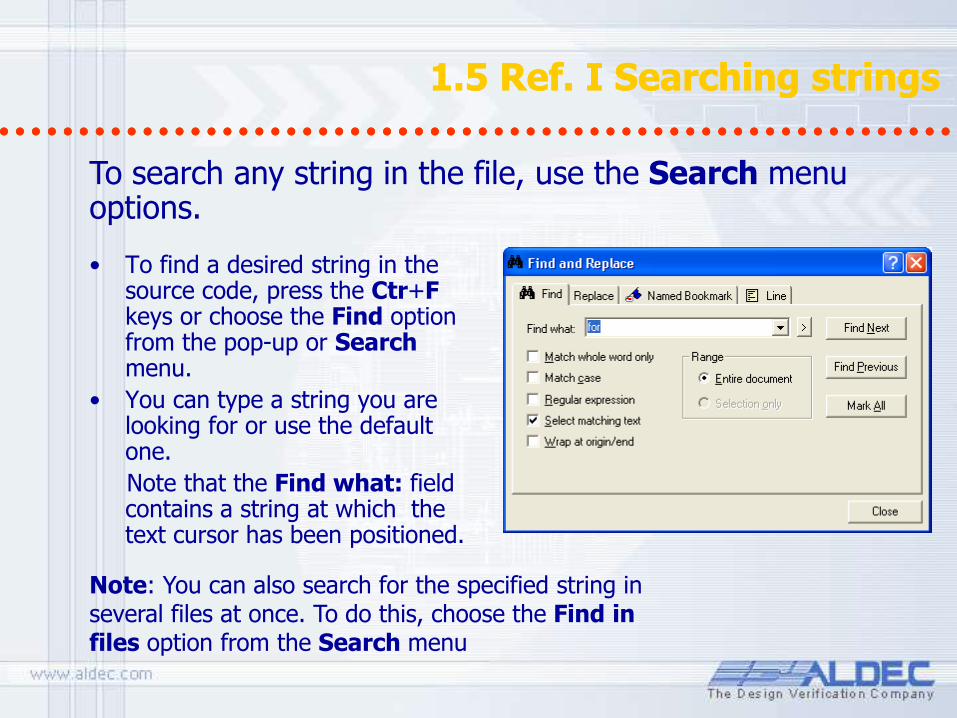
1.5 Ref. I Searching strings 1.5 Ref. I Searching strings
• To find a desired string in the source code, press the Ctr+F keys or choose the Find option from the pop-up or Search menu.
• You can type a string you are looking for or use the default one.
Note that the Find what: field contains a string at which the text cursor has been positioned.
Note: You can also search for the specified string in several files at once. To do this, choose the Find in files option from the Search menu
To search any string in the file, use the Search menu options.

1.5 Ref. J Replacing strings 1.5 Ref. J Replacing strings
• To replace a desired string in the source code, press the Ctrl+H keys. You can also choose the Replace option from the pop-up or the Search menu.
• Type the string you want to replace or use the automatically inserted one.
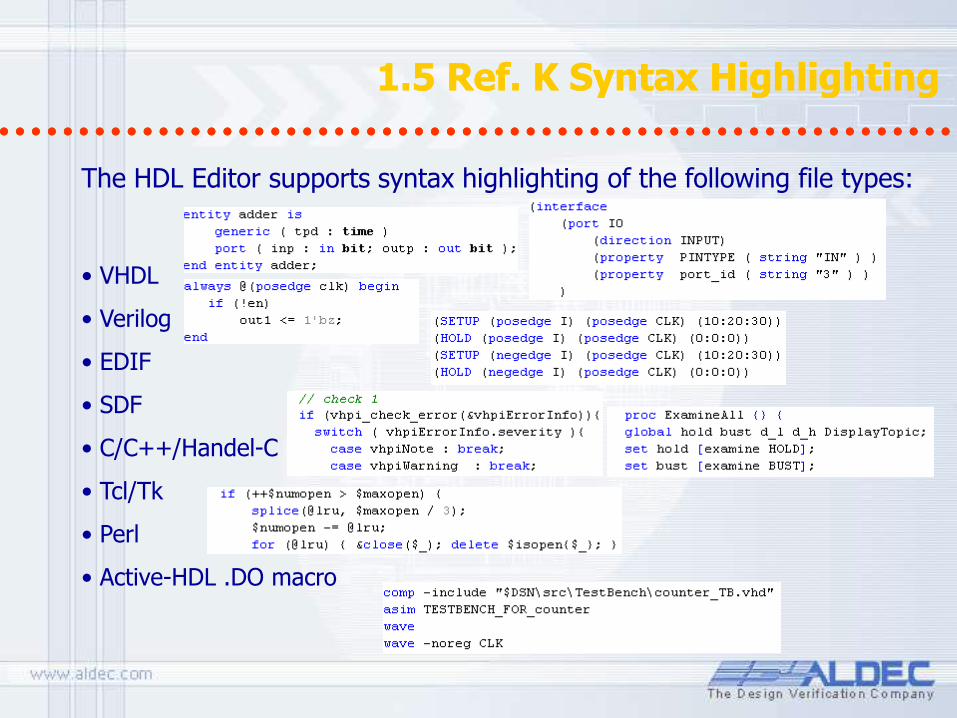
1.5 Ref. K Syntax Highlighting 1.5 Ref. K Syntax Highlighting
The HDL Editor supports syntax highlighting of the following file types:
• VHDL
• Verilog
• EDIF
• SDF
• C/C++/Handel-C
• Tcl/Tk
• Perl
• Active-HDL .DO macro
1.6 Navigation and Bookmarks 1.6 Navigation and Bookmarks
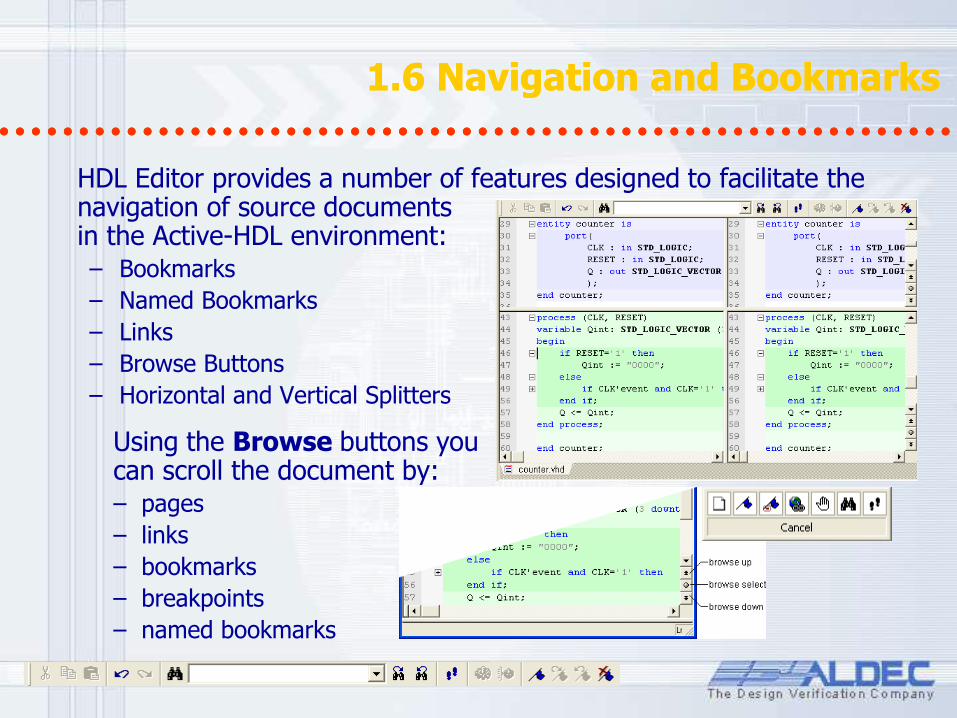
HDL Editor provides a number of features designed to facilitate the navigation of source documents in the Active-HDL environment: – Bookmarks
– Named Bookmarks
– Links
– Browse Buttons
– Horizontal and Vertical Splitters
Using the Browse buttons you can scroll the document by: – pages
– links
– bookmarks
– breakpoints
– named bookmarks

1.6 Ref. A Using Bookmarks 1.6 Ref. A Using Bookmarks
• To toggle a bookmark in the code, click the button or press the Ctrl+F2 keyboard keys.
• To navigate between the bookmarks use the buttons.
• To remove all bookmarks from the code use the button.
Bookmarks facilitate navigation through long documents. You can place bookmarks in distant regions of the edited document, and then quickly move the insertion point from one bookmark to another.
Note: All of these functions can be invoked from the Search menu.
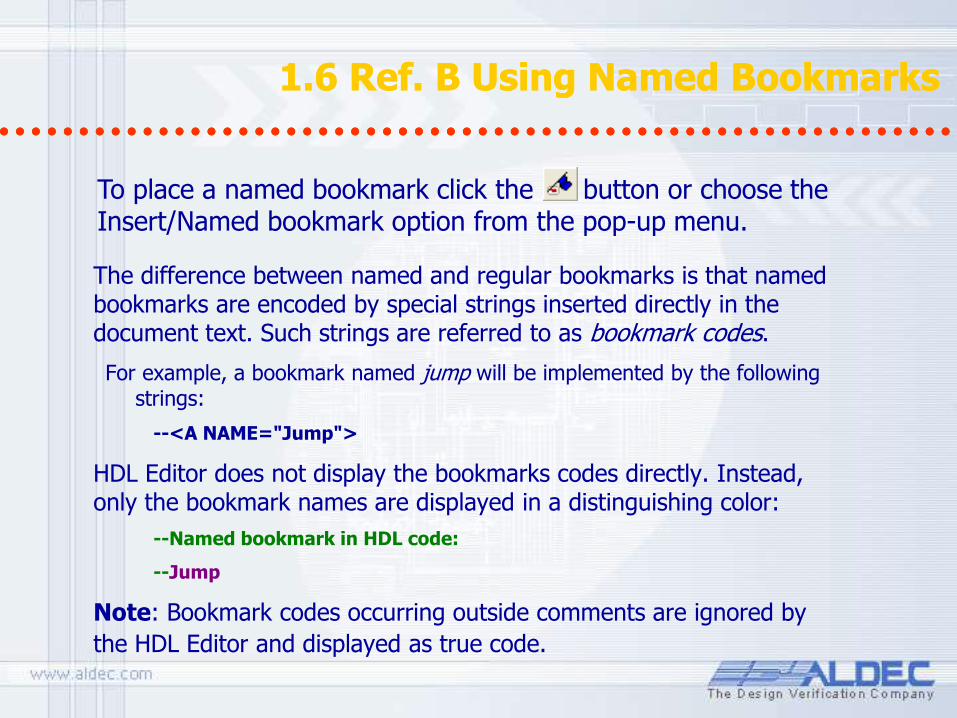
1.6 Ref. B Using Named Bookmarks 1.6 Ref. B Using Named Bookmarks
The difference between named and regular bookmarks is that named bookmarks are encoded by special strings inserted directly in the document text. Such strings are referred to as bookmark codes.
For example, a bookmark named jump will be implemented by the following strings:
--<A NAME="Jump">
HDL Editor does not display the bookmarks codes directly. Instead, only the bookmark names are displayed in a distinguishing color:
--Named bookmark in HDL code:
--Jump
Note: Bookmark codes occurring outside comments are ignored by
the HDL Editor and displayed as true code.
To place a named bookmark click the button or choose the Insert/Named bookmark option from the pop-up menu.

1.6 Ref. C Smart Indent and Auto Indent 1.6 Ref. C Smart Indent and Auto Indent
HDL Editor provides two features designed to facilitate indenting of the edited code: Auto Indent and Smart Indent. Both options are controlled from the Preferences dialog.
• Auto Indent When you hit Enter to start a new text line, the editor automatically inserts tab characters or spaces in the new line so as to align the insertion point with the first character in the previous line.
• Smart Indent When you hit Enter to start a new text line, the editor automatically inserts tab characters or spaces in the new line so as to indent consecutive HDL constructs.
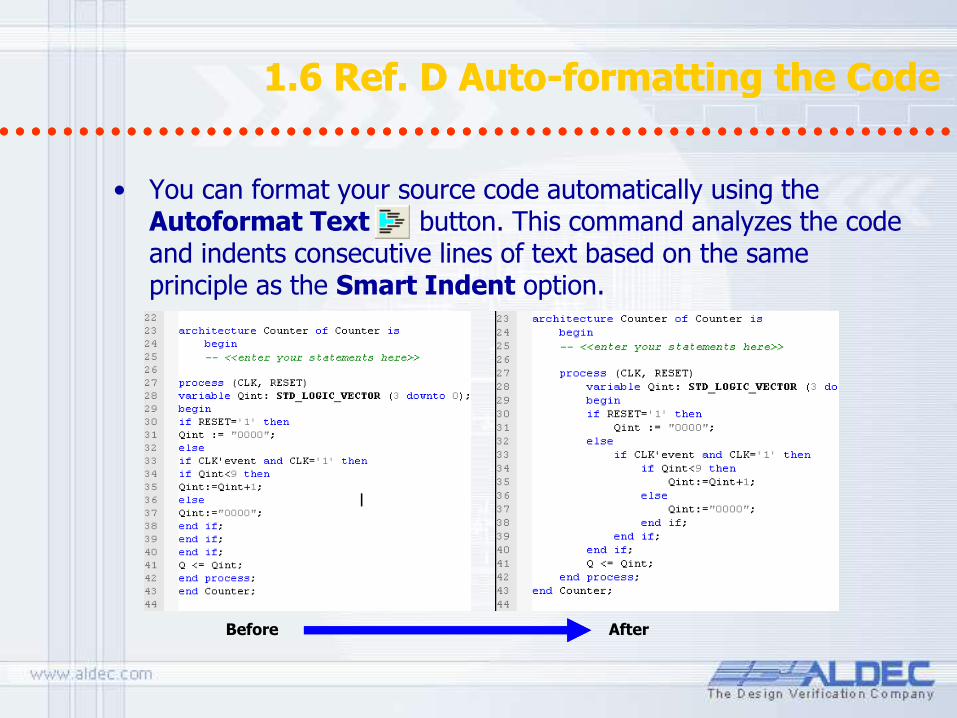
1.6 Ref. D Auto-formatting the Code 1.6 Ref. D Auto-formatting the Code
• You can format your source code automatically using the Autoformat Text button. This command analyzes the code and indents consecutive lines of text based on the same principle as the Smart Indent option.
Before After
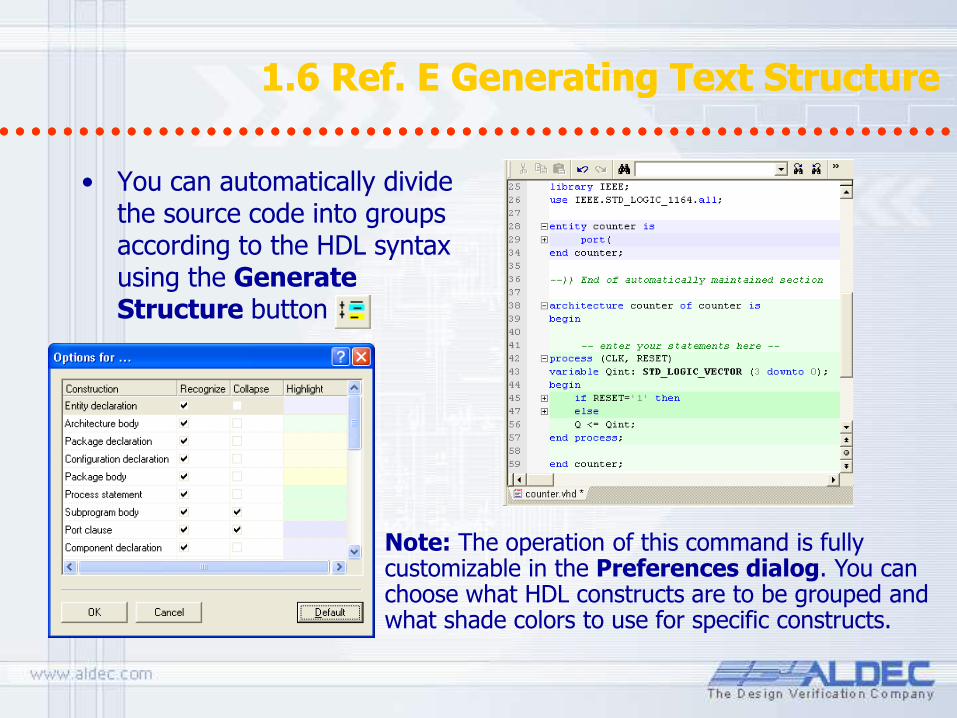
1.6 Ref. E Generating Text Structure 1.6 Ref. E Generating Text Structure
• You can automatically divide the source code into groups according to the HDL syntax using the Generate Structure button
Note: The operation of this command is fully customizable in the Preferences dialog. You can choose what HDL constructs are to be grouped and what shade colors to use for specific constructs.
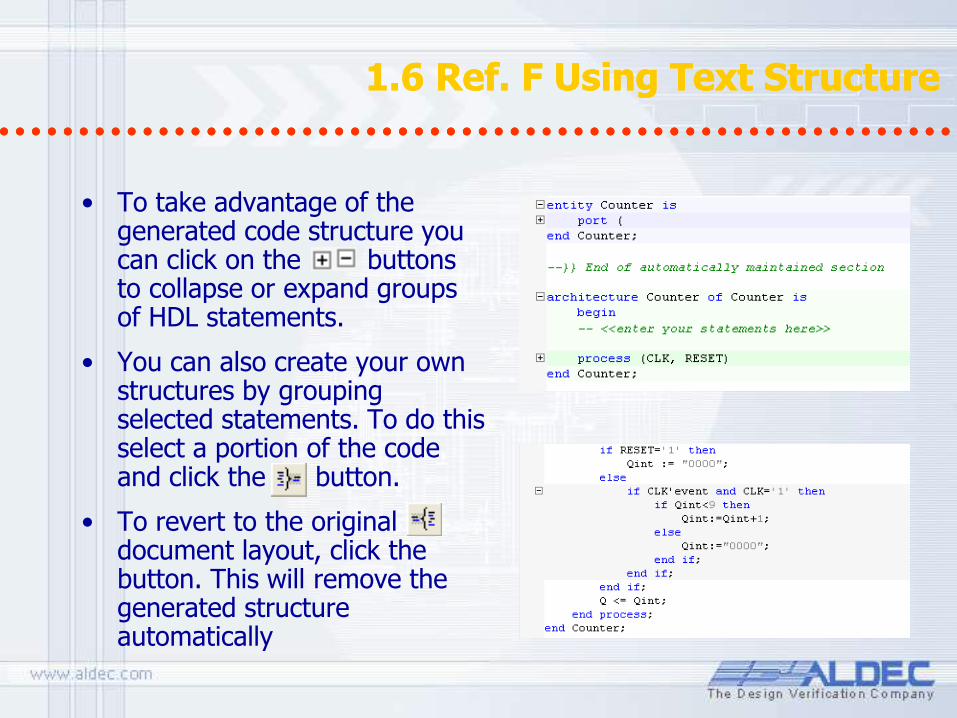
1.6 Ref. F Using Text Structure 1.6 Ref. F Using Text Structure
• To take advantage of the generated code structure you can click on the buttons to collapse or expand groups of HDL statements.
• You can also create your own structures by grouping selected statements. To do this select a portion of the code and click the button.
• To revert to the original document layout, click the button. This will remove the generated structure automatically

• Source files can be compiled individually by choosing the Design|Compile command or clicking the toolbar button.
• All source files can be compiled in one pass according to the order set in Design Compilation Order (Design | Design Compilation Order). To do this select the Design|Compile All command or click the button.
• All source files can be compiled in one pass with the prior reorder. The files are reordered so as to ensure the proper order of analysis. To do this, select the Design|Compile All with File Reorder command or click the button.
1.7 Compiling the Design 1.7 Compiling the Design
Active-HDL allows you to compile design source files in several manners.
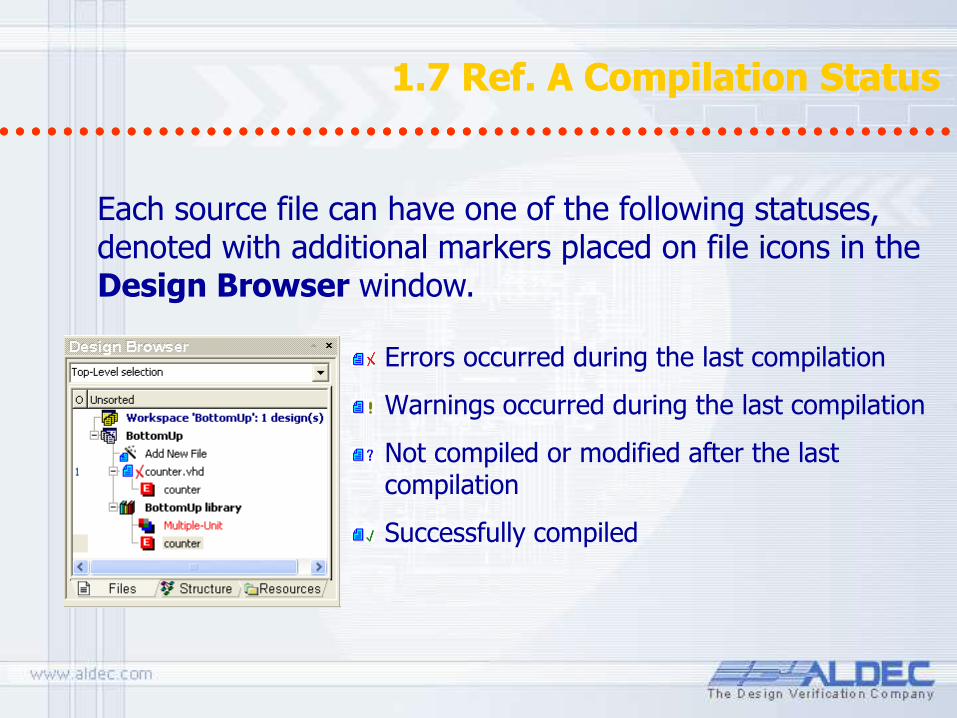
1.7 Ref. A Compilation Status 1.7 Ref. A Compilation Status
Errors occurred during the last compilation
Warnings occurred during the last compilation
Not compiled or modified after the last compilation
Successfully compiled
Each source file can have one of the following statuses, denoted with additional markers placed on file icons in the Design Browser window.
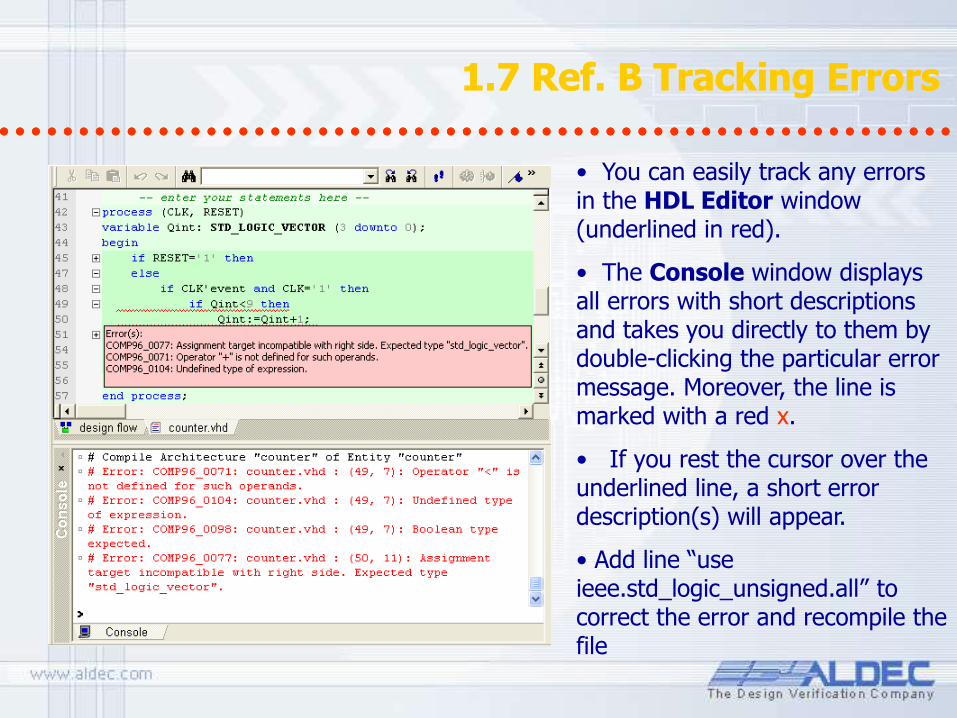
1.7 Ref. B Tracking Errors 1.7 Ref. B Tracking Errors
• You can easily track any errors in the HDL Editor window (underlined in red).
• The Console window displays all errors with short descriptions and takes you directly to them by double-clicking the particular error message. Moreover, the line is marked with a red x.
• If you rest the cursor over the underlined line, a short error description(s) will appear.
• Add line “use ieee.std_logic_unsigned.all” to correct the error and recompile the file
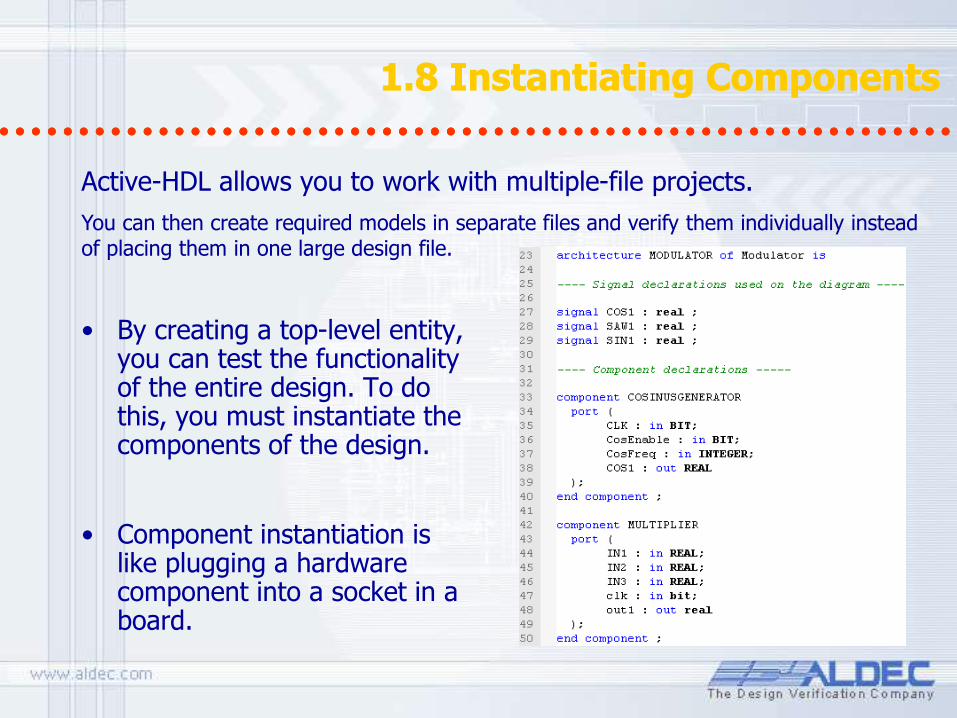
1.8 Instantiating Components 1.8 Instantiating Components
• By creating a top-level entity, you can test the functionality of the entire design. To do this, you must instantiate the components of the design.
• Component instantiation is like plugging a hardware component into a socket in a board.
Active-HDL allows you to work with multiple-file projects.
You can then create required models in separate files and verify them individually instead of placing them in one large design file.

1.8 Ref.A Declaring Components 1.8 Ref.A Declaring Components
• Expand the library contents in the Design Browser and copy the declaration pressing Ctrl+C keys or use the Copy Declaration option from the pop-up menu.
• Go to the HDL Editor window and paste the declaration pressing Ctrl+V keys or using the Paste option from the pop-up menu.
Active-HDL provides a utility to speed up a component declaration. You can copy a component declaration from the working library or a library in the Library Manager window.
Note: This will only copy the component declaration. You will have to map the ports and generics of the entity by yourself.
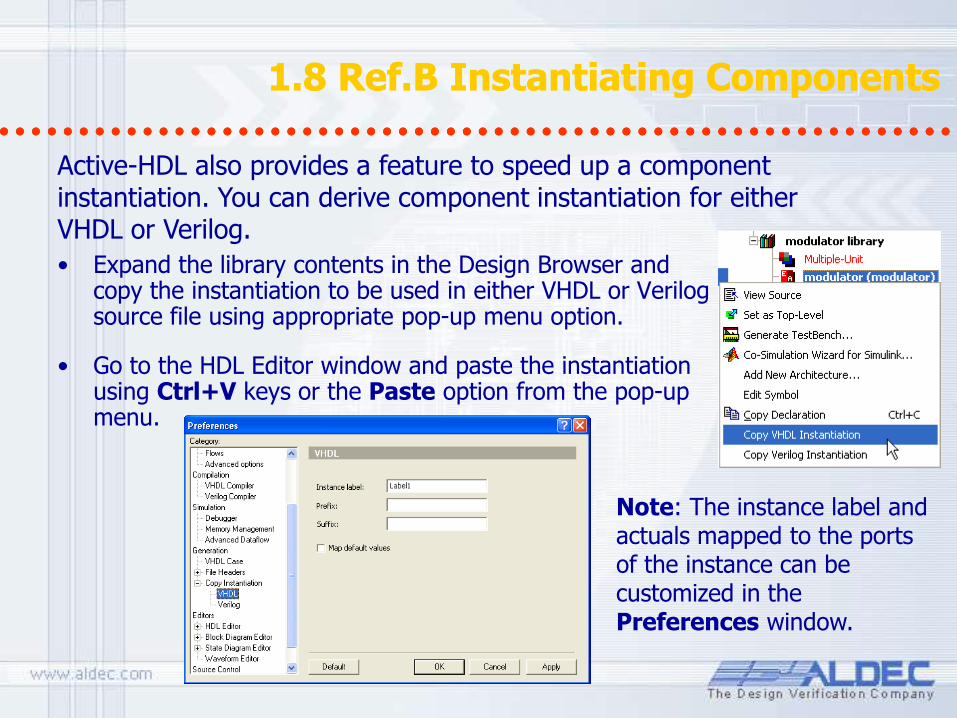
1.8 Ref.B Instantiating Components 1.8 Ref.B Instantiating Components
• Expand the library contents in the Design Browser and copy the instantiation to be used in either VHDL or Verilog source file using appropriate pop-up menu option.
• Go to the HDL Editor window and paste the instantiation using Ctrl+V keys or the Paste option from the pop-up menu.
Active-HDL also provides a feature to speed up a component instantiation. You can derive component instantiation for either VHDL or Verilog.
Note: The instance label and actuals mapped to the ports of the instance can be customized in the Preferences window.

Design Entry Methods
Creating HDL Graphical Modules
Part 2
2. Top-Down Design Concepts 2. Top-Down Design Concepts
• Start by creating a top level diagram
• Push into individual symbols
• Select your preferred design entry tool: • BDE – Block Diagram Editor
• HDE – HDL Editor
• FSM – Finite State Machine Editor
• Create the source code
• Compile the entire design sources
2.1 Creating at Top Level Block Diagram 2.1 Creating at Top Level Block Diagram
• To create the new block diagram, double click on Add New File from the Files tab on the Design Browser
• Select Wizards tab and double click Block Diagram Wizard
Note that you can also create an empty skeleton file by selecting Empty Files tab in the Add New File window.
• Click Next >
• Type Top_Counter in the first box in the New Source File Wizard - Name window and click Next >
See ref. A for more details
In this section we will implement the top level Block Diagram file to familiarize you with the basic concepts of the Block Diagram Editor. We will also create a State Machine module Control using top-down design methodology.

2.1 Ref. A The Design Wizards 2.1 Ref. A The Design Wizards
Design Wizards simplify the creation process guiding you through the initial stages of design development. Using design wizards, you will create skeleton files with little effort.

2.2 Creating the Top Level Block Diagram 2.2 Creating the Top Level Block Diagram
• Define the following ports of the top_counter block diagram: Input Ports:
– START
– RESET
– CLK
Output Ports:
– Q [3:0]
• Click Finish
Block Diagram Editor (BDE) screen with an empty diagram will appear.
See ref. B for more details

2.2 Ref. A Design Wizard - Ports 2.2 Ref. A Design Wizard - Ports
• To add a port, click the New button and type the name of the port.
• To change a port type, click the radio buttons in the Port direction box. There are four types:
– In
– Out
– Inout
– Buffer
• To remove any port, click its name on the list and click the Delete button.
• To create a bus, add a new port name and click the Array indexes arrows to specify the bus width.
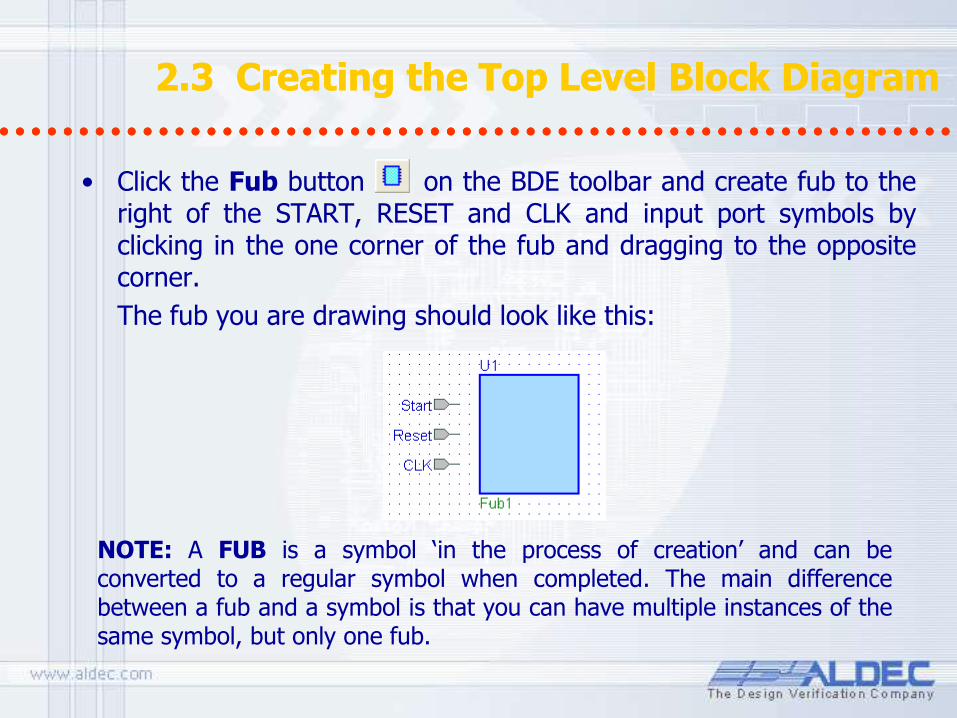
2.3 Creating the Top Level Block Diagram 2.3 Creating the Top Level Block Diagram
• Click the Fub button on the BDE toolbar and create fub to the right of the START, RESET and CLK and input port symbols by clicking in the one corner of the fub and dragging to the opposite corner.
The fub you are drawing should look like this:
NOTE: A FUB is a symbol ‘in the process of creation’ and can be converted to a regular symbol when completed. The main difference between a fub and a symbol is that you can have multiple instances of the same symbol, but only one fub.

2.4 Creating the Top Level Block Diagram 2.4 Creating the Top Level Block Diagram
• Click the Wire button on the BDE toolbar and drag three horizontal wires from the START, RESET and CLK input port symbols to the U1 fub;
* please note that three input pins are automatically created in the fub
• Hit Esc key to return to Select mode
• Double-click “Fub1” label below the fub and change fub name to CONTROL
• Right click in the fub body and select Edit to switch to Edit mode

2.5 Creating the Top Level Block Diagram 2.5 Creating the Top Level Block Diagram
• Drag Out pin from the Add New Pin window to the fub and drop it on the right-hand edge to create Pin1; repeat dragging to create Pin2
• Double-click Pin1 and change its name to Clock
• Double-click Pin2 and change its name to RST
• Click outside the fub and answer Yes when asked if you want to save changes to the fub

2.6 Creating the Top Level Block Diagram 2.6 Creating the Top Level Block Diagram
• The completed fub should look like this:
(we will fill the fub contents after completing our top level block diagram)
• We can now proceed to placing the remaining symbol on the top_counter block diagram. To place the symbol from the library, we will use the Symbol Toolbox
window.
To open it, use the Show Symbol Toolbox button .
2.7 Creating the Top Level Block Diagram 2.7 Creating the Top Level Block Diagram
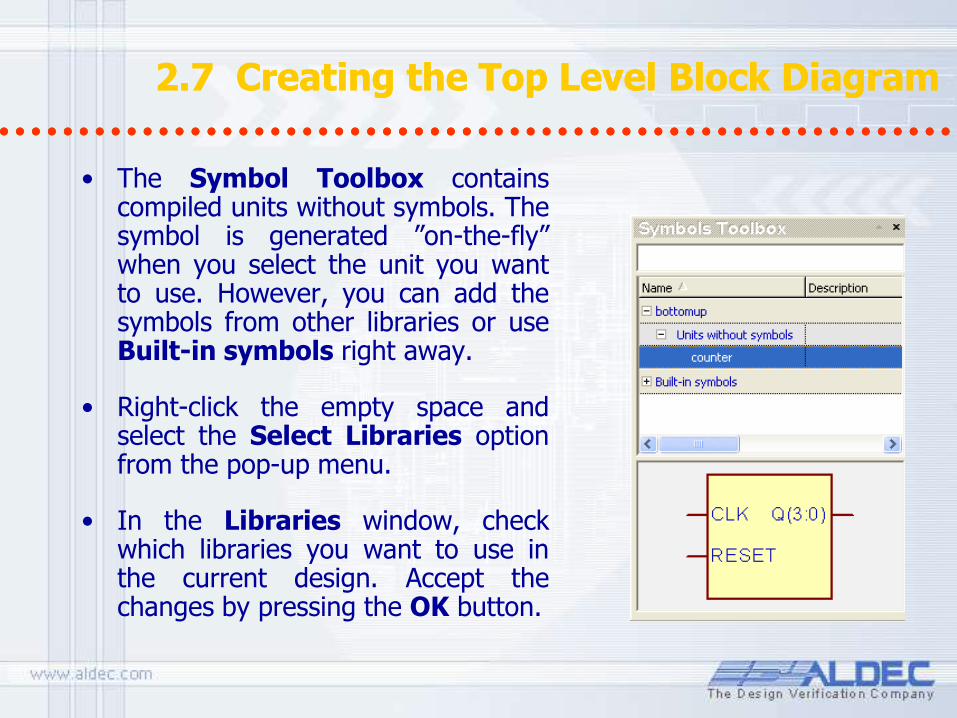
• The Symbol Toolbox contains compiled units without symbols. The symbol is generated ”on-the-fly” when you select the unit you want to use. However, you can add the symbols from other libraries or use Built-in symbols right away.
• Right-click the empty space and select the Select Libraries option from the pop-up menu.
• In the Libraries window, check which libraries you want to use in the current design. Accept the changes by pressing the OK button.

• Drag the counter symbol to the diagram window and drop it to the right of the Control fub.
• Use the Wire button to draw the following connections: 1. from the Clock output port of the Control symbol to the CLK input of the Counter symbol
2. from the RST output port of the Control symbol to the Reset input of the Counter symbol
• Hit Esc to return to the Select mode
• You can rename wires by double-clicking on them and typing a new name in the Segment box in the Wire Properties window. Please rename:
– wire drawn in point 1 above to CLOCK
– wire drawn in point 2 above to RST
2.8 Creating the Top Level Block Diagram 2.8 Creating the Top Level Block Diagram
2.9 Creating the Top Level Block Diagram 2.9 Creating the Top Level Block Diagram
• Use the Bus button to draw the following connection, from the Q(3:0) output port of the Counter symbol to the Q(3:0) port of the block diagram
• Hit Esc to return to the Select mode
• You can rename buses by double-clicking on them and typing a new name in the Segment box in the Bus Properties window. Please verify if the bus has the same name and range as the output of the Counter symbol.
2.10 Creating the Top Level Block Diagram 2.10 Creating the Top Level Block Diagram
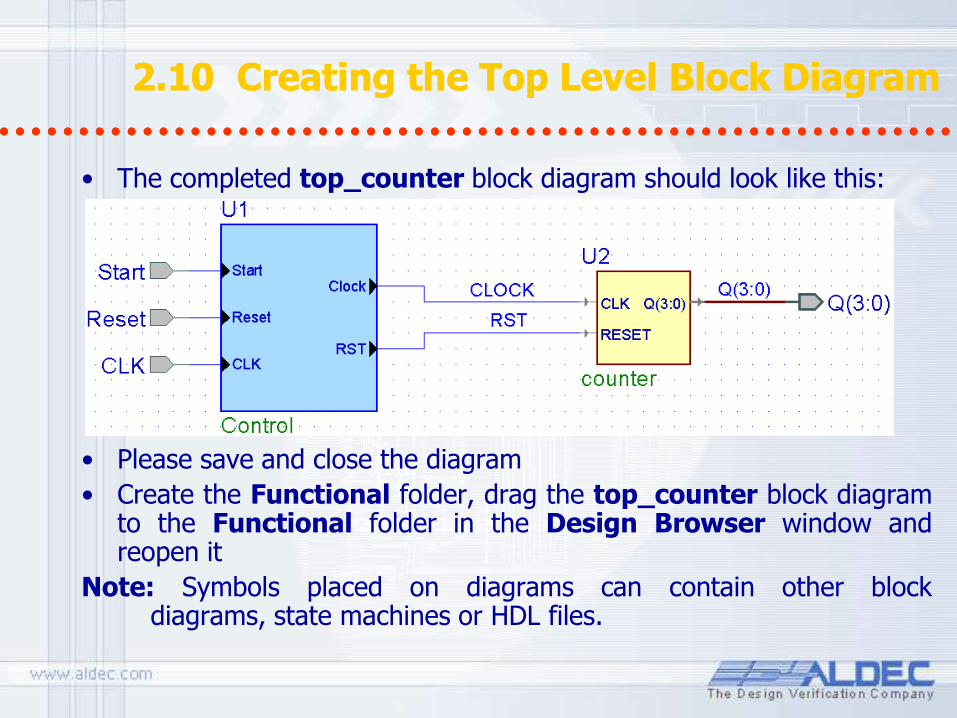
• The completed top_counter block diagram should look like this:
• Please save and close the diagram
• Create the Functional folder, drag the top_counter block diagram to the Functional folder in the Design Browser window and reopen it
Note: Symbols placed on diagrams can contain other block diagrams, state machines or HDL files.
2.10 Ref.A Design Rule Checking 2.10 Ref.A Design Rule Checking
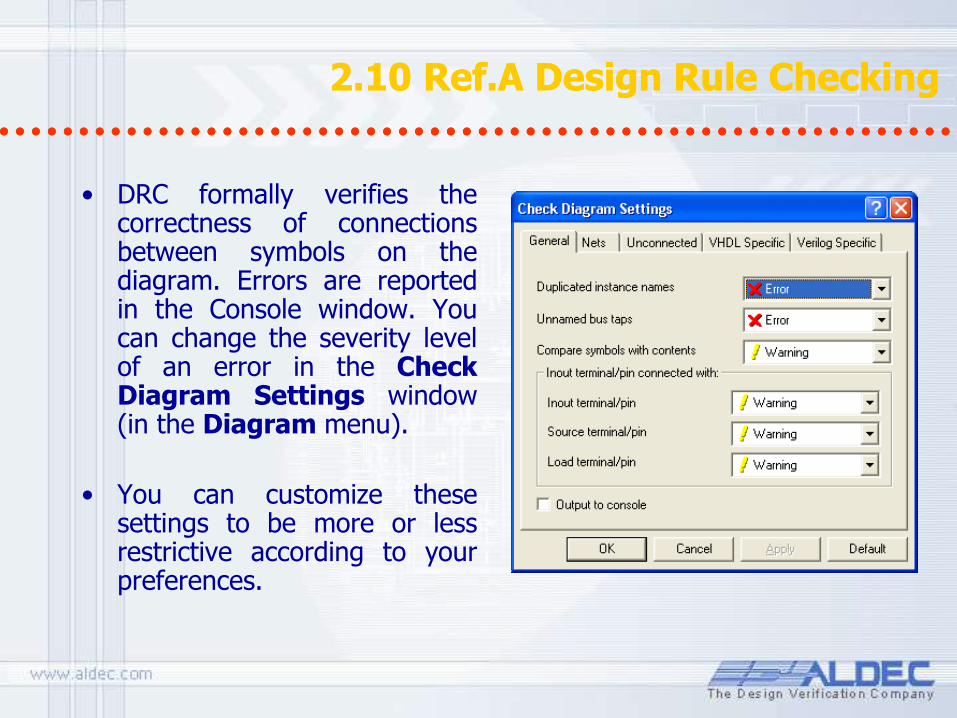
• DRC formally verifies the correctness of connections between symbols on the diagram. Errors are reported in the Console window. You can change the severity level of an error in the Check Diagram Settings window (in the Diagram menu).
• You can customize these settings to be more or less restrictive according to your preferences.
2.11 Creating Fub Contents 2.11 Creating Fub Contents
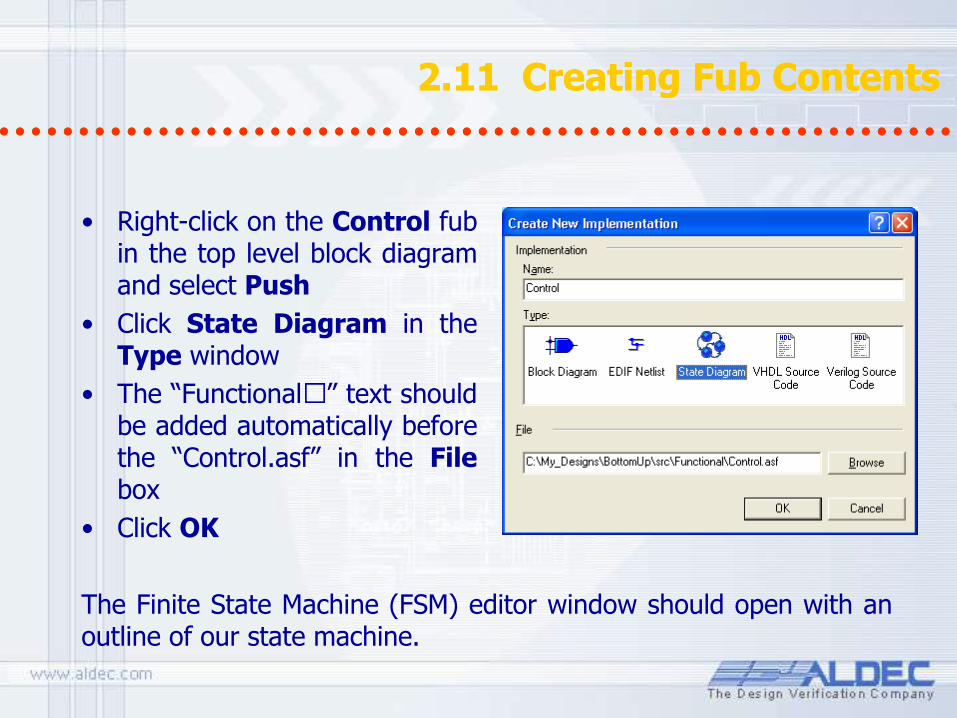
• Right-click on the Control fub in the top level block diagram and select Push
• Click State Diagram in the Type window
• The “Functional\” text should be added automatically before the “Control.asf” in the File box
• Click OK
The Finite State Machine (FSM) editor window should open with an outline of our state machine.
2.12 Creating Fub Contents 2.12 Creating Fub Contents
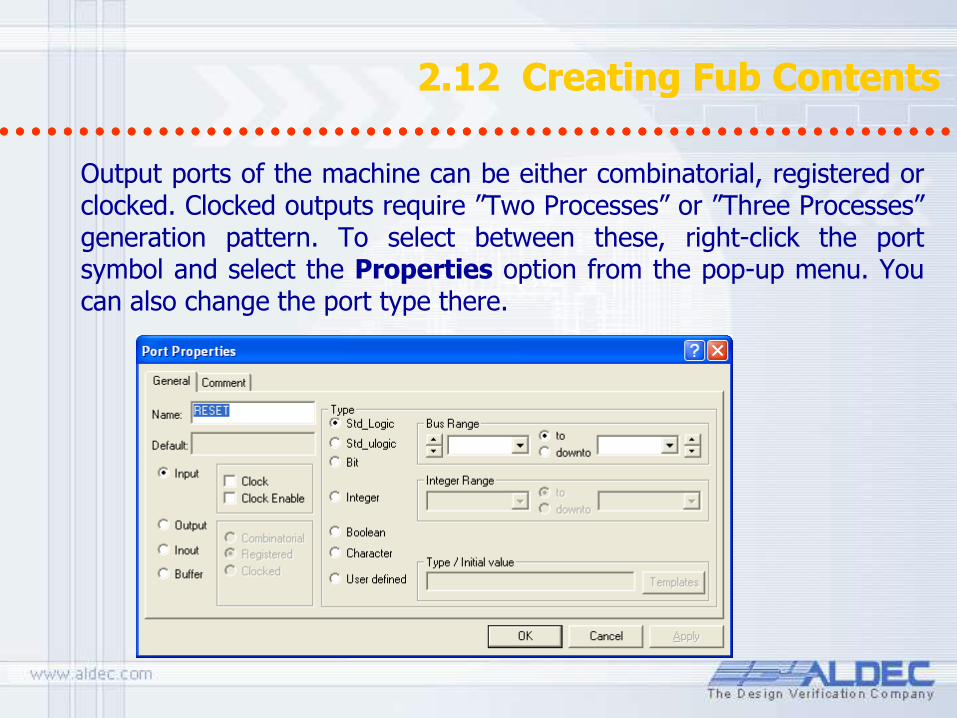
Output ports of the machine can be either combinatorial, registered or clocked. Clocked outputs require ”Two Processes” or ”Three Processes” generation pattern. To select between these, right-click the port symbol and select the Properties option from the pop-up menu. You can also change the port type there.

2.13 Creating Fub Contents 2.13 Creating Fub Contents
• Right click on the CLK port symbol in the Control state diagram and select Properties.
• Select the Clock checkbox in the Port Properties window.
• Click OK.
• Similarly create START as an input port, GATE and END_RESET as Registered Output ports.
The FSM Editor is designed for behavioral descriptions of State Machines. The Control unit we are going to describe will be synchronous, so we must declare one of the inputs F_PATTERN in the diagram as our machine clock.
2.14 Creating Fub Contents 2.14 Creating Fub Contents
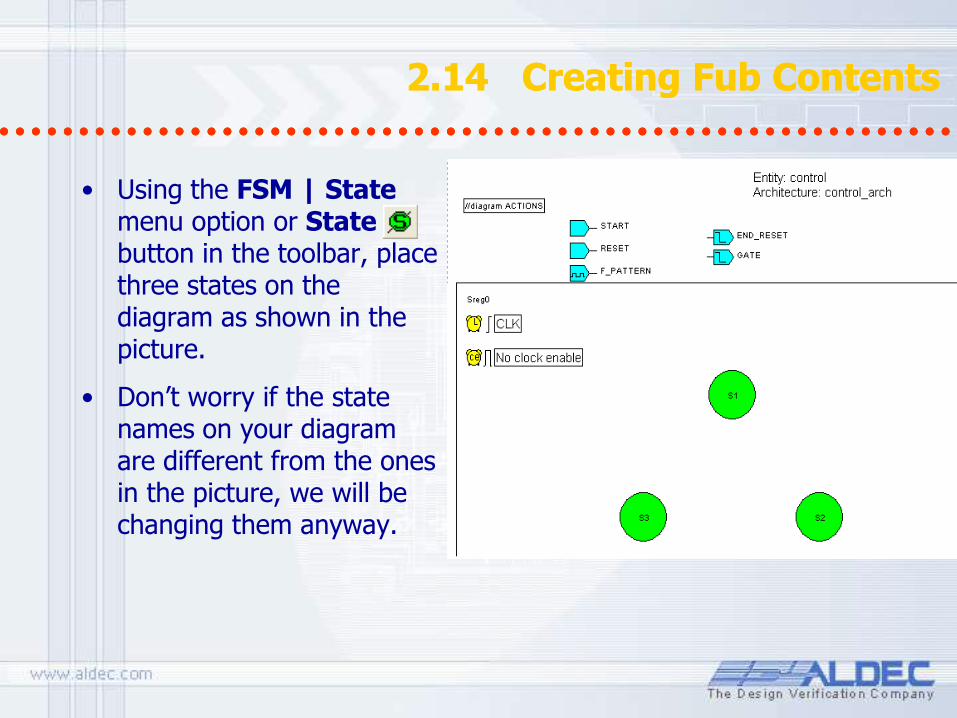
• Using the FSM | State menu option or State button in the toolbar, place three states on the diagram as shown in the picture.
• Don’t worry if the state names on your diagram are different from the ones in the picture, we will be changing them anyway.
2.15 Creating Fub Contents 2.15 Creating Fub Contents
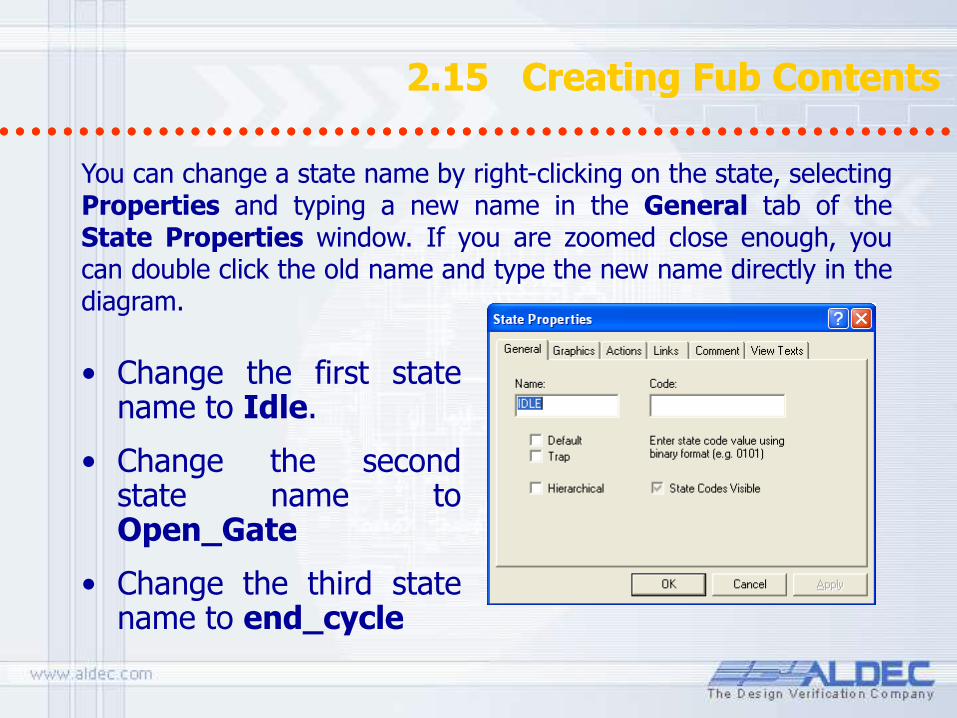
You can change a state name by right-clicking on the state, selecting Properties and typing a new name in the General tab of the State Properties window. If you are zoomed close enough, you can double click the old name and type the new name directly in the diagram.
• Change the first state name to Idle.
• Change the second state name to Open_Gate
• Change the third state name to end_cycle

2.16 Creating Fub Contents 2.16 Creating Fub Contents
• Draw transitions as shown in this picture.
• To draw a loop transition, click inside the same state twice.
• To change the shape of any transition, click on it and drag the handles.
You can draw transitions between states by selecting FSM | Transition from the menu or Transition button in the toolbar and clicking the starting state, then clicking the target state.
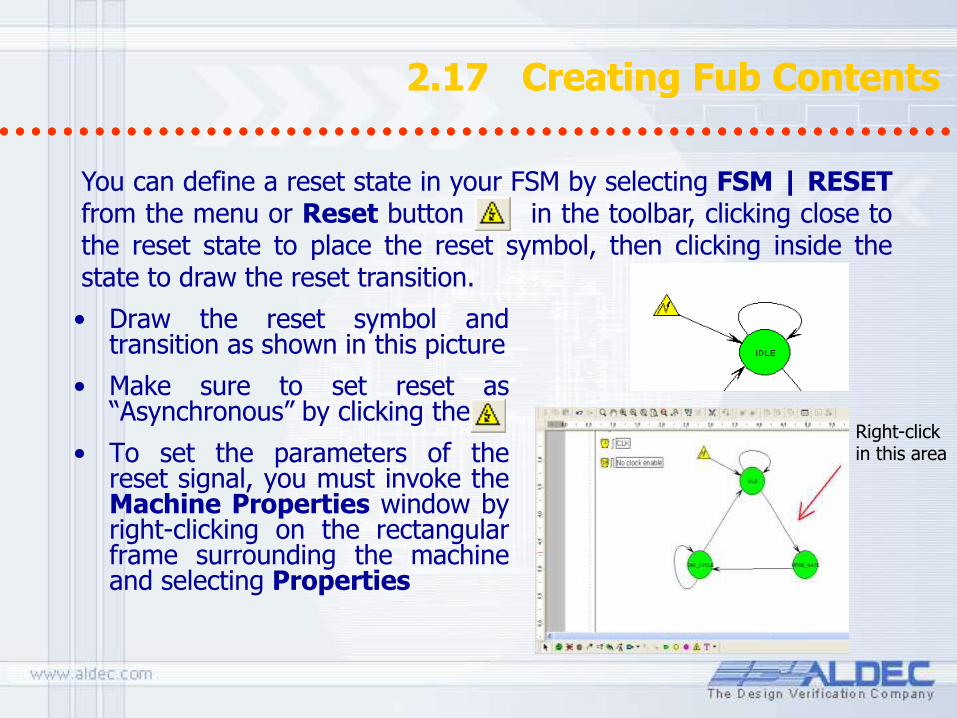
2.17 Creating Fub Contents 2.17 Creating Fub Contents
• Draw the reset symbol and transition as shown in this picture
• Make sure to set reset as “Asynchronous” by clicking the .
• To set the parameters of the reset signal, you must invoke the Machine Properties window by right-clicking on the rectangular frame surrounding the machine and selecting Properties
You can define a reset state in your FSM by selecting FSM | RESET from the menu or Reset button in the toolbar, clicking close to the reset state to place the reset symbol, then clicking inside the state to draw the reset transition.
Right-click in this area

2.18 Creating Fub Contents 2.18 Creating Fub Contents
• Click the Reset tab in the Machine Properties window and select:
– Reset signal in the Name box
– Asynchronous in the Type box
– High in the Active Level box
You can specify more elaborate reset conditions by clicking Advanced & typing an expression describing the reset condition
• Click OK
• To change the machine name, switch to the General tab and type the name of the machine in the Name field.
• To set a trap or default state, you can switch to the Defaults tab. These states are used in cases when illegal conditions are met.
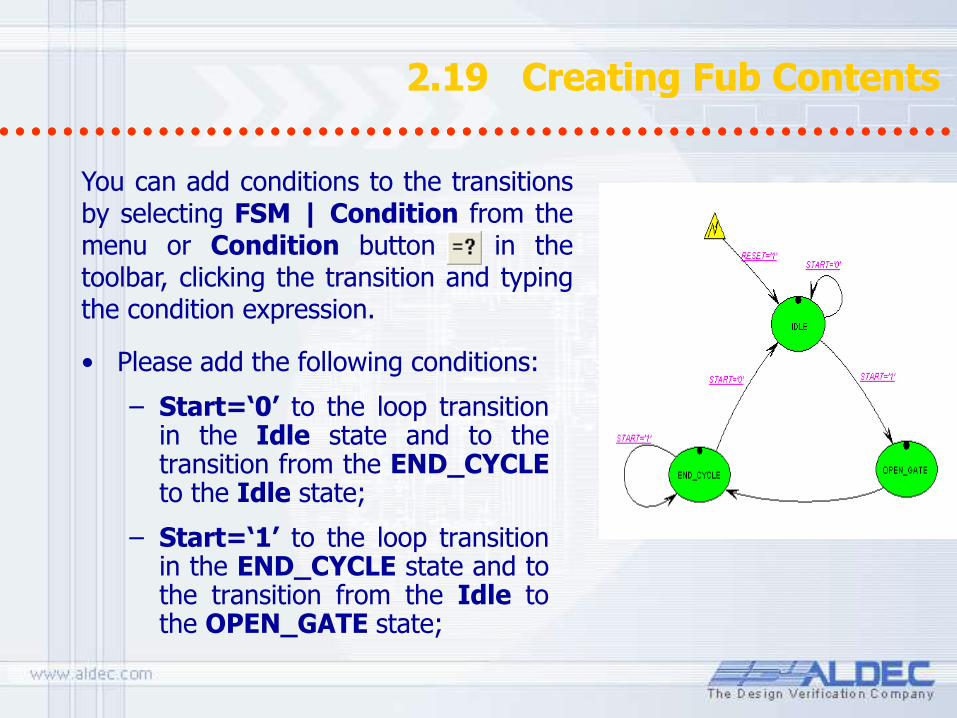
2.19 Creating Fub Contents 2.19 Creating Fub Contents
• Please add the following conditions:
– Start=‘0’ to the loop transition in the Idle state and to the transition from the END_CYCLE to the Idle state;
– Start=‘1’ to the loop transition in the END_CYCLE state and to the transition from the Idle to the OPEN_GATE state;
You can add conditions to the transitions by selecting FSM | Condition from the menu or Condition button in the toolbar, clicking the transition and typing the condition expression.
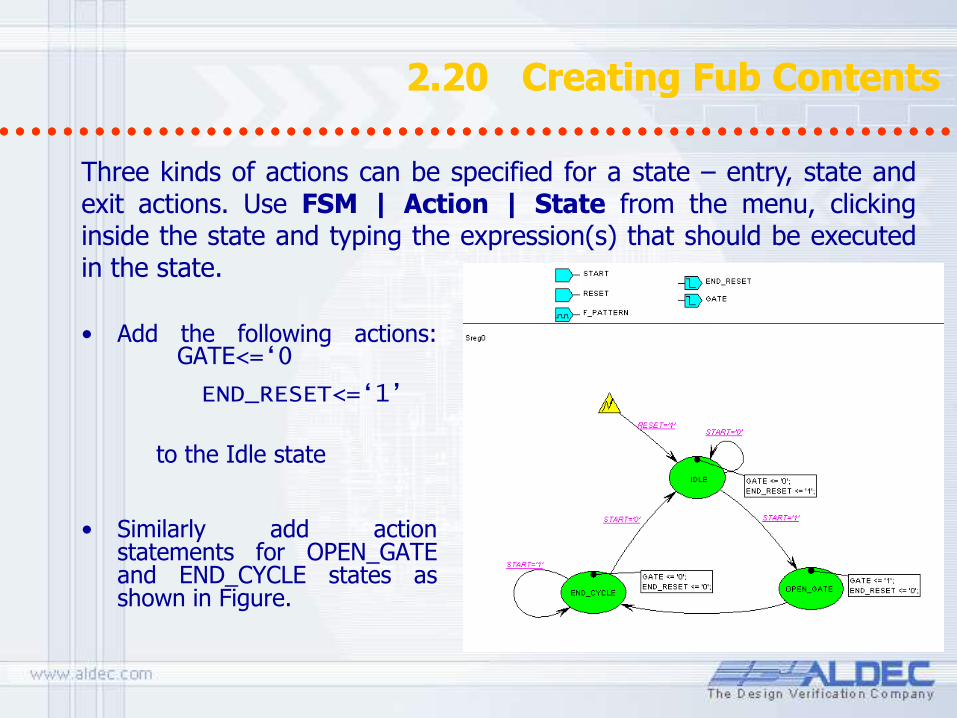
2.20 Creating Fub Contents 2.20 Creating Fub Contents
• Add the following actions: GATE<=‘0
END_RESET<=‘1’
to the Idle state
• Similarly add action statements for OPEN_GATE and END_CYCLE states as shown in Figure.
Three kinds of actions can be specified for a state – entry, state and exit actions. Use FSM | Action | State from the menu, clicking inside the state and typing the expression(s) that should be executed in the state.
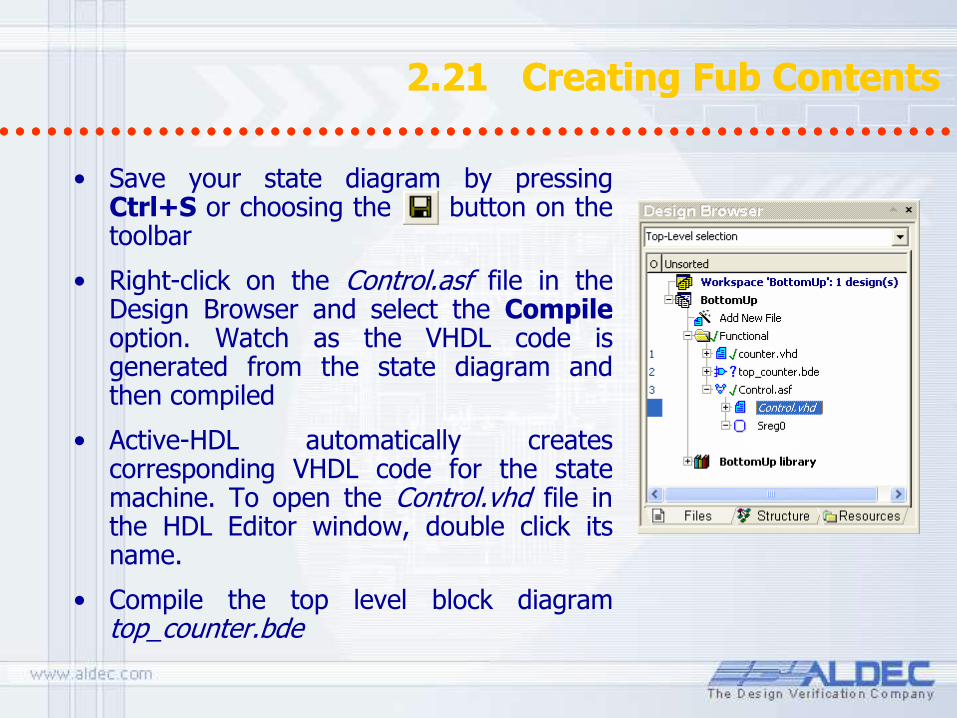
2.21 Creating Fub Contents 2.21 Creating Fub Contents
• Save your state diagram by pressing Ctrl+S or choosing the button on the toolbar
• Right-click on the Control.asf file in the Design Browser and select the Compile option. Watch as the VHDL code is generated from the state diagram and then compiled
• Active-HDL automatically creates corresponding VHDL code for the state machine. To open the Control.vhd file in the HDL Editor window, double click its name.
• Compile the top level block diagram top_counter.bde
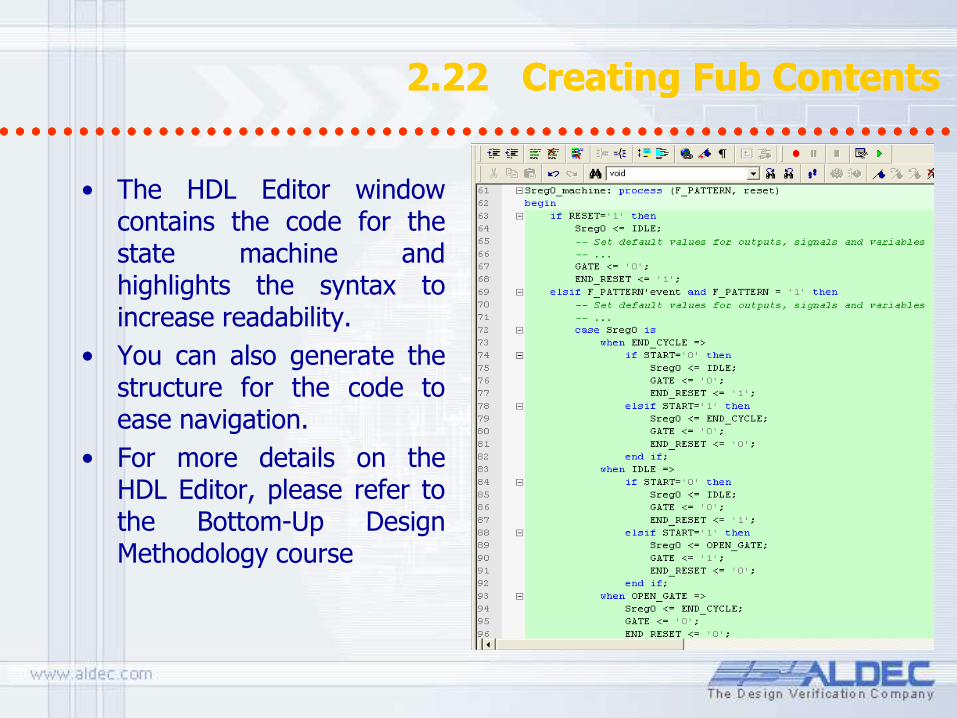
2.22 Creating Fub Contents 2.22 Creating Fub Contents
• The HDL Editor window contains the code for the state machine and highlights the syntax to increase readability.
• You can also generate the structure for the code to ease navigation.
• For more details on the HDL Editor, please refer to the Bottom-Up Design Methodology course
2.23 Creating Graphical Process/Always 2.23 Creating Graphical Process/Always
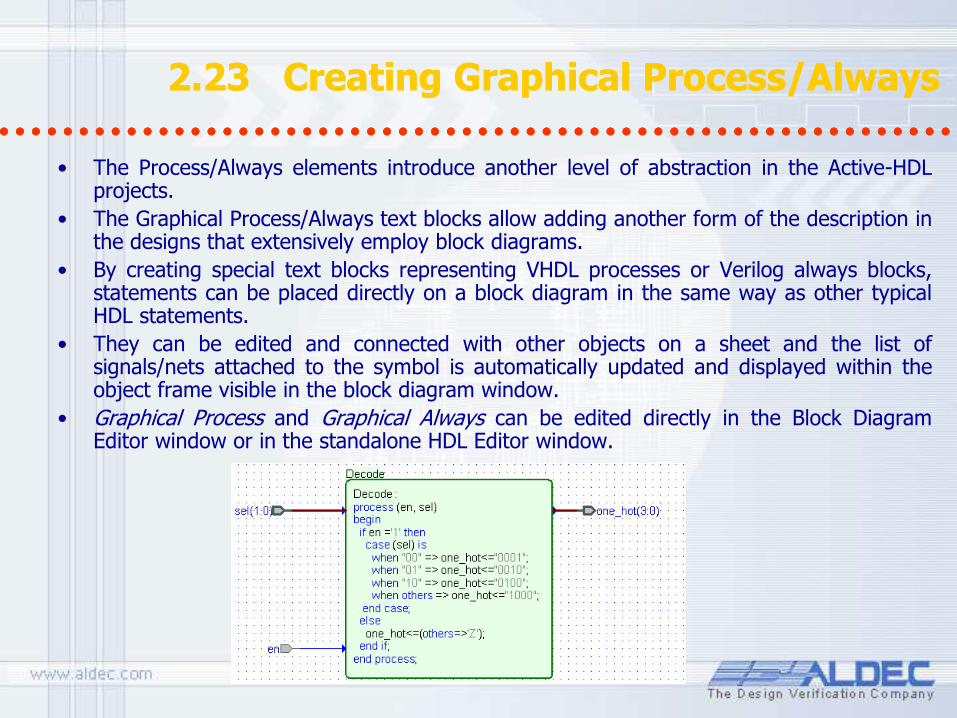
• The Process/Always elements introduce another level of abstraction in the Active-HDL projects.
• The Graphical Process/Always text blocks allow adding another form of the description in the designs that extensively employ block diagrams.
• By creating special text blocks representing VHDL processes or Verilog always blocks, statements can be placed directly on a block diagram in the same way as other typical HDL statements.
• They can be edited and connected with other objects on a sheet and the list of signals/nets attached to the symbol is automatically updated and displayed within the object frame visible in the block diagram window.
• Graphical Process and Graphical Always can be edited directly in the Block Diagram Editor window or in the standalone HDL Editor window.
2.24 Objects View 2.24 Objects View
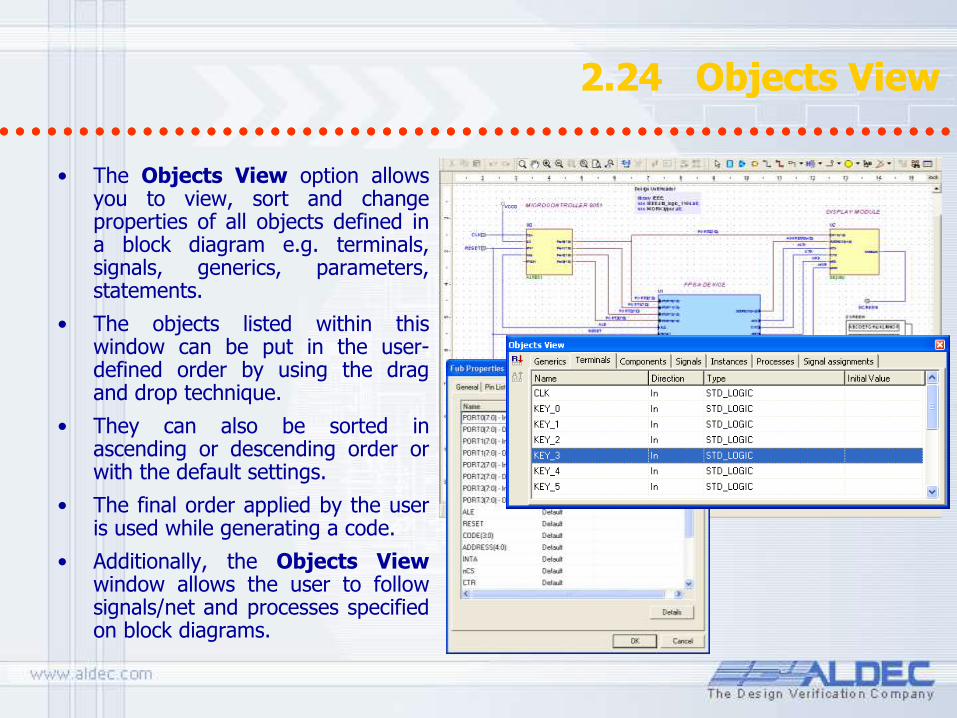
• The Objects View option allows you to view, sort and change properties of all objects defined in a block diagram e.g. terminals, signals, generics, parameters, statements.
• The objects listed within this window can be put in the user-defined order by using the drag and drop technique.
• They can also be sorted in ascending or descending order or with the default settings.
• The final order applied by the user is used while generating a code.
• Additionally, the Objects View window allows the user to follow signals/net and processes specified on block diagrams.
2.25 Multiple architectures support 2.25 Multiple architectures support
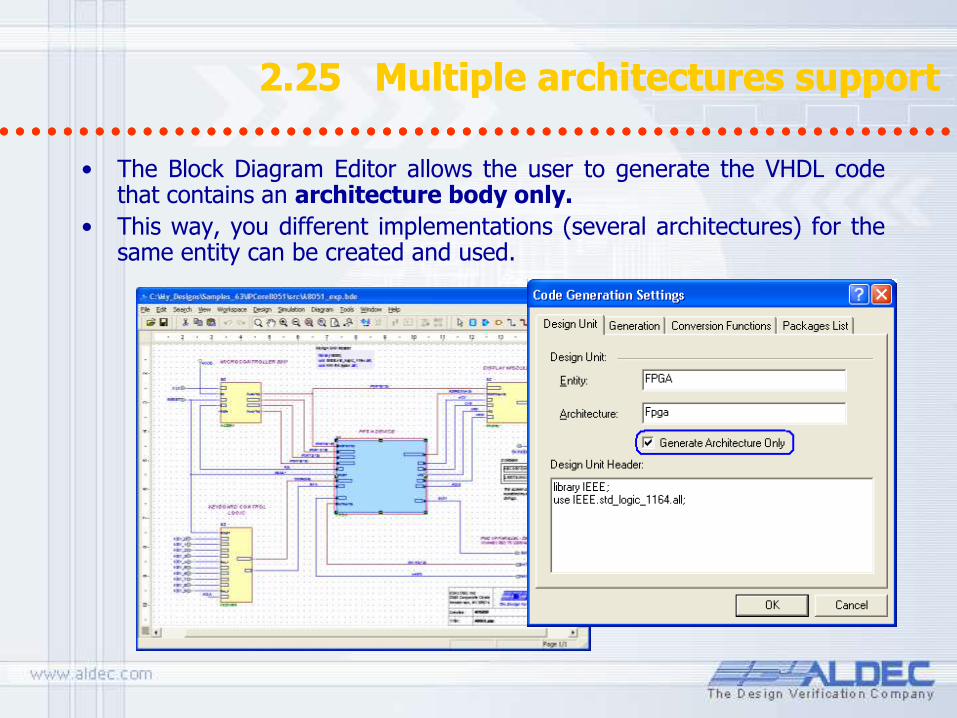
• The Block Diagram Editor allows the user to generate the VHDL code that contains an architecture body only.
• This way, you different implementations (several architectures) for the same entity can be created and used.
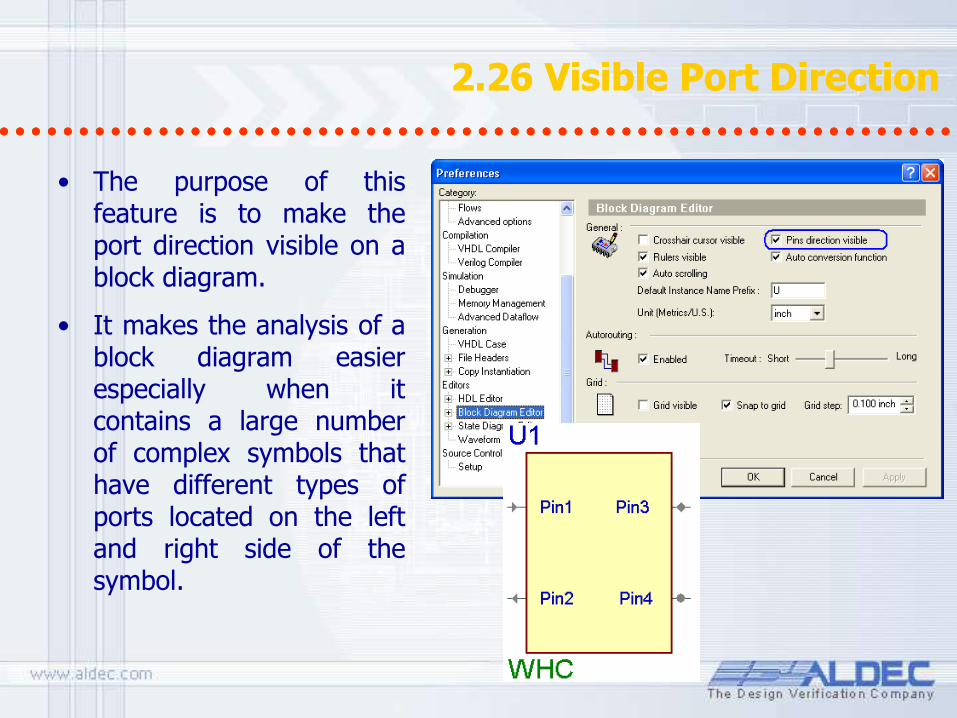
2.26 Visible Port Direction 2.26 Visible Port Direction
• The purpose of this feature is to make the port direction visible on a block diagram.
• It makes the analysis of a block diagram easier especially when it contains a large number of complex symbols that have different types of ports located on the left and right side of the symbol.
2.27 Cross-probing between Block Diagram Editor and generated HDL code
2.27 Cross-probing between Block Diagram Editor and generated HDL code
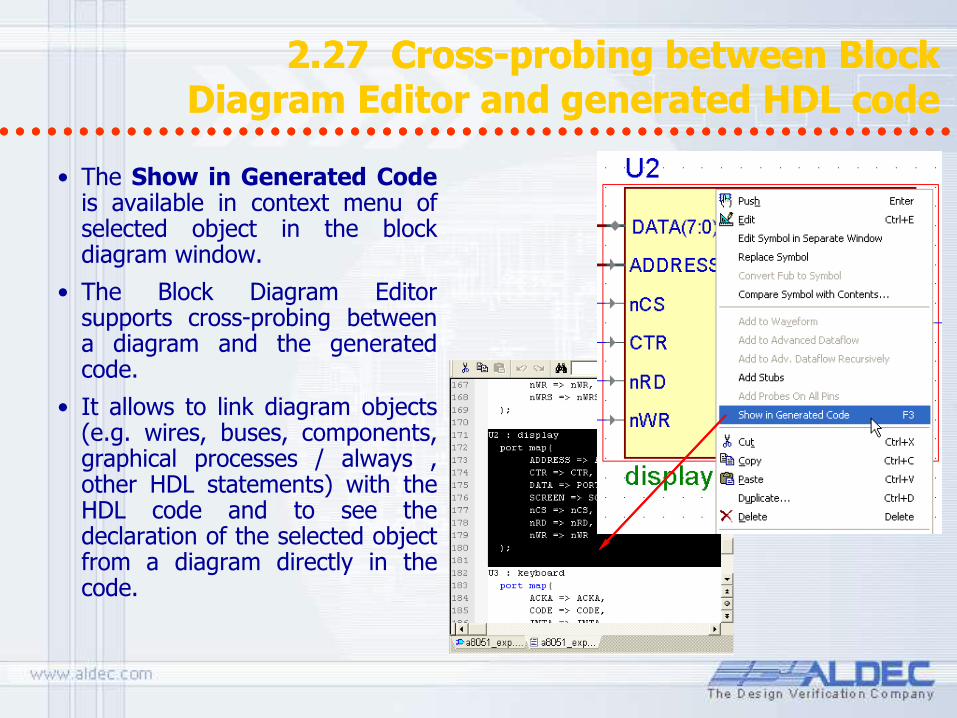
• The Show in Generated Code is available in context menu of selected object in the block diagram window.
• The Block Diagram Editor supports cross-probing between a diagram and the generated code.
• It allows to link diagram objects (e.g. wires, buses, components, graphical processes / always , other HDL statements) with the HDL code and to see the declaration of the selected object from a diagram directly in the code.
2.28 Bitmap support 2.28 Bitmap support
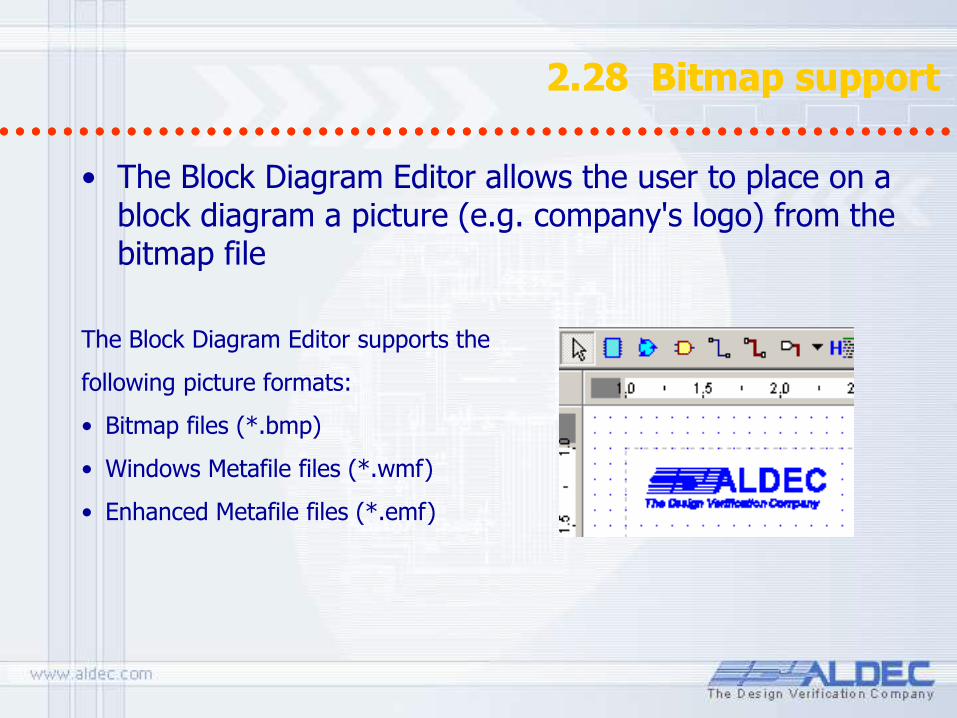
• The Block Diagram Editor allows the user to place on a block diagram a picture (e.g. company's logo) from the bitmap file
The Block Diagram Editor supports the
following picture formats:
• Bitmap files (*.bmp)
• Windows Metafile files (*.wmf)
• Enhanced Metafile files (*.emf)
2.29 Comments for diagram elements 2.29 Comments for diagram elements
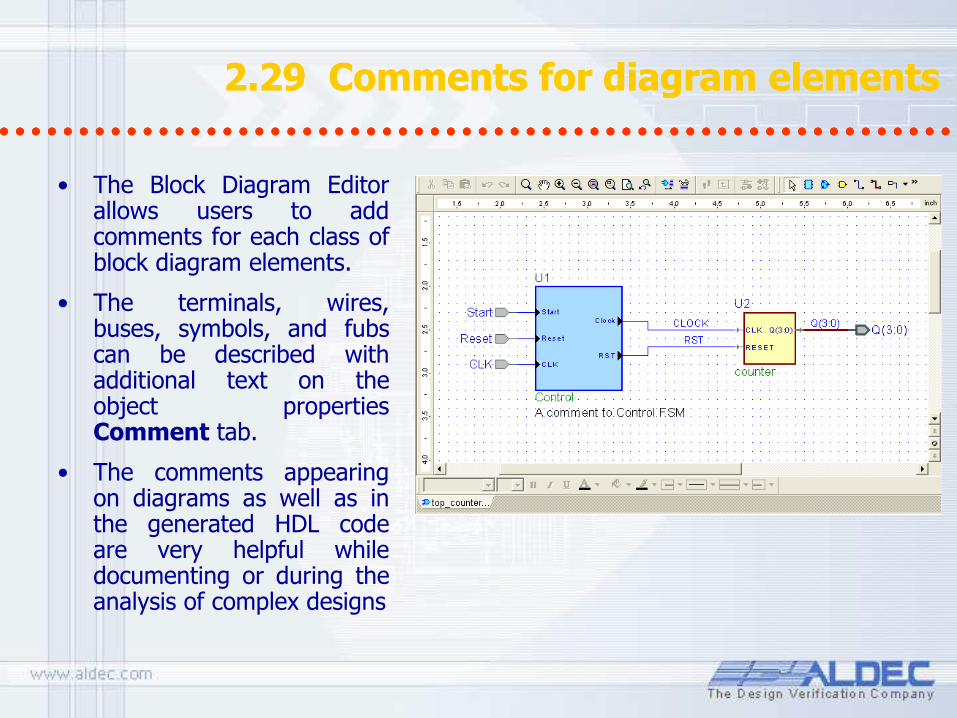
• The Block Diagram Editor allows users to add comments for each class of block diagram elements.
• The terminals, wires, buses, symbols, and fubs can be described with additional text on the object properties Comment tab.
• The comments appearing on diagrams as well as in the generated HDL code are very helpful while documenting or during the analysis of complex designs
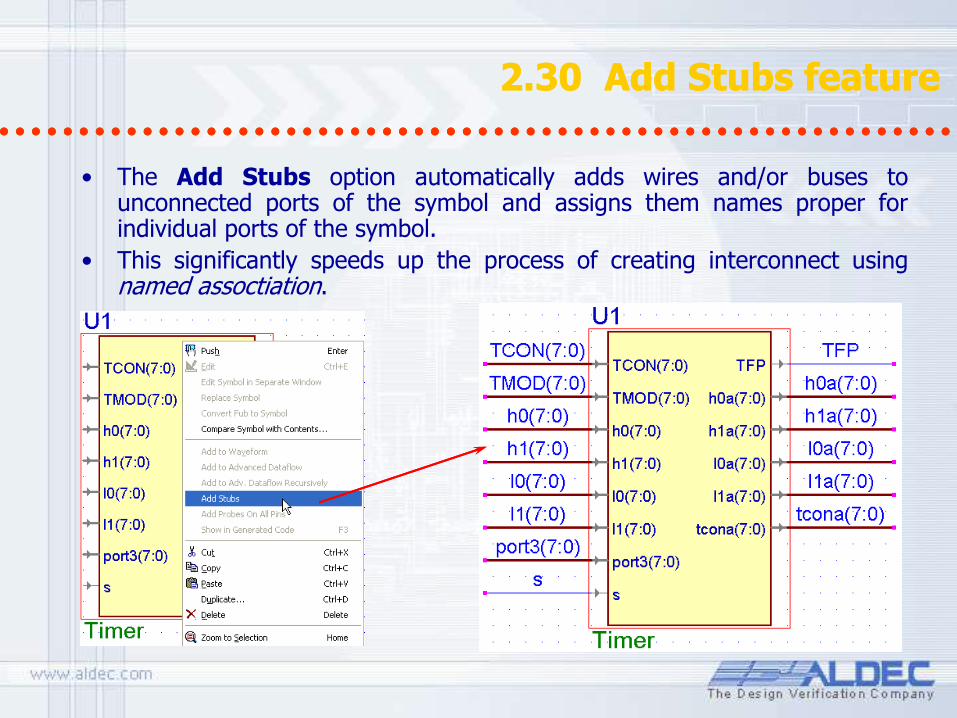
2.30 Add Stubs feature 2.30 Add Stubs feature
• The Add Stubs option automatically adds wires and/or buses to unconnected ports of the symbol and assigns them names proper for individual ports of the symbol.
• This significantly speeds up the process of creating interconnect using named assoctiation.
Design Entry Methods
Creating HDL Graphical Modules
Part 3

3. State Diagram Editor features 3. State Diagram Editor features
• Multiple architectures support • Code Generation Settings • HDL code editing • Asynchronous machines • Multiple reset support • Transition Auto Priority • Junction • Convert to Hierarchical State • State register port • Synthesis Attributes • Export to previous ASF format • Report file generation
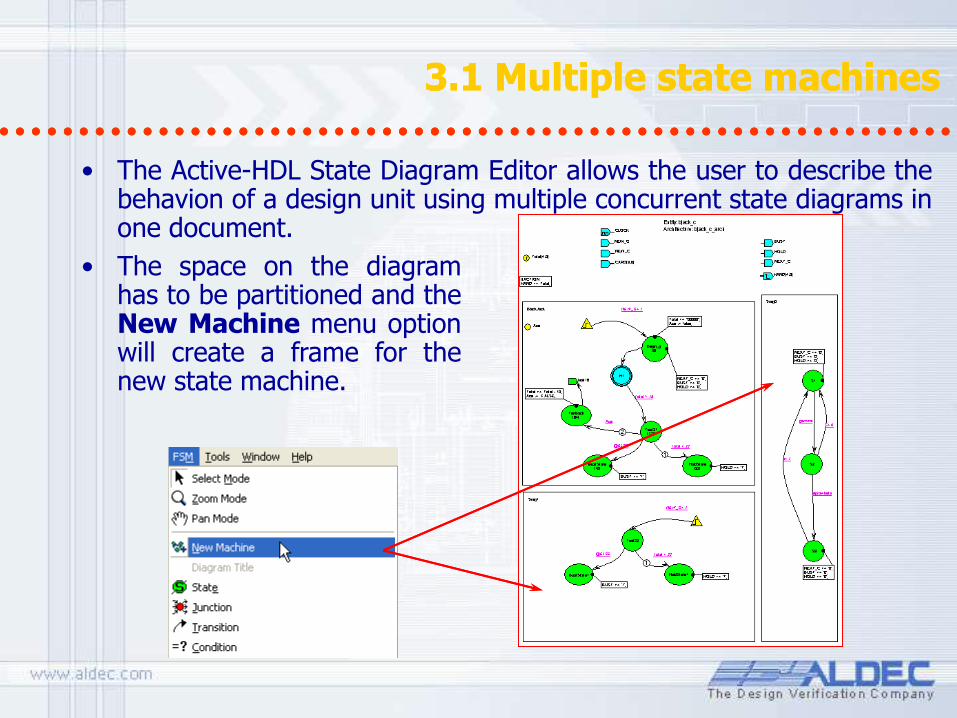
3.1 Multiple state machines 3.1 Multiple state machines
• The Active-HDL State Diagram Editor allows the user to describe the behavion of a design unit using multiple concurrent state diagrams in one document.
• The space on the diagram has to be partitioned and the New Machine menu option will create a frame for the new state machine.
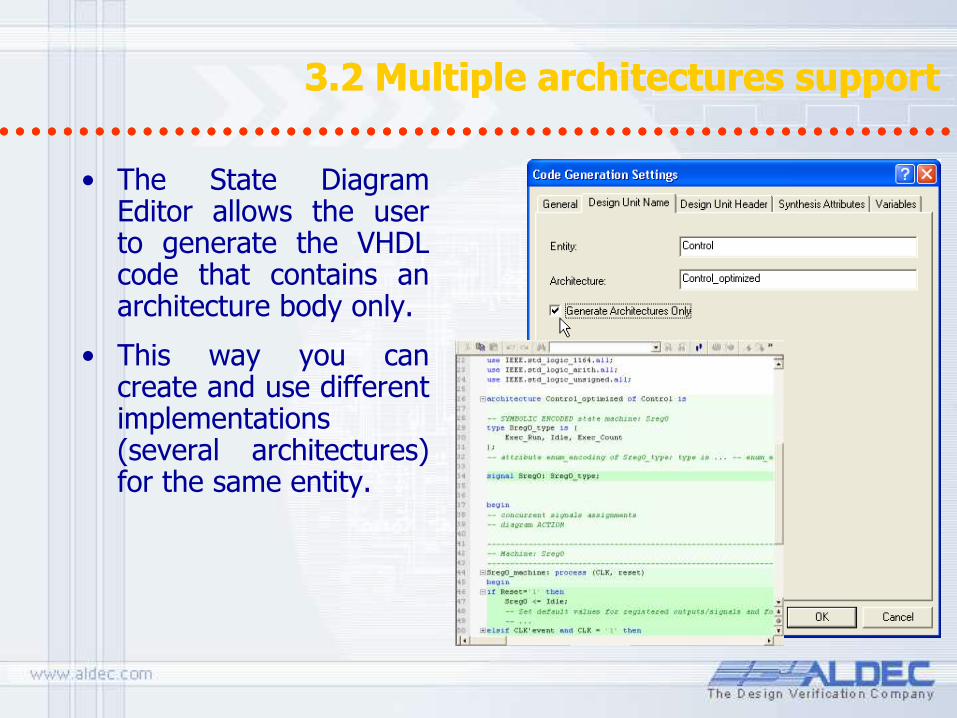
3.2 Multiple architectures support 3.2 Multiple architectures support
• The State Diagram Editor allows the user to generate the VHDL code that contains an architecture body only.
• This way you can create and use different implementations (several architectures) for the same entity.
3.3 Code Generation Settings 3.3 Code Generation Settings
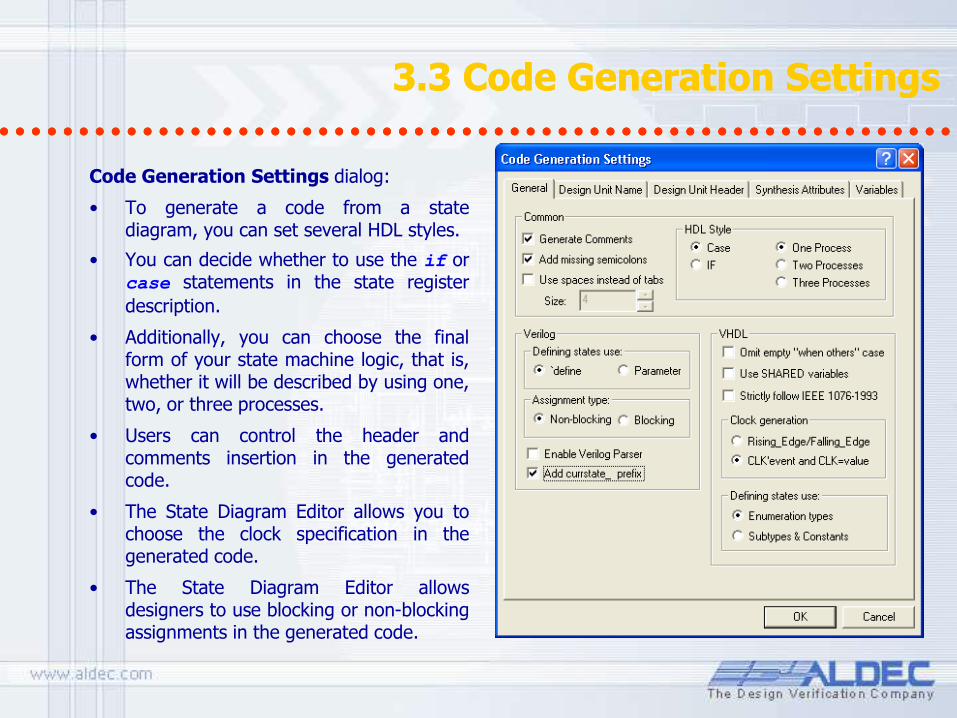
Code Generation Settings dialog:
• To generate a code from a state diagram, you can set several HDL styles.
• You can decide whether to use the if or case statements in the state register
description.
• Additionally, you can choose the final form of your state machine logic, that is, whether it will be described by using one, two, or three processes.
• Users can control the header and comments insertion in the generated code.
• The State Diagram Editor allows you to choose the clock specification in the generated code.
• The State Diagram Editor allows designers to use blocking or non-blocking assignments in the generated code.
3.4 HDL code editing 3.4 HDL code editing
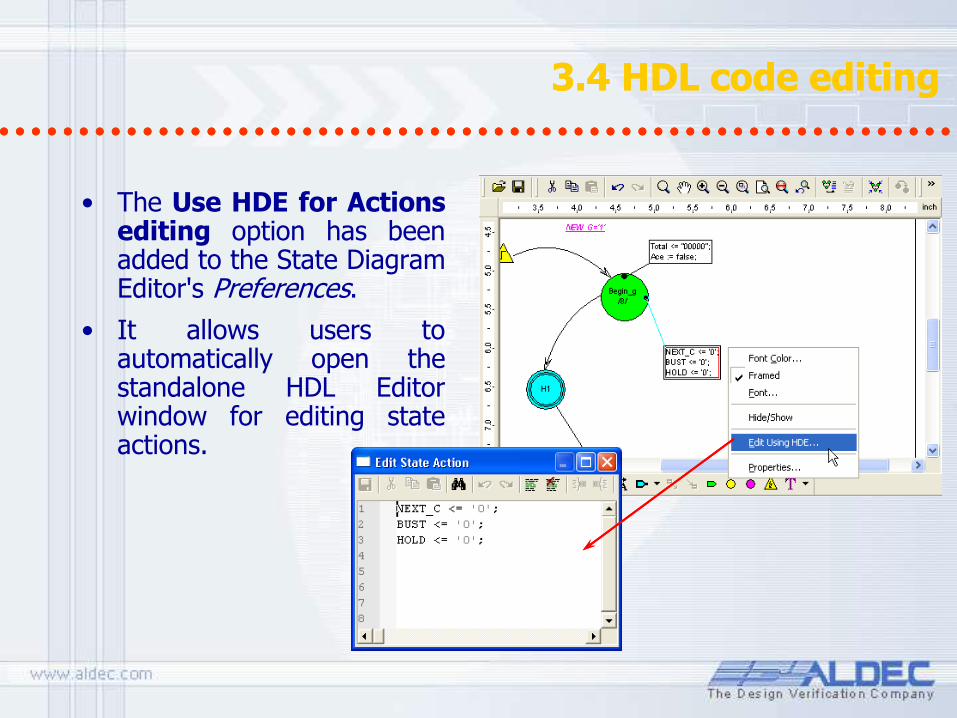
• The Use HDE for Actions editing option has been added to the State Diagram Editor's Preferences.
• It allows users to automatically open the standalone HDL Editor window for editing state actions.
3.5 Asynchronous machines 3.5 Asynchronous machines
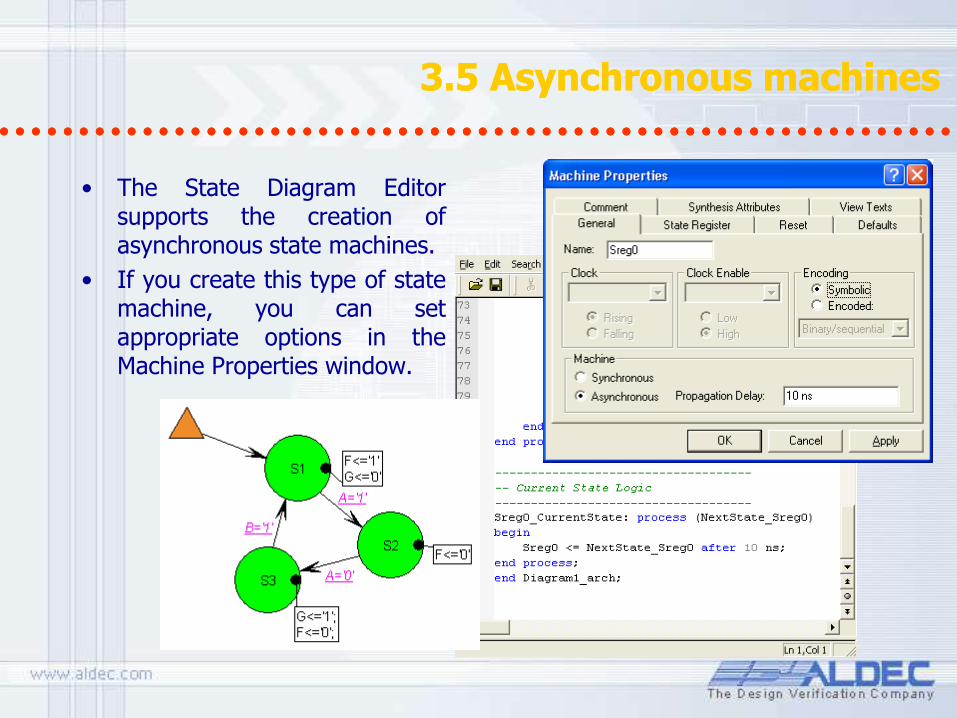
• The State Diagram Editor supports the creation of asynchronous state machines.
• If you create this type of state machine, you can set appropriate options in the Machine Properties window.
3.6 Multiple reset support 3.6 Multiple reset support
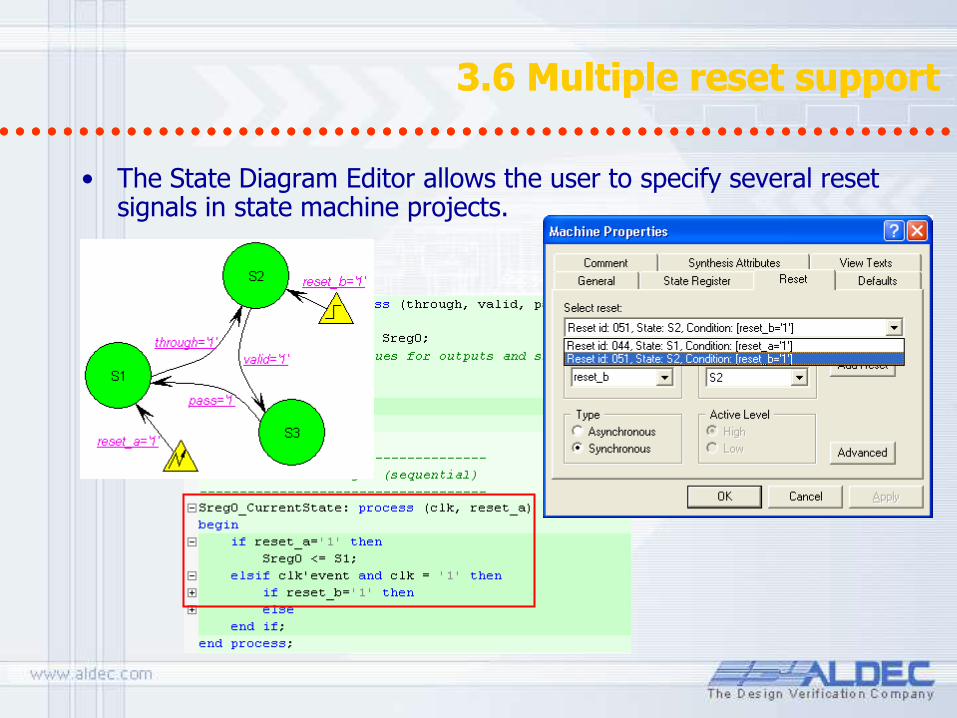
• The State Diagram Editor allows the user to specify several reset signals in state machine projects.
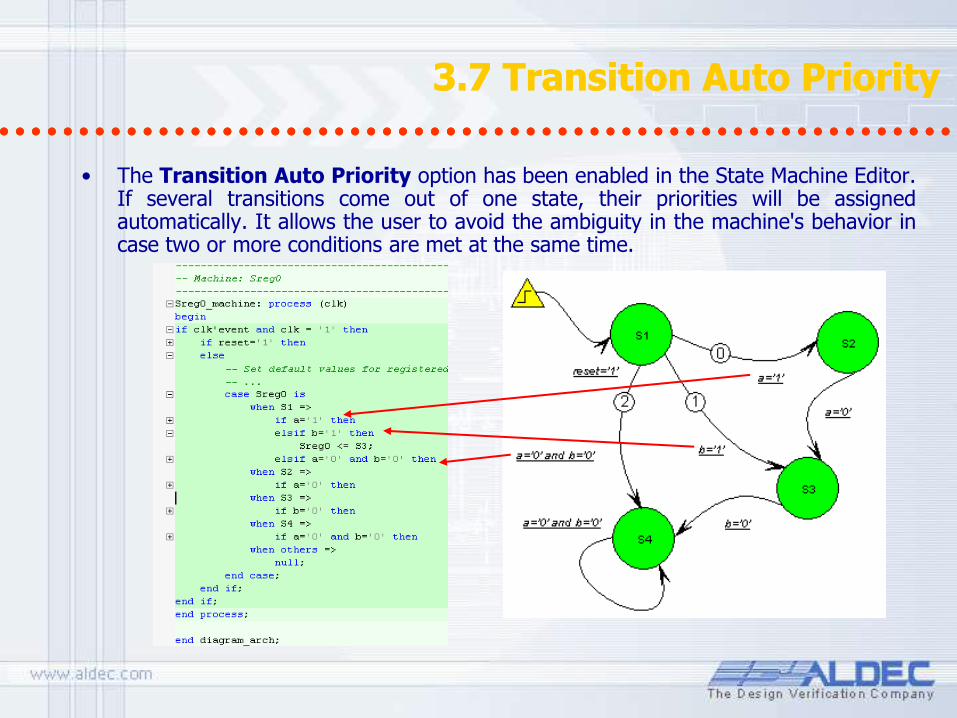
3.7 Transition Auto Priority 3.7 Transition Auto Priority
• The Transition Auto Priority option has been enabled in the State Machine Editor. If several transitions come out of one state, their priorities will be assigned automatically. It allows the user to avoid the ambiguity in the machine's behavior in case two or more conditions are met at the same time.
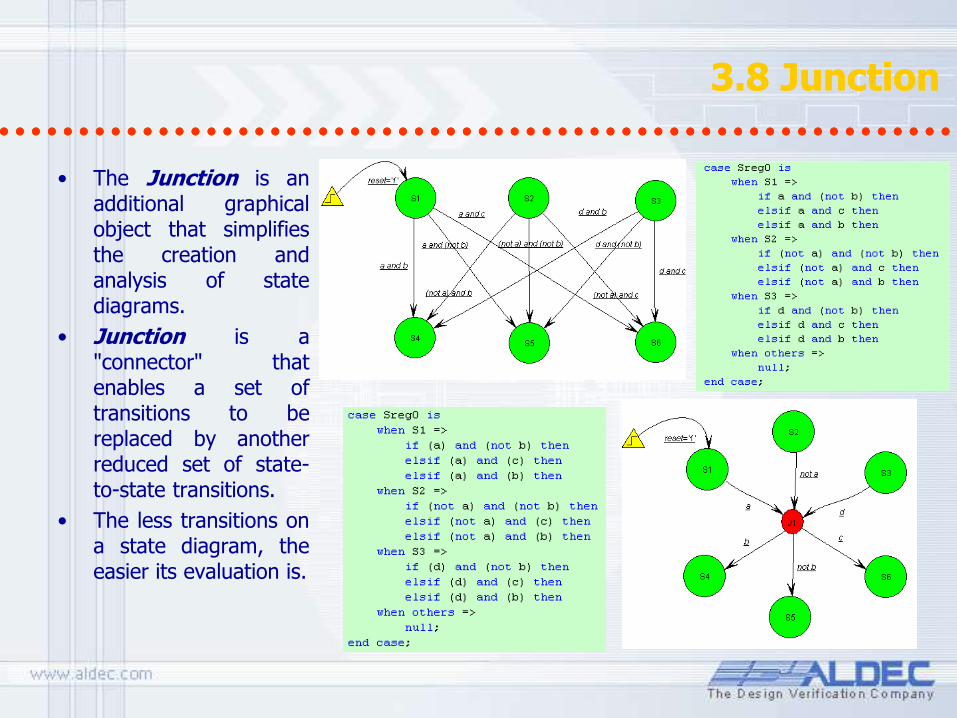
3.8 Junction 3.8 Junction
• The Junction is an additional graphical object that simplifies the creation and analysis of state diagrams.
• Junction is a "connector" that enables a set of transitions to be replaced by another reduced set of state-to-state transitions.
• The less transitions on a state diagram, the easier its evaluation is.
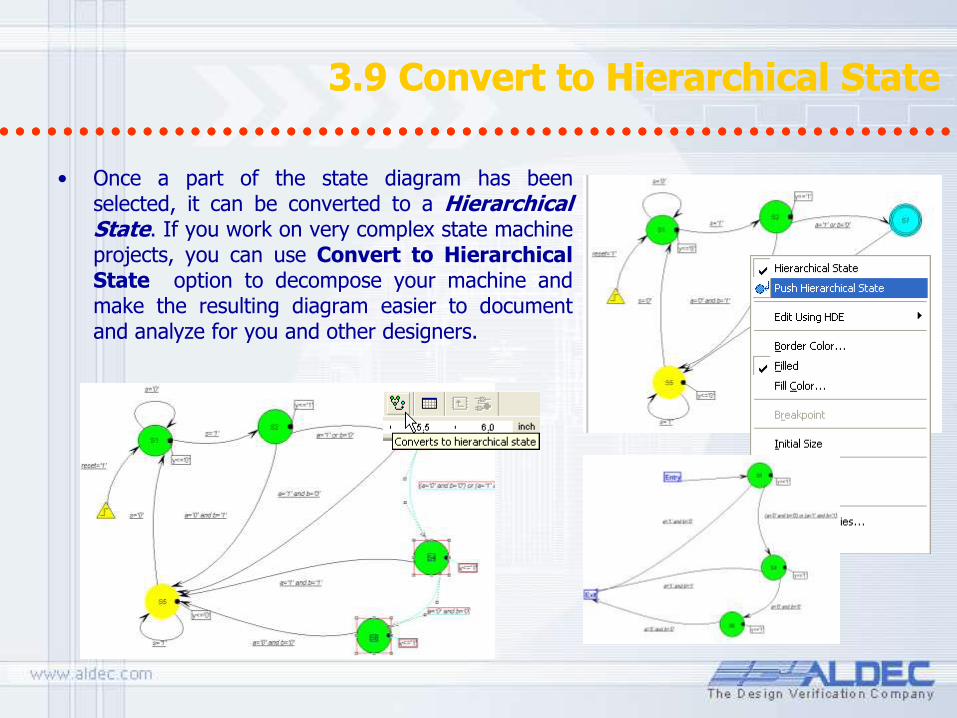
3.9 Convert to Hierarchical State 3.9 Convert to Hierarchical State
• Once a part of the state diagram has been selected, it can be converted to a Hierarchical State. If you work on very complex state machine projects, you can use Convert to Hierarchical State option to decompose your machine and make the resulting diagram easier to document and analyze for you and other designers.
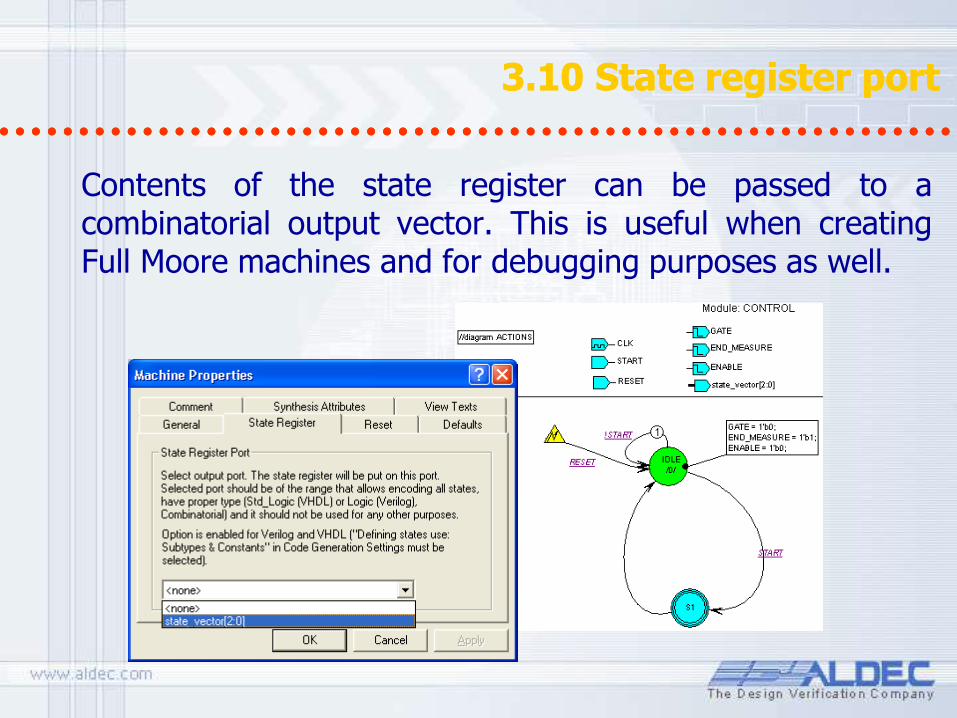
3.10 State register port 3.10 State register port
Contents of the state register can be passed to a combinatorial output vector. This is useful when creating Full Moore machines and for debugging purposes as well.
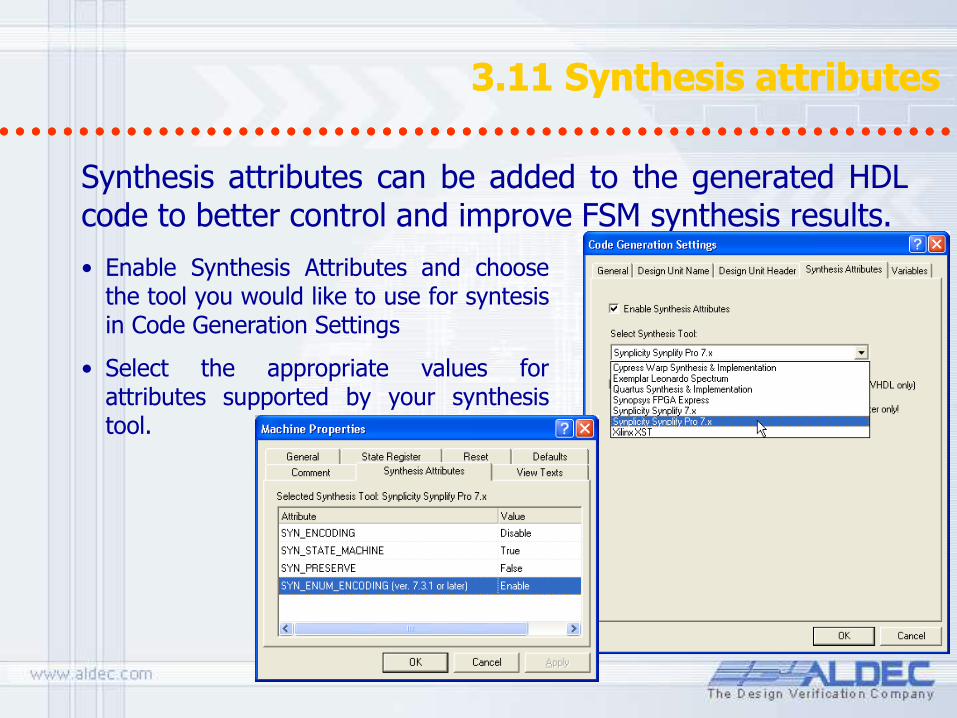
3.11 Synthesis attributes 3.11 Synthesis attributes
Synthesis attributes can be added to the generated HDL code to better control and improve FSM synthesis results.
• Enable Synthesis Attributes and choose the tool you would like to use for syntesis in Code Generation Settings
• Select the appropriate values for attributes supported by your synthesis tool.
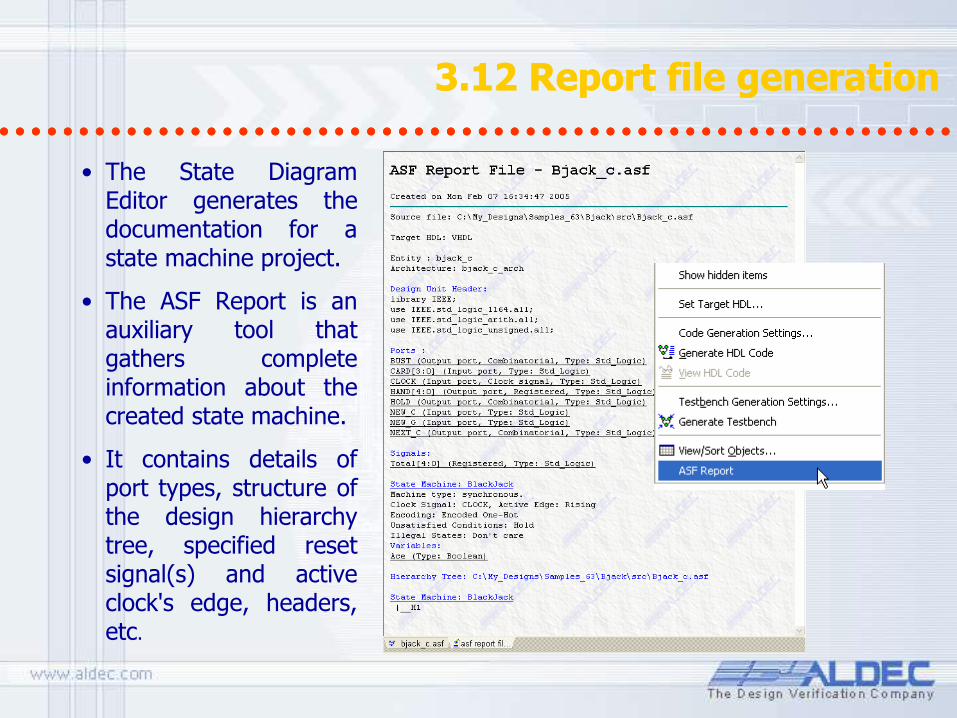
3.12 Report file generation 3.12 Report file generation
• The State Diagram Editor generates the documentation for a state machine project.
• The ASF Report is an auxiliary tool that gathers complete information about the created state machine.
• It contains details of port types, structure of the design hierarchy tree, specified reset signal(s) and active clock's edge, headers, etc.
Efficient Design Management
Part 4
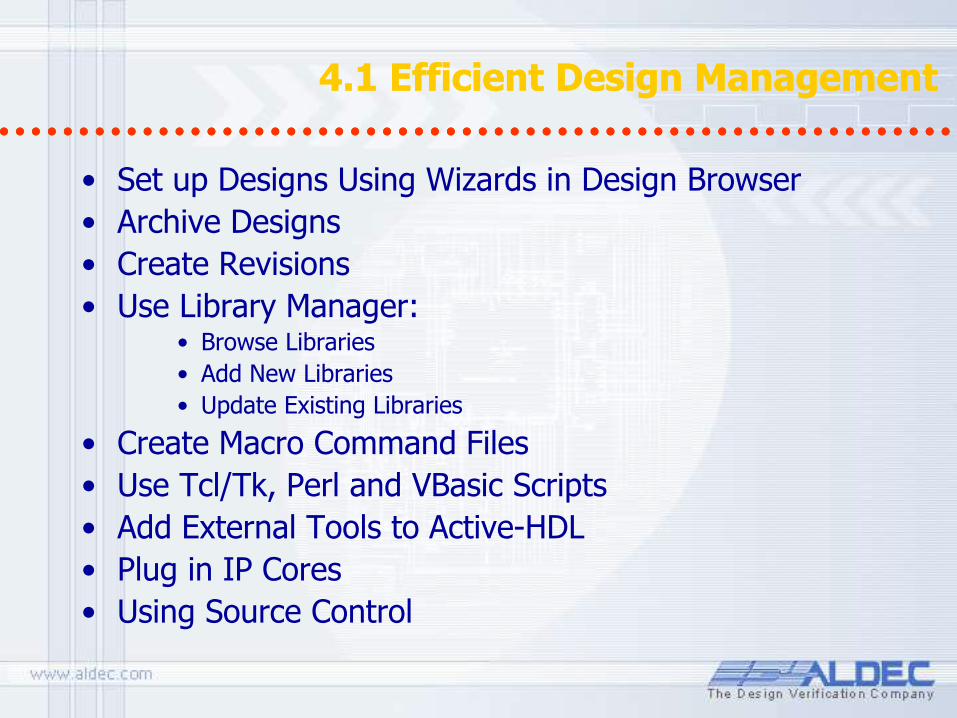
4.1 Efficient Design Management 4.1 Efficient Design Management
• Set up Designs Using Wizards in Design Browser
• Archive Designs
• Create Revisions
• Use Library Manager: • Browse Libraries
• Add New Libraries
• Update Existing Libraries
• Create Macro Command Files
• Use Tcl/Tk, Perl and VBasic Scripts
• Add External Tools to Active-HDL
• Plug in IP Cores
• Using Source Control

4.2 Using Design Browser 4.2 Using Design Browser
• Add, remove, view, modify, or perform another specific operation on the resource files.
• View the contents of the libraries present in the current design.
• View the elaborated structure of the currently selected simulation top-level design unit.
• View objects defined within specific regions of the simulated design units.
The Design Browser is a tool designed for managing the attached design resources.
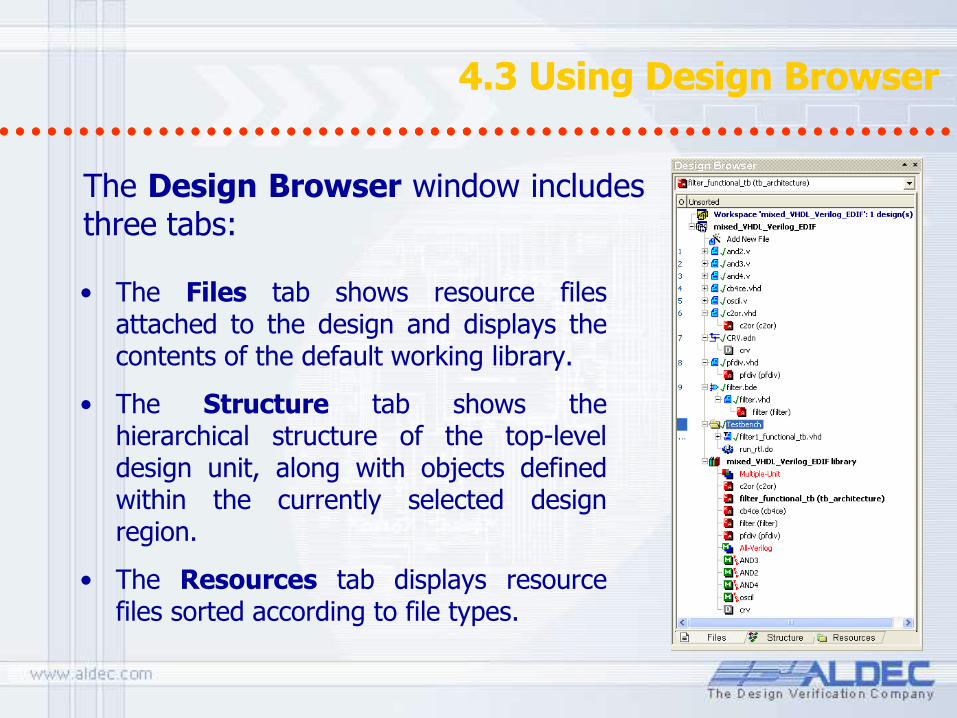
4.3 Using Design Browser 4.3 Using Design Browser
• The Files tab shows resource files attached to the design and displays the contents of the default working library.
• The Structure tab shows the hierarchical structure of the top-level design unit, along with objects defined within the currently selected design region.
• The Resources tab displays resource files sorted according to file types.
The Design Browser window includes three tabs:
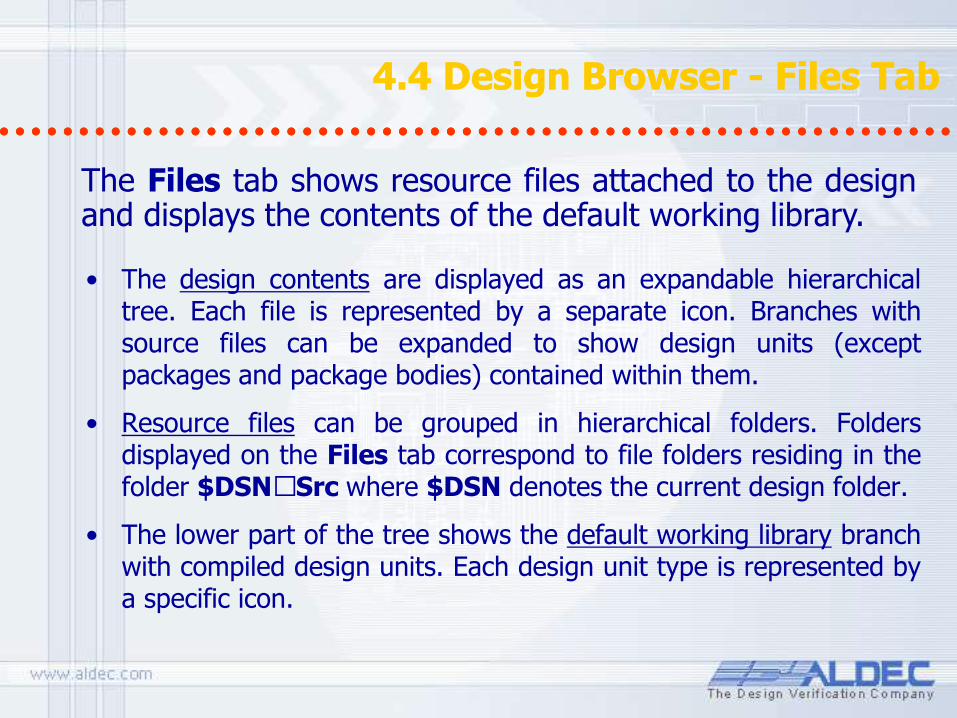
4.4 Design Browser - Files Tab 4.4 Design Browser - Files Tab
• The design contents are displayed as an expandable hierarchical tree. Each file is represented by a separate icon. Branches with source files can be expanded to show design units (except packages and package bodies) contained within them.
• Resource files can be grouped in hierarchical folders. Folders displayed on the Files tab correspond to file folders residing in the folder $DSN\Src where $DSN denotes the current design folder.
• The lower part of the tree shows the default working library branch with compiled design units. Each design unit type is represented by a specific icon.
The Files tab shows resource files attached to the design and displays the contents of the default working library.
4.5 Design Browser - Files Tab Resource File Types
4.5 Design Browser - Files Tab Resource File Types
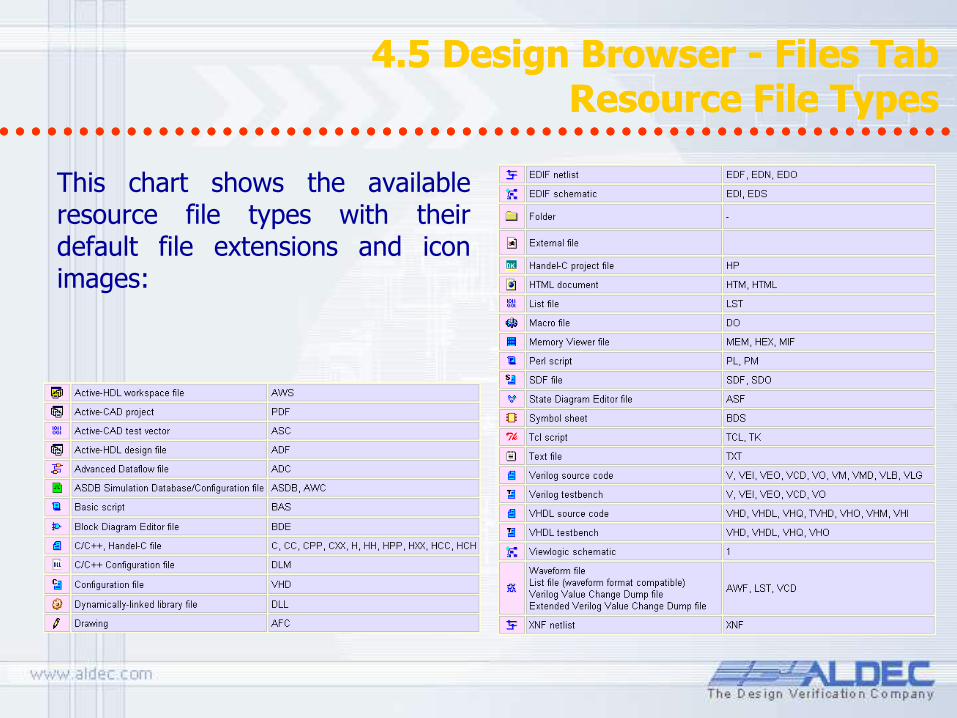
This chart shows the available resource file types with their default file extensions and icon images:
4.5.1 Design Browser - Files Tab File status display
4.5.1 Design Browser - Files Tab File status display
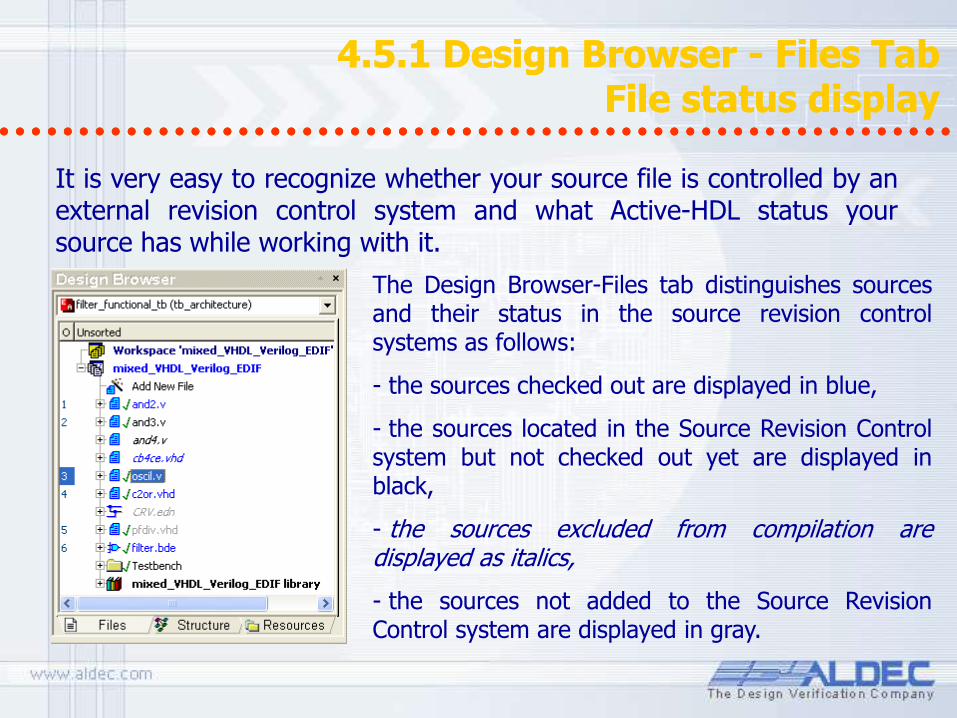
It is very easy to recognize whether your source file is controlled by an external revision control system and what Active-HDL status your source has while working with it.
The Design Browser-Files tab distinguishes sources and their status in the source revision control systems as follows:
- the sources checked out are displayed in blue,
- the sources located in the Source Revision Control system but not checked out yet are displayed in black,
- the sources excluded from compilation are displayed as italics,
- the sources not added to the Source Revision Control system are displayed in gray.
4.5.2 Design Browser - Files Tab Compilation Order
4.5.2 Design Browser - Files Tab Compilation Order
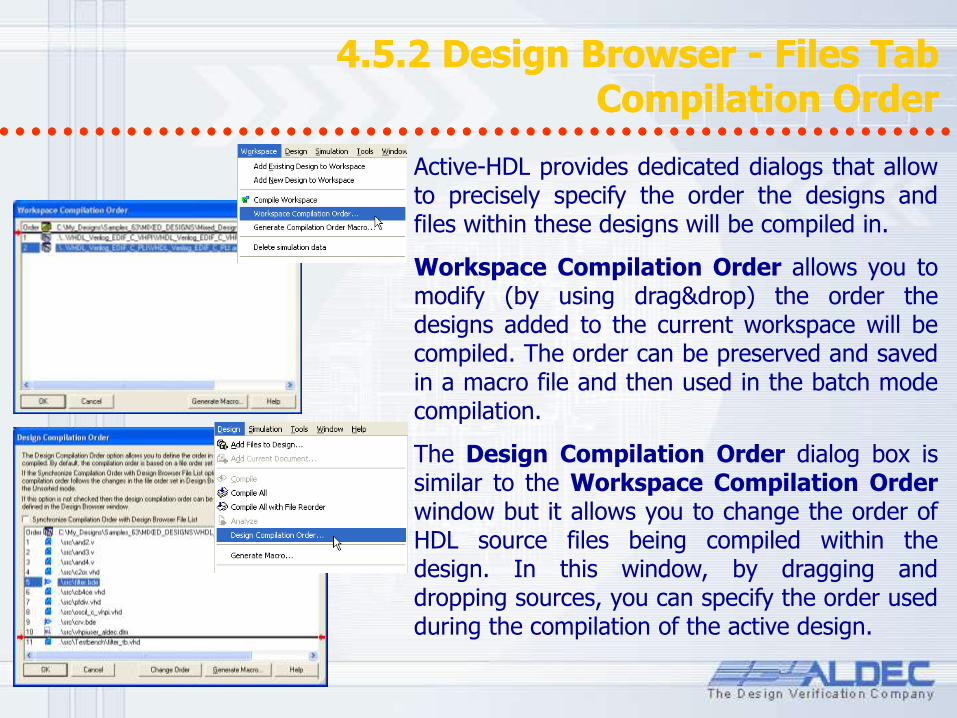
Active-HDL provides dedicated dialogs that allow to precisely specify the order the designs and files within these designs will be compiled in.
Workspace Compilation Order allows you to modify (by using drag&drop) the order the designs added to the current workspace will be compiled. The order can be preserved and saved in a macro file and then used in the batch mode compilation.
The Design Compilation Order dialog box is similar to the Workspace Compilation Order window but it allows you to change the order of HDL source files being compiled within the design. In this window, by dragging and dropping sources, you can specify the order used during the compilation of the active design.
4.5.3 Design Browser - Files Tab Design Unit Types
4.5.3 Design Browser - Files Tab Design Unit Types
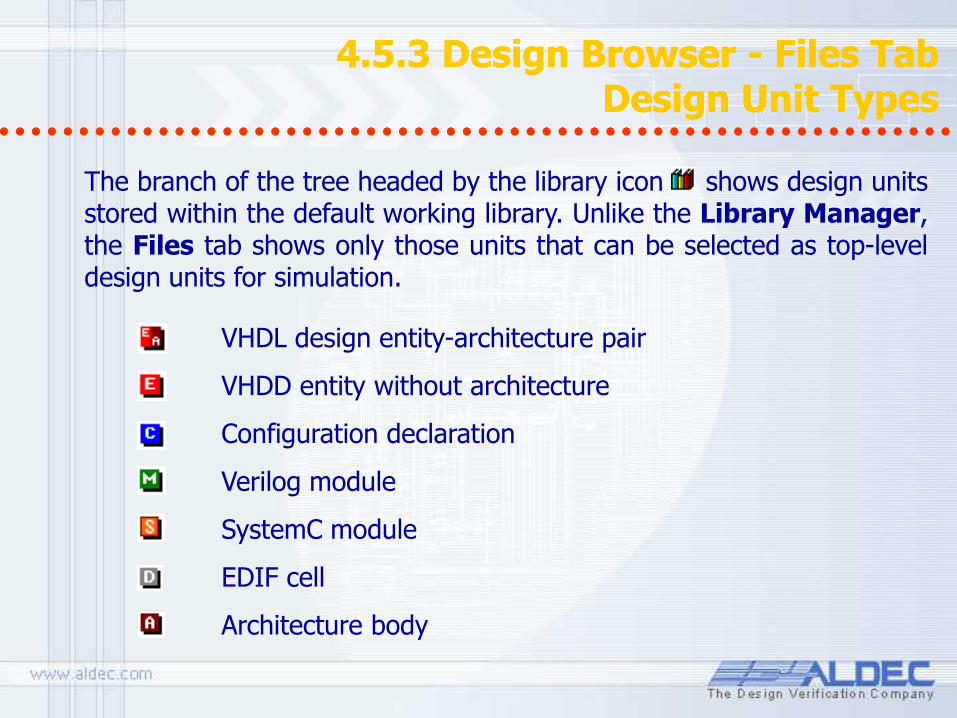
The branch of the tree headed by the library icon shows design units stored within the default working library. Unlike the Library Manager, the Files tab shows only those units that can be selected as top-level design units for simulation.
VHDL design entity-architecture pair
VHDD entity without architecture
Configuration declaration
Verilog module
SystemC module
EDIF cell
Architecture body
4.6 Design Browser - Structure Tab 4.6 Design Browser - Structure Tab
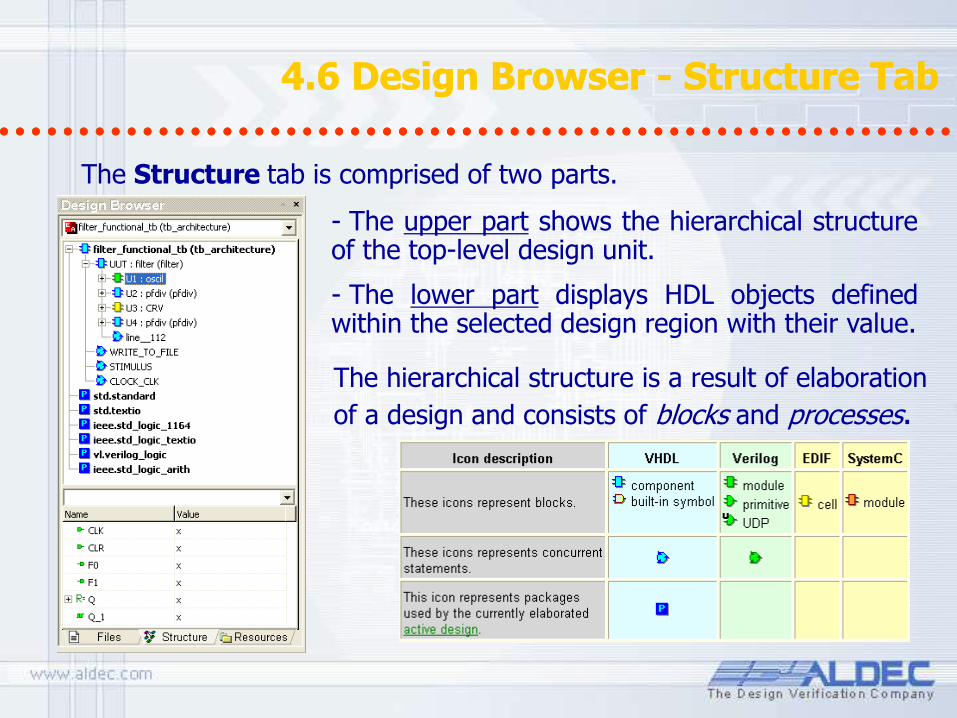
The hierarchical structure is a result of elaboration
of a design and consists of blocks and processes.
The Structure tab is comprised of two parts.
- The upper part shows the hierarchical structure of the top-level design unit.
- The lower part displays HDL objects defined within the selected design region with their value.

4.6.1 Design Browser - Structure Tab 4.6.1 Design Browser - Structure Tab
• A block results from elaboration of one of the following concurrent statements:
– Block statement
– Generate statement (zero, one or more blocks may result)
– Component instantiation statements
• A process results from elaboration of one of the concurrent statements.
– Process statement
– Concurrent procedure call statement
– Concurrent assertion statement
– Concurrent signal assignment statement
The hierarchical structure resulting from elaboration of a design consists of blocks and processes.
After the compilation the “Top-Level” unit is detected.
4.6.2 Design Browser - Structure Tab 4.6.2 Design Browser - Structure Tab
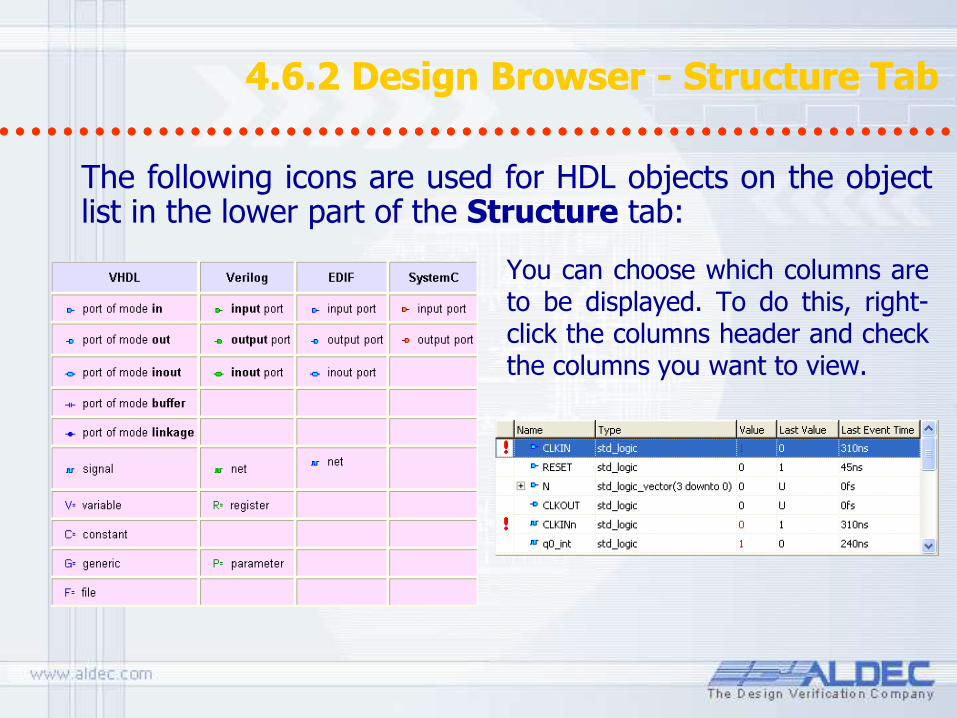
You can choose which columns are to be displayed. To do this, right-click the columns header and check the columns you want to view.
The following icons are used for HDL objects on the object list in the lower part of the Structure tab:

4.6.3 Design Browser - Structure Tab Multiple architectures and configuration support
4.6.3 Design Browser - Structure Tab Multiple architectures and configuration support
You can create several architectures for the same entity and easily prepare configuration declaration for your design.
Configuration file automatically updated

• Folder name.
• Set of file extensions. The resource folder will include resource files with matching extensions only.
• File folder to be scanned for resource files. The Design Browser will scan the contents of the specified file folder and all of its subfolders. You can specify a folder that does not belong to the current design.
4.7 Design Browser - Resources Tab 4.7 Design Browser - Resources Tab
The Resources tab shows resource files existing in the design sorted by their extension. The files are displayed in resource folders. For each resource folder you can define:
NOTE: Resource folders have nothing to do with file folders. They exist only on the Resources tab of the Design Browser.
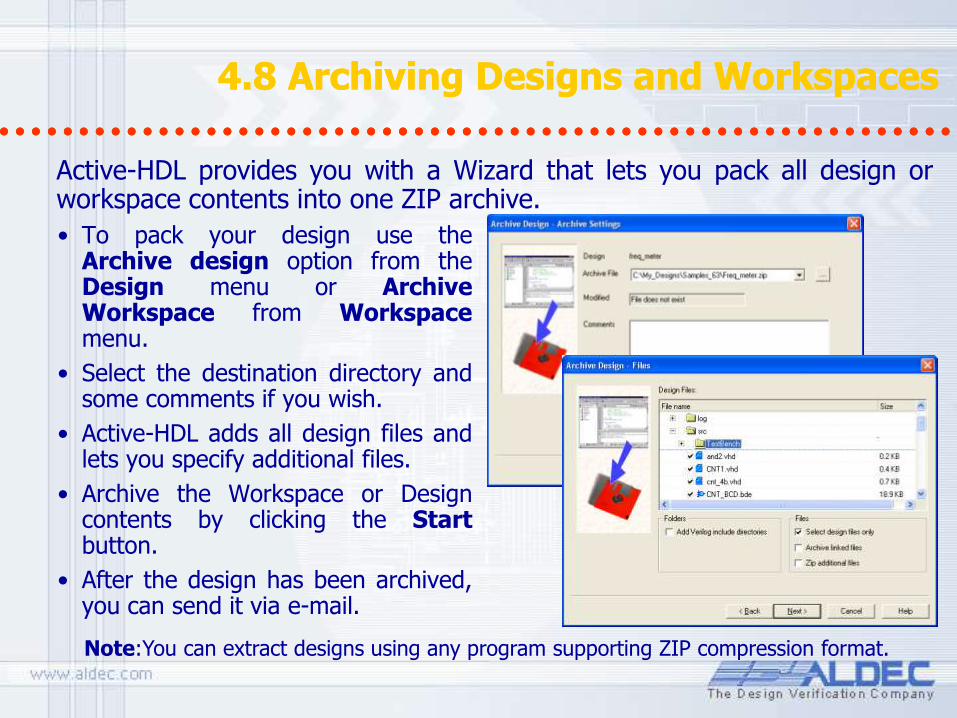
4.8 Archiving Designs and Workspaces 4.8 Archiving Designs and Workspaces
• To pack your design use the Archive design option from the Design menu or Archive Workspace from Workspace menu.
• Select the destination directory and some comments if you wish.
• Active-HDL adds all design files and lets you specify additional files.
• Archive the Workspace or Design contents by clicking the Start button.
• After the design has been archived, you can send it via e-mail.
Active-HDL provides you with a Wizard that lets you pack all design or workspace contents into one ZIP archive.
Note:You can extract designs using any program supporting ZIP compression format.
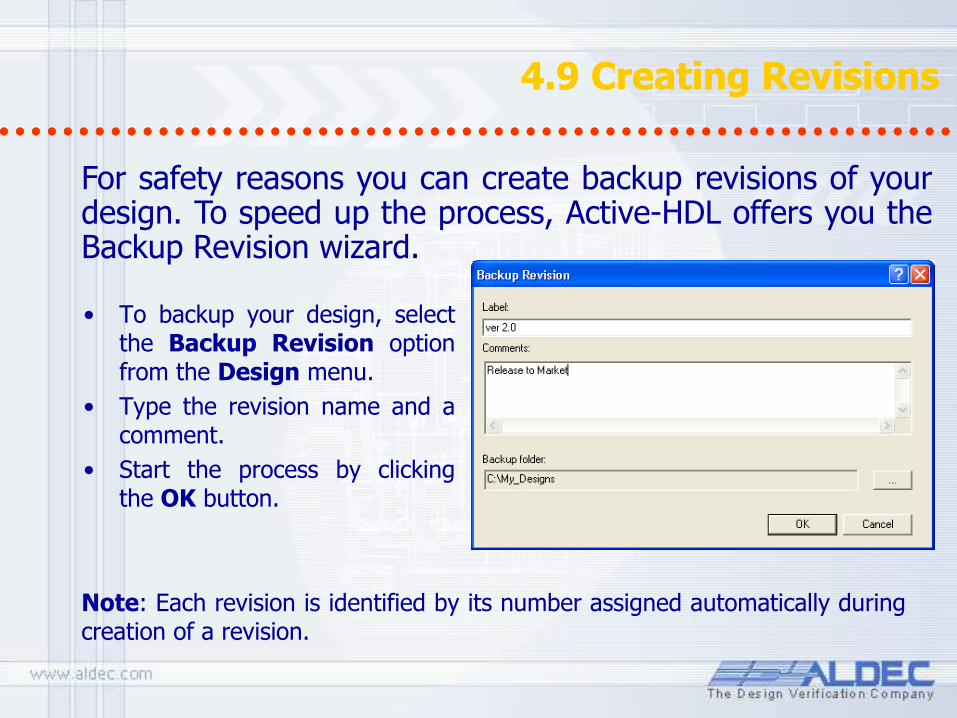
4.9 Creating Revisions 4.9 Creating Revisions
• To backup your design, select the Backup Revision option from the Design menu.
• Type the revision name and a comment.
• Start the process by clicking the OK button.
For safety reasons you can create backup revisions of your design. To speed up the process, Active-HDL offers you the Backup Revision wizard.
Note: Each revision is identified by its number assigned automatically during creation of a revision.
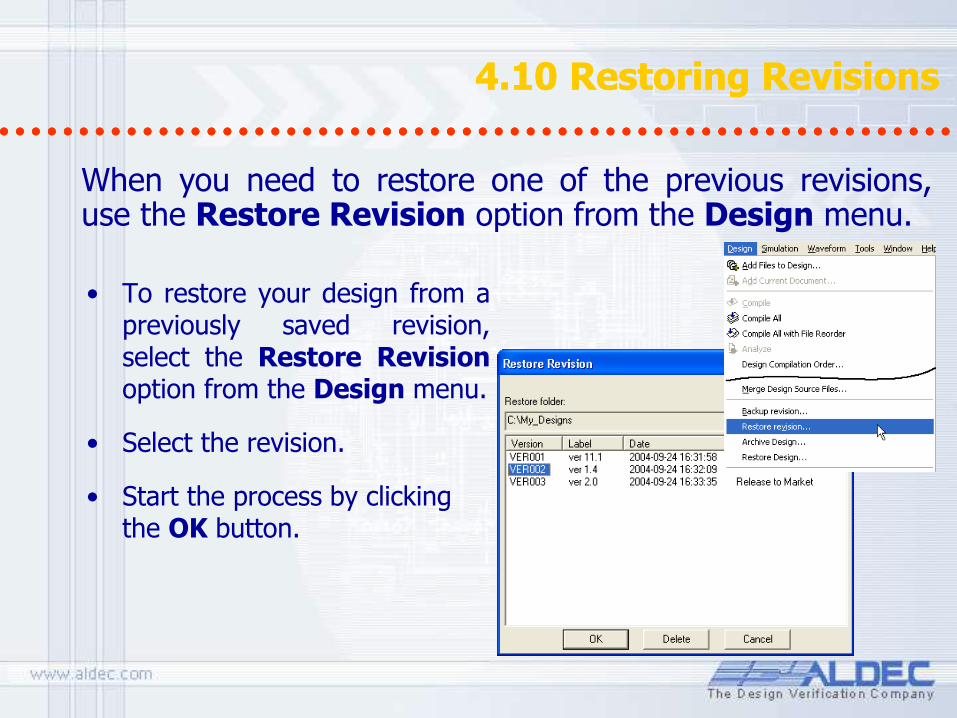
4.10 Restoring Revisions 4.10 Restoring Revisions
• To restore your design from a previously saved revision, select the Restore Revision option from the Design menu.
• Select the revision.
• Start the process by clicking the OK button.
When you need to restore one of the previous revisions, use the Restore Revision option from the Design menu.
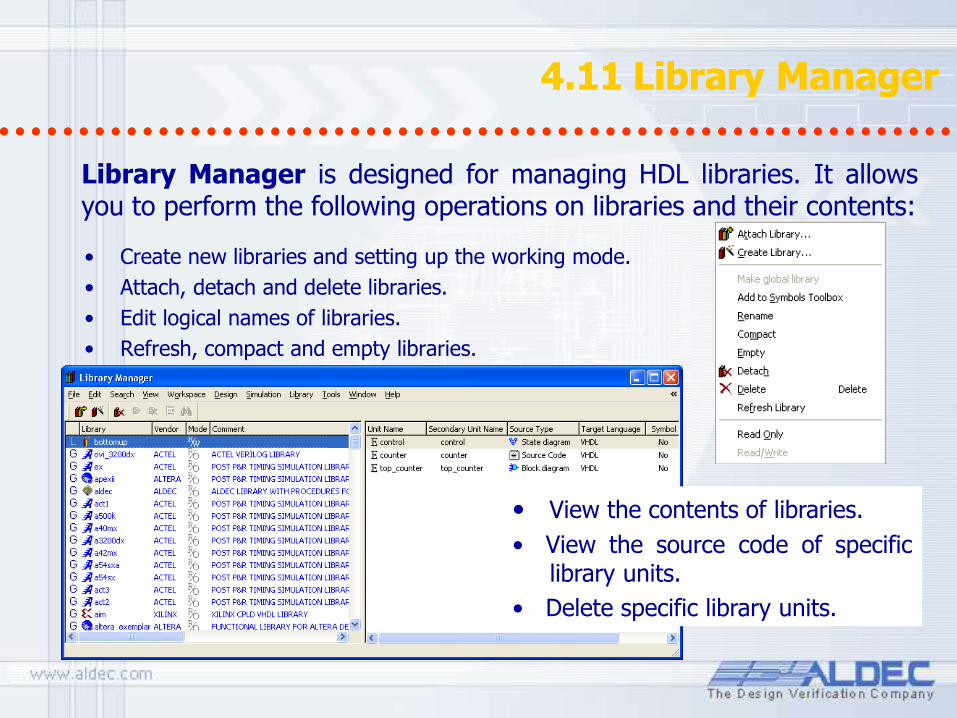
4.11 Library Manager 4.11 Library Manager
• Create new libraries and setting up the working mode.
• Attach, detach and delete libraries.
• Edit logical names of libraries.
• Refresh, compact and empty libraries.
Library Manager is designed for managing HDL libraries. It allows you to perform the following operations on libraries and their contents:
• View the contents of libraries.
• View the source code of specific library units.
• Delete specific library units.
• View the contents of libraries.
• View the source code of specific library units.
• Delete specific library units.

4.11.1 Library Manager 4.11.1 Library Manager
The Library Manager window contains two panels. The left pane shows a list of currently attached libraries and their parameters. It has five columns: • Library - displaying the logical name of the library.
• Vendor - displaying library vendor
• Mode - displaying the mode of the library:
• Read/Write (R/W)
• Read/Only (R/O)
• Comment - displaying an optional comment providing a short
description of the library contents.
• Directory - displaying the library index file with the full path.
4.11.2 Library Manager 4.11.2 Library Manager
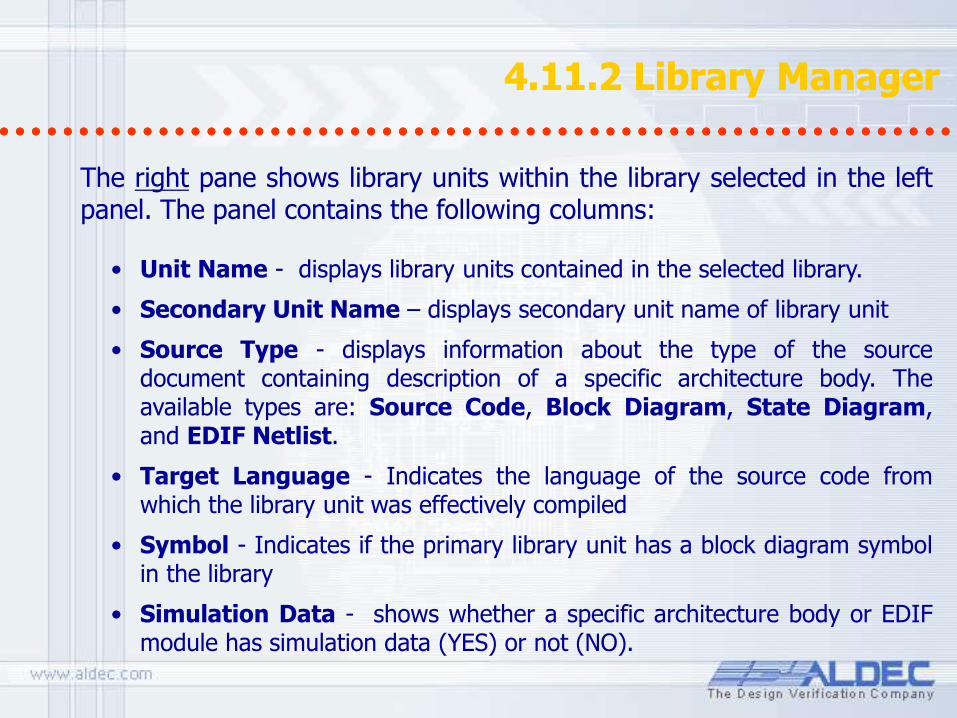
The right pane shows library units within the library selected in the left panel. The panel contains the following columns:
• Unit Name - displays library units contained in the selected library.
• Secondary Unit Name – displays secondary unit name of library unit
• Source Type - displays information about the type of the source document containing description of a specific architecture body. The available types are: Source Code, Block Diagram, State Diagram, and EDIF Netlist.
• Target Language - Indicates the language of the source code from which the library unit was effectively compiled
• Symbol - Indicates if the primary library unit has a block diagram symbol in the library
• Simulation Data - shows whether a specific architecture body or EDIF module has simulation data (YES) or not (NO).

4.11.3 Library Manager 4.11.3 Library Manager
Library Units and Secondary Units are represented by the following symbols:
4.11.4 Library Manager 4.11.4 Library Manager
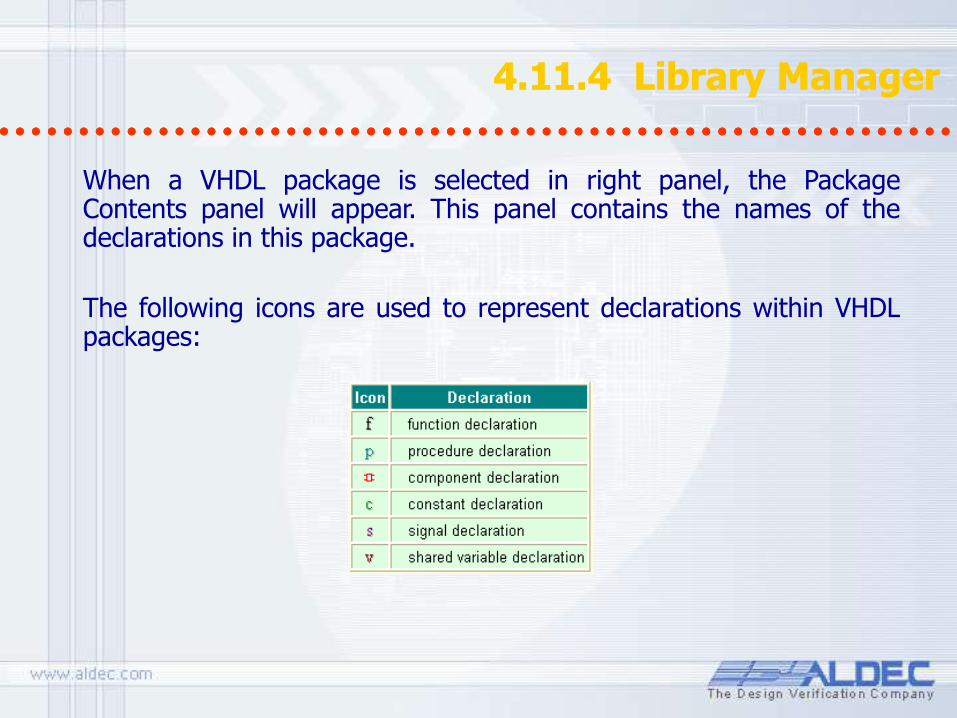
When a VHDL package is selected in right panel, the Package Contents panel will appear. This panel contains the names of the declarations in this package.
The following icons are used to represent declarations within VHDL packages:
4.11.5 Library Manager 4.11.5 Library Manager
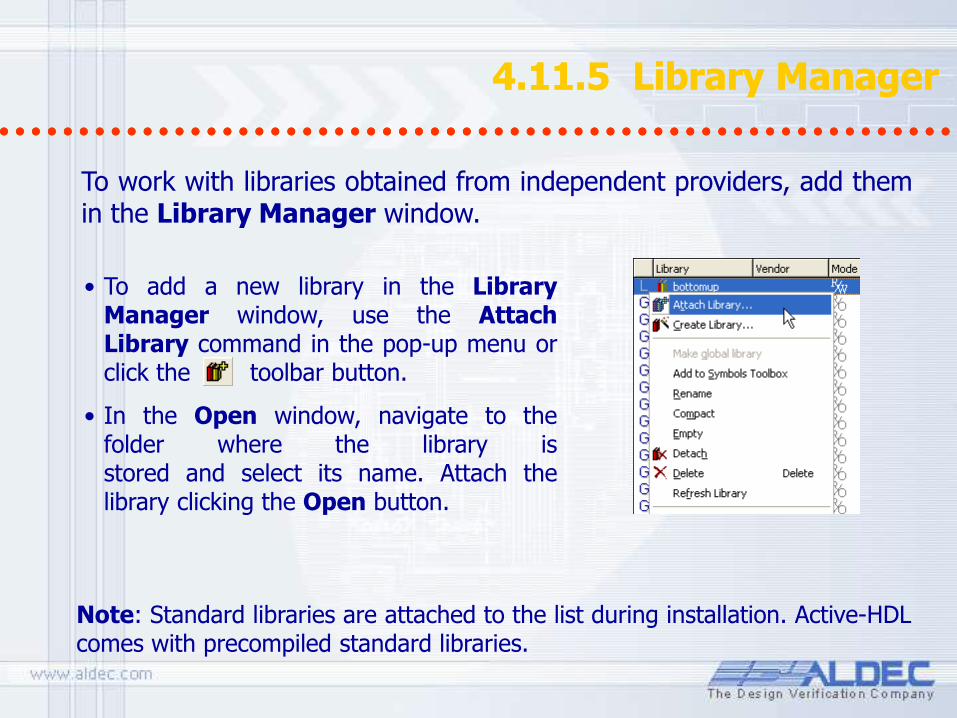
To work with libraries obtained from independent providers, add them in the Library Manager window.
Note: Standard libraries are attached to the list during installation. Active-HDL comes with precompiled standard libraries.
• To add a new library in the Library Manager window, use the Attach Library command in the pop-up menu or click the toolbar button.
• In the Open window, navigate to the folder where the library is stored and select its name. Attach the library clicking the Open button.
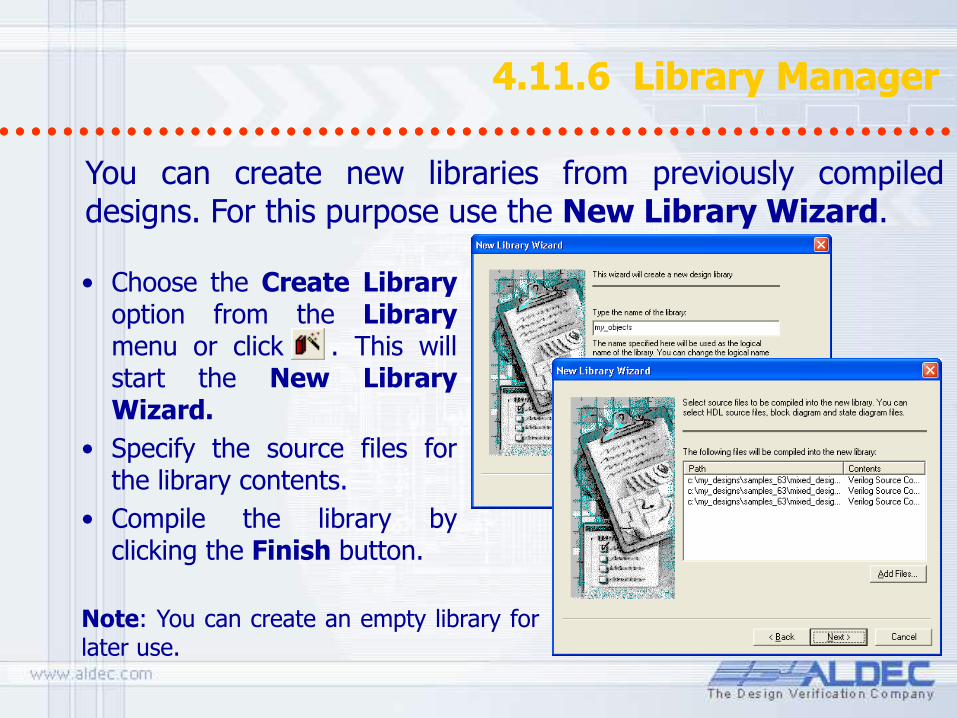
4.11.6 Library Manager 4.11.6 Library Manager
• Choose the Create Library option from the Library menu or click . This will start the New Library Wizard.
• Specify the source files for the library contents.
• Compile the library by clicking the Finish button.
You can create new libraries from previously compiled designs. For this purpose use the New Library Wizard.
Note: You can create an empty library for later use.

4.12 Creating Macro Command Files 4.12 Creating Macro Command Files
• To execute a single macro command, enter it in the Console window with appropriate parameters. The moment you press Enter, the command will be executed.
• To execute a macro command file that contains a sequence of macro commands, enter the following command line in the Console window:
do <filename> [ <parameter_value> ...]
• To find out more about particular command, type the line:
help <command_name>
This will open the Help window with the topic describing the command behavior and syntax.
Active-HDL’s macro language has been designed to enable the user to work with Active-HDL without using the graphical user interface (GUI). You can get most of the Active-HDL functionality by entering the appropriate macro commands in the Console window and without touching the mouse.
4.12.1 Creating Macro Command Files 4.12.1 Creating Macro Command Files
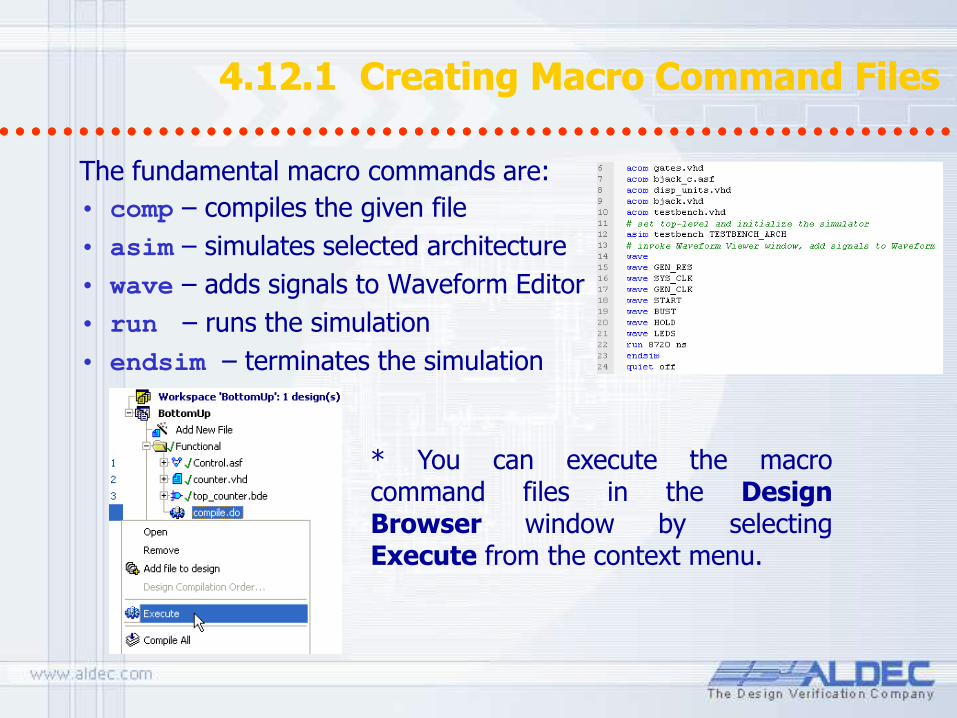
The fundamental macro commands are:
• comp – compiles the given file
• asim – simulates selected architecture
• wave – adds signals to Waveform Editor
• run – runs the simulation
• endsim – terminates the simulation
* You can execute the macro command files in the Design Browser window by selecting Execute from the context menu.

4.12.2 Creating Macro Command Files 4.12.2 Creating Macro Command Files
Active-HDL provides also a very convenient mechanism for automated generation of compilation macros for entire Workspace and Designs. These macros can be also generated for VSimSA standalone simulator for use in batch mode.
4.13 Using Tcl/Tk Scripts 4.13 Using Tcl/Tk Scripts
• Tcl/Tk script can be either executed from Design Browser context menu or from the Console by entering the runscript command followed by the script file name:
runscript <scriptname> [ <parameter_value> ...]
• Tcl/Tk scripts can provide the same functionality as the Active-HDL macro language.
Tcl (Tool Command Language) is a simple yet powerful scripting language for controlling and extending applications. Tcl together with its Tk extension, provide a programming system for developing and using graphical user interface (GUI) applications.
A Tcl/Tk script is a text file containing a program created in the Tcl language.
4.13.1 Using Tcl/Tk Scripts 4.13.1 Using Tcl/Tk Scripts
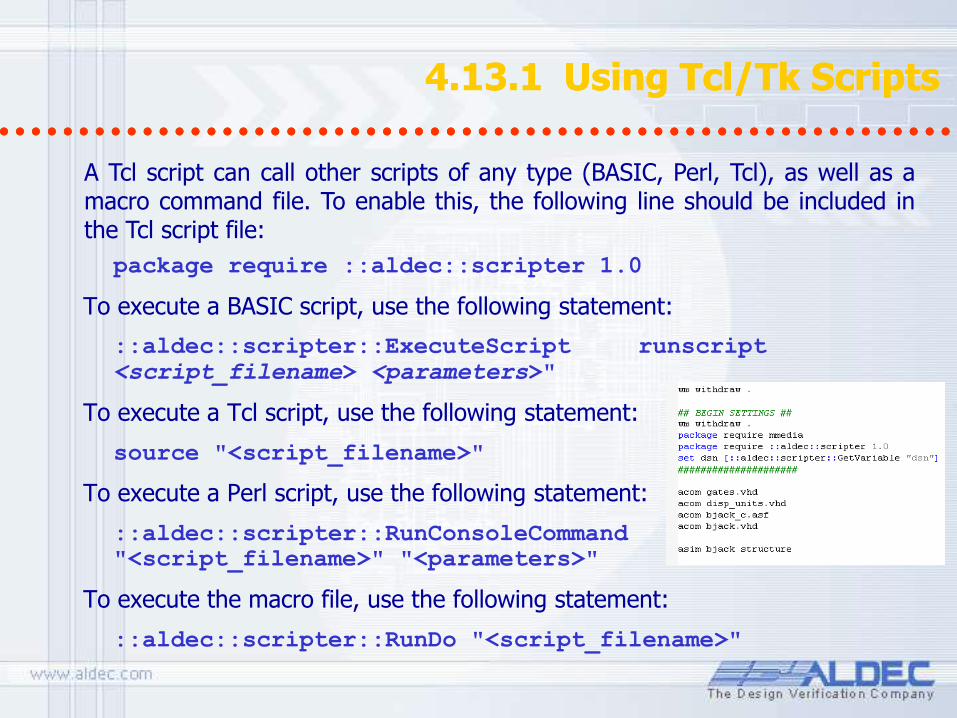
package require ::aldec::scripter 1.0
To execute a BASIC script, use the following statement:
::aldec::scripter::ExecuteScript runscript
<script_filename> <parameters>"
To execute a Tcl script, use the following statement:
source "<script_filename>"
To execute a Perl script, use the following statement:
::aldec::scripter::RunConsoleCommand
"<script_filename>" "<parameters>"
To execute the macro file, use the following statement:
::aldec::scripter::RunDo "<script_filename>"
A Tcl script can call other scripts of any type (BASIC, Perl, Tcl), as well as a macro command file. To enable this, the following line should be included in the Tcl script file:
4.13.2 Using Tcl/Tk Scripts 4.13.2 Using Tcl/Tk Scripts
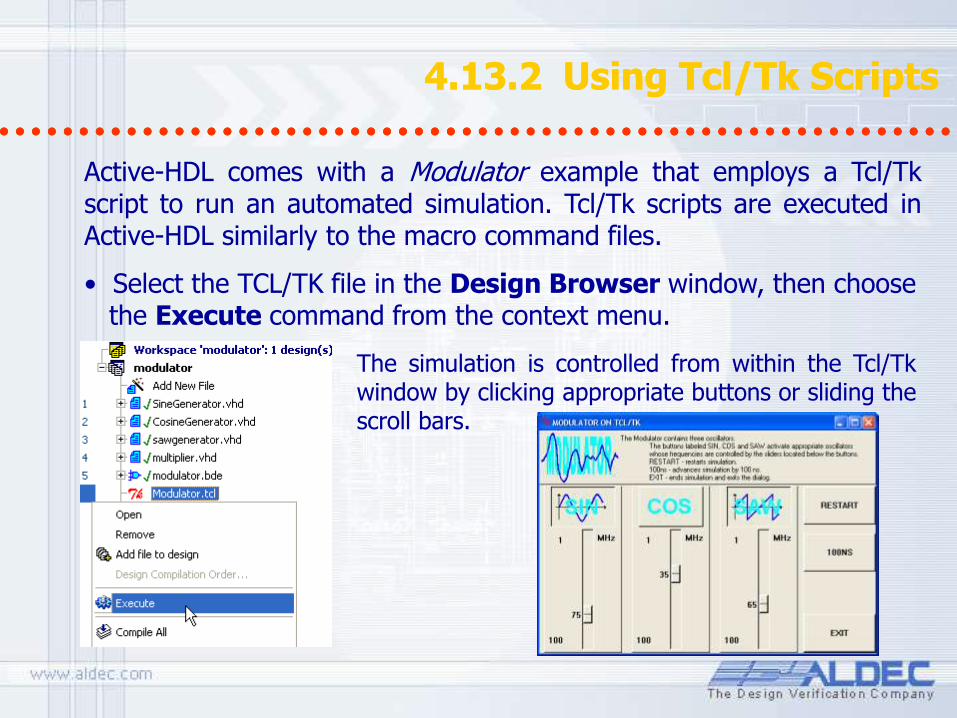
Active-HDL comes with a Modulator example that employs a Tcl/Tk script to run an automated simulation. Tcl/Tk scripts are executed in Active-HDL similarly to the macro command files.
• Select the TCL/TK file in the Design Browser window, then choose the Execute command from the context menu.
The simulation is controlled from within the Tcl/Tk window by clicking appropriate buttons or sliding the scroll bars.
4.14 Using BASIC and Perl Scripts 4.14 Using BASIC and Perl Scripts
• Perl and Basic scripts can be invoked from the Design Browser or from the Console window.
• To execute a script file in the Design Browser, add it to the design using the Add New File wizard. Then right-click on the script file and choose the Execute option from the context menu.
• In the Console window, enter the runscript command followed by the script file name:
runscript <scriptname> [ <parameter_value> ...]
Active-HDL allows you to work with Perl and VisualBasic scripts as well.
Note: In order to execute scripts from the Console window without necessity to use runscript command, BASIC scripts should be placed in the Scripts folder located in the Active-HDL home directory and Perl scripts should be stored in the Scripts/Perl subfolder.

4.15 Using Scripts 4.15 Using Scripts
The Active-HDL command interpreter provides a few special features related to the string interpretation:
• Any string surrounded by brace brackets ({ }) is treated exactly as it looks. This is useful when you use values (for example, strings with spaces or other special characters inside) that would be normally misinterpreted:
set time 10" #this command will fail (# Error: missing ")
set time {10"} #this command will succeed
• The exclamation mark (!) sign preceding a string allows executing system shell commands. The Console window also allows users to execute system shell commands.
set -- displays the Aldec’s environment variables, while
!set -- displays the system variables.

4.15.1 Using Scripts 4.15.1 Using Scripts
• Any string surrounded by square brackets ([ ]) is treated as a valid Active-HDL macro language subcommand and executed in the first place. The result of the subcommand replaces the square brackets before the higher level command runs. This is used for nesting commands.
• The macro files can be easily created by using the GUI interface. Users can do this if the Commands transcript on option in the Preferences | Environment | Console category is checked. When this option is checked, user actions are translated into the Active-HDL Macro Language commands and displayed in the Console window. Then, they can be copied and pasted to a new script file. In the future, this sequence of macro commands can be executed automatically as a script.
4.16 Interfacing External Tools 4.16 Interfacing External Tools
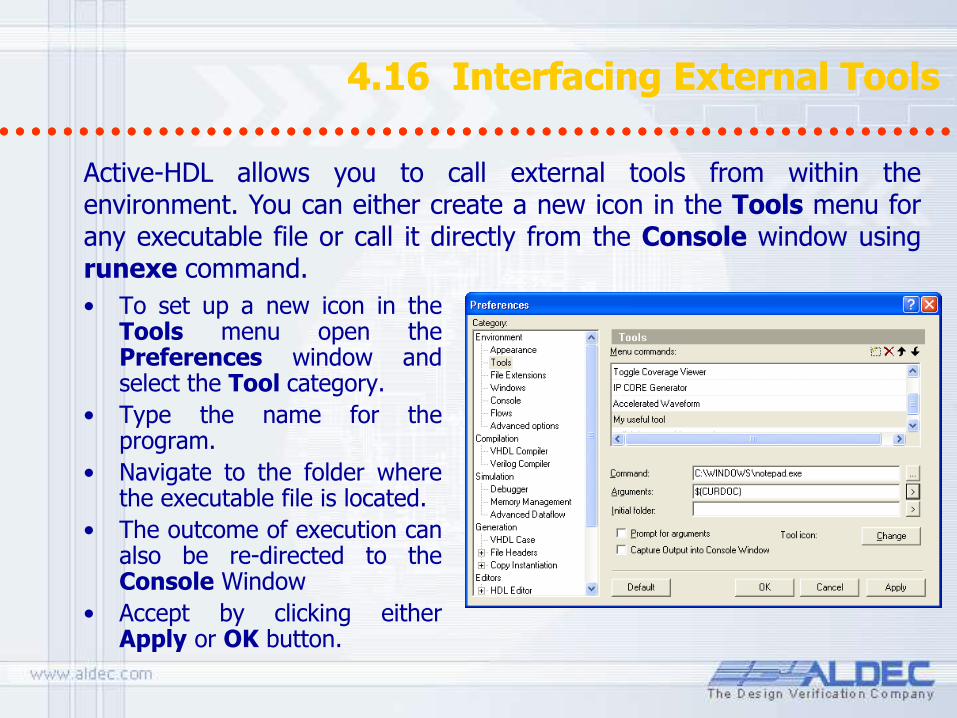
• To set up a new icon in the Tools menu open the Preferences window and select the Tool category.
• Type the name for the program.
• Navigate to the folder where the executable file is located.
• The outcome of execution can also be re-directed to the Console Window
• Accept by clicking either Apply or OK button.
Active-HDL allows you to call external tools from within the environment. You can either create a new icon in the Tools menu for any executable file or call it directly from the Console window using runexe command.
4.17 Interfacing External Tools 4.17 Interfacing External Tools
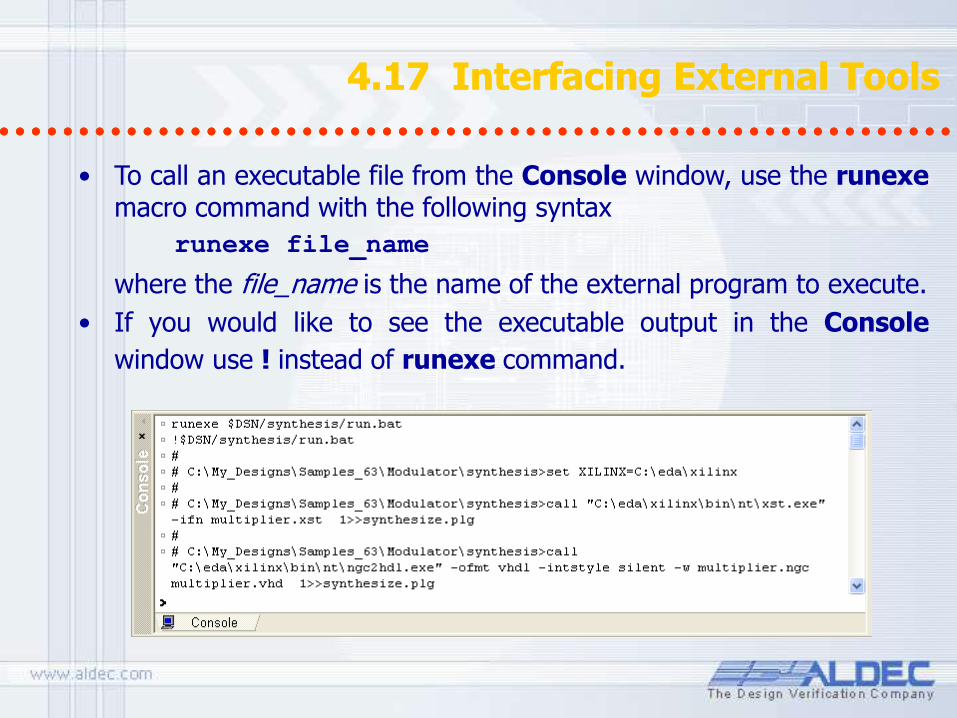
• To call an executable file from the Console window, use the runexe macro command with the following syntax
runexe file_name
where the file_name is the name of the external program to execute.
• If you would like to see the executable output in the Console
window use ! instead of runexe command.

4.18 Using IP Cores 4.18 Using IP Cores
1. Open an existing design or set up a new one.
2. Use the Add New File dialog.
3. Select the Empty file tab and click the Add existing file button.
4. Navigate to the folder where the IP core file is saved. Click its name.
5. Click the Add button.
6. Instantiate the IP core to use it in the current project.
With HDL Intellectual Property modules (IP cores) obtained from various providers, you can build your design faster and with less effort. IP cores usually come in the form of HDL code or EDIF netlist
files. The following steps must be taken to utilize an IP core module:
Note: The remaining steps are identical with the typical design development process. See Part 1 and 2.
4.19 Using IP Core Generator 4.19 Using IP Core Generator
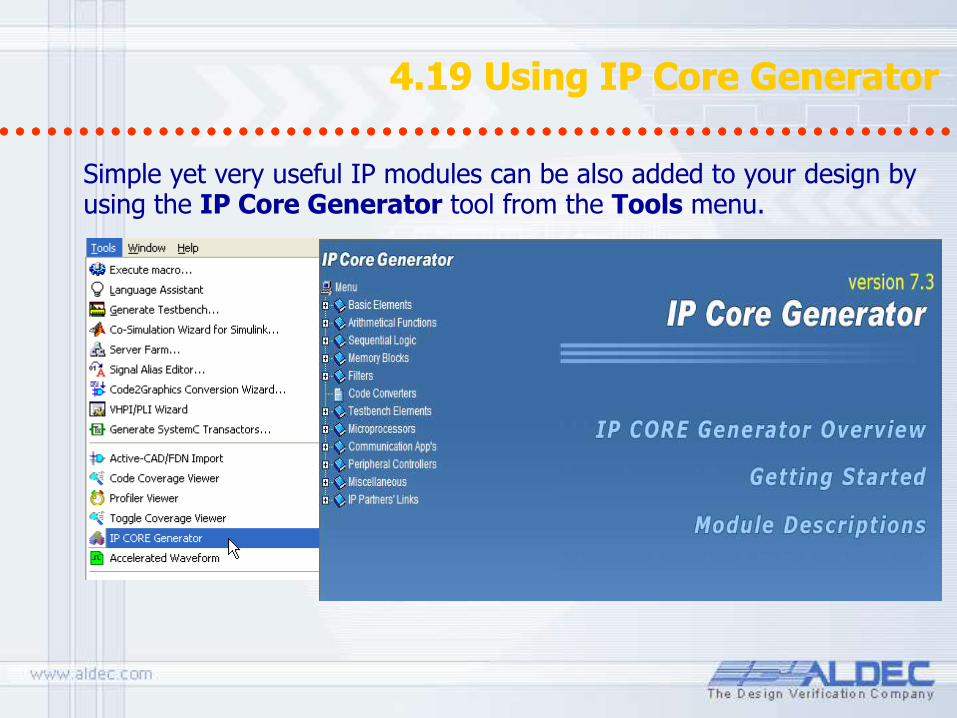
Simple yet very useful IP modules can be also added to your design by using the IP Core Generator tool from the Tools menu.
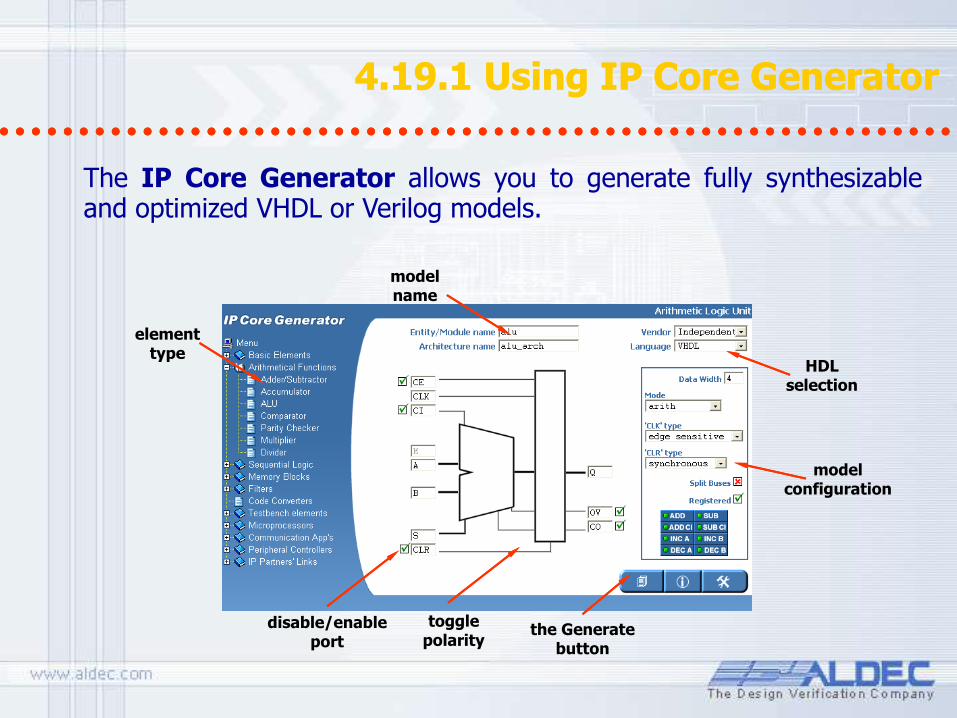
4.19.1 Using IP Core Generator 4.19.1 Using IP Core Generator
The IP Core Generator allows you to generate fully synthesizable and optimized VHDL or Verilog models.
model name
element type
disable/enable port
HDL selection
model configuration
the Generate button
toggle polarity
4.20 Using Source Control 4.20 Using Source Control
Source Control enables communication between Active-HDL and external Source Revision Control systems. However, there are options that can be used or invoked from the Source Revision Control system only. To use such features, you do not need to leave the Active-HDL simulator to run your Source Revision Control tool. You can use the Source Control Manager option from the Tools|Source Control menu. This option invokes your currently initialized Source Revision Control system directly from the Active-HDL environment.
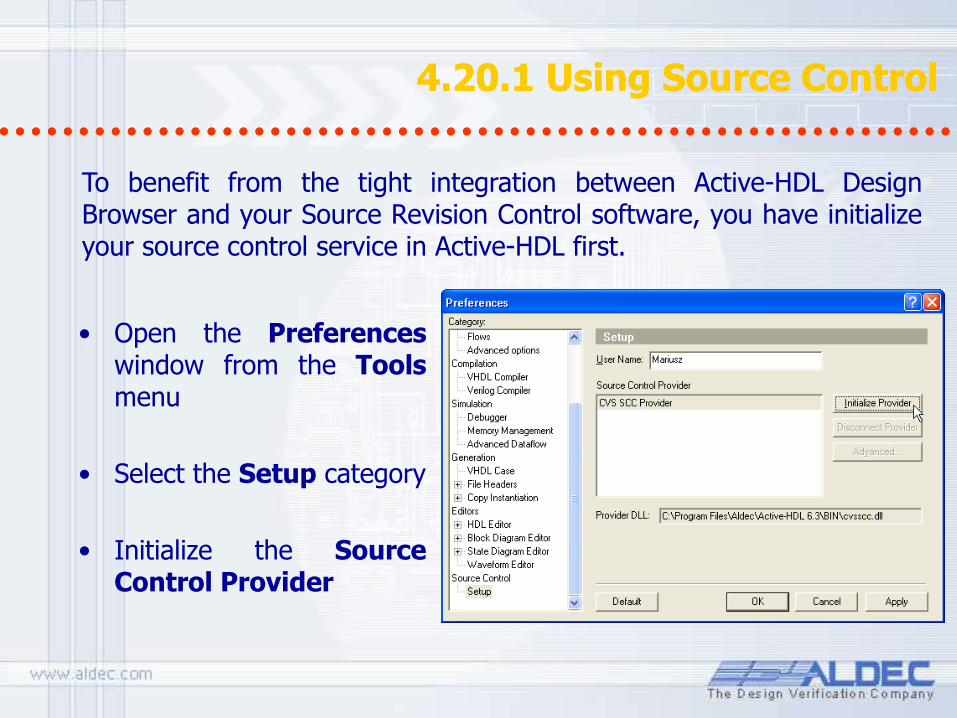
4.20.1 Using Source Control 4.20.1 Using Source Control
• Open the Preferences window from the Tools menu
• Select the Setup category
• Initialize the Source Control Provider
To benefit from the tight integration between Active-HDL Design Browser and your Source Revision Control software, you have initialize your source control service in Active-HDL first.
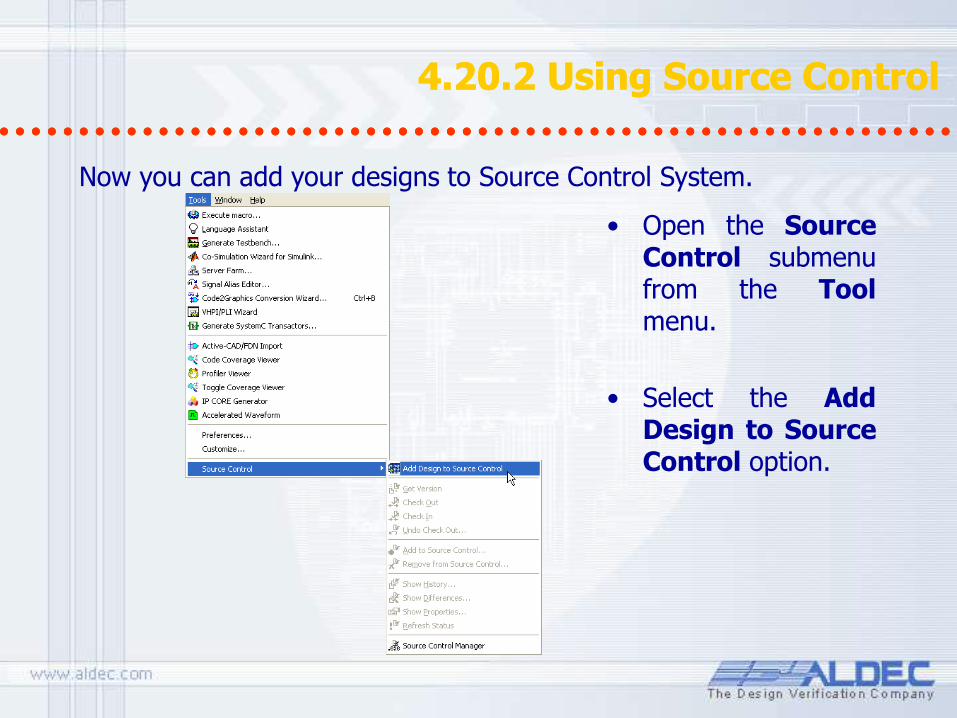
4.20.2 Using Source Control 4.20.2 Using Source Control
Now you can add your designs to Source Control System.
• Open the Source Control submenu from the Tool menu.
• Select the Add Design to Source Control option.

4.20.3 Using Source Control 4.20.3 Using Source Control
Now the Source Control submenu is available in the context menu of the Design Browser.
You can easily:
• Check-in or check-out a file
• Undo changes made after the last check-out
• Get the any version of file
• Show changes history
• Look for differences
Design Verification
Running Simulation
Part 5
5. Simulation 5. Simulation
Simulation steps:
• Compile the design
• Set the top-level architecture
• Open Waveform Editor
• Drag the signals
• Initialize simulation
• Apply stimulators
• Advance simulation
• Verify results
• Save simulation run
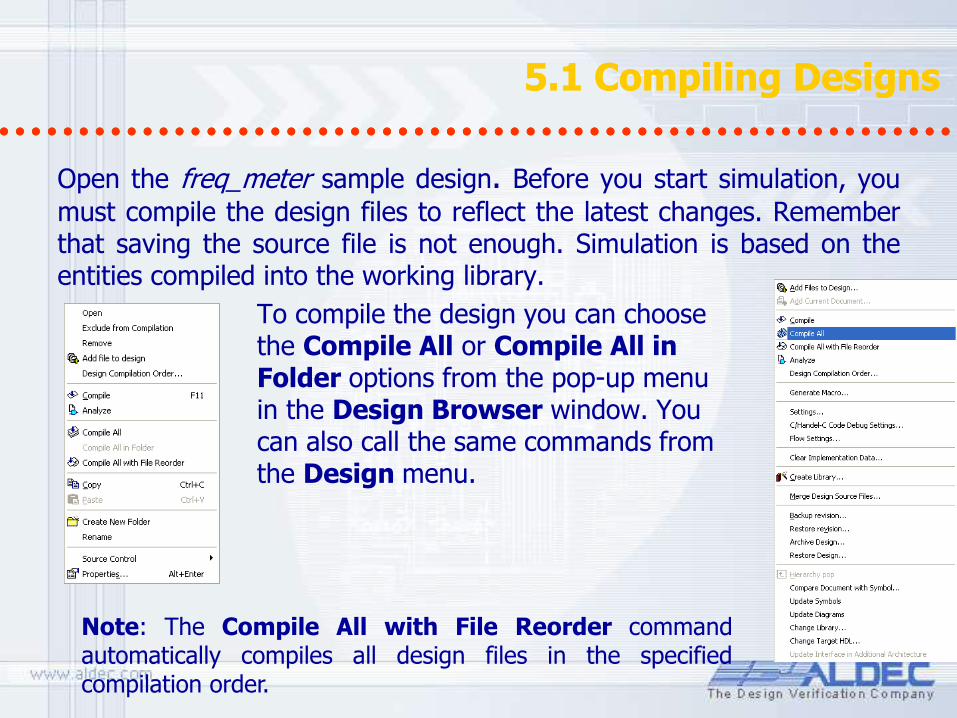
5.1 Compiling Designs 5.1 Compiling Designs
Open the freq_meter sample design. Before you start simulation, you
must compile the design files to reflect the latest changes. Remember that saving the source file is not enough. Simulation is based on the entities compiled into the working library.
To compile the design you can choose the Compile All or Compile All in Folder options from the pop-up menu in the Design Browser window. You can also call the same commands from the Design menu.
Note: The Compile All with File Reorder command automatically compiles all design files in the specified compilation order.
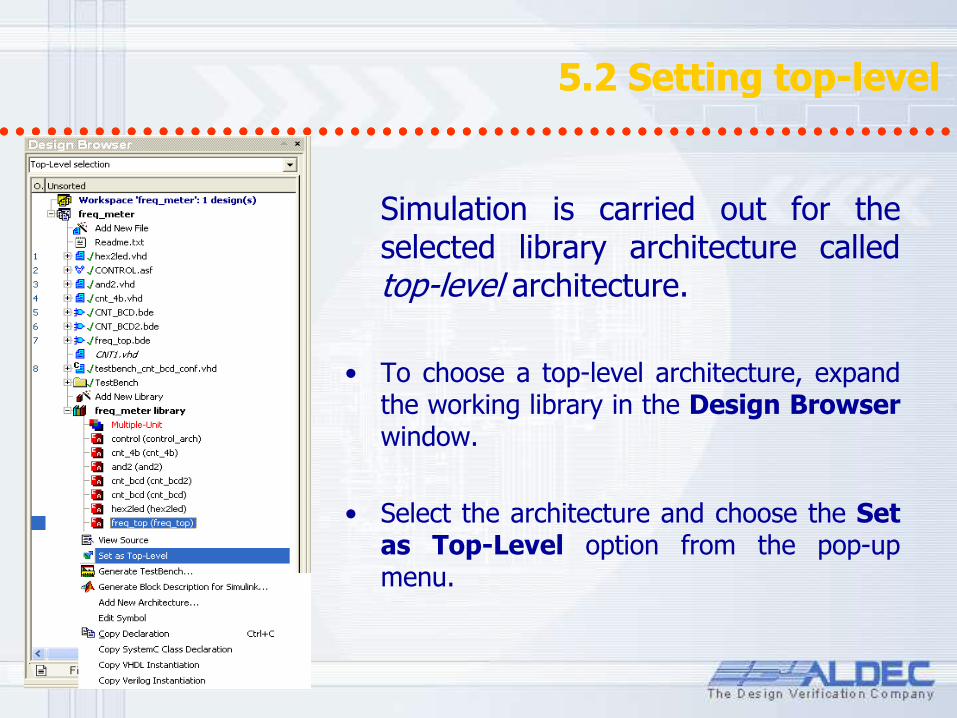
5.2 Setting top-level 5.2 Setting top-level
Simulation is carried out for the selected library architecture called top-level architecture.
• To choose a top-level architecture, expand the working library in the Design Browser window.
• Select the architecture and choose the Set as Top-Level option from the pop-up menu.
5.2 a Setting up the Standard Waveform Viewer 5.2 a Setting up the Standard Waveform Viewer
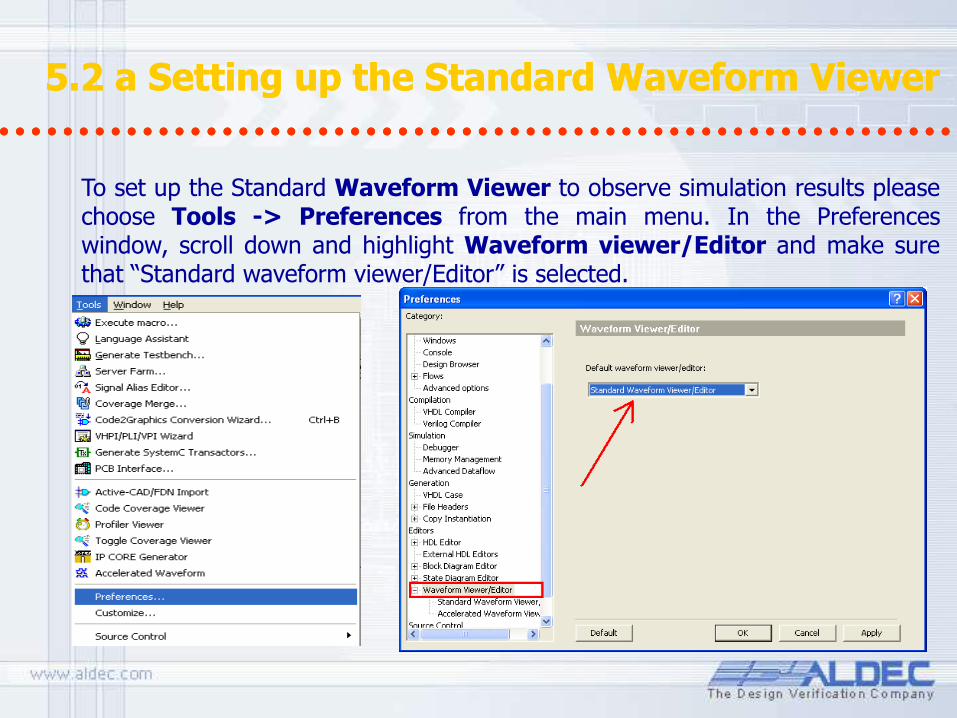
To set up the Standard Waveform Viewer to observe simulation results please choose Tools -> Preferences from the main menu. In the Preferences window, scroll down and highlight Waveform viewer/Editor and make sure that “Standard waveform viewer/Editor” is selected.
5.3 Opening Waveform Editor 5.3 Opening Waveform Editor
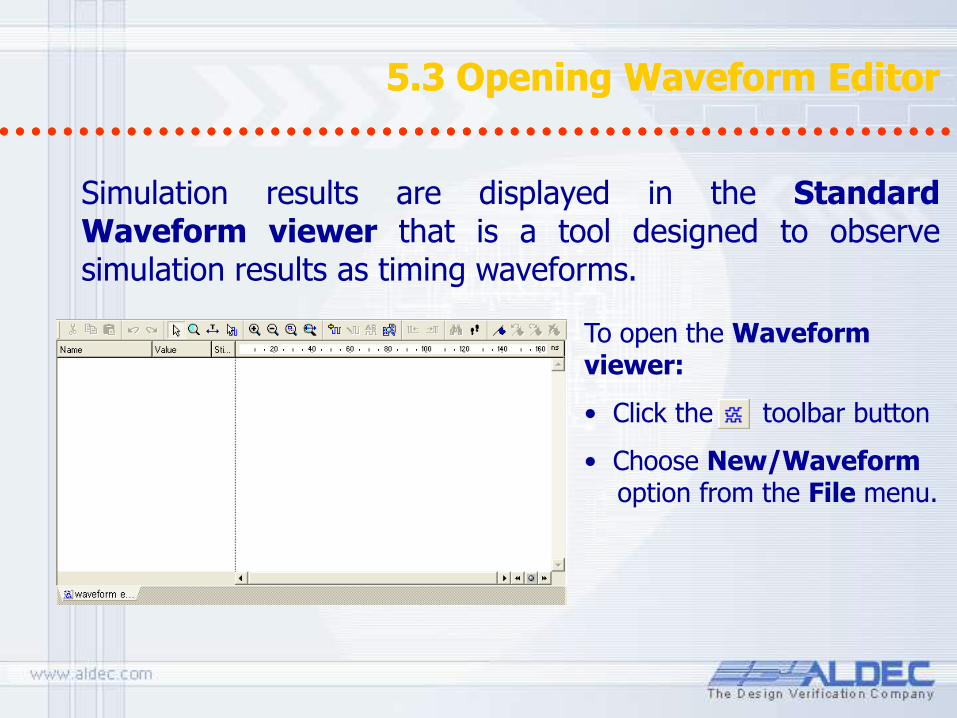
Simulation results are displayed in the Standard Waveform viewer that is a tool designed to observe simulation results as timing waveforms.
To open the Waveform viewer:
• Click the toolbar button
• Choose New/Waveform option from the File menu.

5.3 Ref.A Waveform Editor 5.3 Ref.A Waveform Editor
5.4 Adding Signals 5.4 Adding Signals
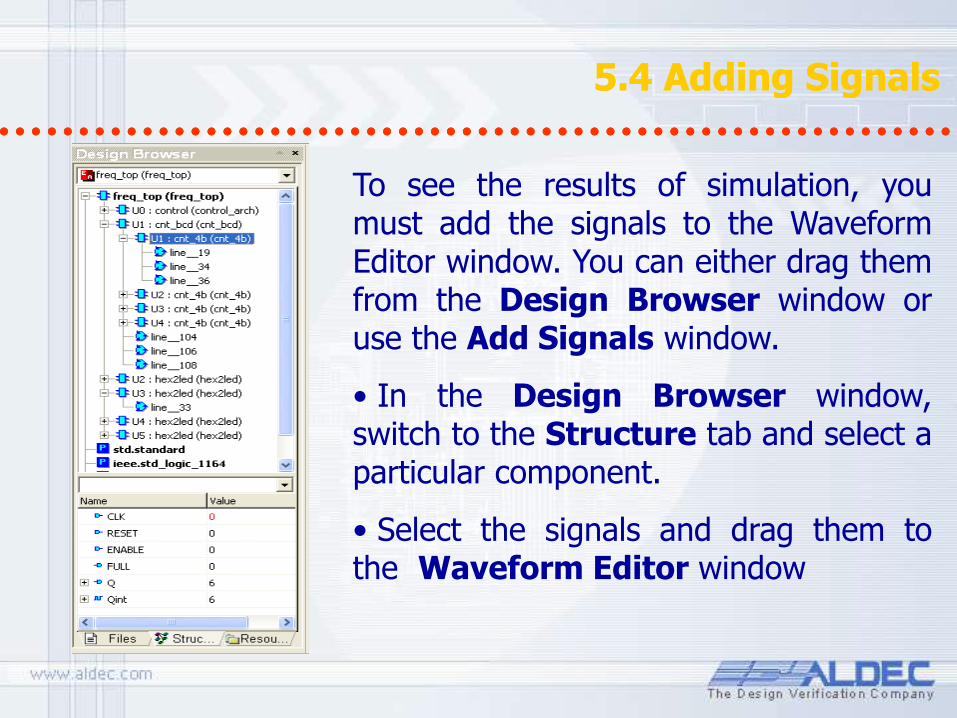
To see the results of simulation, you must add the signals to the Waveform Editor window. You can either drag them from the Design Browser window or use the Add Signals window.
• In the Design Browser window, switch to the Structure tab and select a particular component.
• Select the signals and drag them to the Waveform Editor window
5.5 Adding Signals 5.5 Adding Signals
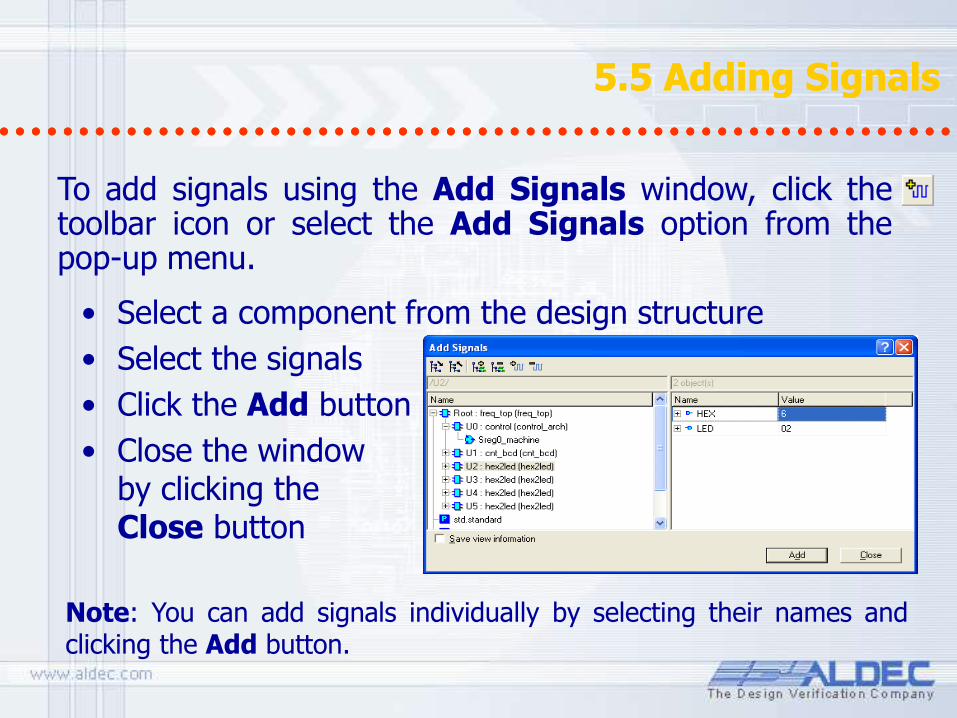
• Select a component from the design structure
• Select the signals
• Click the Add button
• Close the window by clicking the Close button
To add signals using the Add Signals window, click the toolbar icon or select the Add Signals option from the pop-up menu.
Note: You can add signals individually by selecting their names and clicking the Add button.
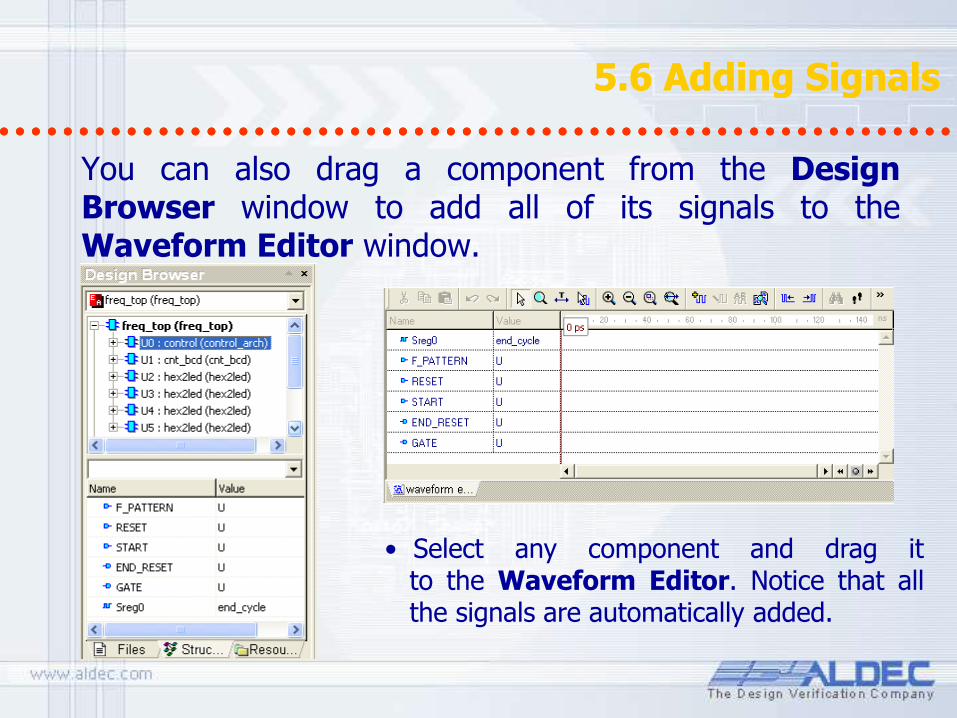
5.6 Adding Signals 5.6 Adding Signals
You can also drag a component from the Design Browser window to add all of its signals to the Waveform Editor window.
• Select any component and drag it to the Waveform Editor. Notice that all the signals are automatically added.
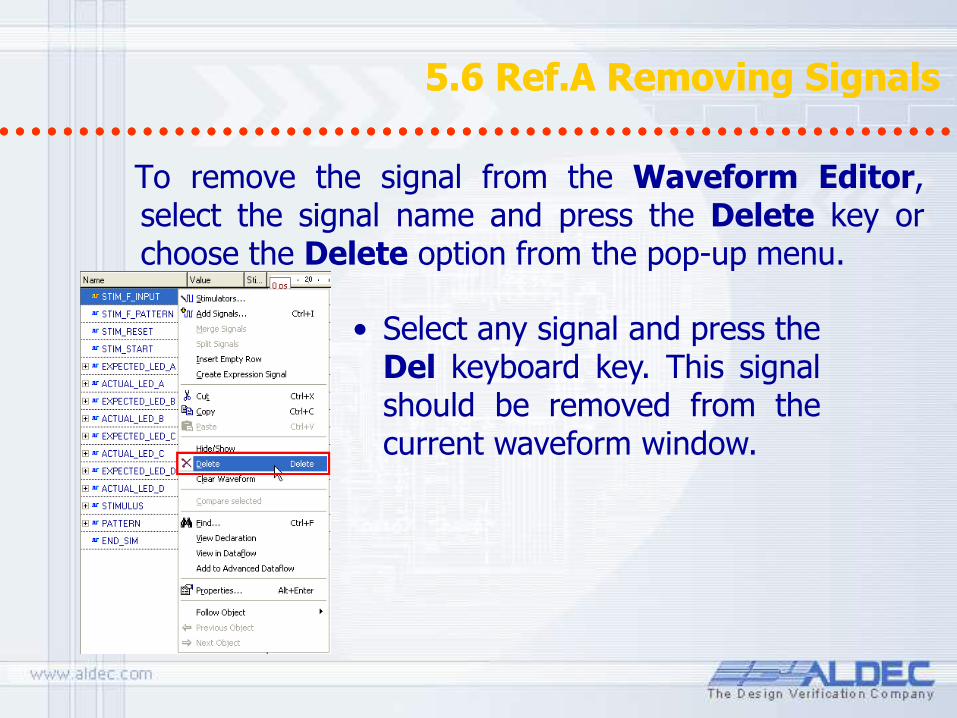
5.6 Ref.A Removing Signals 5.6 Ref.A Removing Signals
To remove the signal from the Waveform Editor, select the signal name and press the Delete key or choose the Delete option from the pop-up menu.
• Select any signal and press the Del keyboard key. This signal should be removed from the current waveform window.

5.7 Initializing Simulation 5.7 Initializing Simulation
The Initialize Simulation command in the Simulation menu launches elaboration and initialization of the simulation model.
During elaboration, the simulator loads design entities and builds the simulation model in the computer memory. During initialization, all objects in the model (signals, variables, etc.) acquire their initial values (either default or explicitly specified) and all concurrent processes are executed once until their suspension.
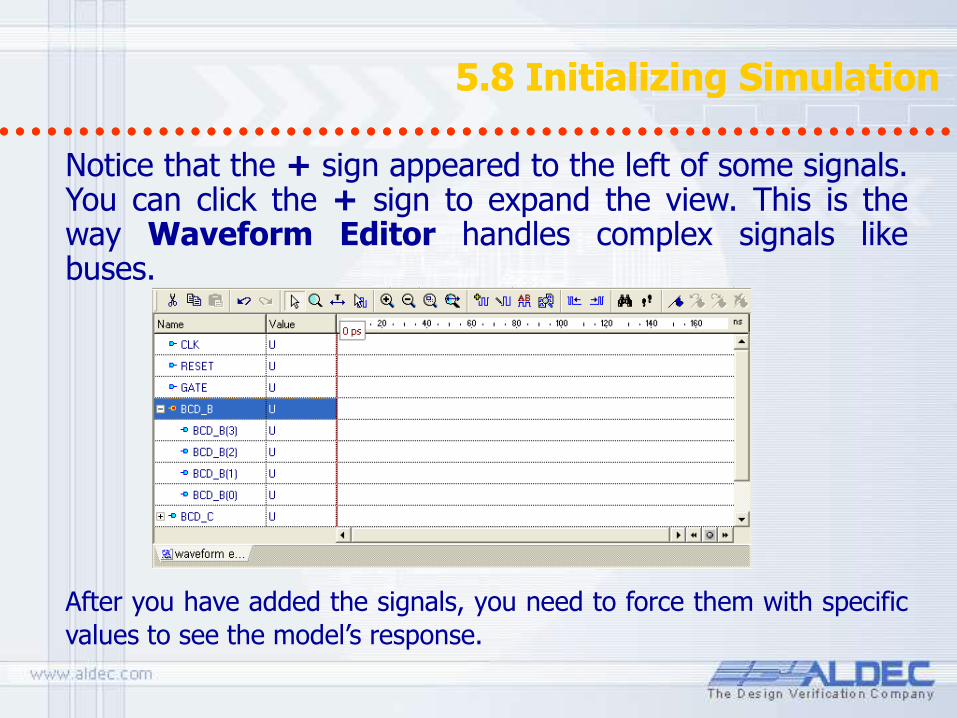
5.8 Initializing Simulation 5.8 Initializing Simulation
Notice that the + sign appeared to the left of some signals. You can click the + sign to expand the view. This is the way Waveform Editor handles complex signals like buses.
After you have added the signals, you need to force them with specific
values to see the model’s response.
5.9 Stimuli 5.9 Stimuli
Active-HDL supports the following methods of stimulating or forcing input signals during the simulation:
– Manually selected stimulators from the Active-HDL resources
– HDL Testbench files
– Simulation commands entered in the Console window
– Files containing simulation macro commands
– Test Vector files imported from Active-CAD
– Simulation input based on waveforms edited by the user
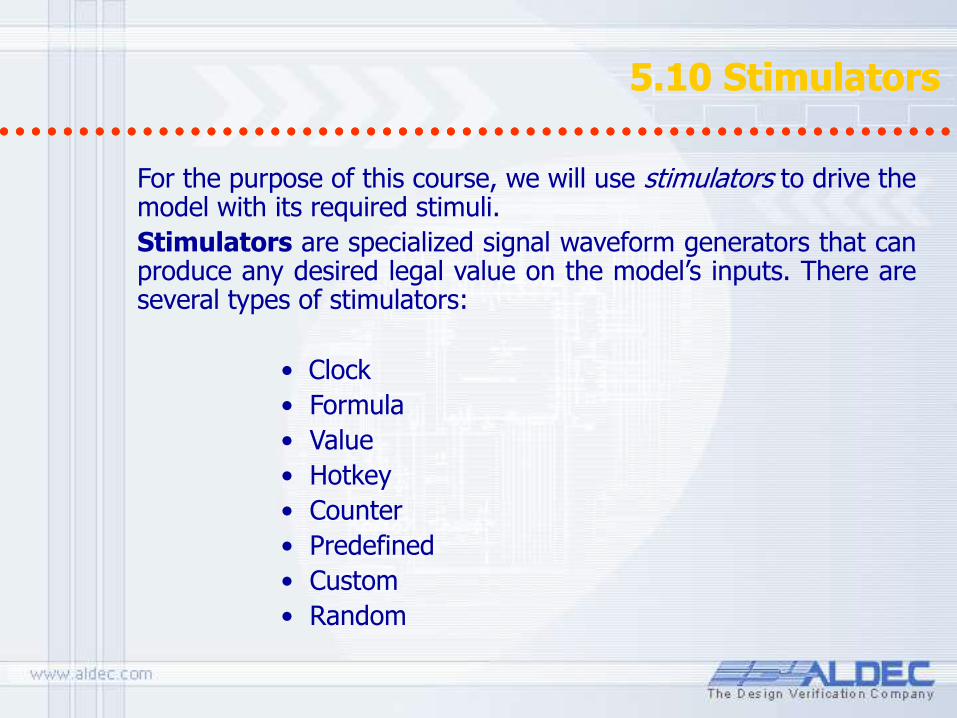
5.10 Stimulators 5.10 Stimulators
For the purpose of this course, we will use stimulators to drive the model with its required stimuli.
Stimulators are specialized signal waveform generators that can produce any desired legal value on the model’s inputs. There are several types of stimulators:
• Clock
• Formula
• Value
• Hotkey
• Counter
• Predefined
• Custom
• Random
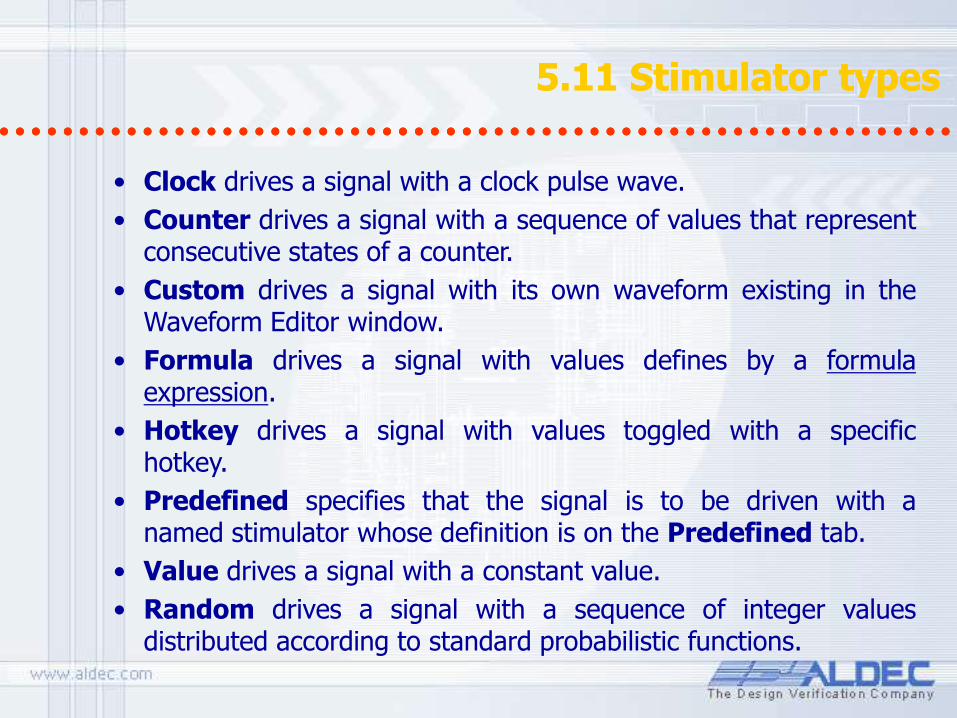
5.11 Stimulator types 5.11 Stimulator types
• Clock drives a signal with a clock pulse wave.
• Counter drives a signal with a sequence of values that represent consecutive states of a counter.
• Custom drives a signal with its own waveform existing in the Waveform Editor window.
• Formula drives a signal with values defines by a formula expression.
• Hotkey drives a signal with values toggled with a specific hotkey.
• Predefined specifies that the signal is to be driven with a named stimulator whose definition is on the Predefined tab.
• Value drives a signal with a constant value.
• Random drives a signal with a sequence of integer values distributed according to standard probabilistic functions.
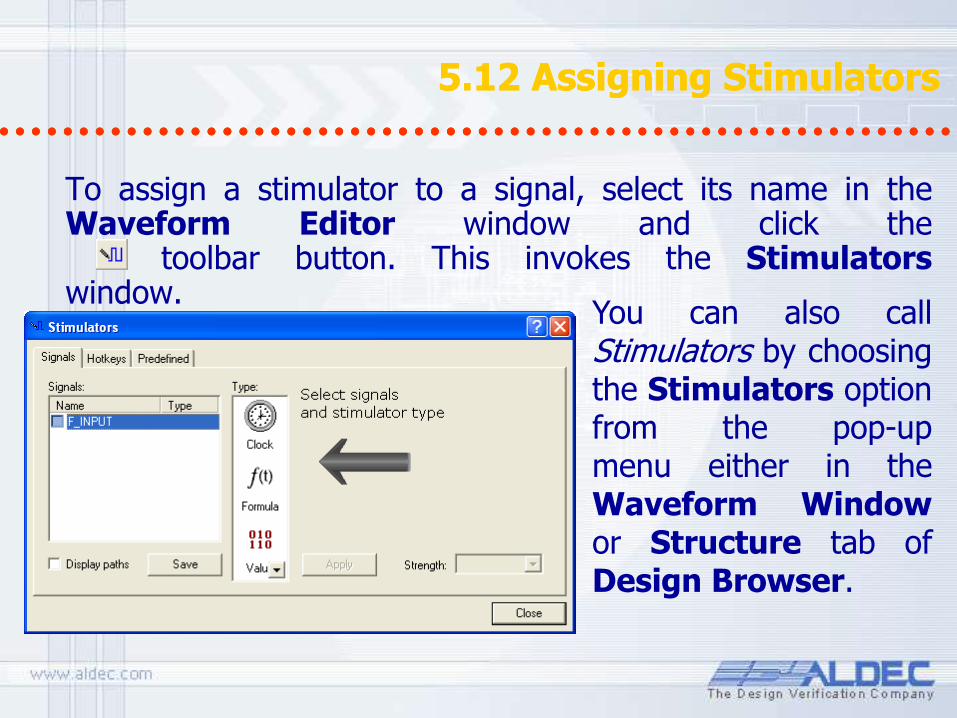
5.12 Assigning Stimulators 5.12 Assigning Stimulators
To assign a stimulator to a signal, select its name in the Waveform Editor window and click the toolbar button. This invokes the Stimulators window.
You can also call Stimulators by choosing the Stimulators option from the pop-up menu either in the Waveform Window or Structure tab of Design Browser.

5.13 Assigning Stimulators 5.13 Assigning Stimulators
Choose the Clock type stimulator, set Frequency as 60Mhz and click the Apply button.To assign the next stimulator, you do not need to close the Stimulators window. Move it aside and select the F_PATTERN signal in the Waveform Editor. Notice the F_PATTERN signal appear in the Stimulators window. Choose the Clock type stimulator, set Frequency as 10Mhz and click the Apply button for F_PATTERN
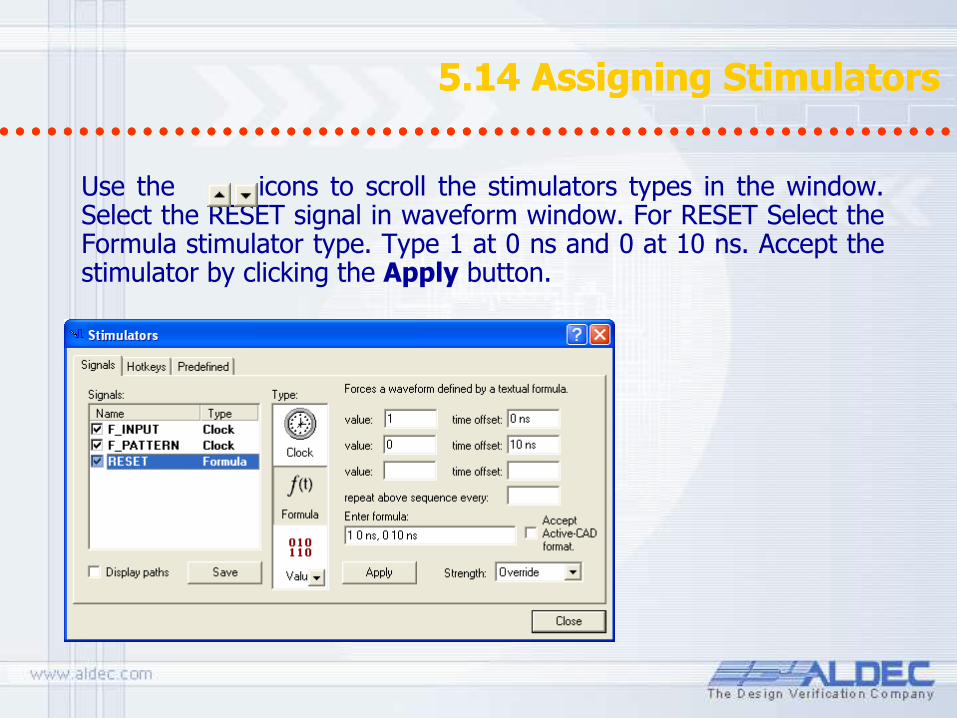
5.14 Assigning Stimulators 5.14 Assigning Stimulators
Use the icons to scroll the stimulators types in the window. Select the RESET signal in waveform window. For RESET Select the Formula stimulator type. Type 1 at 0 ns and 0 at 10 ns. Accept the stimulator by clicking the Apply button.
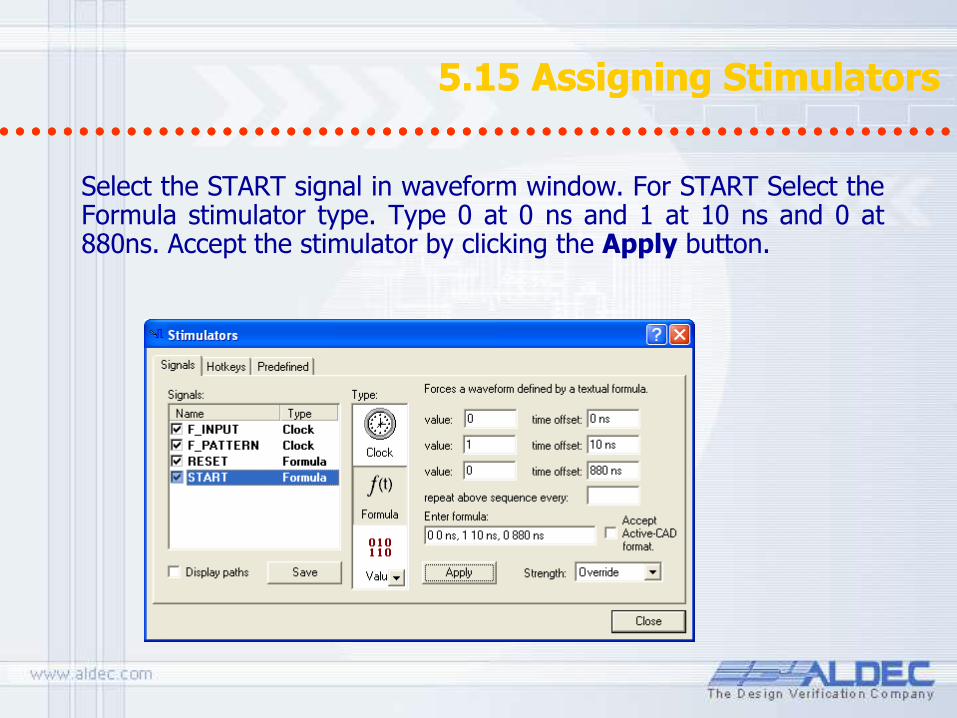
5.15 Assigning Stimulators 5.15 Assigning Stimulators
Select the START signal in waveform window. For START Select the Formula stimulator type. Type 0 at 0 ns and 1 at 10 ns and 0 at 880ns. Accept the stimulator by clicking the Apply button.
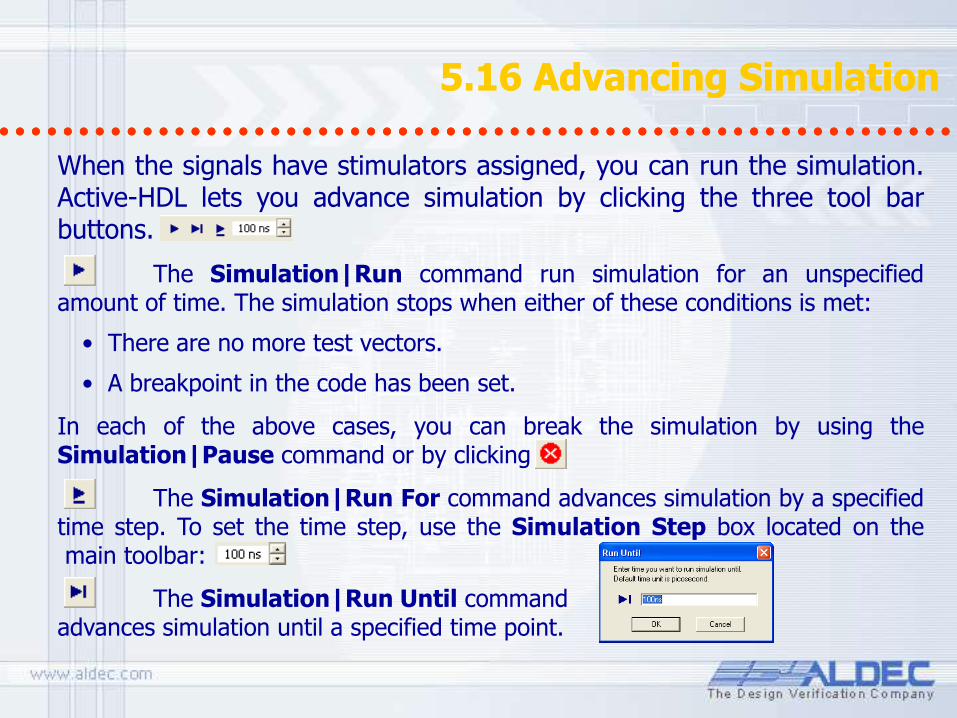
5.16 Advancing Simulation 5.16 Advancing Simulation
When the signals have stimulators assigned, you can run the simulation. Active-HDL lets you advance simulation by clicking the three tool bar buttons.
The Simulation|Run command run simulation for an unspecified amount of time. The simulation stops when either of these conditions is met:
• There are no more test vectors.
• A breakpoint in the code has been set.
In each of the above cases, you can break the simulation by using the Simulation|Pause command or by clicking
The Simulation|Run For command advances simulation by a specified time step. To set the time step, use the Simulation Step box located on the main toolbar:
The Simulation|Run Until command advances simulation until a specified time point.
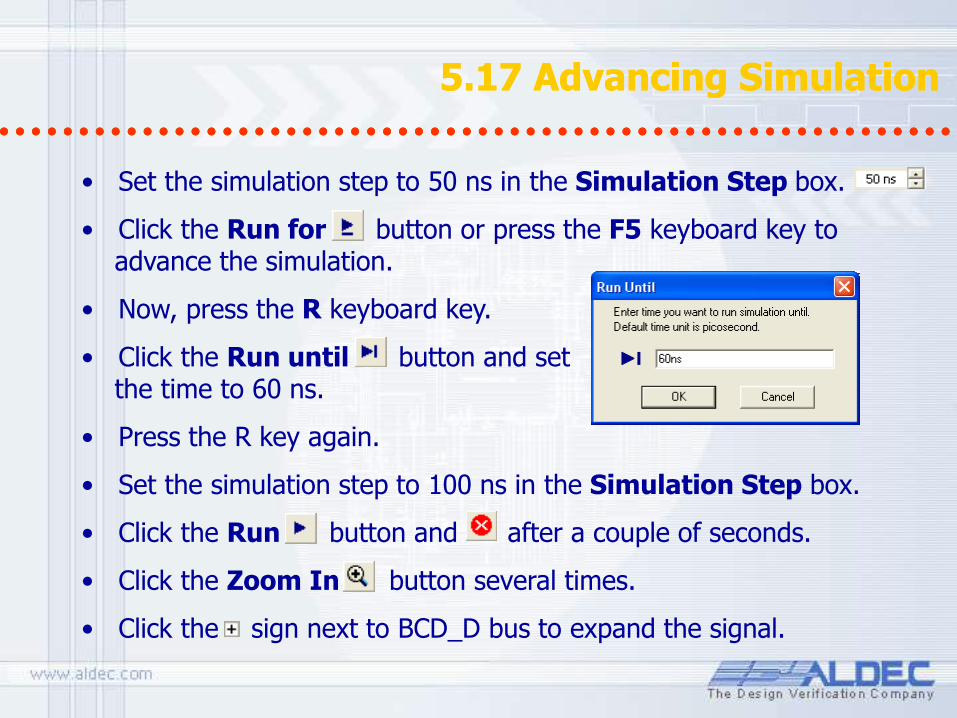
5.17 Advancing Simulation 5.17 Advancing Simulation
• Set the simulation step to 50 ns in the Simulation Step box.
• Click the Run for button or press the F5 keyboard key to advance the simulation.
• Now, press the R keyboard key.
• Click the Run until button and set the time to 60 ns.
• Press the R key again.
• Set the simulation step to 100 ns in the Simulation Step box.
• Click the Run button and after a couple of seconds.
• Click the Zoom In button several times.
• Click the sign next to BCD_D bus to expand the signal.
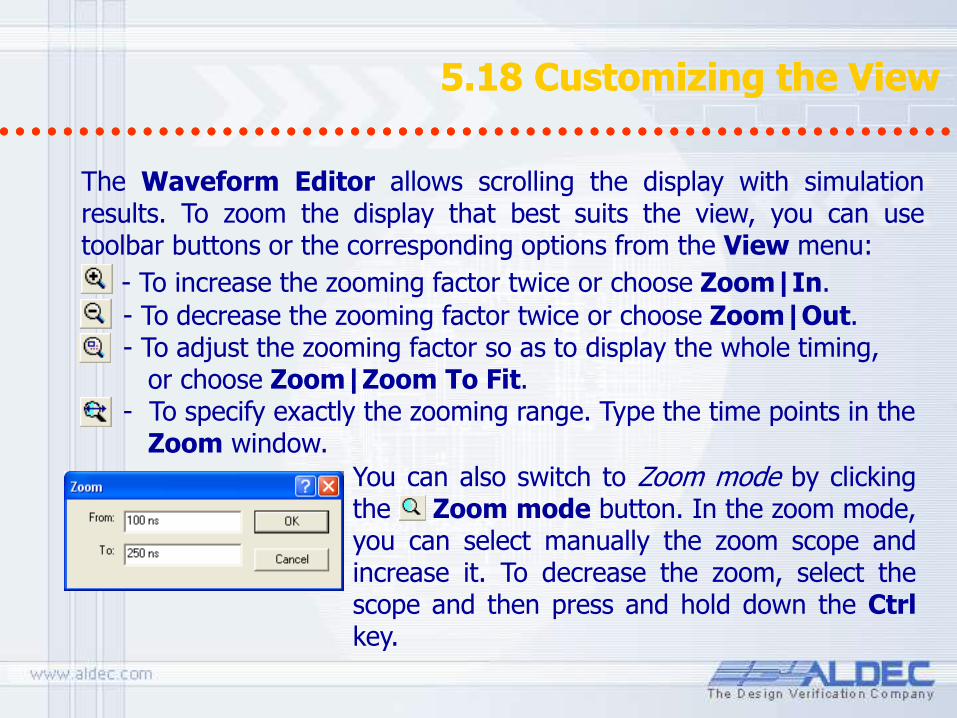
5.18 Customizing the View 5.18 Customizing the View
The Waveform Editor allows scrolling the display with simulation results. To zoom the display that best suits the view, you can use toolbar buttons or the corresponding options from the View menu:
- To increase the zooming factor twice or choose Zoom|In.
- To decrease the zooming factor twice or choose Zoom|Out. - To adjust the zooming factor so as to display the whole timing, or choose Zoom|Zoom To Fit. - To specify exactly the zooming range. Type the time points in the Zoom window.
You can also switch to Zoom mode by clicking the Zoom mode button. In the zoom mode, you can select manually the zoom scope and increase it. To decrease the zoom, select the scope and then press and hold down the Ctrl key.
5.19 Customizing the View 5.19 Customizing the View
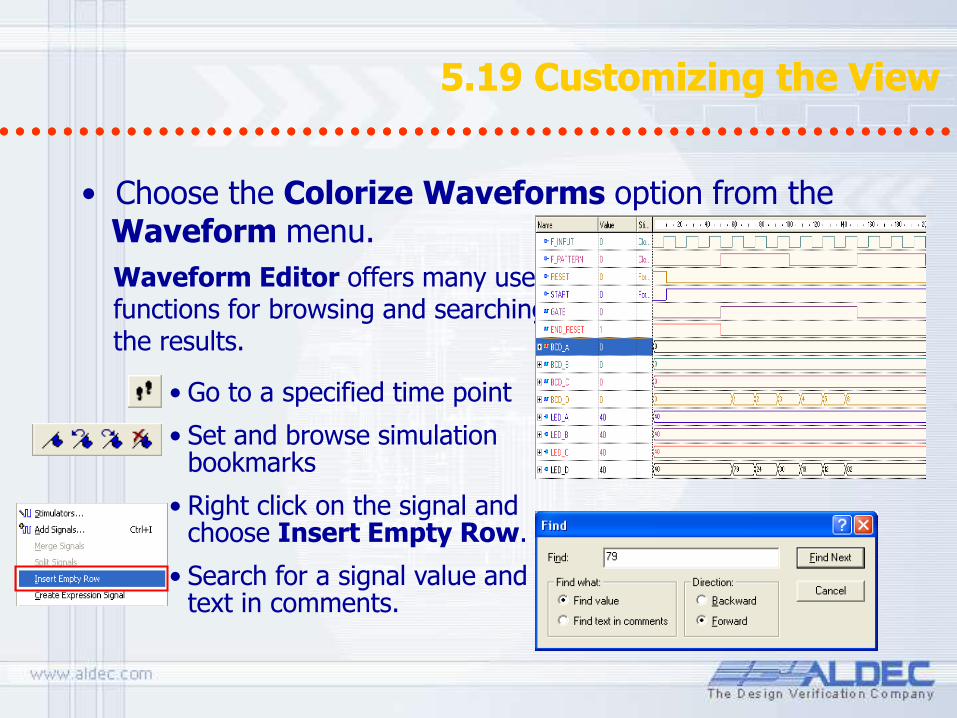
• Choose the Colorize Waveforms option from the Waveform menu.
Waveform Editor offers many useful functions for browsing and searching the results.
• Go to a specified time point
• Set and browse simulation bookmarks
• Right click on the signal and choose Insert Empty Row.
• Search for a signal value and text in comments.
5.20 Customizing the View 5.20 Customizing the View
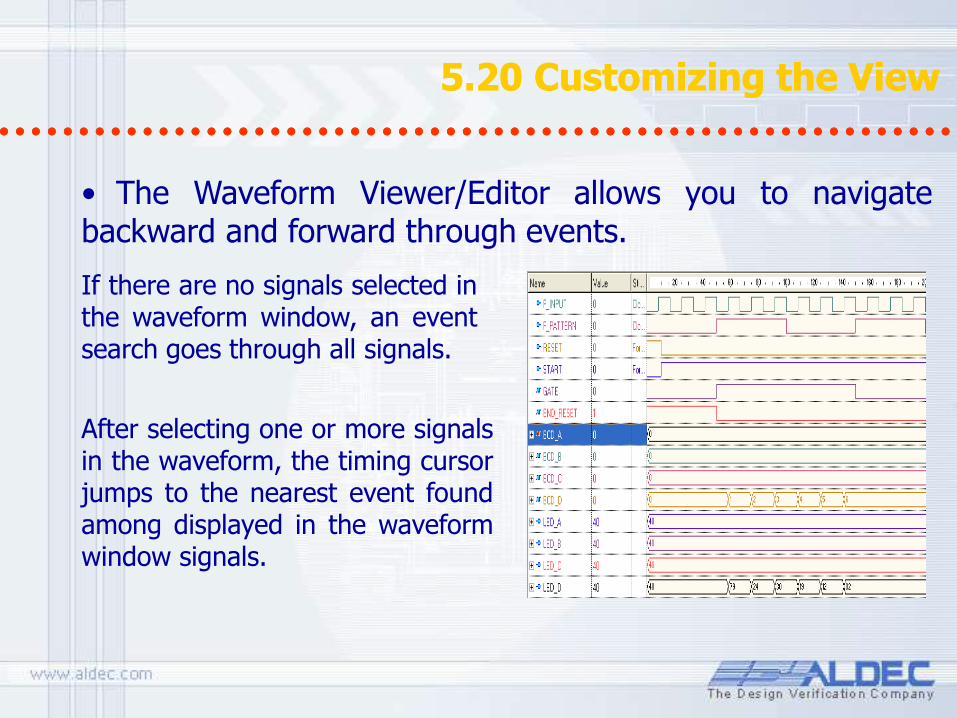
• The Waveform Viewer/Editor allows you to navigate backward and forward through events.
After selecting one or more signals in the waveform, the timing cursor jumps to the nearest event found among displayed in the waveform window signals.
If there are no signals selected in the waveform window, an event search goes through all signals.
5.21 Customizing the View 5.21 Customizing the View
To jump to the next/previous event:
• Switch to the Select mode. Press the Esc keyboard key or or click the Select Mode button
• Click the waveform in place where you want to start tracking events. By default, tracking starts at the the beginning of the waveform (0ps).
• Click the Previous event button or the Next event button to find the nearest event before or after the current cursor position, respectively.
5.22 Customizing the View 5.22 Customizing the View
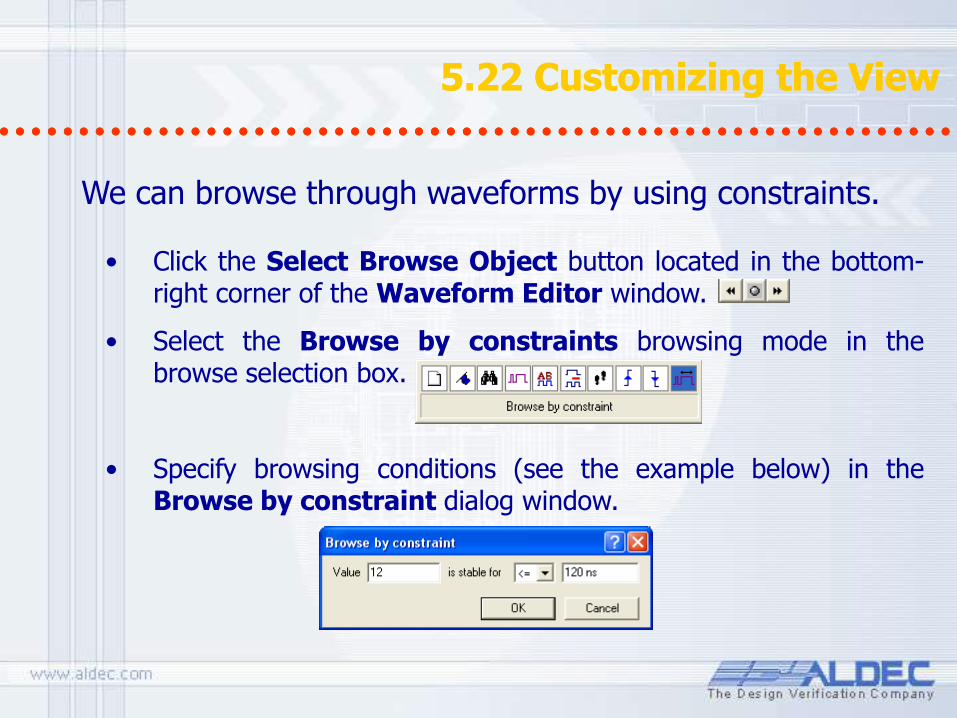
We can browse through waveforms by using constraints.
• Click the Select Browse Object button located in the bottom-right corner of the Waveform Editor window.
• Select the Browse by constraints browsing mode in the browse selection box.
• Specify browsing conditions (see the example below) in the Browse by constraint dialog window.
5.23 Customizing the View 5.23 Customizing the View
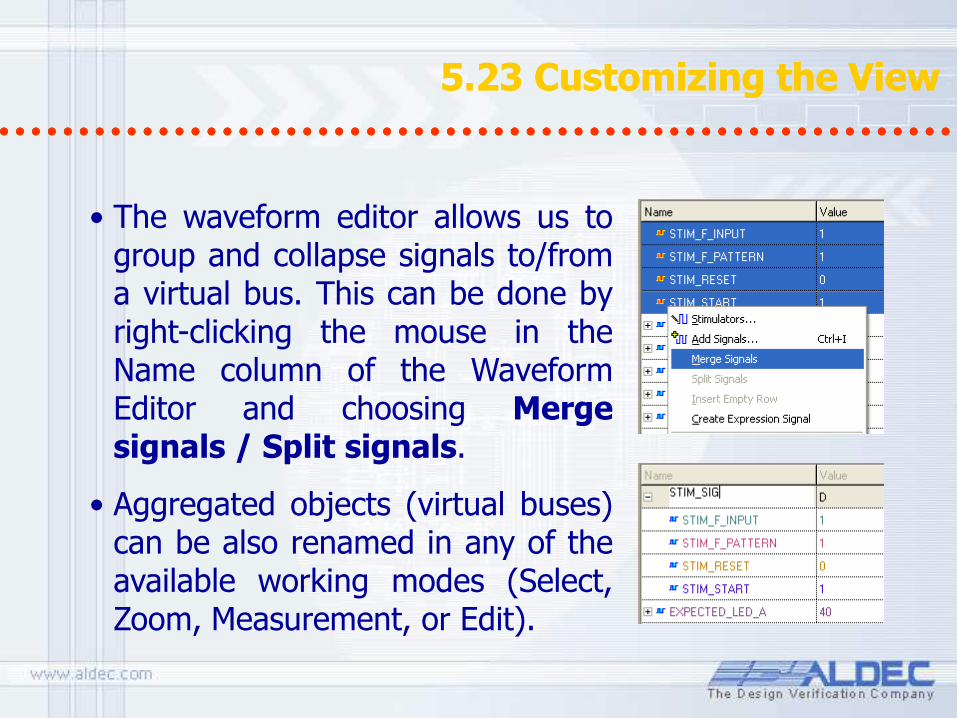
• The waveform editor allows us to group and collapse signals to/from a virtual bus. This can be done by right-clicking the mouse in the Name column of the Waveform Editor and choosing Merge signals / Split signals.
• Aggregated objects (virtual buses) can be also renamed in any of the available working modes (Select, Zoom, Measurement, or Edit).

5.24 Expression signals 5.24 Expression signals
To create an expression, right click on the waveform window after choosing a signal or signals. Select Create Expression Signal.
The Waveform Editor allows you to create logical expressions by using design signals.
In the dialog box that pops up, write the expression that is a function of the selected signals.
The value of this expression is evaluated and added to the waveform window.
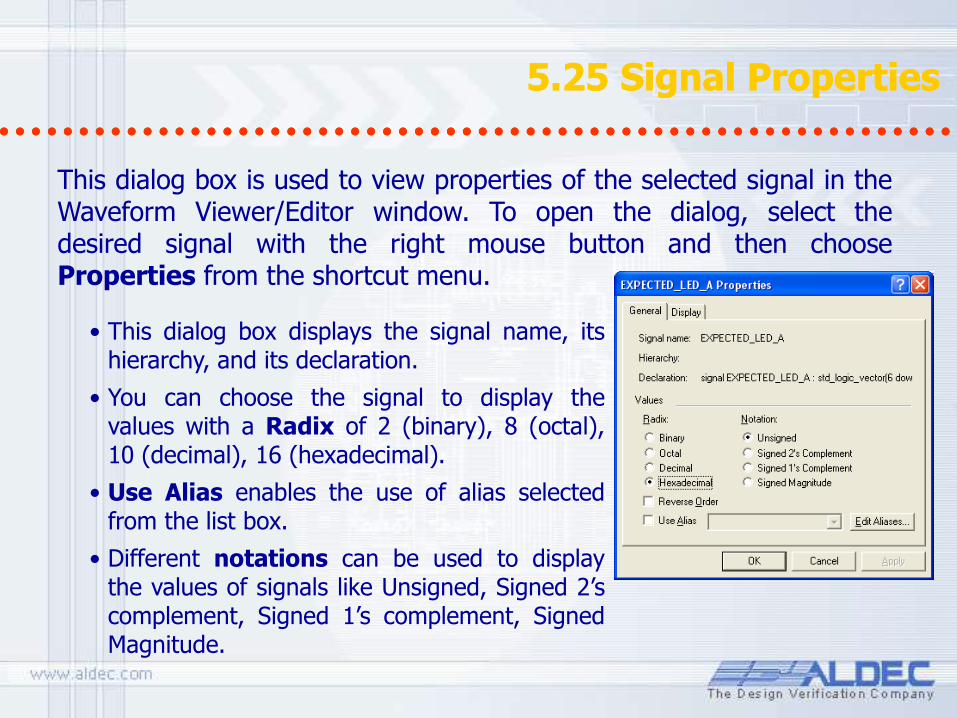
5.25 Signal Properties 5.25 Signal Properties
This dialog box is used to view properties of the selected signal in the Waveform Viewer/Editor window. To open the dialog, select the desired signal with the right mouse button and then choose Properties from the shortcut menu.
• This dialog box displays the signal name, its hierarchy, and its declaration.
• You can choose the signal to display the values with a Radix of 2 (binary), 8 (octal), 10 (decimal), 16 (hexadecimal).
• Use Alias enables the use of alias selected from the list box.
• Different notations can be used to display the values of signals like Unsigned, Signed 2’s complement, Signed 1’s complement, Signed Magnitude.
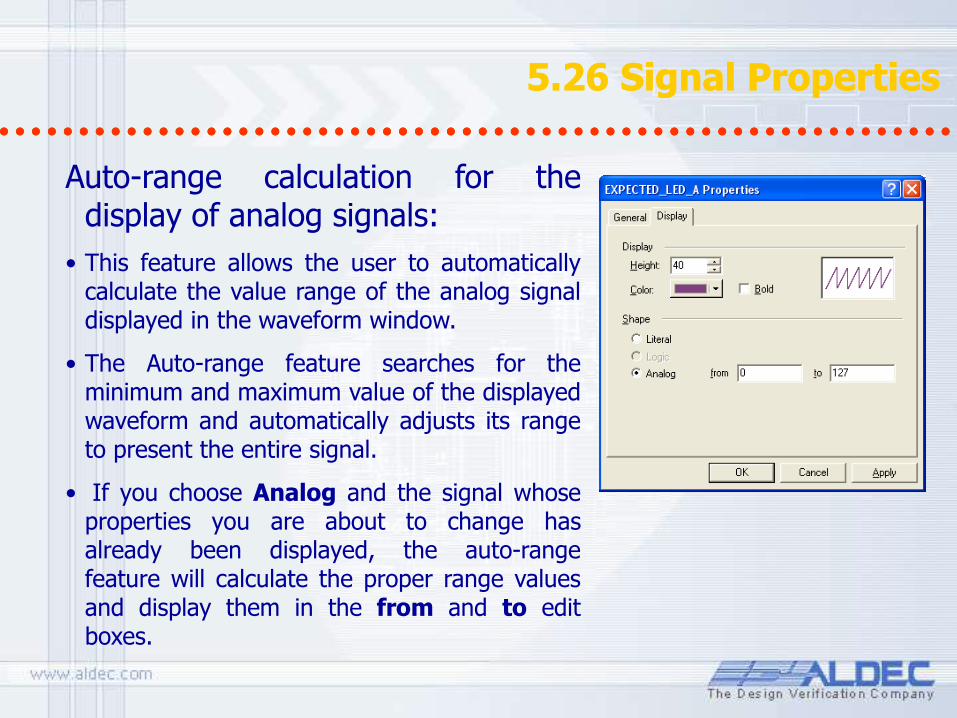
5.26 Signal Properties 5.26 Signal Properties
Auto-range calculation for the display of analog signals:
• This feature allows the user to automatically calculate the value range of the analog signal displayed in the waveform window.
• The Auto-range feature searches for the minimum and maximum value of the displayed waveform and automatically adjusts its range to present the entire signal.
• If you choose Analog and the signal whose properties you are about to change has already been displayed, the auto-range feature will calculate the proper range values and display them in the from and to edit boxes.
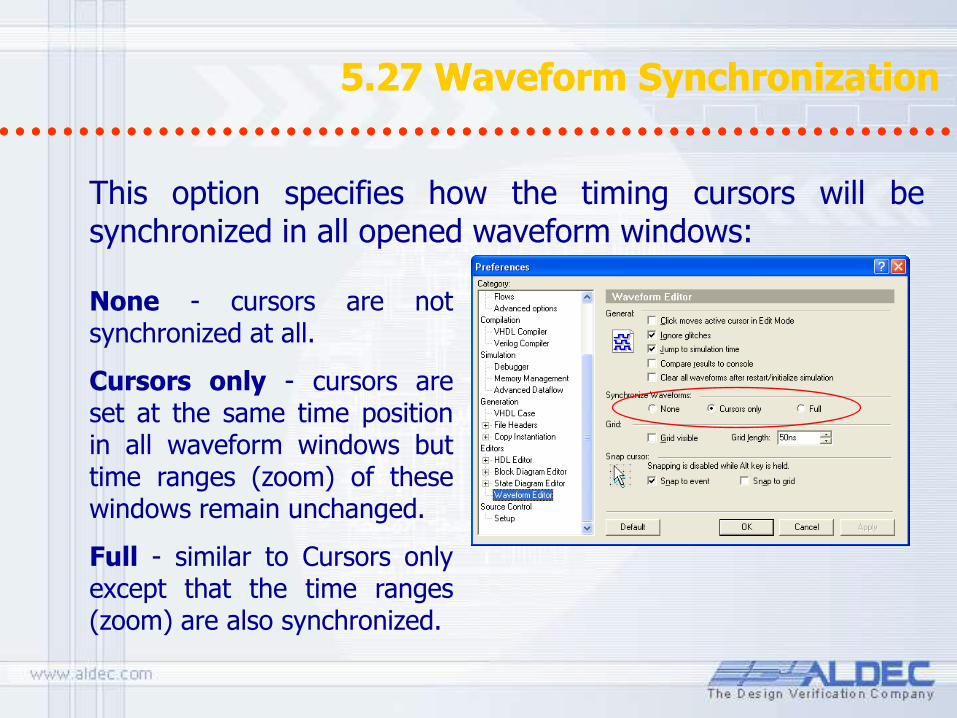
5.27 Waveform Synchronization 5.27 Waveform Synchronization
This option specifies how the timing cursors will be synchronized in all opened waveform windows:
None - cursors are not synchronized at all.
Cursors only - cursors are set at the same time position in all waveform windows but time ranges (zoom) of these windows remain unchanged.
Full - similar to Cursors only except that the time ranges (zoom) are also synchronized.
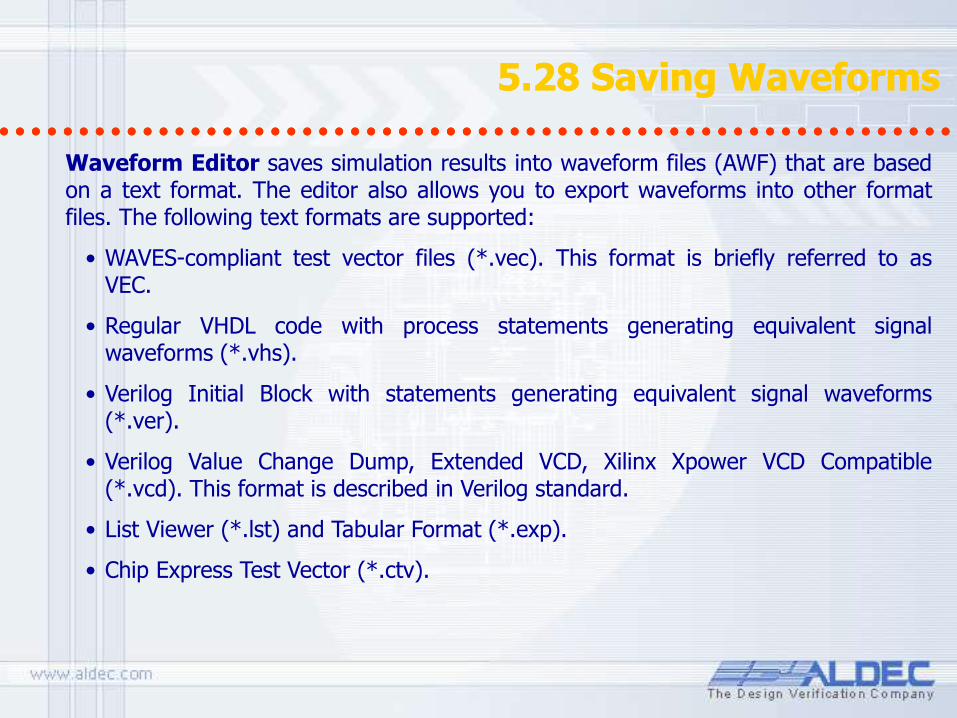
5.28 Saving Waveforms 5.28 Saving Waveforms
Waveform Editor saves simulation results into waveform files (AWF) that are based on a text format. The editor also allows you to export waveforms into other format files. The following text formats are supported:
• WAVES-compliant test vector files (*.vec). This format is briefly referred to as VEC.
• Regular VHDL code with process statements generating equivalent signal waveforms (*.vhs).
• Verilog Initial Block with statements generating equivalent signal waveforms (*.ver).
• Verilog Value Change Dump, Extended VCD, Xilinx Xpower VCD Compatible (*.vcd). This format is described in Verilog standard.
• List Viewer (*.lst) and Tabular Format (*.exp).
• Chip Express Test Vector (*.ctv).
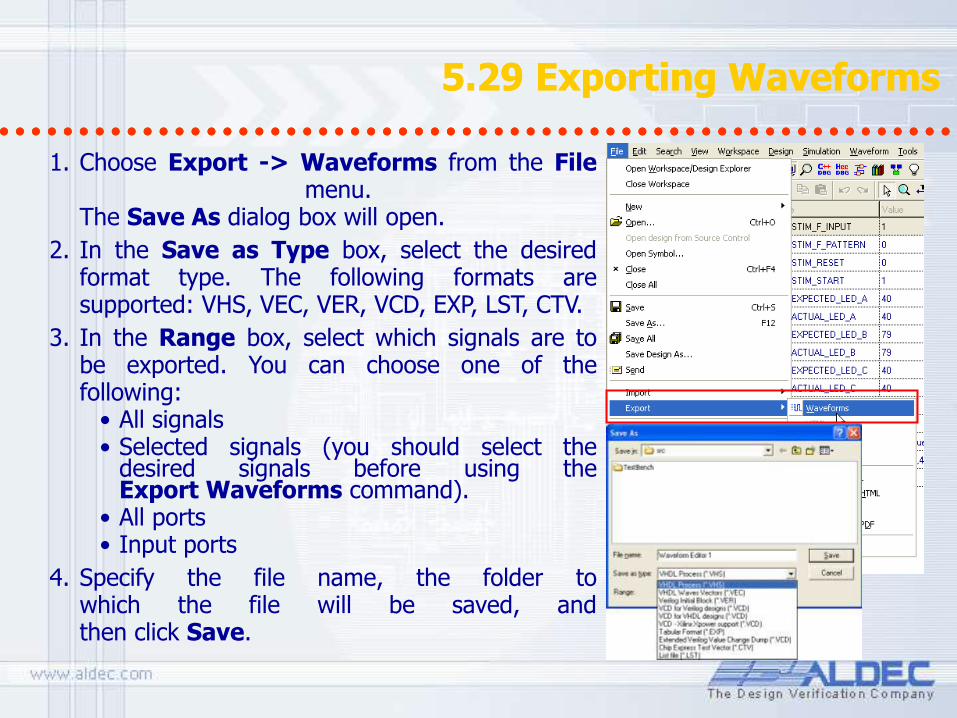
5.29 Exporting Waveforms 5.29 Exporting Waveforms
1. Choose Export -> Waveforms from the File menu.
The Save As dialog box will open.
2. In the Save as Type box, select the desired format type. The following formats are supported: VHS, VEC, VER, VCD, EXP, LST, CTV.
3. In the Range box, select which signals are to be exported. You can choose one of the following:
• All signals • Selected signals (you should select the
desired signals before using the Export Waveforms command).
• All ports • Input ports
4. Specify the file name, the folder to which the file will be saved, and then click Save.
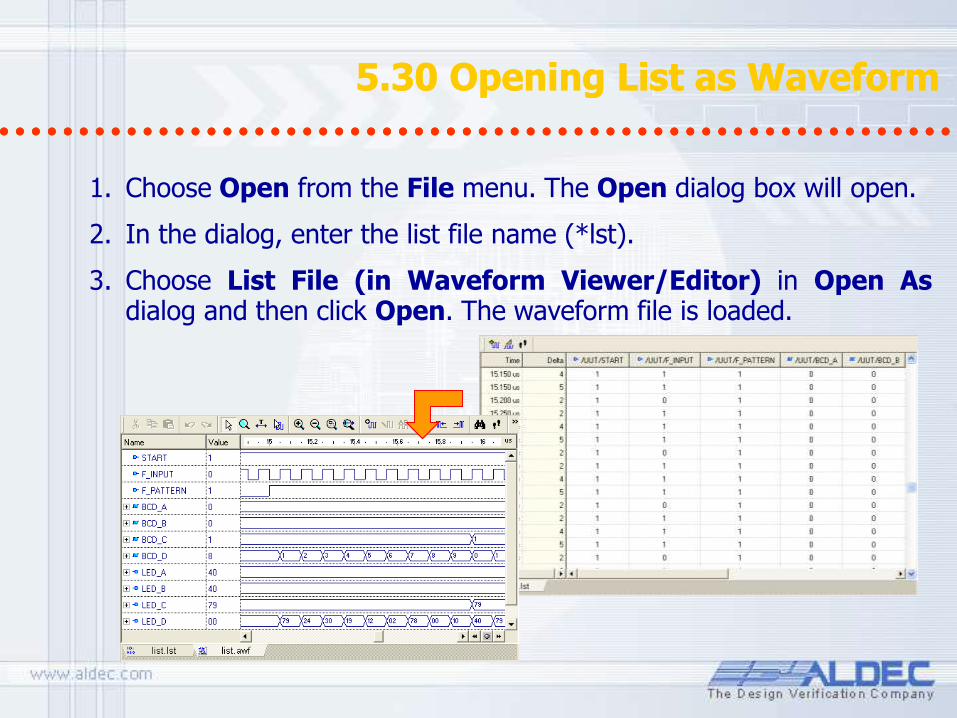
5.30 Opening List as Waveform 5.30 Opening List as Waveform
1. Choose Open from the File menu. The Open dialog box will open.
2. In the dialog, enter the list file name (*lst).
3. Choose List File (in Waveform Viewer/Editor) in Open As dialog and then click Open. The waveform file is loaded.
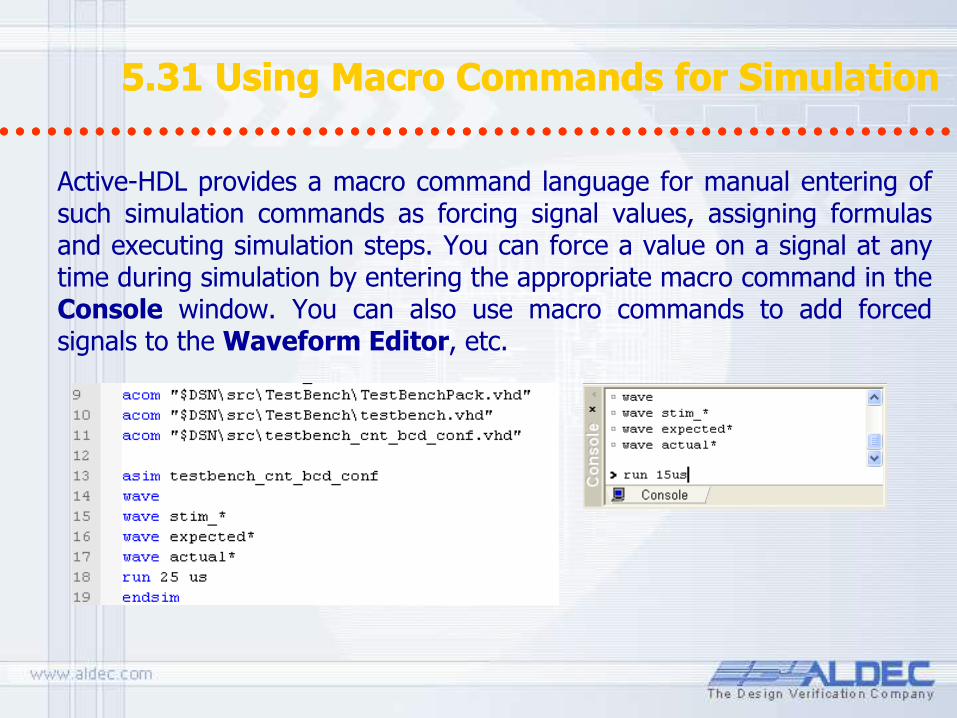
5.31 Using Macro Commands for Simulation 5.31 Using Macro Commands for Simulation
Active-HDL provides a macro command language for manual entering of such simulation commands as forcing signal values, assigning formulas and executing simulation steps. You can force a value on a signal at any time during simulation by entering the appropriate macro command in the Console window. You can also use macro commands to add forced signals to the Waveform Editor, etc.
5.32 VITAL and SDF 5.32 VITAL and SDF
Active-HDL simulator can perform timing simulation based on HDL structural netlists, EDIF netlists, and SDF files. These files are created during the synthesis and implementation processes. The simulator provides built-in acceleration for VITAL packages.
HDL and EDIF netlists contain structural connections between components. SDF (Standard Delay Format) files contain specific timing constraints of a programmable device.
To simulate such netlists in Active-HDL, you need to add these files to the current design. You can do it by using the Add New File wizard. For details, refer to the previous courses.
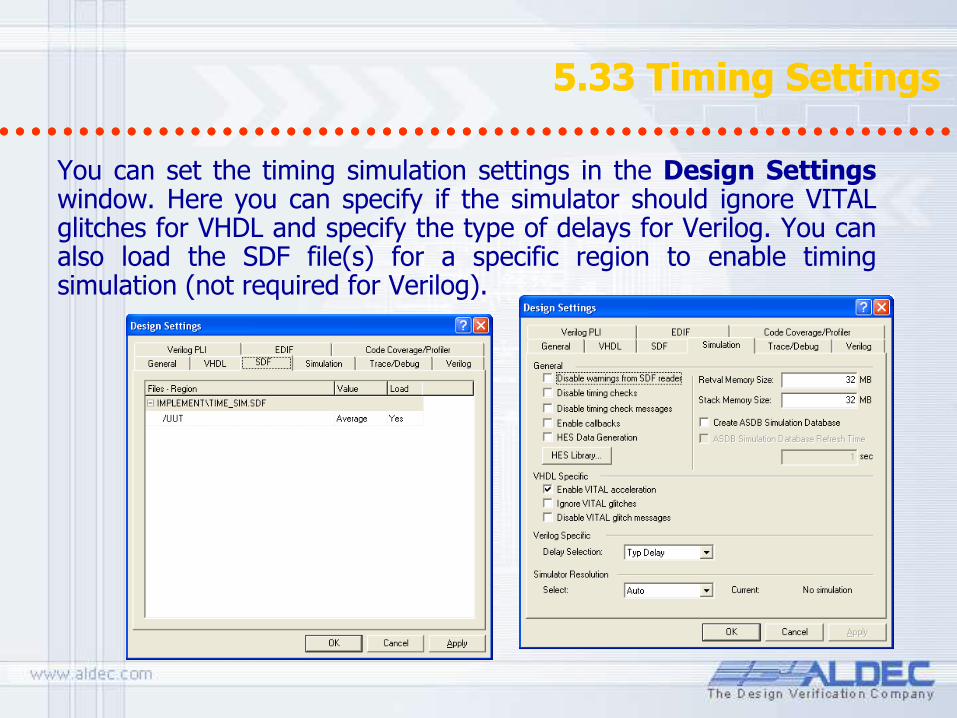
5.33 Timing Settings 5.33 Timing Settings
You can set the timing simulation settings in the Design Settings window. Here you can specify if the simulator should ignore VITAL glitches for VHDL and specify the type of delays for Verilog. You can also load the SDF file(s) for a specific region to enable timing simulation (not required for Verilog).
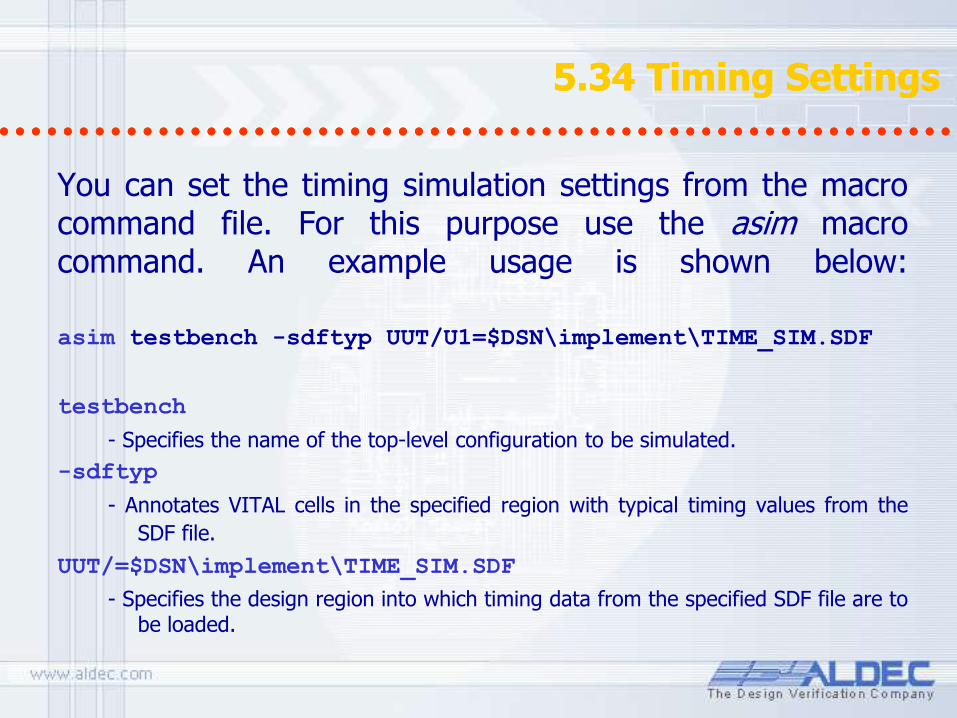
5.34 Timing Settings 5.34 Timing Settings
You can set the timing simulation settings from the macro command file. For this purpose use the asim macro command. An example usage is shown below: asim testbench -sdftyp UUT/U1=$DSN\implement\TIME_SIM.SDF
testbench
- Specifies the name of the top-level configuration to be simulated.
-sdftyp
- Annotates VITAL cells in the specified region with typical timing values from the
SDF file.
UUT/=$DSN\implement\TIME_SIM.SDF
- Specifies the design region into which timing data from the specified SDF file are to be loaded.

5.35 Running Timing Simulation 5.35 Running Timing Simulation
• Open the VITAL_Glitch_example design.
• Execute the run_stimulators.do file.
• Observe the simulation results in the waveform.
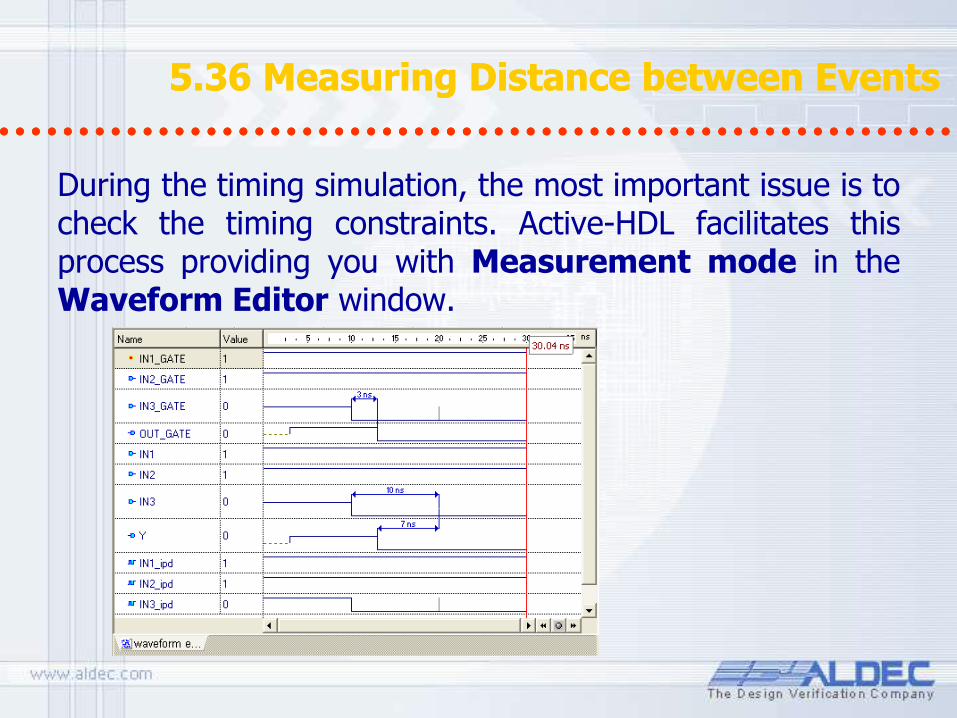
5.36 Measuring Distance between Events 5.36 Measuring Distance between Events
During the timing simulation, the most important issue is to check the timing constraints. Active-HDL facilitates this process providing you with Measurement mode in the Waveform Editor window.
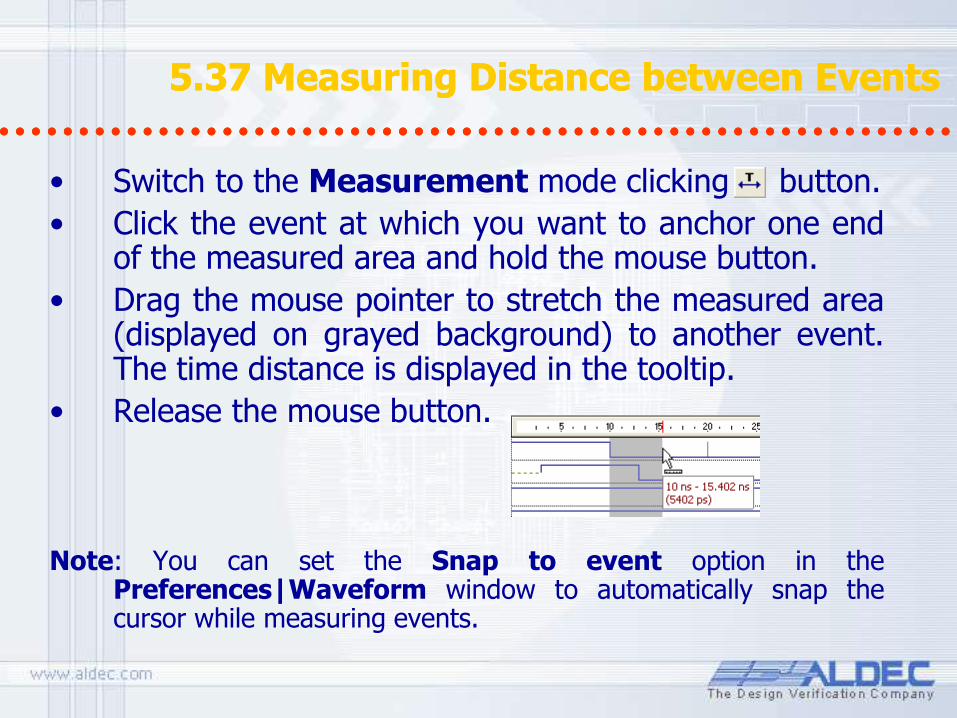
5.37 Measuring Distance between Events 5.37 Measuring Distance between Events
• Switch to the Measurement mode clicking button.
• Click the event at which you want to anchor one end of the measured area and hold the mouse button.
• Drag the mouse pointer to stretch the measured area (displayed on grayed background) to another event. The time distance is displayed in the tooltip.
• Release the mouse button.
Note: You can set the Snap to event option in the Preferences|Waveform window to automatically snap the cursor while measuring events.
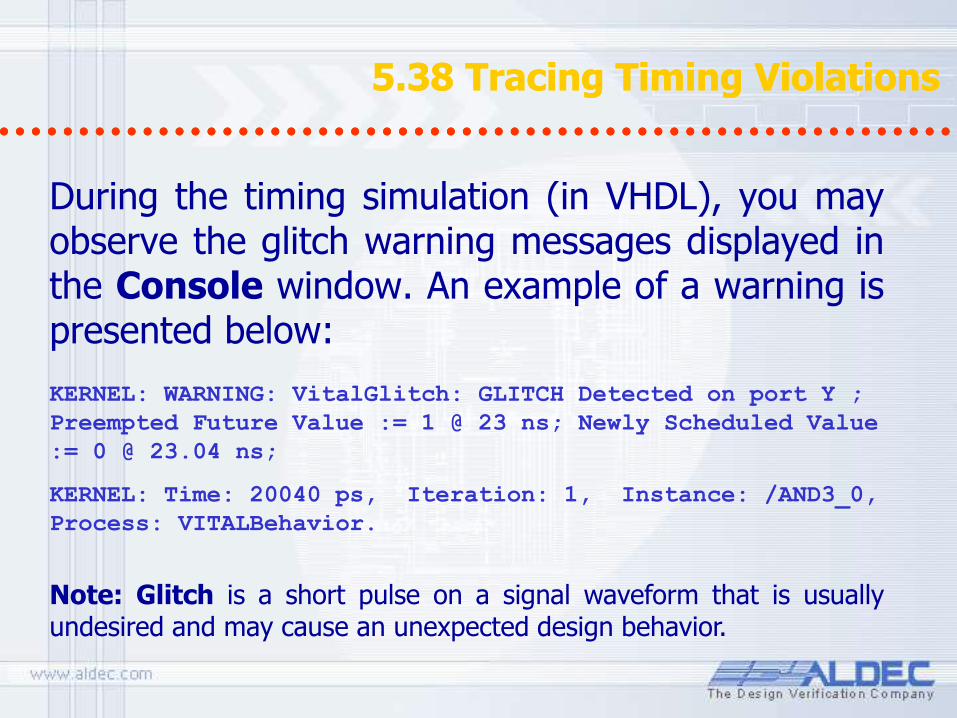
5.38 Tracing Timing Violations 5.38 Tracing Timing Violations
During the timing simulation (in VHDL), you may observe the glitch warning messages displayed in the Console window. An example of a warning is presented below:
KERNEL: WARNING: VitalGlitch: GLITCH Detected on port Y ; Preempted Future Value := 1 @ 23 ns; Newly Scheduled Value
:= 0 @ 23.04 ns;
KERNEL: Time: 20040 ps, Iteration: 1, Instance: /AND3_0,
Process: VITALBehavior.
Note: Glitch is a short pulse on a signal waveform that is usually undesired and may cause an unexpected design behavior.

5.39 Tracing Timing Violations 5.39 Tracing Timing Violations
Active-HDL allows you to disable glitch detection by checking the Ignore VITAL glitches option on the Simulation tab of the Design Settings window. If you only want to disable glitch messaging check the Disable VITAL Glitch messages option.
In the example, the glitch has been detected on the Y output port of the /AND3_0 instance.
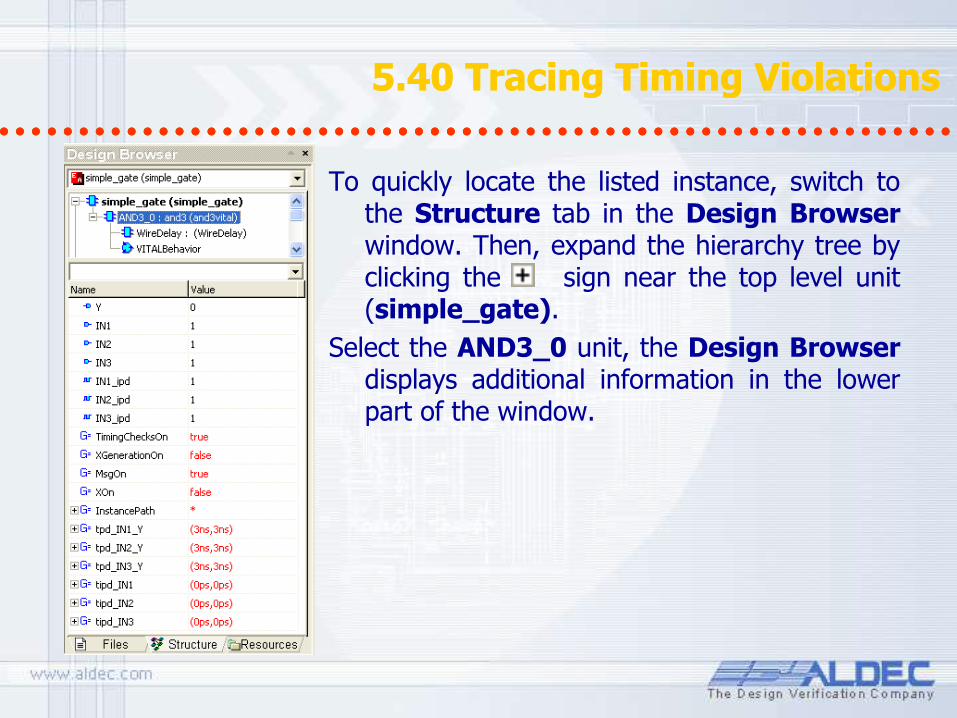
5.40 Tracing Timing Violations 5.40 Tracing Timing Violations
To quickly locate the listed instance, switch to the Structure tab in the Design Browser window. Then, expand the hierarchy tree by clicking the sign near the top level unit (simple_gate).
Select the AND3_0 unit, the Design Browser displays additional information in the lower part of the window.
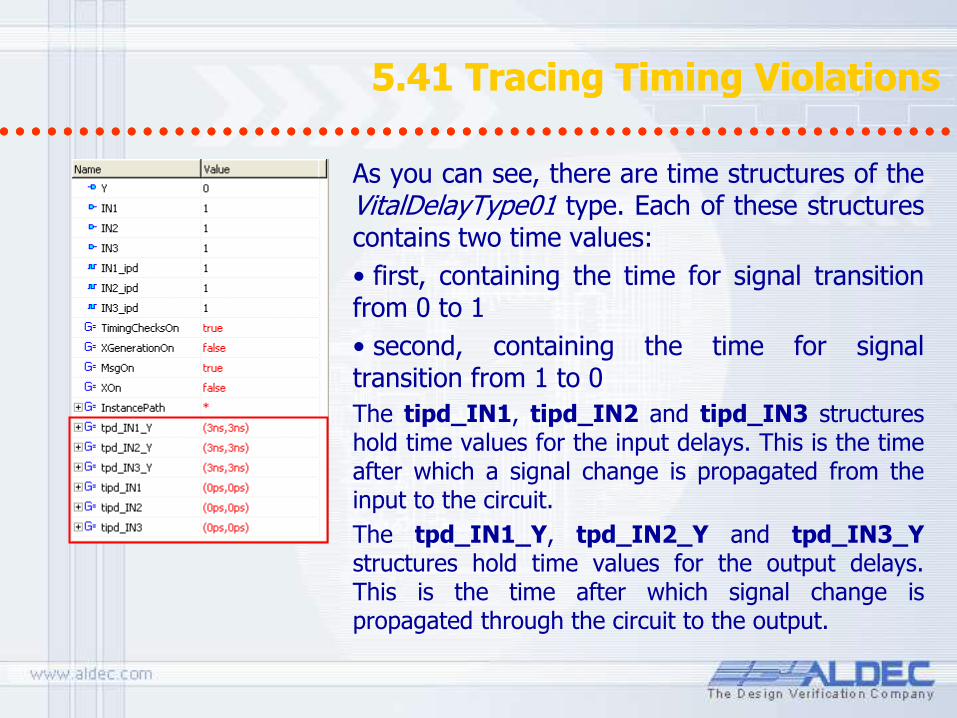
5.41 Tracing Timing Violations 5.41 Tracing Timing Violations
As you can see, there are time structures of the VitalDelayType01 type. Each of these structures contains two time values:
• first, containing the time for signal transition from 0 to 1
• second, containing the time for signal transition from 1 to 0
The tipd_IN1, tipd_IN2 and tipd_IN3 structures hold time values for the input delays. This is the time after which a signal change is propagated from the input to the circuit.
The tpd_IN1_Y, tpd_IN2_Y and tpd_IN3_Y structures hold time values for the output delays. This is the time after which signal change is propagated through the circuit to the output.

5.42 Tracing Timing Violations 5.42 Tracing Timing Violations
Keeping in mind all of the above information, we can now explain what causes the glitch. In the warning displayed in the Console window, the time of the glitch detection is 20040 ps (20.04 ns). This is specified in the line beginning with the Time clause:
KERNEL: WARNING: VitalGlitch: GLITCH Detected on port Y
; Preempted Future Value := 1 @ 23 ns; Newly Scheduled
Value := 0 @ 23.04 ns;
KERNEL: Time: 20040 ps, Iteration: 1, Instance:
/AND3_0, Process: VITALBehavior.

5.43 Tracing Timing Violations 5.43 Tracing Timing Violations
The next preempted value for the output Y port is '1' at 23 ns. However, the newly scheduled value for the output Y port is '0' at 23.04 ns.
We should keep in mind that the current output value for the Y port is '0'. The absolute time period between those two transactions equals 40 ps and we know that the output delay for this particular gate is 3000 ps.
If we add the present time value of 20040 ps and the output delay of 3000 ps then we will have the result of 23040 ps. This is the time of the newly scheduled value for the output Y port.

5.44 Tracing Timing Violations 5.44 Tracing Timing Violations
The design operates in the OnEvent mode… CONSTANT DefGlitchMode : VitalGlitchKindType := OnEvent;
...
VitalPathDelay01 (...
Mode => DefGlitchMode,
…where all input changes that have a duration time shorter than the output delay tpd are propagated to the output with ‘X’ values.
The simulator, however, does not display the glitch on the waveform because the XOn generic has been assigned with FALSE value. CONSTANT DefGlitchXOn : BOOLEAN := FALSE;
...
generic(...
XOn: Boolean := DefGlitchXOn;
...
VitalPathDelay01 (...
XOn => XOn,
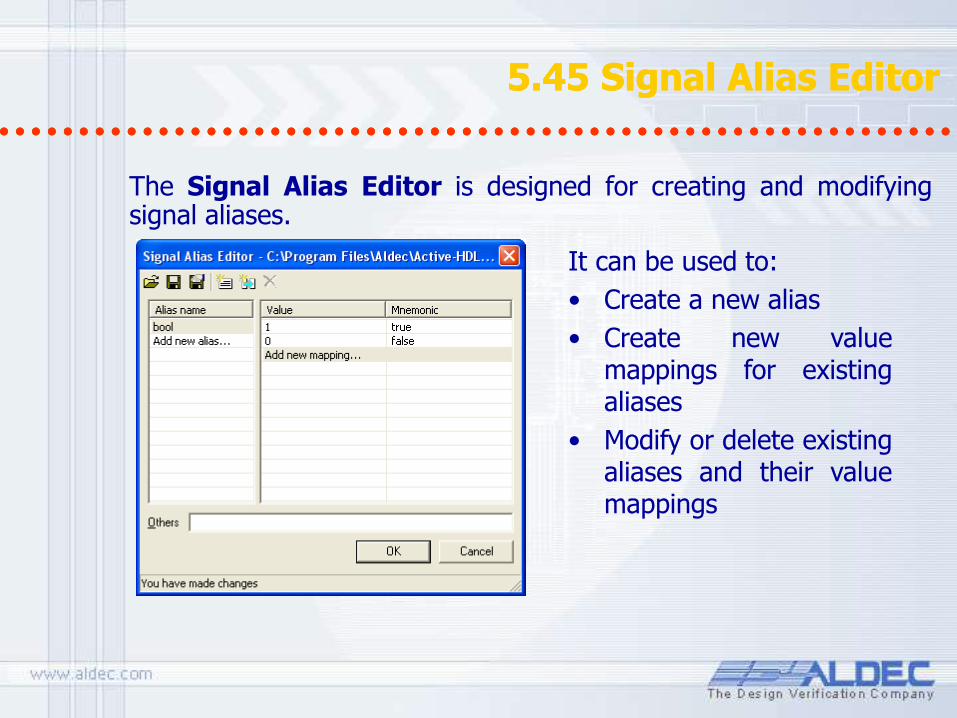
5.45 Signal Alias Editor 5.45 Signal Alias Editor
The Signal Alias Editor is designed for creating and modifying signal aliases.
It can be used to:
• Create a new alias
• Create new value mappings for existing aliases
• Modify or delete existing aliases and their value mappings
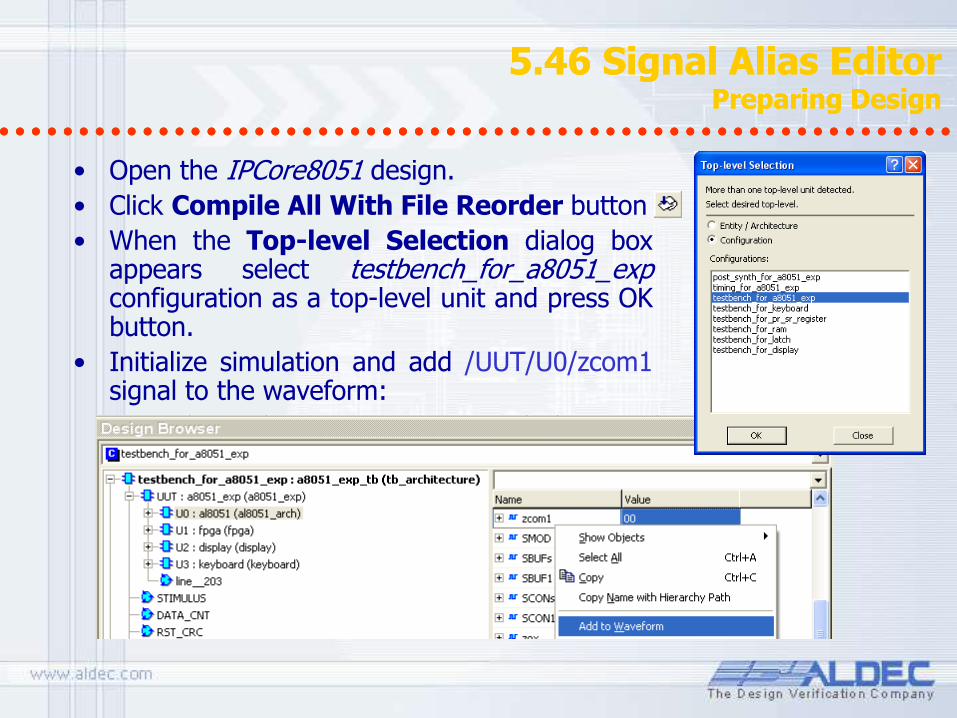
5.46 Signal Alias Editor Preparing Design
5.46 Signal Alias Editor Preparing Design
• Open the IPCore8051 design.
• Click Compile All With File Reorder button
• When the Top-level Selection dialog box appears select testbench_for_a8051_exp configuration as a top-level unit and press OK button.
• Initialize simulation and add /UUT/U0/zcom1 signal to the waveform:
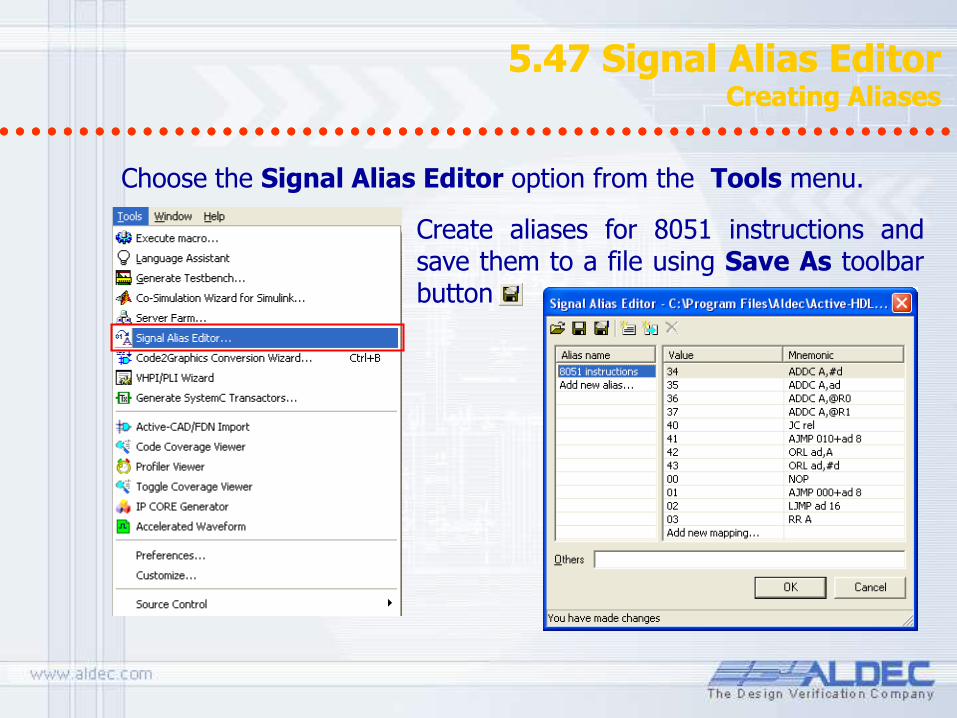
5.47 Signal Alias Editor Creating Aliases
5.47 Signal Alias Editor Creating Aliases
Choose the Signal Alias Editor option from the Tools menu.
Create aliases for 8051 instructions and save them to a file using Save As toolbar button
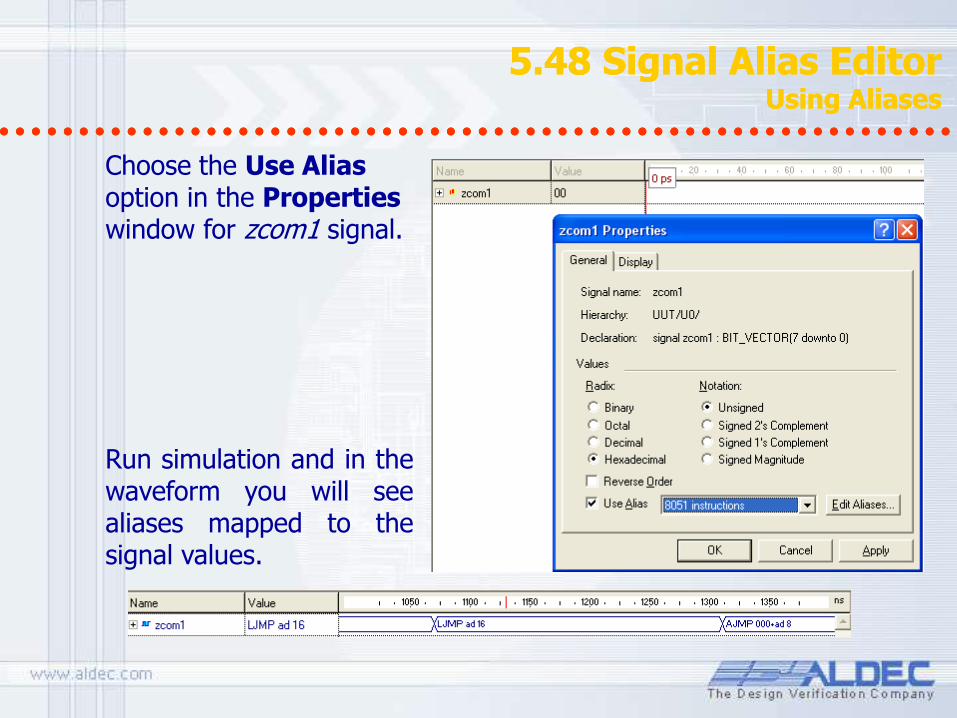
5.48 Signal Alias Editor Using Aliases
5.48 Signal Alias Editor Using Aliases
Choose the Use Alias option in the Properties window for zcom1 signal.
Run simulation and in the waveform you will see aliases mapped to the signal values.

Design Verification
Debugging
Part 6
6.1 Debugging 6.1 Debugging
• Syntax Checking - performed with every Compile command
• Code Tracing - HDL code is executed either statement-by-statement or traced by processes, subprograms, and procedures
• Value Verification - variable values are displayed in additional Watch, List, and Memory View windows
• Activity Status – active processes are displayed in the Processes window
• Off-line Simulation – the Post Simulation Debug mode allows observing simulation results saved to a file after the simulation has been finished
• Design Interconnects - statements, port maps, connections, instances are displayed in the Advanced Dataflow window
• XTrace – helps to find the unknown values throughout the design
Active-HDL provides several mechanisms for efficient HDL code debugging and viewing design interconnects:
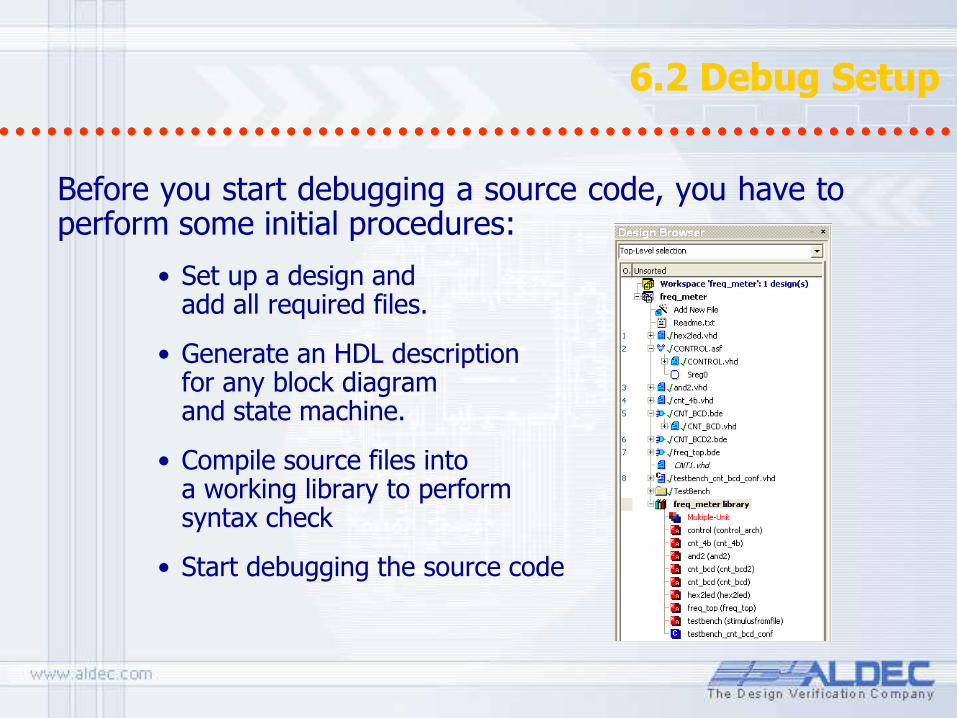
6.2 Debug Setup 6.2 Debug Setup
Before you start debugging a source code, you have to perform some initial procedures:
• Set up a design and add all required files.
• Generate an HDL description for any block diagram and state machine.
• Compile source files into a working library to perform syntax check
• Start debugging the source code

6.3 Debugging Restrictions 6.3 Debugging Restrictions
Active-HDL allows you to debug the source code of your design that has been compiled into a working library.
However, the components stored in some standard libraries provided with Active-HDL software do not contain the original source code.
Instead, they contain the headers for the pre-compiled code that you will not be able to debug.
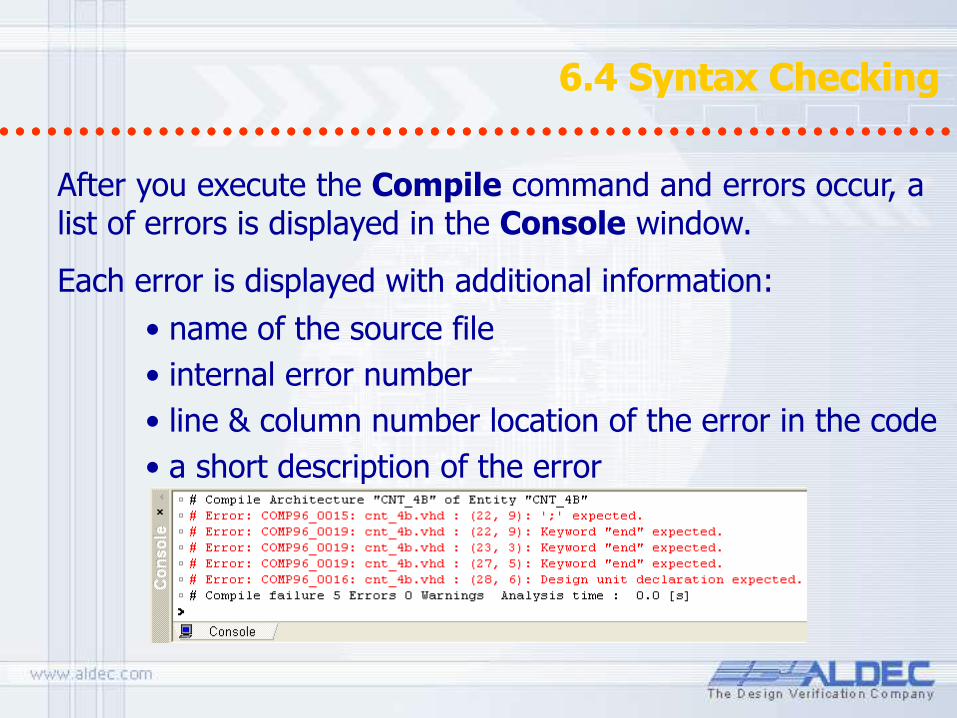
6.4 Syntax Checking 6.4 Syntax Checking
• name of the source file
• internal error number
• line & column number location of the error in the code
• a short description of the error
After you execute the Compile command and errors occur, a list of errors is displayed in the Console window.
Each error is displayed with additional information:
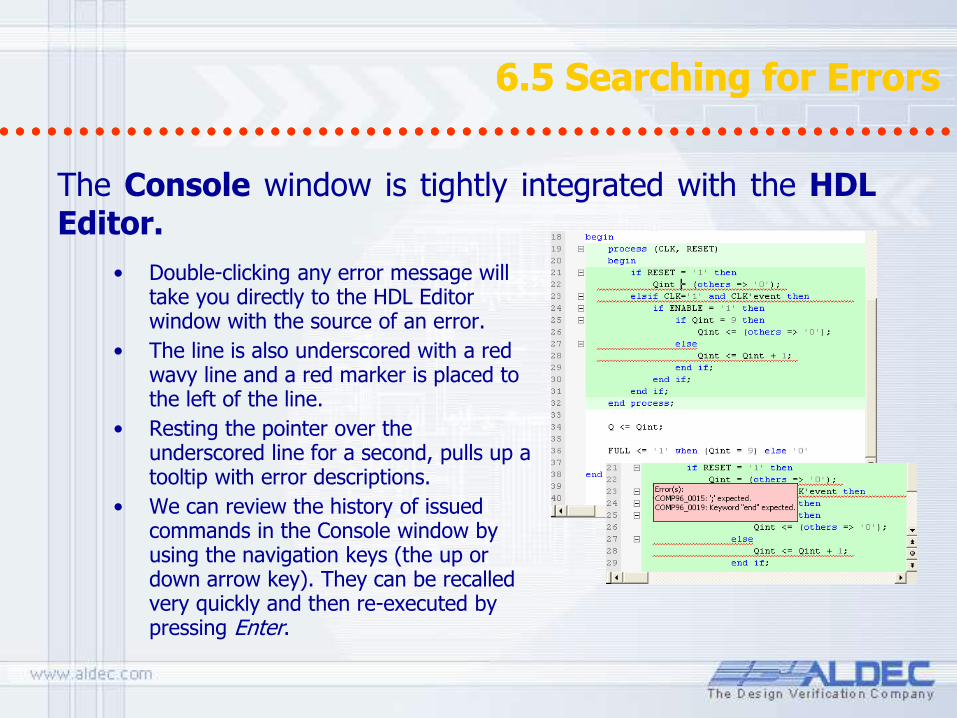
6.5 Searching for Errors 6.5 Searching for Errors
• Double-clicking any error message will take you directly to the HDL Editor window with the source of an error.
• The line is also underscored with a red wavy line and a red marker is placed to the left of the line.
• Resting the pointer over the underscored line for a second, pulls up a tooltip with error descriptions.
• We can review the history of issued commands in the Console window by using the navigation keys (the up or down arrow key). They can be recalled very quickly and then re-executed by pressing Enter.
The Console window is tightly integrated with the HDL Editor.

6.6 Preferences 6.6 Preferences
• Select one of the two options for tracing state machine code:
– trace the original state machine
– trace HDL code generated from a state machine
• Separate component instances view
• Set the display options for vectors and numbers
The Preferences window allows you to customize the way the debugger works:

6.7 Code Tracing 6.7 Code Tracing
Trace into - executes a single HDL statement. If a subprogram call is encountered, the execution descends into the subprogram body.
Trace over - executes a single HDL command. If a subprogram call is encountered, the statements contained within the subprogram body are executed in a single step.
Trace out - executes as many HDL statements as are required to complete the execution of a subprogram. If subprograms are nested, the command completes the execution of the innermost subprogram only.
Trace over transition - executes as many HDL statements as are required to perform a transition between states.
You can trace the HDL source code statement-by-statement. There are four functions that allow you to trace the code:
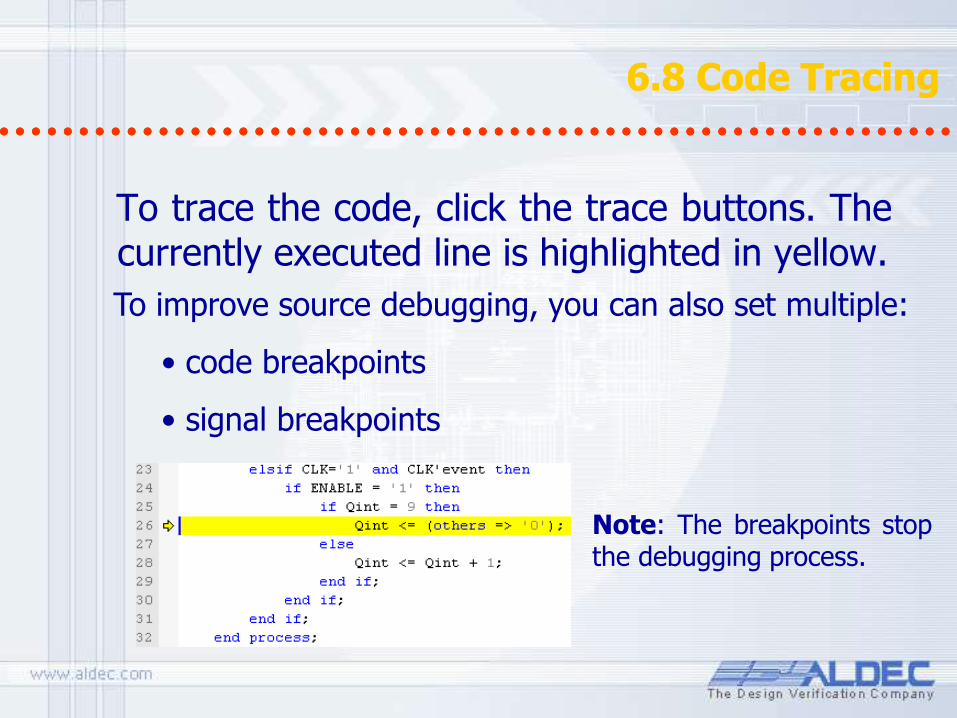
6.8 Code Tracing 6.8 Code Tracing
To trace the code, click the trace buttons. The currently executed line is highlighted in yellow. To improve source debugging, you can also set multiple:
• code breakpoints
• signal breakpoints
Note: The breakpoints stop the debugging process.
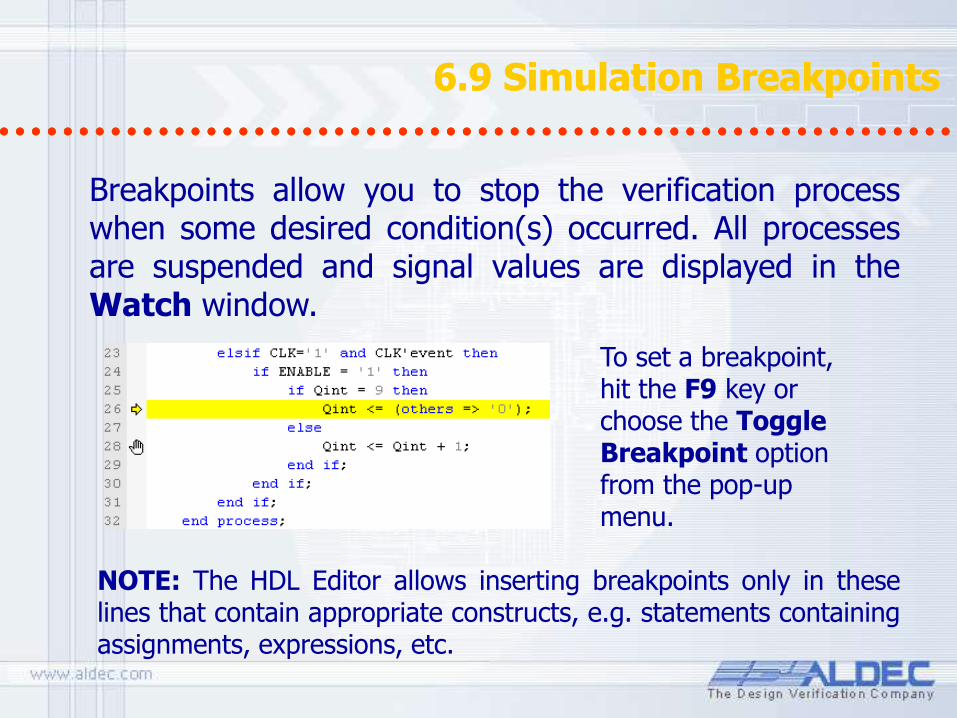
6.9 Simulation Breakpoints 6.9 Simulation Breakpoints
Breakpoints allow you to stop the verification process when some desired condition(s) occurred. All processes are suspended and signal values are displayed in the Watch window.
NOTE: The HDL Editor allows inserting breakpoints only in these lines that contain appropriate constructs, e.g. statements containing assignments, expressions, etc.
To set a breakpoint, hit the F9 key or choose the Toggle Breakpoint option from the pop-up menu.
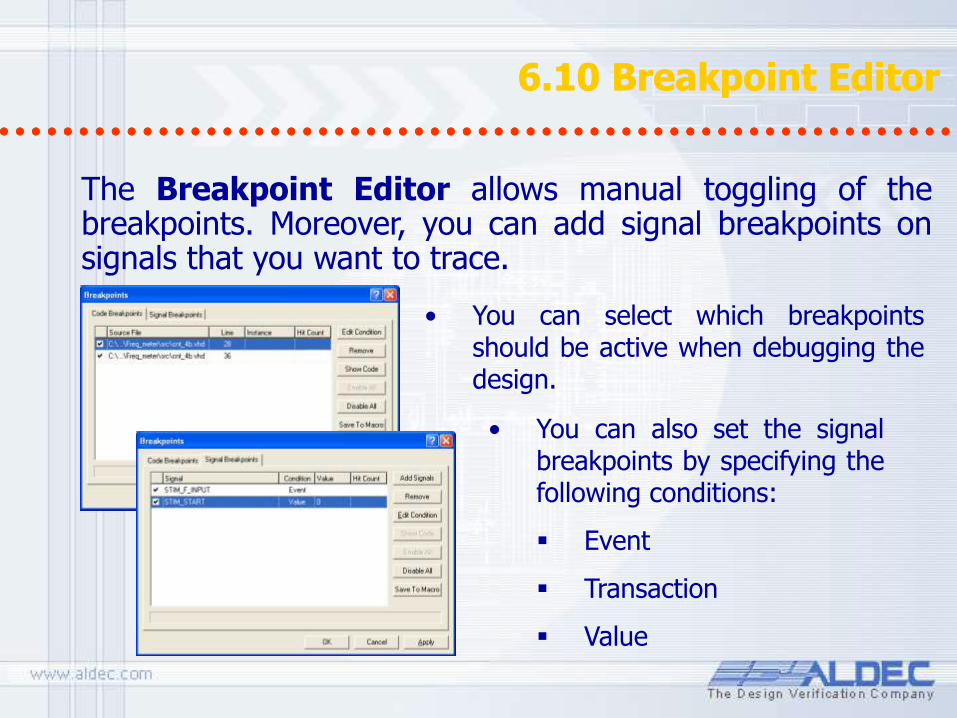
6.10 Breakpoint Editor 6.10 Breakpoint Editor
The Breakpoint Editor allows manual toggling of the breakpoints. Moreover, you can add signal breakpoints on signals that you want to trace.
• You can select which breakpoints should be active when debugging the design.
• You can also set the signal breakpoints by specifying the following conditions:
Event
Transaction
Value
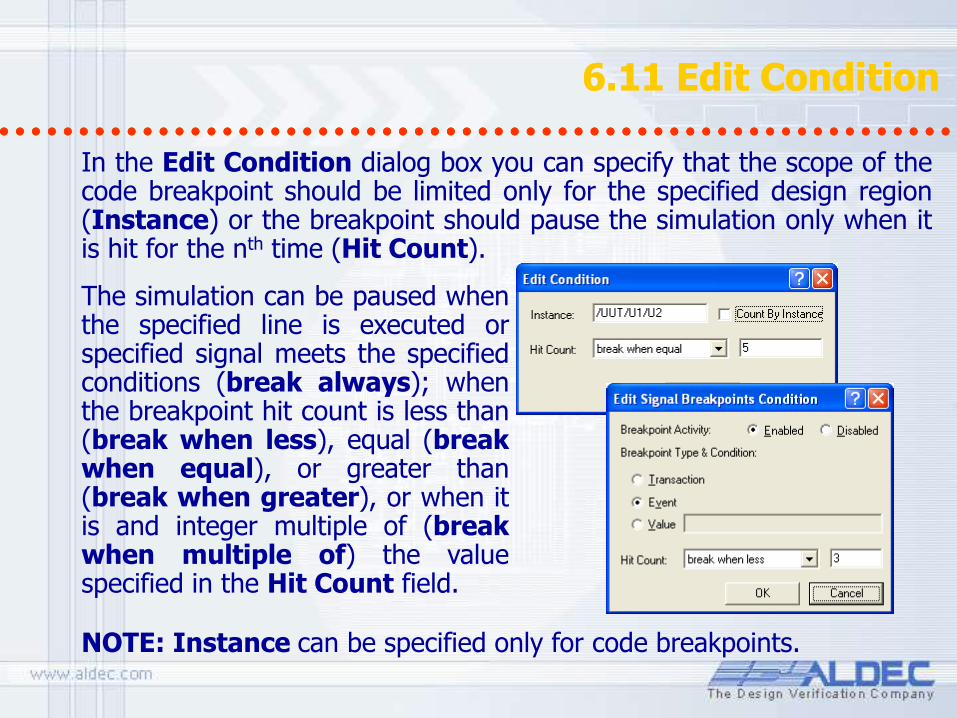
6.11 Edit Condition 6.11 Edit Condition
In the Edit Condition dialog box you can specify that the scope of the code breakpoint should be limited only for the specified design region (Instance) or the breakpoint should pause the simulation only when it is hit for the nth time (Hit Count).
NOTE: Instance can be specified only for code breakpoints.
The simulation can be paused when the specified line is executed or specified signal meets the specified conditions (break always); when the breakpoint hit count is less than (break when less), equal (break when equal), or greater than (break when greater), or when it is and integer multiple of (break when multiple of) the value specified in the Hit Count field.

6.12 State Machine Code Debugging 6.12 State Machine Code Debugging
• All the Trace commands are active during the debugging. Therefore, you can trace an execution of any statement in the HDL code and observe its influence on the model’s behavior.
• The Trace over Transition option executes the source code to the point where the next transition takes place.
To trace state machines, you need to generate their corresponding HDL code. The State Machine Editor highlights the currently active state in yellow.
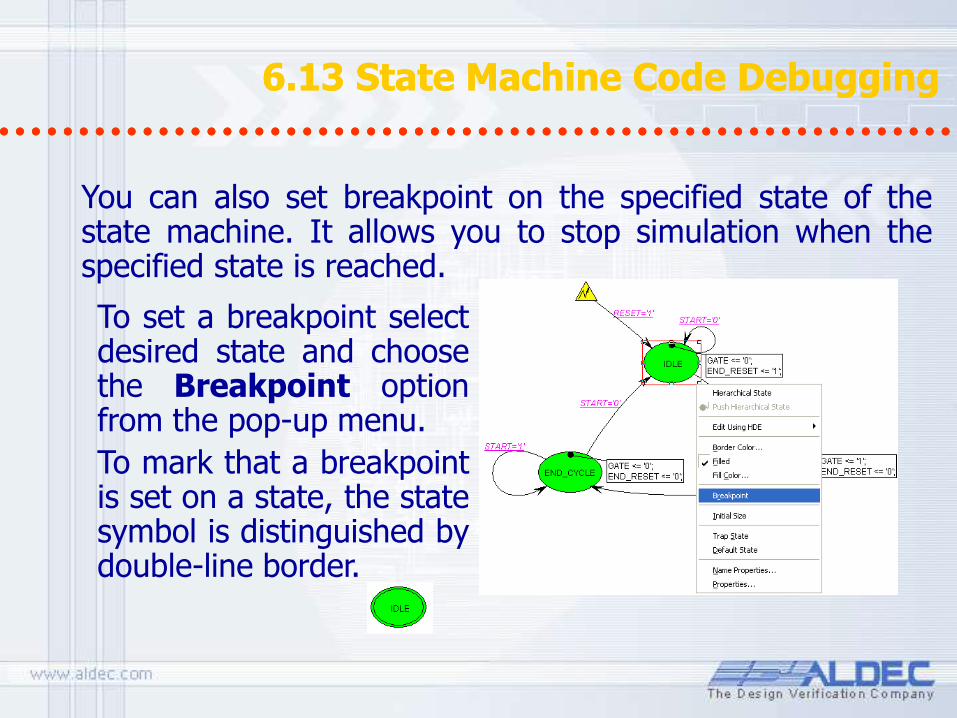
6.13 State Machine Code Debugging 6.13 State Machine Code Debugging
You can also set breakpoint on the specified state of the state machine. It allows you to stop simulation when the specified state is reached.
To set a breakpoint select desired state and choose the Breakpoint option from the pop-up menu.
To mark that a breakpoint is set on a state, the state symbol is distinguished by double-line border.

6.14 Verifying Results 6.14 Verifying Results
• Watch – displays the current signal, variable, or generic value • List – displays results in a tabular format • Waveform – displays graphical results in a form of signal waves • Processes – displays the process status in the current simulation
cycle • Call Stack – displays a list of sub-programs being currently
executed and their parameters
You can use additional tools while tracing HDL code that will help you to verify the design’s overall responses. Active-HDL comes with the following interactive windows:
Note: You can open each window by choosing an appropriate option from the View or File | New menu.
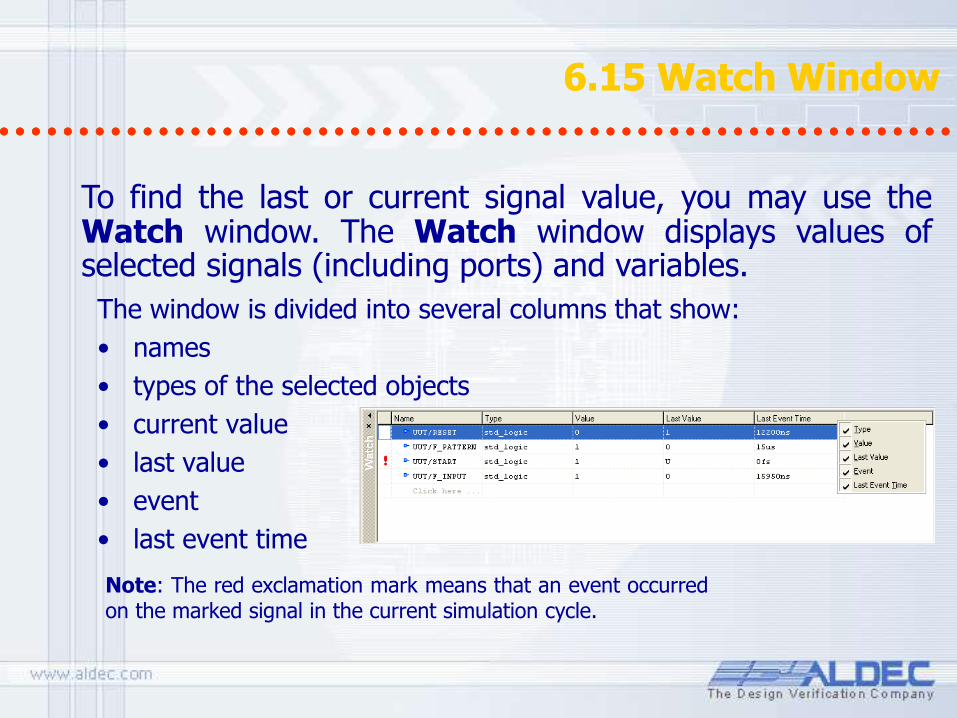
The window is divided into several columns that show:
• names
• types of the selected objects
• current value
• last value
• event
• last event time
6.15 Watch Window 6.15 Watch Window
To find the last or current signal value, you may use the Watch window. The Watch window displays values of selected signals (including ports) and variables.
Note: The red exclamation mark means that an event occurred on the marked signal in the current simulation cycle.

6.16 Adding Signals to Watch 6.16 Adding Signals to Watch
• To add the signal from the HDL code, highlight the signal name.
• Drag the signal to the Watch window.
All signals viewed in the Watch window can be dragged and dropped from the Design Browser window or the Standard Waveform window. You can also drag a signal name from the HDL source code itself.
Note: You can change signal display options in the Preferences window by choosing the Display options from the pop-up menu.
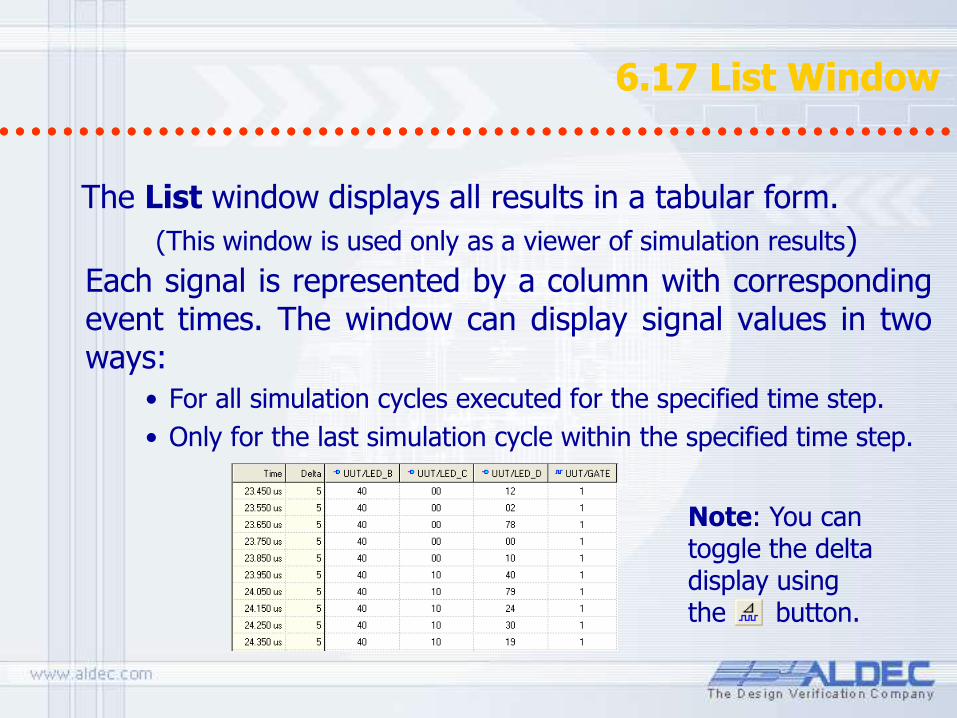
6.17 List Window 6.17 List Window
Each signal is represented by a column with corresponding event times. The window can display signal values in two ways:
• For all simulation cycles executed for the specified time step.
• Only for the last simulation cycle within the specified time step.
The List window displays all results in a tabular form.
(This window is used only as a viewer of simulation results)
Note: You can toggle the delta display using the button.

6.18 Delta Cycle Handling 6.18 Delta Cycle Handling
The Active-HDL simulator uses delta cycles to simulate the design.
A delta time is an infinitesimally small amount of time that represents a time greater than zero, but it is zero when added to a discrete amount of time. Thus, if a signal assignment is made at time "100ns + 1 delta time" and the model discrete delay is 10ns, the new signal value is assigned at 100ns + 10ns + 0 delta time = 110ns. This is because the 1 delta time * 1 = 0ns.
The number of delta delays reflects the number of events that take place in particular simulation cycles.
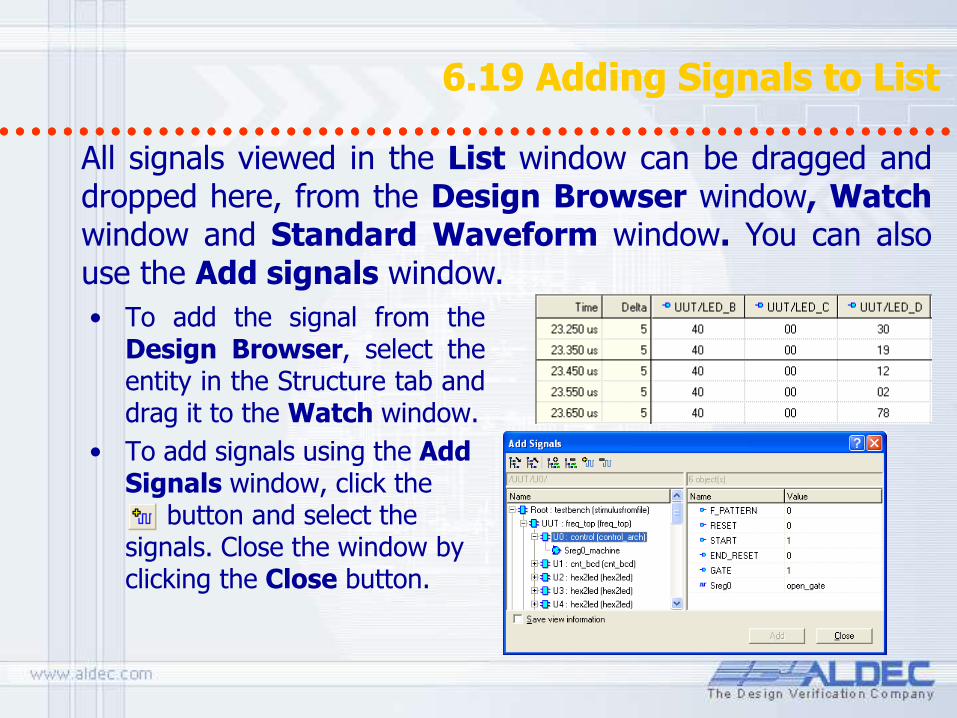
6.19 Adding Signals to List 6.19 Adding Signals to List
• To add the signal from the Design Browser, select the entity in the Structure tab and drag it to the Watch window.
• To add signals using the Add Signals window, click the button and select the signals. Close the window by clicking the Close button.
All signals viewed in the List window can be dragged and dropped here, from the Design Browser window, Watch window and Standard Waveform window. You can also use the Add signals window.

6.20 Processes Window 6.20 Processes Window
Each concurrent statement that is modeling a sequential process is represented in the window. There are: – process statements
– concurrent signals assignment statements
– concurrent assertion statements
– concurrent procedure call statements
The Processes window displays a list of processes in the elaborated model along with their current status. This window is available only while the simulator is running.
Note: For processes without explicit labels, the compiler generates default labels that show the line number of the source file in which a process is located (e.g., line__15).
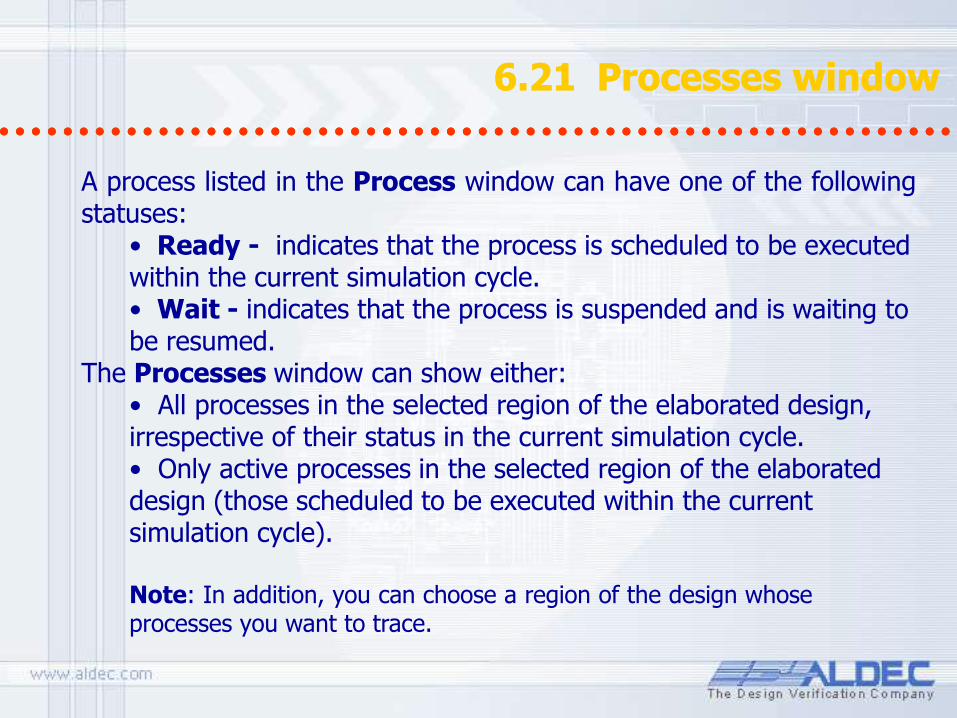
6.21 Processes window 6.21 Processes window
A process listed in the Process window can have one of the following statuses:
• Ready - indicates that the process is scheduled to be executed within the current simulation cycle. • Wait - indicates that the process is suspended and is waiting to be resumed.
The Processes window can show either: • All processes in the selected region of the elaborated design, irrespective of their status in the current simulation cycle. • Only active processes in the selected region of the elaborated design (those scheduled to be executed within the current simulation cycle).
Note: In addition, you can choose a region of the design whose processes you want to trace.
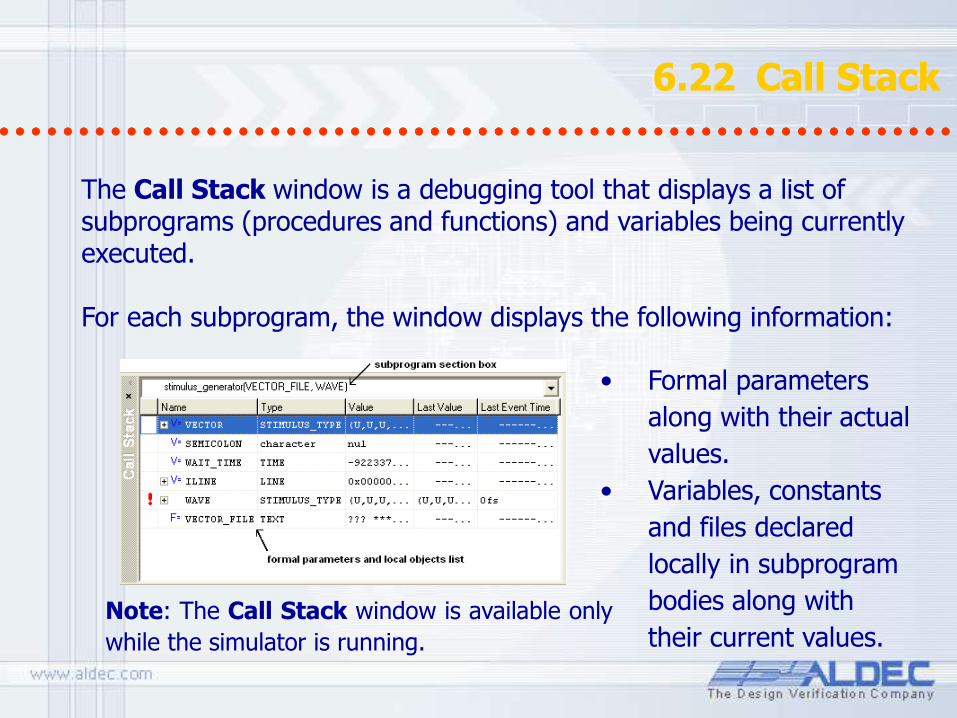
6.22 Call Stack 6.22 Call Stack
The Call Stack window is a debugging tool that displays a list of subprograms (procedures and functions) and variables being currently executed. For each subprogram, the window displays the following information:
• Formal parameters
along with their actual
values.
• Variables, constants
and files declared
locally in subprogram
bodies along with
their current values.
Note: The Call Stack window is available only
while the simulator is running.
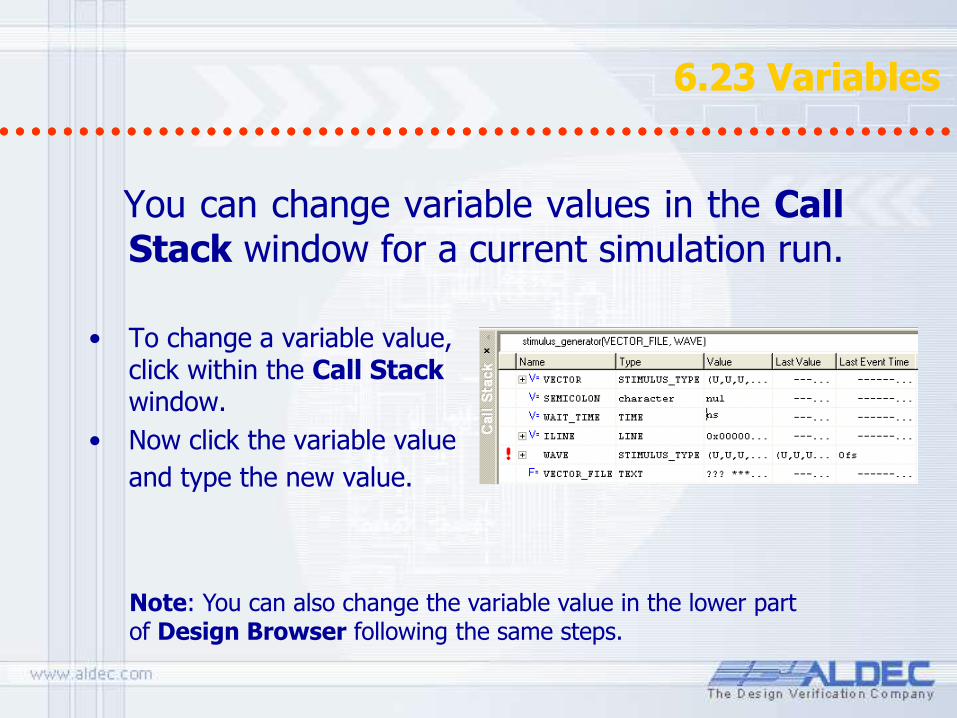
6.23 Variables 6.23 Variables
You can change variable values in the Call Stack window for a current simulation run.
• To change a variable value, click within the Call Stack window.
• Now click the variable value
and type the new value.
Note: You can also change the variable value in the lower part of Design Browser following the same steps.
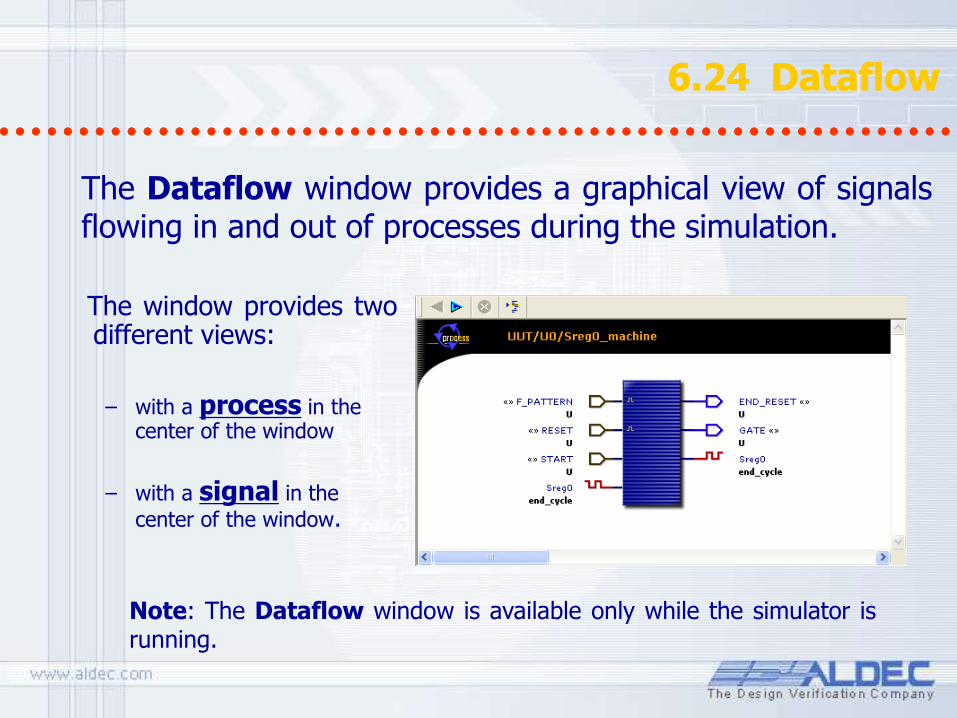
6.24 Dataflow 6.24 Dataflow
The Dataflow window provides a graphical view of signals flowing in and out of processes during the simulation.
The window provides two different views:
– with a process in the center of the window
– with a signal in the
center of the window.
Note: The Dataflow window is available only while the simulator is running.
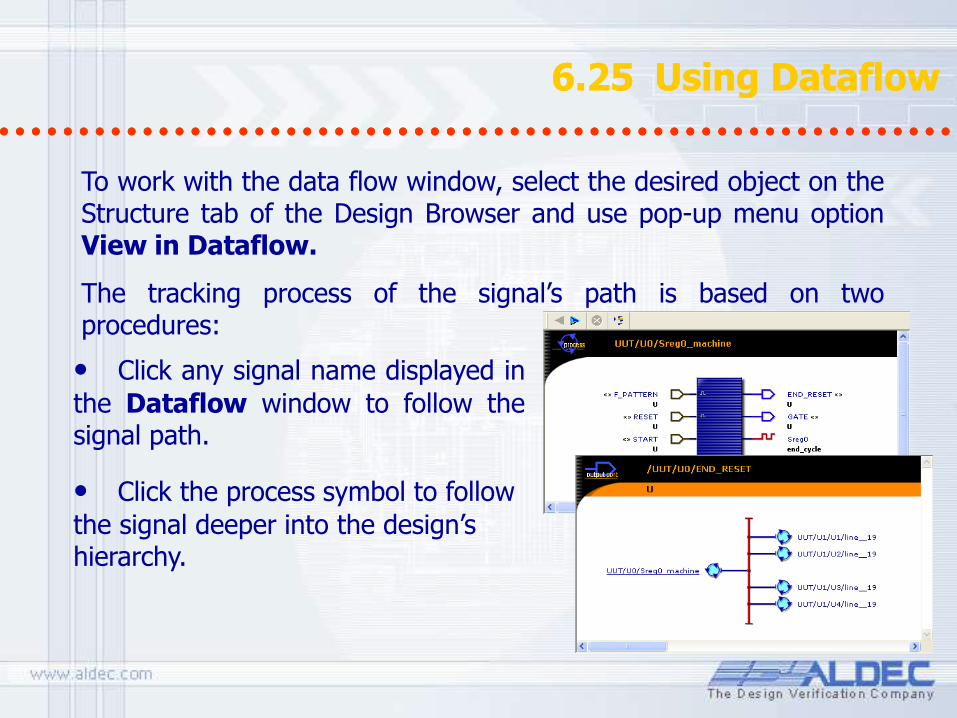
6.25 Using Dataflow 6.25 Using Dataflow
To work with the data flow window, select the desired object on the Structure tab of the Design Browser and use pop-up menu option View in Dataflow.
The tracking process of the signal’s path is based on two procedures:
• Click any signal name displayed in
the Dataflow window to follow the signal path.
• Click the process symbol to follow
the signal deeper into the design’s hierarchy.

Synthesis and Implementation in Flow Manager
Part 7
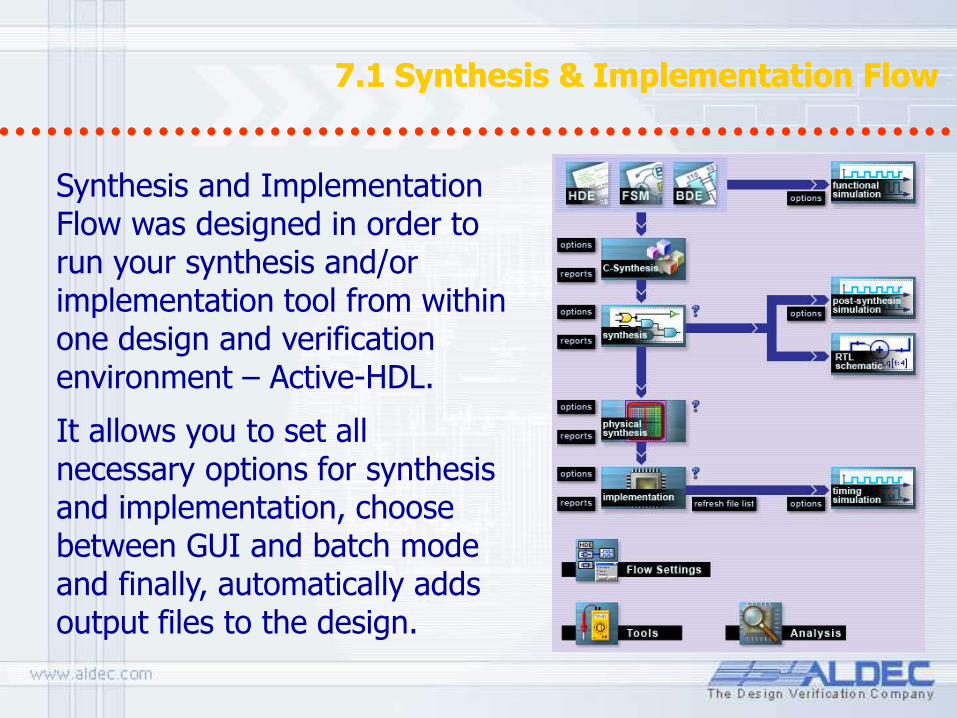
7.1 Synthesis & Implementation Flow 7.1 Synthesis & Implementation Flow
Synthesis and Implementation Flow was designed in order to run your synthesis and/or implementation tool from within one design and verification environment – Active-HDL.
It allows you to set all necessary options for synthesis and implementation, choose between GUI and batch mode and finally, automatically adds output files to the design.
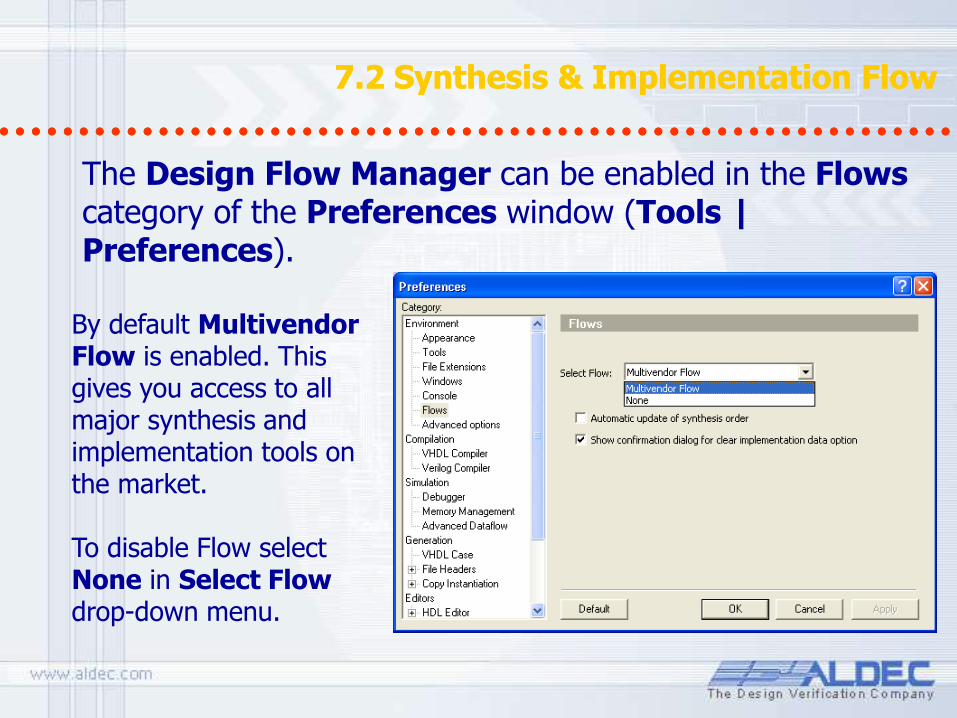
7.2 Synthesis & Implementation Flow 7.2 Synthesis & Implementation Flow
The Design Flow Manager can be enabled in the Flows category of the Preferences window (Tools | Preferences).
By default Multivendor Flow is enabled. This gives you access to all major synthesis and implementation tools on the market. To disable Flow select None in Select Flow drop-down menu.
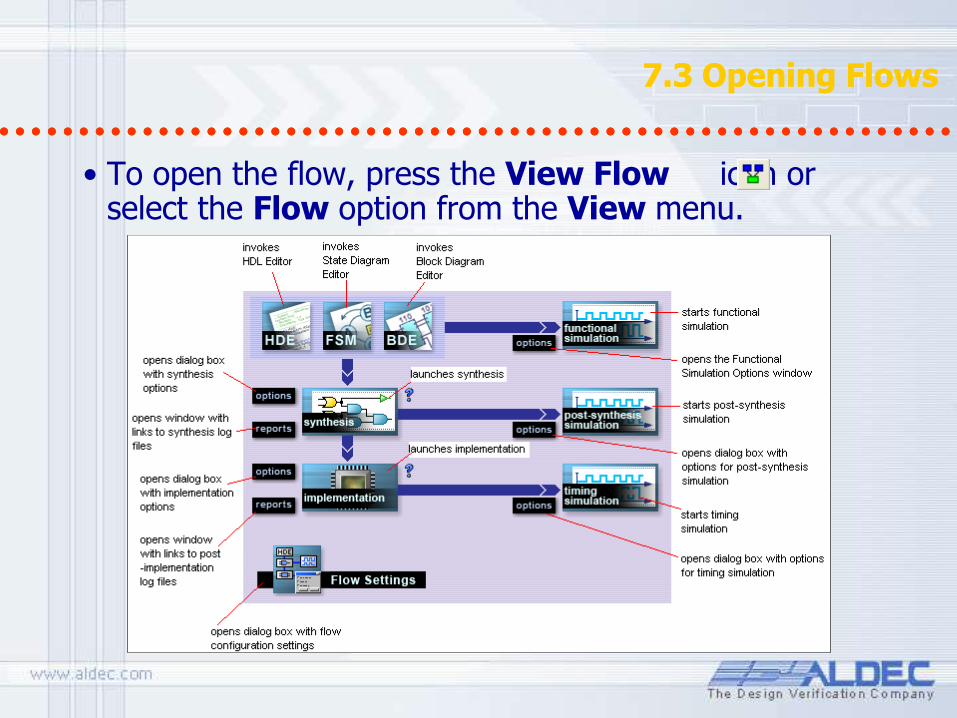
7.3 Opening Flows 7.3 Opening Flows
• To open the flow, press the View Flow icon or select the Flow option from the View menu.
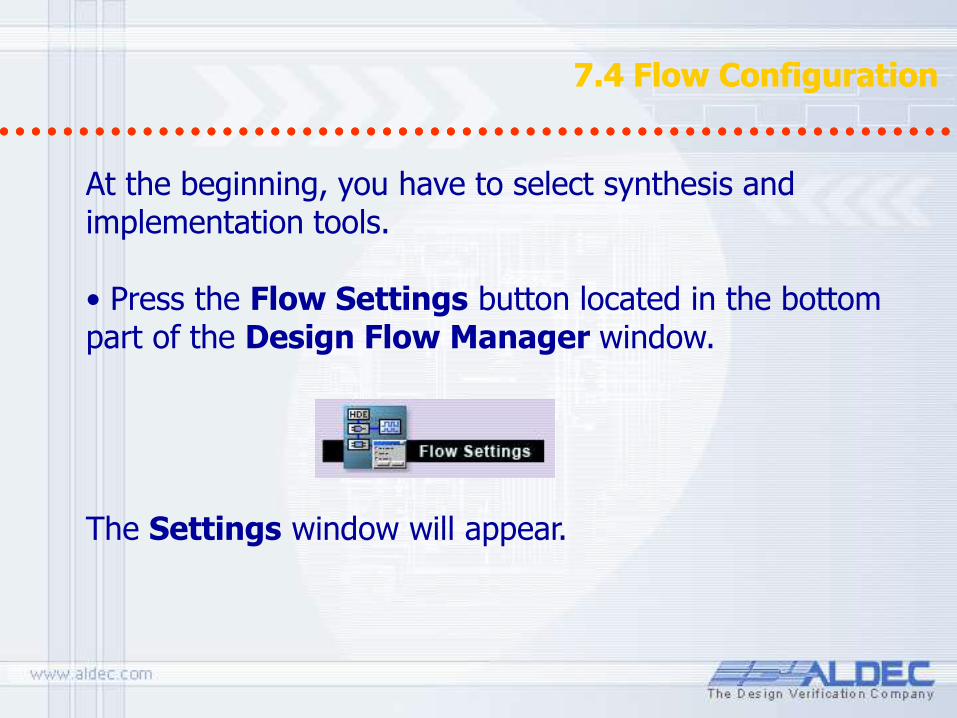
7.4 Flow Configuration 7.4 Flow Configuration
At the beginning, you have to select synthesis and implementation tools. • Press the Flow Settings button located in the bottom part of the Design Flow Manager window.
The Settings window will appear.
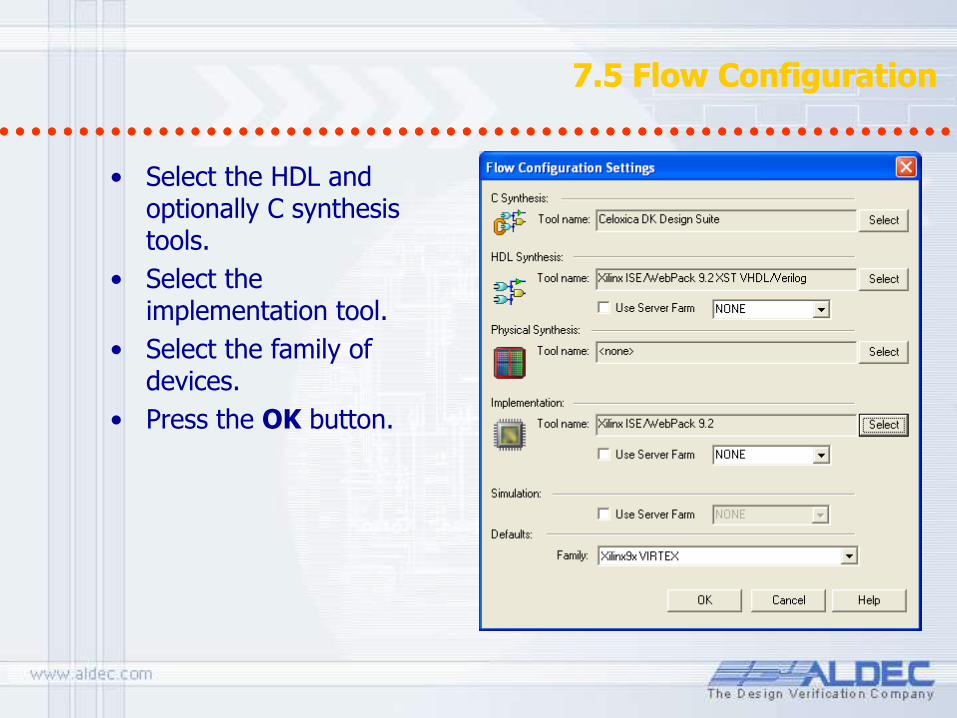
7.5 Flow Configuration 7.5 Flow Configuration
• Select the HDL and optionally C synthesis tools.
• Select the implementation tool.
• Select the family of devices.
• Press the OK button.

7.6 Synthesis 7.6 Synthesis
When the Flow is configured and your design is ready, you can start synthesis. To set the synthesis options, press the Options button located to the left of the Synthesis button.
The Synthesis Options window will appear.
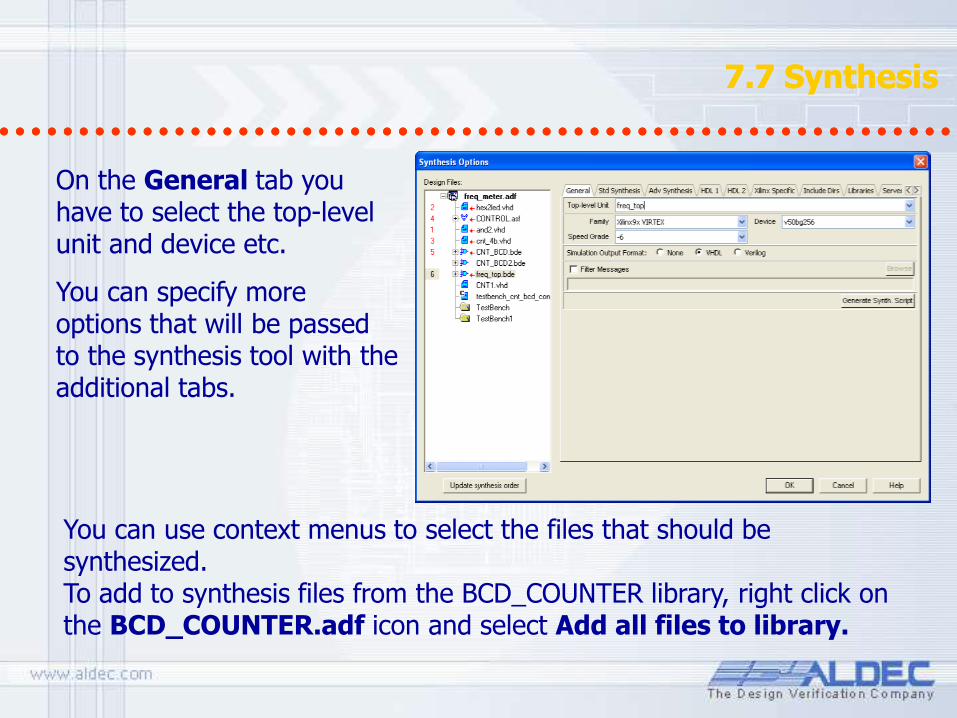
7.7 Synthesis 7.7 Synthesis
On the General tab you have to select the top-level unit and device etc.
You can specify more options that will be passed to the synthesis tool with the additional tabs.
You can use context menus to select the files that should be synthesized. To add to synthesis files from the BCD_COUNTER library, right click on the BCD_COUNTER.adf icon and select Add all files to library.
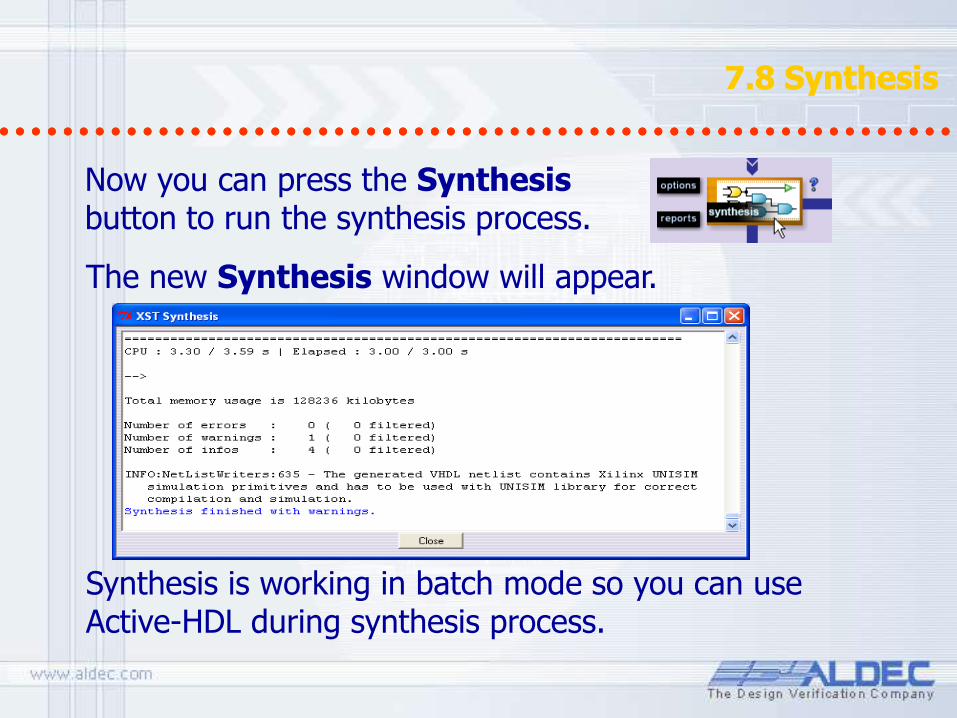
7.8 Synthesis 7.8 Synthesis
The new Synthesis window will appear. Synthesis is working in batch mode so you can use Active-HDL during synthesis process.
Now you can press the Synthesis button to run the synthesis process.
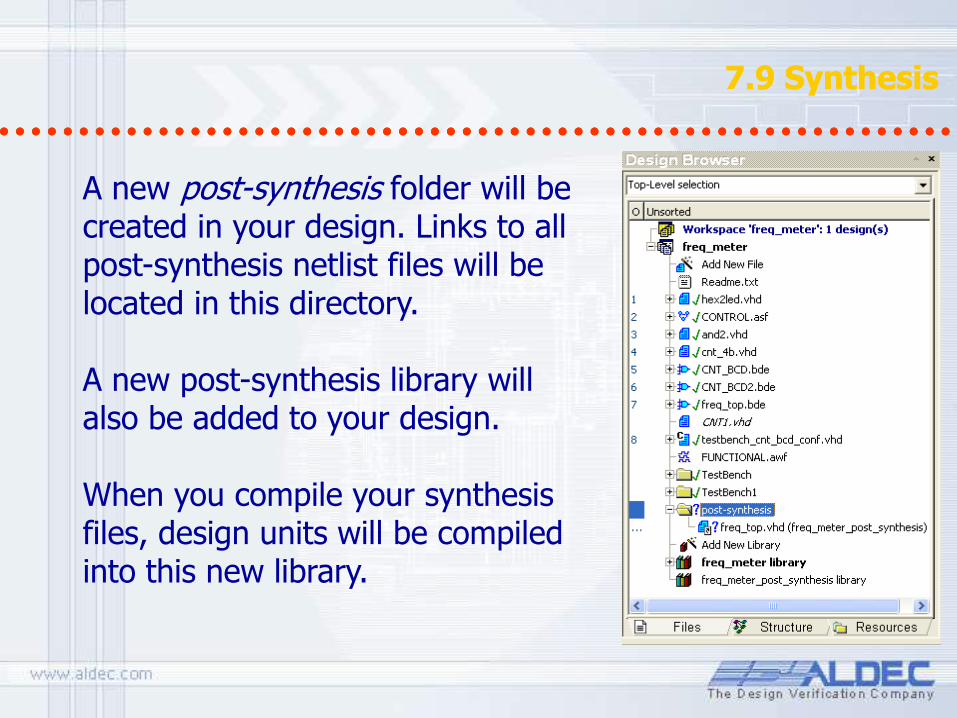
7.9 Synthesis 7.9 Synthesis
A new post-synthesis folder will be created in your design. Links to all post-synthesis netlist files will be located in this directory. A new post-synthesis library will also be added to your design. When you compile your synthesis files, design units will be compiled into this new library.

7.10 Post-synthesis Simulation 7.10 Post-synthesis Simulation
Now you are ready to run post-synthesis simulation. You can use the same testbench model as for behavioral simulation. Press the Options button located near the Post-synthesis simulation button. The Post-synthesis Simulation Options window will appear.
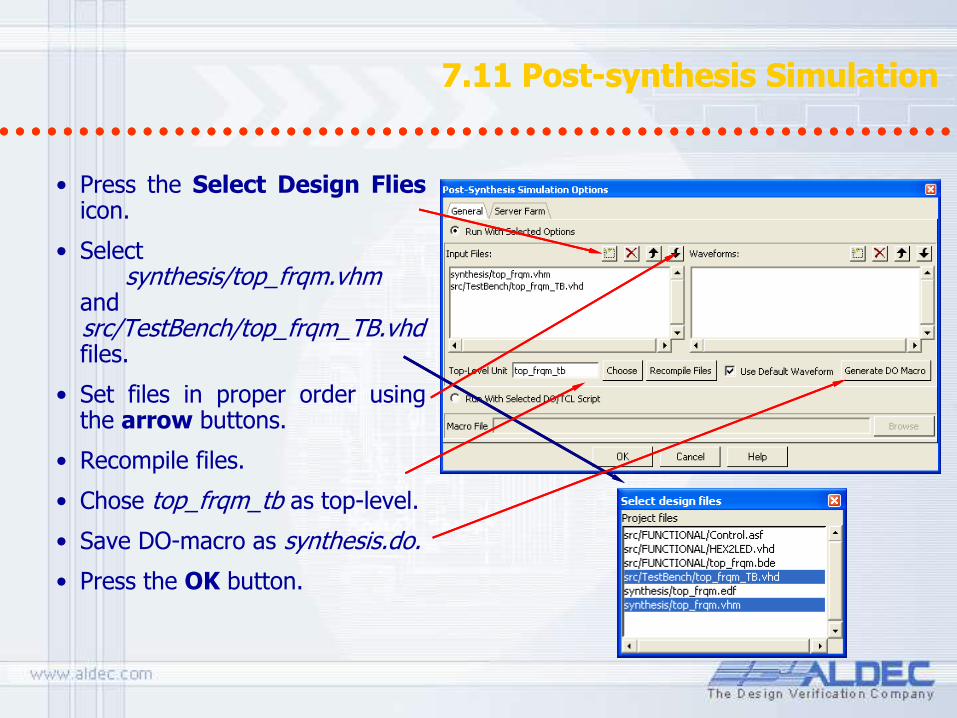
7.11 Post-synthesis Simulation 7.11 Post-synthesis Simulation
• Press the Select Design Flies icon.
• Select synthesis/top_frqm.vhm
and src/TestBench/top_frqm_TB.vhd files.
• Set files in proper order using the arrow buttons.
• Recompile files.
• Chose top_frqm_tb as top-level.
• Save DO-macro as synthesis.do.
• Press the OK button.
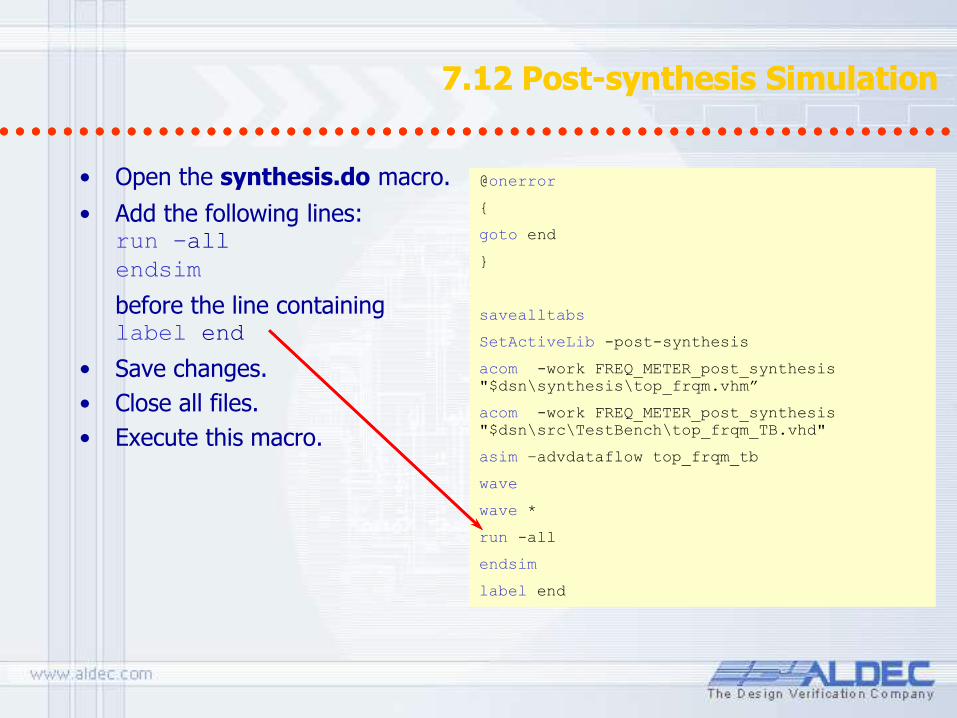
7.12 Post-synthesis Simulation 7.12 Post-synthesis Simulation
• Open the synthesis.do macro.
• Add the following lines: run –all
endsim
before the line containing label end
• Save changes.
• Close all files.
• Execute this macro.
@onerror
{
goto end
}
savealltabs
SetActiveLib -post-synthesis
acom -work FREQ_METER_post_synthesis
"$dsn\synthesis\top_frqm.vhm”
acom -work FREQ_METER_post_synthesis
"$dsn\src\TestBench\top_frqm_TB.vhd"
asim –advdataflow top_frqm_tb
wave
wave *
run -all
endsim
label end
@onerror
{
goto end
}
savealltabs
SetActiveLib -post-synthesis
acom -work FREQ_METER_post_synthesis
"$dsn\synthesis\top_frqm.vhm”
acom -work FREQ_METER_post_synthesis
"$dsn\src\TestBench\top_frqm_TB.vhd"
asim –advdataflow top_frqm_tb
wave
wave *
run -all
endsim
label end
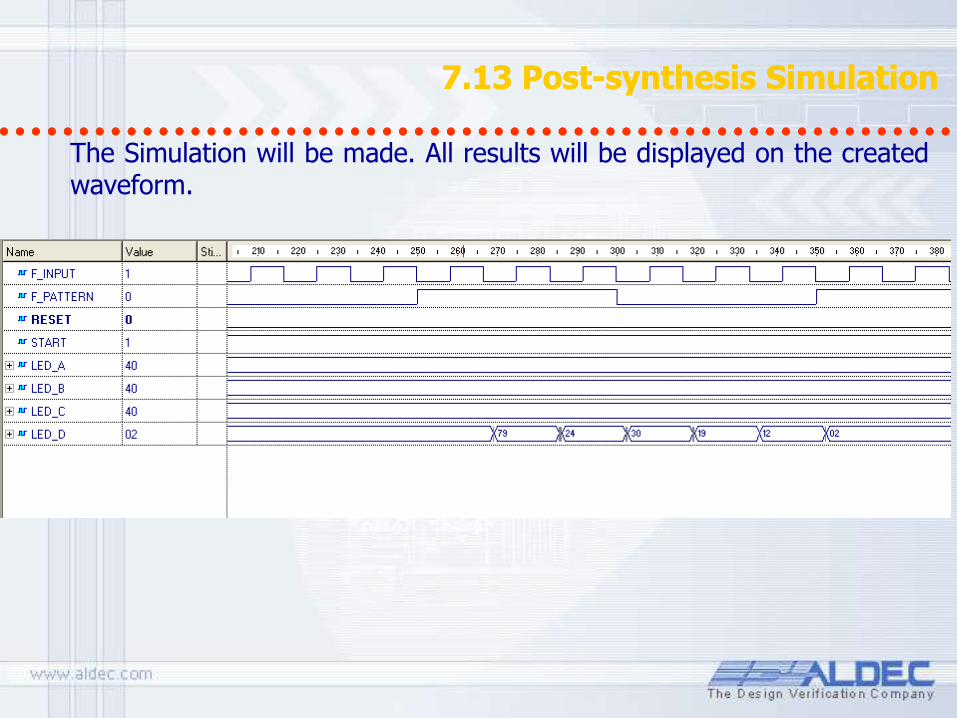
7.13 Post-synthesis Simulation 7.13 Post-synthesis Simulation
The Simulation will be made. All results will be displayed on the created waveform.
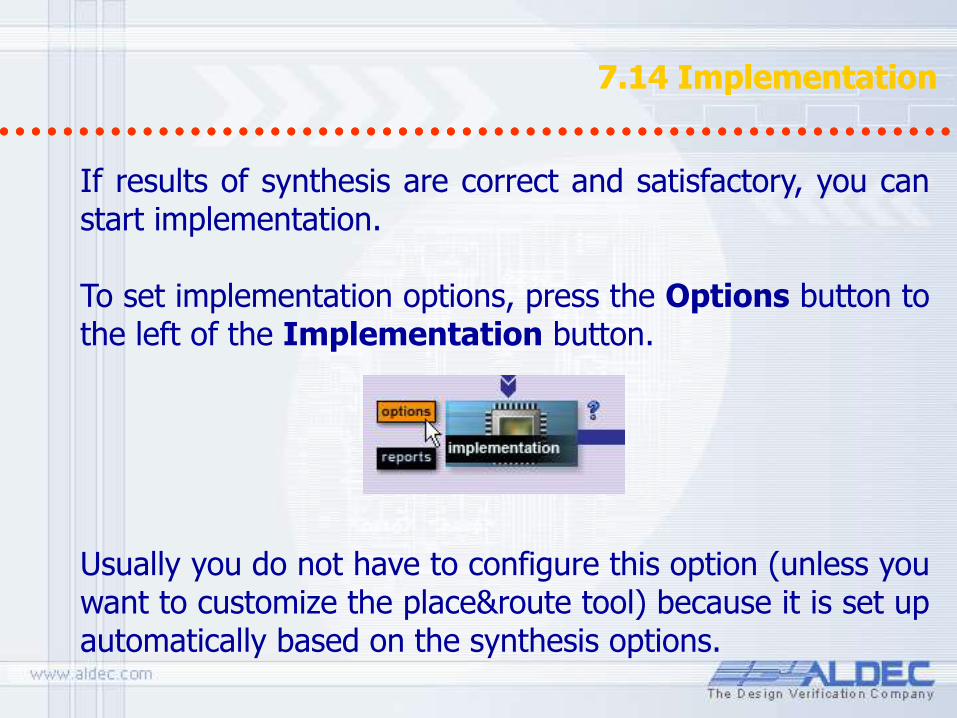
7.14 Implementation 7.14 Implementation
If results of synthesis are correct and satisfactory, you can start implementation. To set implementation options, press the Options button to the left of the Implementation button.
Usually you do not have to configure this option (unless you want to customize the place&route tool) because it is set up automatically based on the synthesis options.

7.15 Implementation 7.15 Implementation
In the Main tab you can select Netlist File to be sent to implementation, change device and mode (Batch/GUI).
Additional tabs allow you to change and customize options available in your implementation tool including the option to include FPGA Pin constraints file.

7.16 Implementation 7.16 Implementation
The new Implementation window will appear. Implementation is working in batch mode so you can use Active-HDL during implementation process.
Now you can press the Implementation button to run the implementation process.
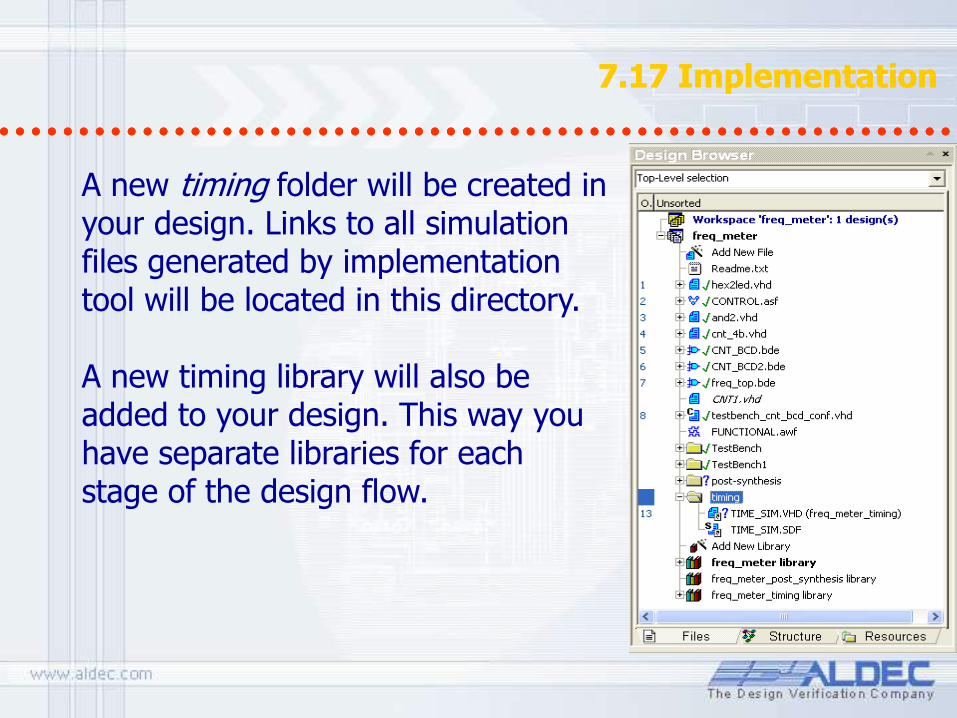
7.17 Implementation 7.17 Implementation
A new timing folder will be created in your design. Links to all simulation files generated by implementation tool will be located in this directory. A new timing library will also be added to your design. This way you have separate libraries for each stage of the design flow.
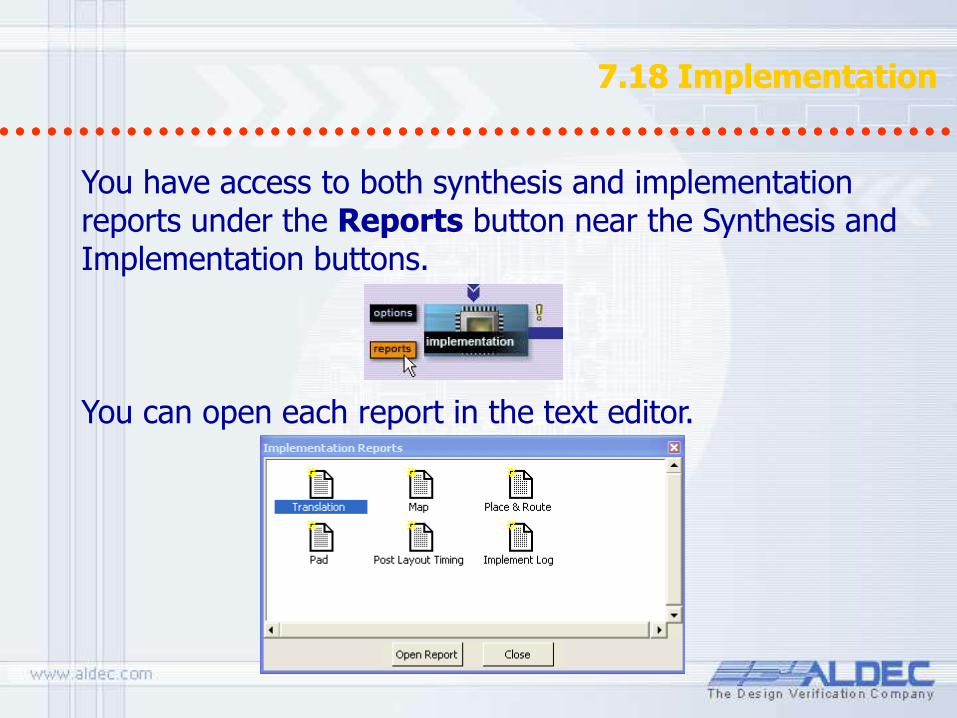
7.18 Implementation 7.18 Implementation
You have access to both synthesis and implementation reports under the Reports button near the Synthesis and Implementation buttons. You can open each report in the text editor.

7.19 Timing Simulation 7.19 Timing Simulation
Now you are ready to perform the timing simulation. Again you are able to use the same testbench as you did for behavioral and post-synthesis simulation. Press the Options button located near the Timing Simulation button. The Timing Simulation Options window will appear.
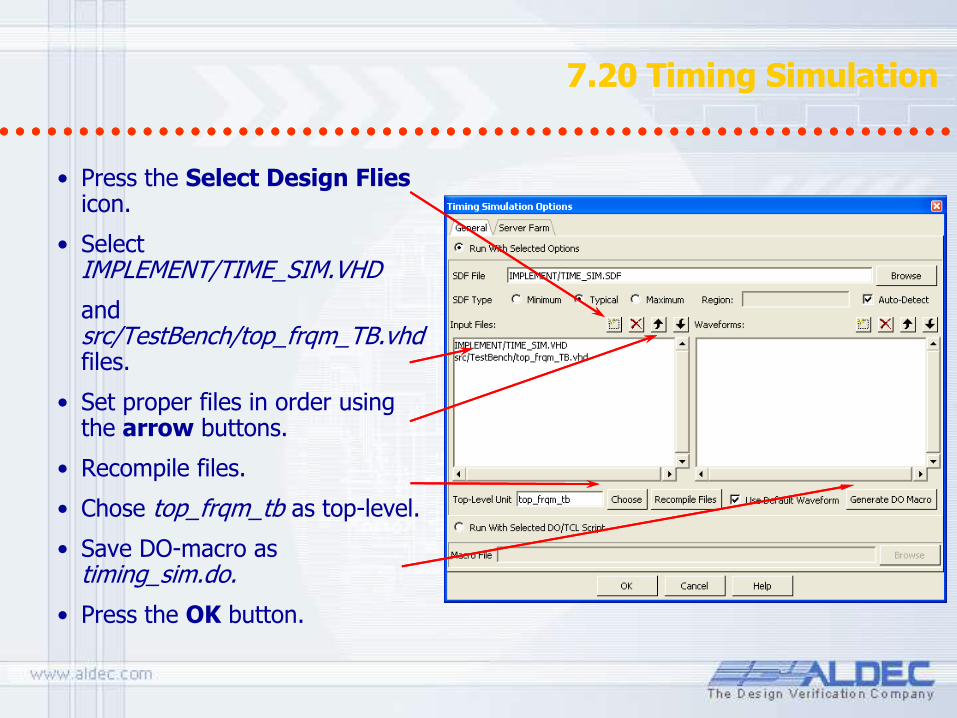
7.20 Timing Simulation 7.20 Timing Simulation
• Press the Select Design Flies icon.
• Select IMPLEMENT/TIME_SIM.VHD
and src/TestBench/top_frqm_TB.vhd files.
• Set proper files in order using the arrow buttons.
• Recompile files.
• Chose top_frqm_tb as top-level.
• Save DO-macro as timing_sim.do.
• Press the OK button.
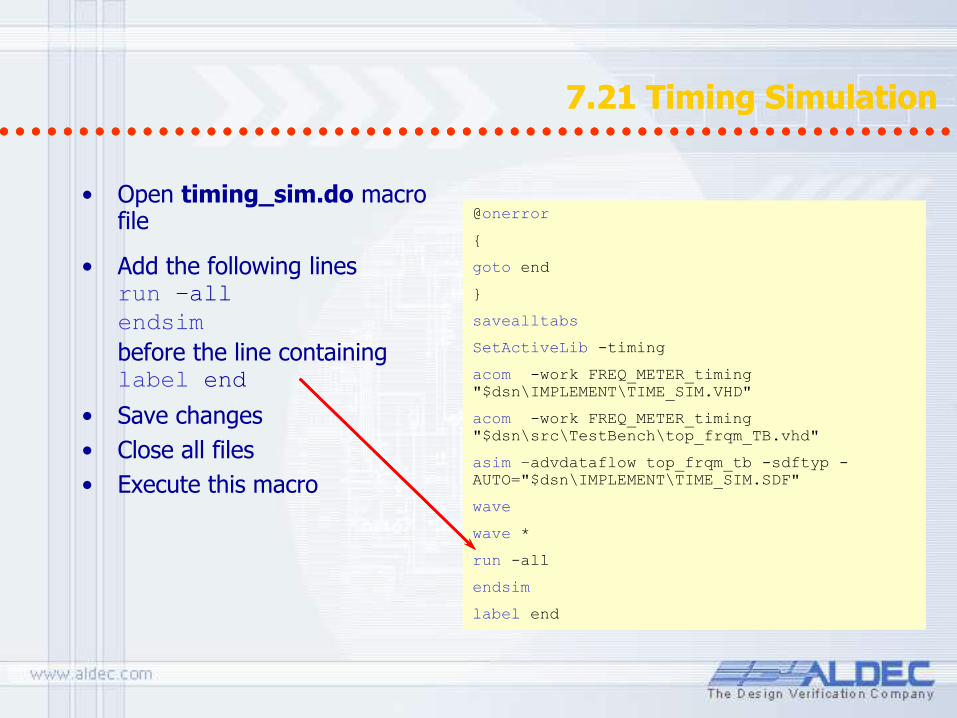
7.21 Timing Simulation 7.21 Timing Simulation
• Open timing_sim.do macro file
• Add the following lines run –all
endsim
before the line containing label end
• Save changes
• Close all files
• Execute this macro
@onerror
{
goto end
}
savealltabs
SetActiveLib -timing
acom -work FREQ_METER_timing
"$dsn\IMPLEMENT\TIME_SIM.VHD"
acom -work FREQ_METER_timing
"$dsn\src\TestBench\top_frqm_TB.vhd"
asim –advdataflow top_frqm_tb -sdftyp -
AUTO="$dsn\IMPLEMENT\TIME_SIM.SDF"
wave
wave *
run -all
endsim
label end
@onerror
{
goto end
}
savealltabs
SetActiveLib -timing
acom -work FREQ_METER_timing
"$dsn\IMPLEMENT\TIME_SIM.VHD"
acom -work FREQ_METER_timing
"$dsn\src\TestBench\top_frqm_TB.vhd"
asim –advdataflow top_frqm_tb -sdftyp -
AUTO="$dsn\IMPLEMENT\TIME_SIM.SDF"
wave
wave *
run -all
endsim
label end
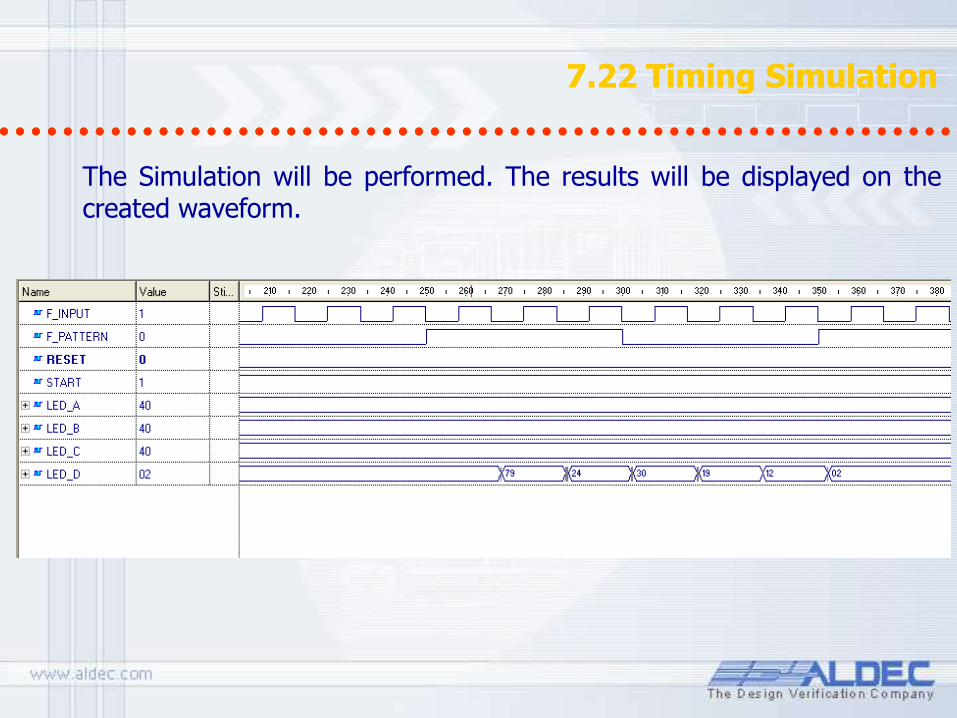
7.22 Timing Simulation 7.22 Timing Simulation
The Simulation will be performed. The results will be displayed on the created waveform.
Using PCB Interface
Part 8
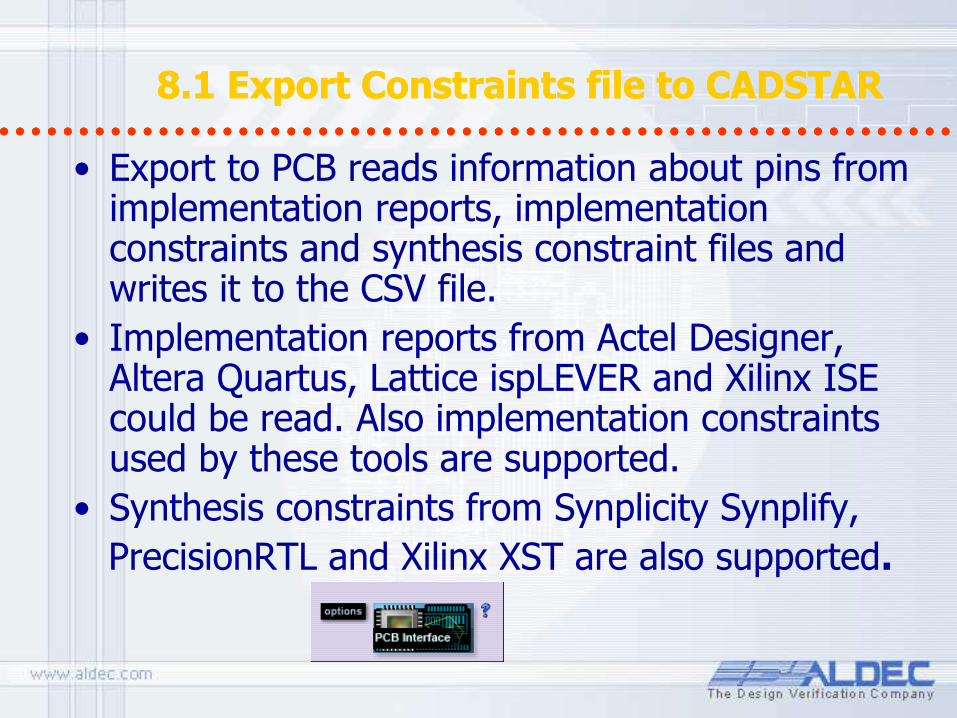
8.1 Export Constraints file to CADSTAR 8.1 Export Constraints file to CADSTAR
• Export to PCB reads information about pins from implementation reports, implementation constraints and synthesis constraint files and writes it to the CSV file.
• Implementation reports from Actel Designer, Altera Quartus, Lattice ispLEVER and Xilinx ISE could be read. Also implementation constraints used by these tools are supported.
• Synthesis constraints from Synplicity Synplify,
PrecisionRTL and Xilinx XST are also supported.
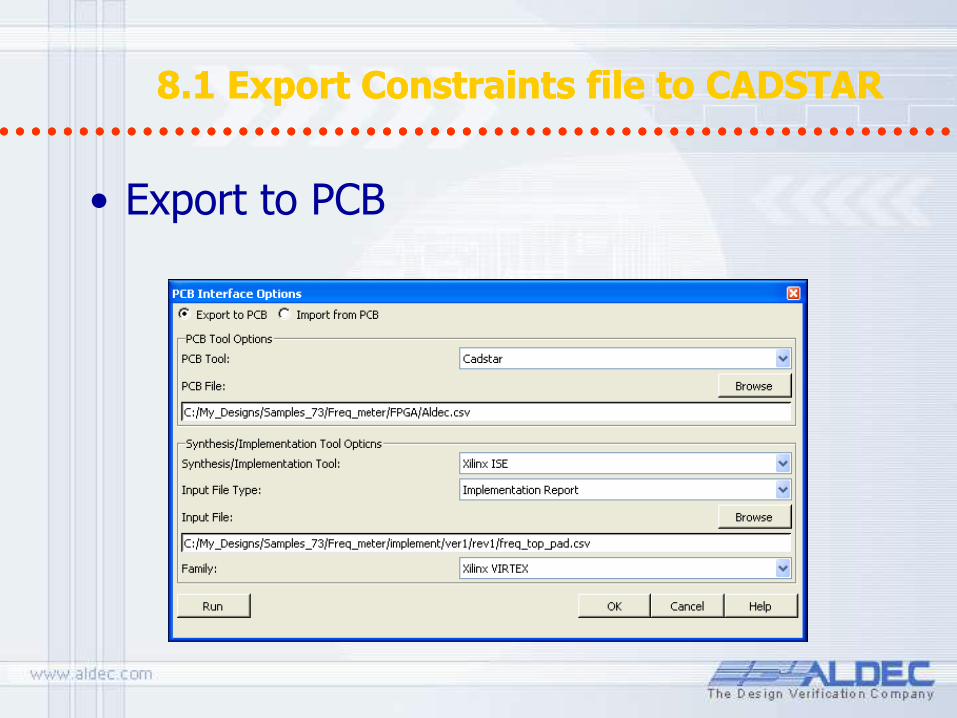
8.1 Export Constraints file to CADSTAR 8.1 Export Constraints file to CADSTAR
• Export to PCB
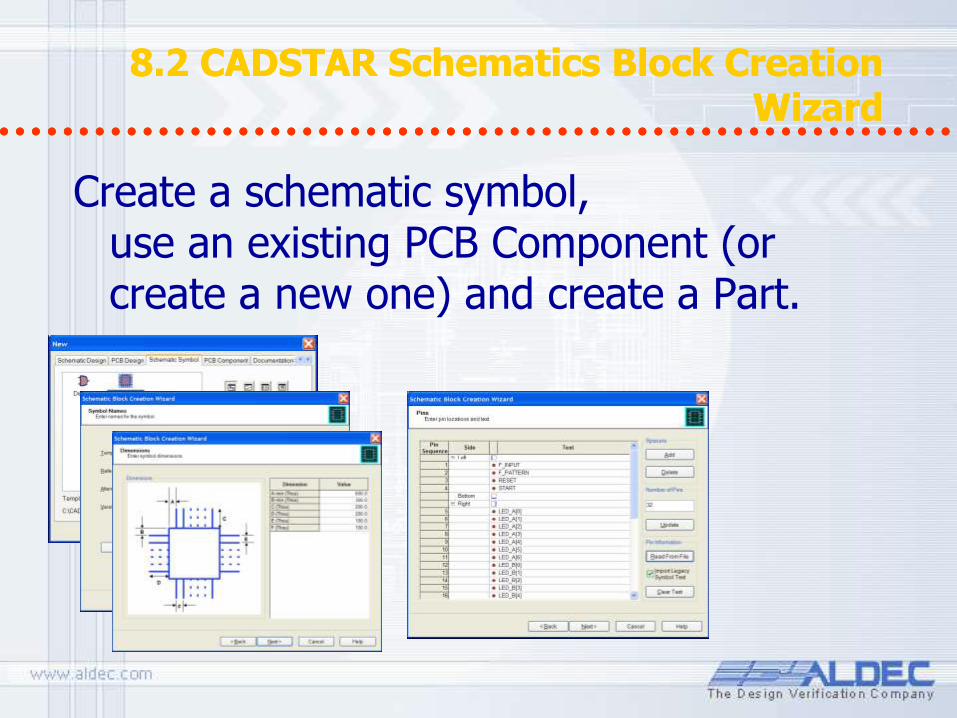
8.2 CADSTAR Schematics Block Creation Wizard
8.2 CADSTAR Schematics Block Creation Wizard
Create a schematic symbol, use an existing PCB Component (or create a new one) and create a Part.
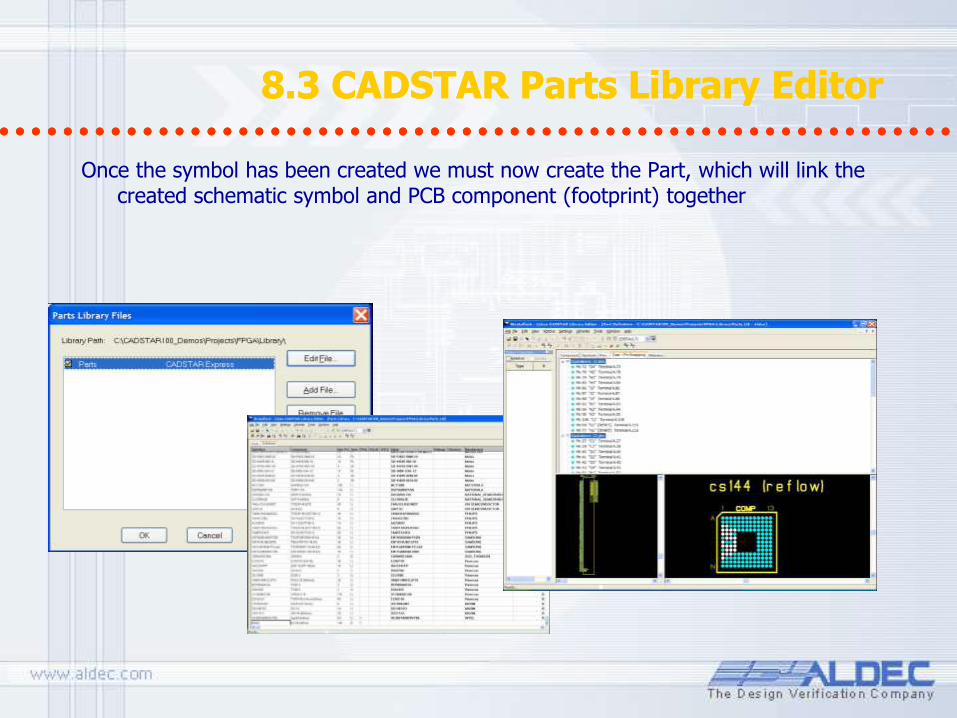
8.3 CADSTAR Parts Library Editor 8.3 CADSTAR Parts Library Editor
Once the symbol has been created we must now create the Part, which will link the created schematic symbol and PCB component (footprint) together
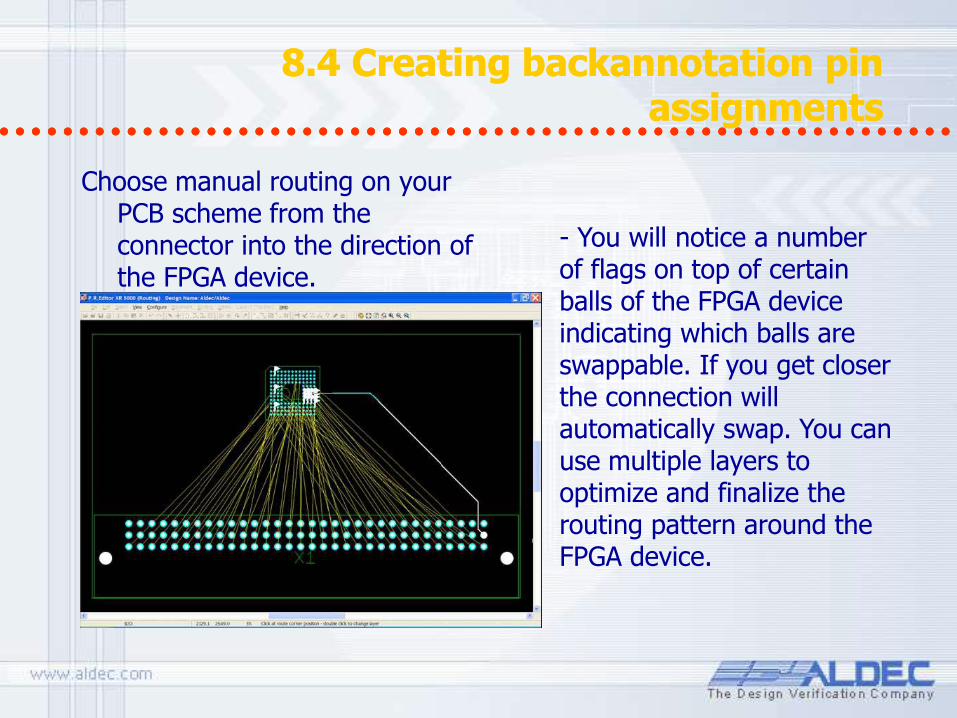
8.4 Creating backannotation pin assignments
8.4 Creating backannotation pin assignments
Choose manual routing on your PCB scheme from the connector into the direction of the FPGA device.
- You will notice a number of flags on top of certain balls of the FPGA device indicating which balls are swappable. If you get closer the connection will automatically swap. You can use multiple layers to optimize and finalize the routing pattern around the FPGA device.
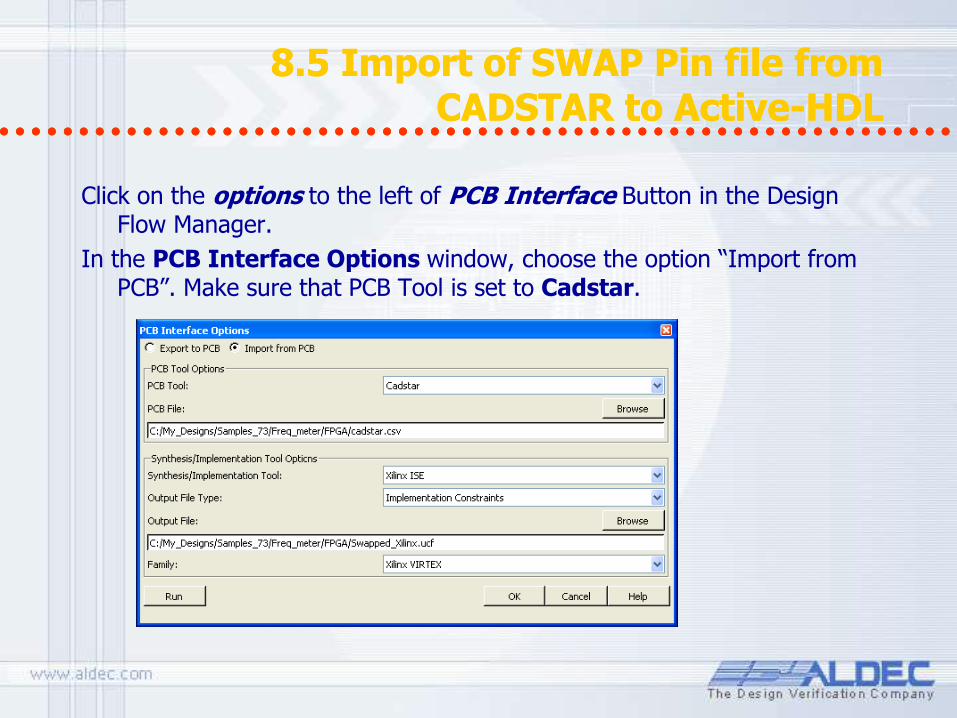
8.5 Import of SWAP Pin file from CADSTAR to Active-HDL
8.5 Import of SWAP Pin file from CADSTAR to Active-HDL
Click on the options to the left of PCB Interface Button in the Design Flow Manager.
In the PCB Interface Options window, choose the option “Import from PCB”. Make sure that PCB Tool is set to Cadstar.

8.6 P&R with updated pin assignment 8.6 P&R with updated pin assignment
1. Open the Implementation options and point new constraint file (ucf)
2. Disable all implementation steps except the P&R
3. Re-run implementation