Embed Size (px)
Citation preview

C5, D5 - Obesity Prevention and C5, D5 - Obesity Prevention and TreatmentTreatment
Laura Brey, MS, Training Director

Ice BreakerIce Breaker
2

ObjectivesObjectives Describe the magnitude of the child and
adolescent obesity epidemic in the US Summarize the national recommendations for child
and adolescent prevention, assessment, and intervention
Utilize the national resources available to providers for assisting in implementation of the national recommendations and guidelines
List the 4 stages of pediatric overweight treatment List for the 4 stages of pediatric blood pressure/
hypertension management Utilize motivational interviewing in the treatment of
overweight children and adolescents
3

Obesity Trends* Among U.S. AdultsObesity Trends* Among U.S. AdultsBRFSS, 1986BRFSS, 1986
(*BMI ≥30, or ~ 30 lbs. overweight for 5’ 4” person))
No Data <10% 10%–14No Data <10% 10%–14%
www.cdc.govwww.cdc.gov 4

Obesity Trends* Among U.S. AdultsObesity Trends* Among U.S. AdultsBRFSS, 1988BRFSS, 1988
(*BMI ≥30, or ~ 30 lbs. overweight for 5’ 4” person(*BMI ≥30, or ~ 30 lbs. overweight for 5’ 4” person))
www.cdc.govwww.cdc.govNo Data <10% 10%–14%
5

Obesity Trends* Among U.S. AdultsObesity Trends* Among U.S. AdultsBRFSS, 1990BRFSS, 1990
(*BMI ≥30, or ~ 30 lbs. overweight for 5’ 4” person)(*BMI ≥30, or ~ 30 lbs. overweight for 5’ 4” person)
No Data <10% 10%–14%No Data <10% 10%–14%
www.cdc.govwww.cdc.gov 6
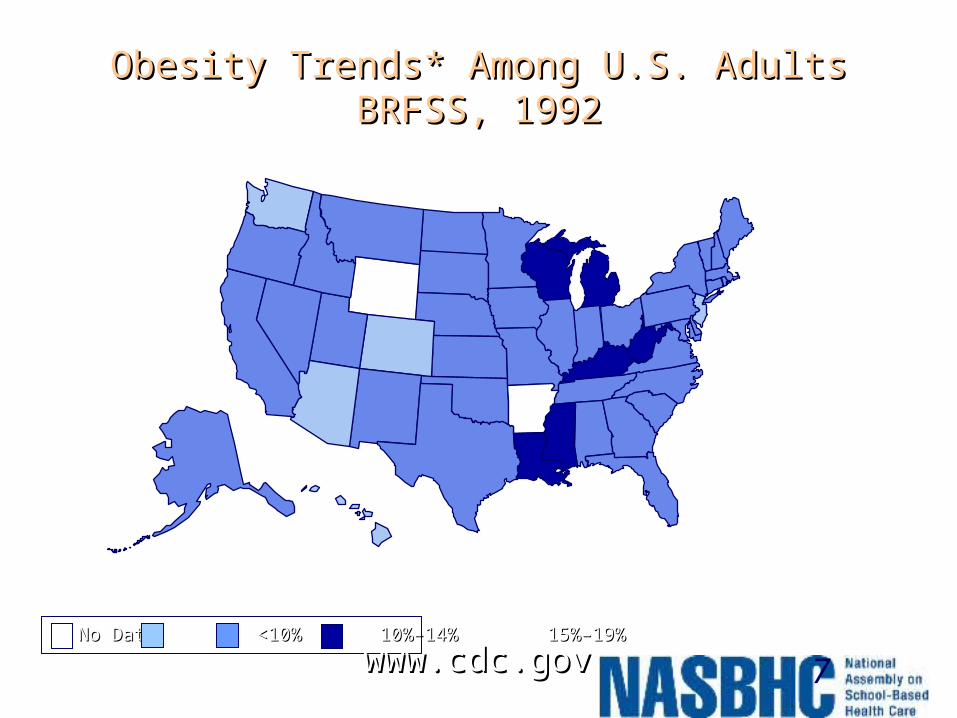
Obesity Trends* Among U.S. AdultsObesity Trends* Among U.S. AdultsBRFSS, 1992BRFSS, 1992
(*BMI ≥30, or ~ 30 lbs. overweight for 5’ 4” person)
No Data <10% 10%–14% 15%–19% No Data <10% 10%–14% 15%–19%
www.cdc.govwww.cdc.gov 7

Obesity Trends* Among U.S. AdultsObesity Trends* Among U.S. AdultsBRFSS, 1994BRFSS, 1994
(*BMI ≥30, or ~ 30 lbs. overweight for 5’ 4” person)(*BMI ≥30, or ~ 30 lbs. overweight for 5’ 4” person)
No Data <10% 10%–14% 15%–19% No Data <10% 10%–14% 15%–19%
www.cdc.govwww.cdc.gov 8

Obesity Trends* Among U.S. AdultsObesity Trends* Among U.S. AdultsBRFSS, 1996BRFSS, 1996
(*BMI ≥30, or ~ 30 lbs. overweight for 5’ 4” person)(*BMI ≥30, or ~ 30 lbs. overweight for 5’ 4” person)
No Data <10% 10%–14% 15%–19No Data <10% 10%–14% 15%–19% %
www.cdc.govwww.cdc.gov 9

Obesity Trends* Among U.S. AdultsObesity Trends* Among U.S. AdultsBRFSS, 1998BRFSS, 1998
(*BMI ≥30, or ~ 30 lbs. overweight for 5’ 4” person(*BMI ≥30, or ~ 30 lbs. overweight for 5’ 4” person)
No Data <10% 10%–14% 15%–19% ≥20%No Data <10% 10%–14% 15%–19% ≥20%
www.cdc.govwww.cdc.gov 10

Obesity Trends* Among U.S. AdultsObesity Trends* Among U.S. AdultsBRFSS, 2000BRFSS, 2000
(*BMI ≥30, or ~ 30 lbs. overweight for 5’ 4” person)
No Data <10% 10%–14% 15%–19% ≥20%No Data <10% 10%–14% 15%–19% ≥20%
www.cdc.govwww.cdc.gov 11
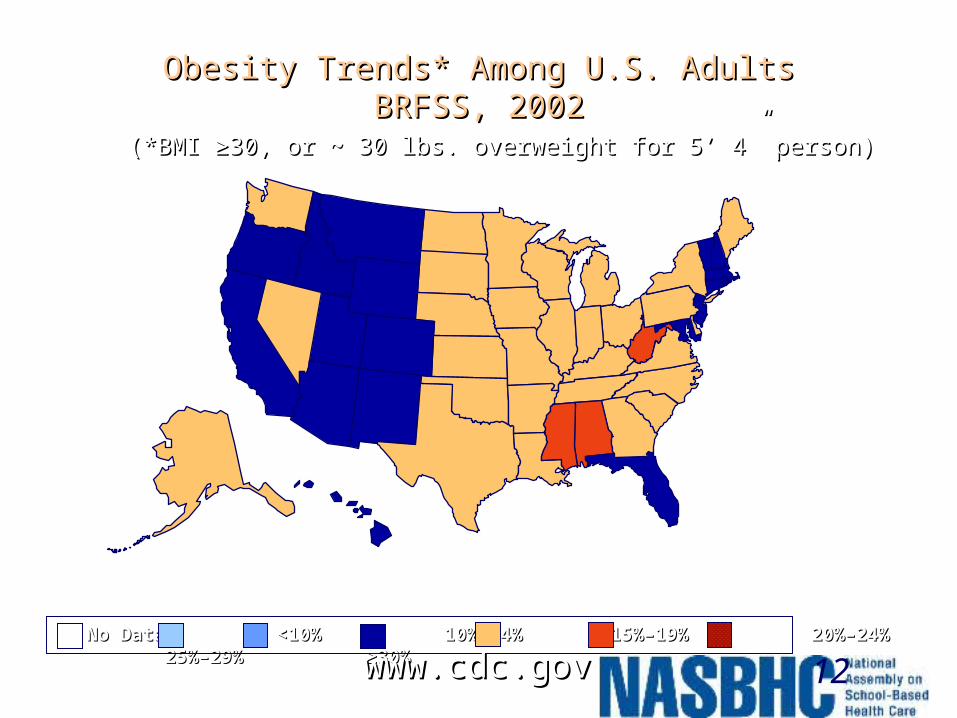
(*BMI ≥30, or ~ 30 lbs. overweight for 5’ 4” person)(*BMI ≥30, or ~ 30 lbs. overweight for 5’ 4” person)
Obesity Trends* Among U.S. AdultsObesity Trends* Among U.S. AdultsBRFSS, 2002BRFSS, 2002
No Data <10% 10%–14%No Data <10% 10%–14% 15%–19% 20%–24% 25%–29% ≥30% 15%–19% 20%–24% 25%–29% ≥30%
www.cdc.govwww.cdc.gov 12

Obesity Trends* Among U.S. AdultsObesity Trends* Among U.S. AdultsBRFSS, 2004BRFSS, 2004
(*BMI ≥30, or ~ 30 lbs. overweight for 5’ 4” person)(*BMI ≥30, or ~ 30 lbs. overweight for 5’ 4” person)
No Data <10% 10%–14%No Data <10% 10%–14% 15%–19% 20%–24% 25%–29% ≥30% 15%–19% 20%–24% 25%–29% ≥30%
www.cdc.govwww.cdc.gov 13
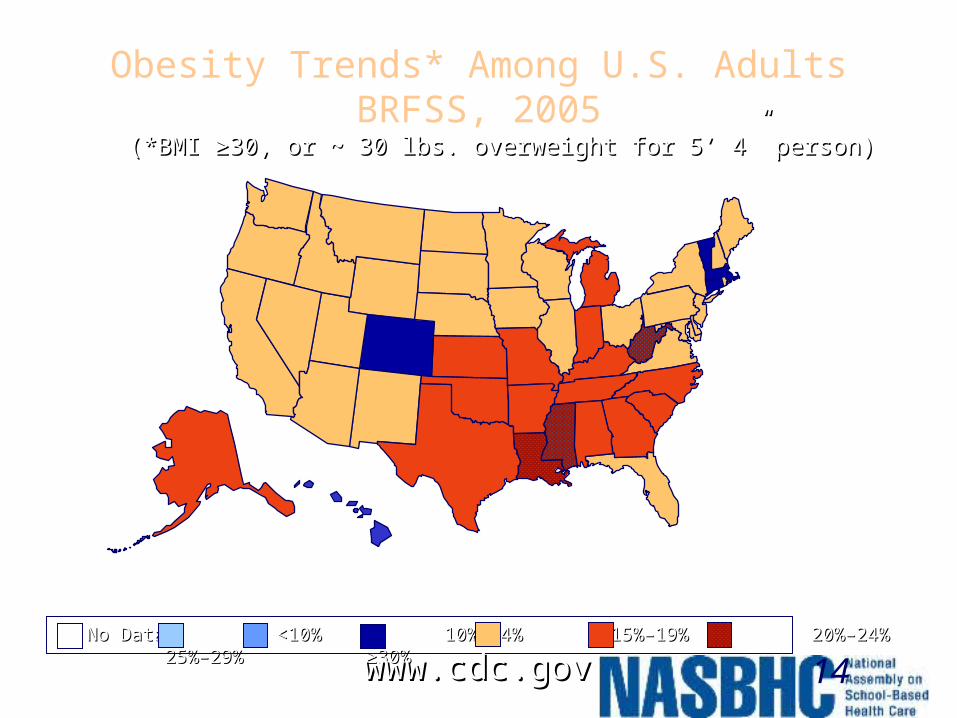
Obesity Trends* Among U.S. AdultsBRFSS, 2005
(*BMI ≥30, or ~ 30 lbs. overweight for 5’ 4” person)(*BMI ≥30, or ~ 30 lbs. overweight for 5’ 4” person)
No Data <10% 10%–14%No Data <10% 10%–14% 15%–19% 20%–24% 25%–29% ≥30% 15%–19% 20%–24% 25%–29% ≥30%
www.cdc.govwww.cdc.gov 14

Obesity Trends* Among U.S. AdultsBRFSS, 2006
(*BMI ≥30, or ~ 30 lbs. overweight for 5’ 4” person)(*BMI ≥30, or ~ 30 lbs. overweight for 5’ 4” person)
No Data <10% 10%–14% 15%–19% 20%–24% 25%–29% ≥30%
www.cdc.govwww.cdc.gov 15
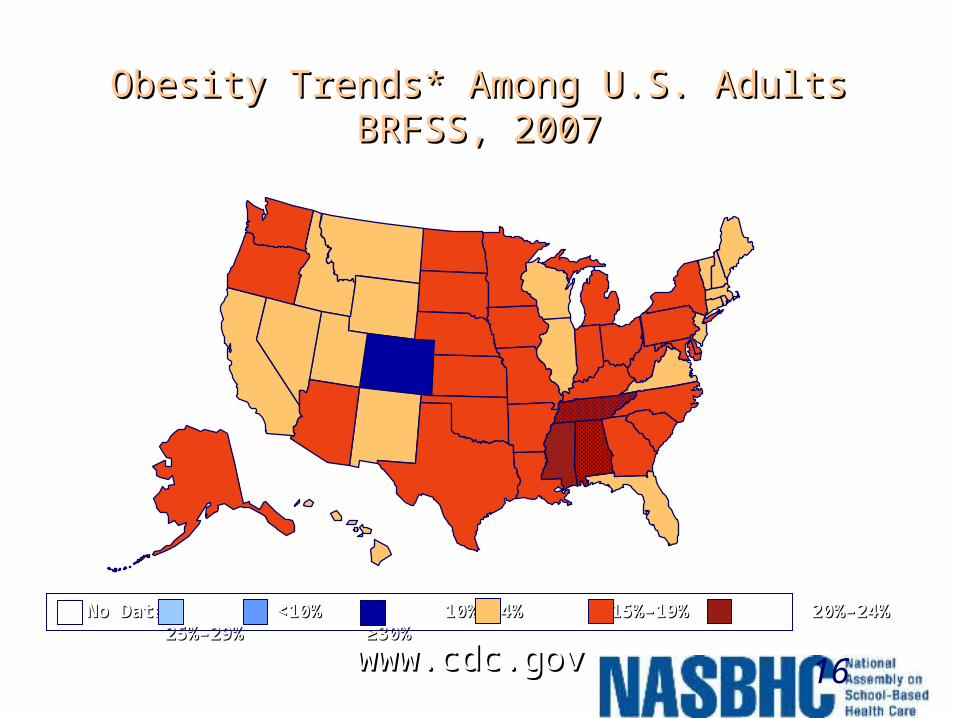
Obesity Trends* Among U.S. AdultsObesity Trends* Among U.S. AdultsBRFSS, 2007BRFSS, 2007
(*BMI ≥30, or ~ 30 lbs. overweight for 5’ 4” person)
No Data <10% 10%–14%No Data <10% 10%–14% 15%–19% 20%–24% 25%–29% ≥30% 15%–19% 20%–24% 25%–29% ≥30%
www.cdc.govwww.cdc.gov 16
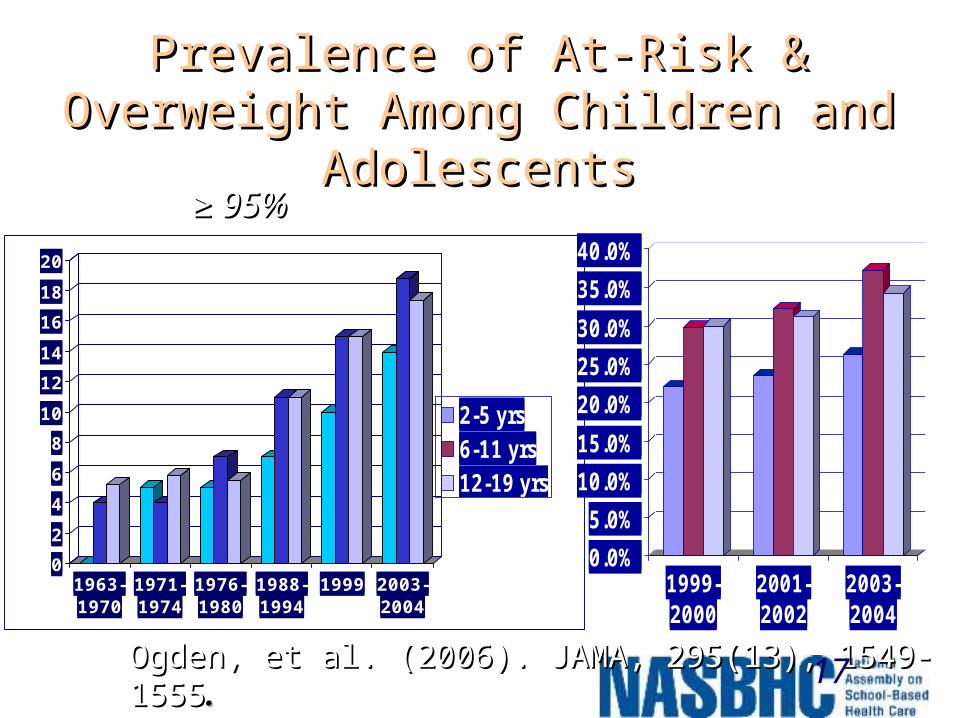
Prevalence of At-Risk & Overweight Prevalence of At-Risk & Overweight Among Children and AdolescentsAmong Children and Adolescents
0
2
4
6
8
10
12
14
16
18
20
1963-1970
1971-1974
1976-1980
1988-1994
1999 2003-2004
Ogden, et al. (2006). JAMA, 295(13), 1549-1555Ogden, et al. (2006). JAMA, 295(13), 1549-1555..
≥ ≥ 95%95%
0.0%
5.0%
10.0%
15.0%
20.0%
25.0%
30.0%
35.0%
40.0%
1999-2000
2001-2002
2003-2004
2-5 yrs6-11 yrs12-19 yrs
≥ 85%
17

Suicide RiskSuicide Risk
Actual and perceived overweight is an important risk factor for suicidal behaviors in youth
Risk factor for suicidality even after controlling for alcohol and illicit drug use
More studies needed to better understand association between perceived and actual overweight and risk for suicide attempts
(Swahn, M., Reynolds, M., Tice, M., et. al, Journal of Adolescent Health, 2009.)
18

Health Risks: Psychosocial
Obese children and their parents rate the quality of life as similar to pediatric cancer patients.
Schimmer, Burwinkle, & Varni, 2003

Ethnic Disparity: At Risk for Overweight or Ethnic Disparity: At Risk for Overweight or Overweight 2003-2004Overweight 2003-2004
0.0%5.0%
10.0%15.0%20.0%25.0%30.0%35.0%40.0%45.0%
2-5yrs
6-11yrs
12-19yrs
Non-HispWhiteNon-HispBlackMexican-American
Ogden, C et al. (2006). JAMA, 295(13), 1549-1555. Ogden, C et al. (2006). JAMA, 295(13), 1549-1555.
0.0%
5.0%
10.0%
15.0%
20.0%
25.0%
2-5 yrs 6-11 yrs 12-19 yrs
≥ 85% ≥ 95%
20

Health Risks of ObesityHealth Risks of Obesity
• Pulmonary– Sleep disorders– Asthma– Obesity-linked
hypoventilations• Neurologic
– Pseudotumor cerebri
21

Health Risks of ObesityHealth Risks of Obesity
• Orthopedic– Slipped capital
epiphysis– Tibia vara (Blount’s
disease)– Tibial torsion– Flat feet – Ankle sprain– Fractures
22

Health Risks of ObesityHealth Risks of Obesity
• Cardiovascular– Hypertension– Dyslidemia– Fatty deposits– Left ventricular
hypertrophy• Other
– Systemic inflammation
23

Health Risks of ObesityHealth Risks of Obesity
• Gastrointestinal Gastrointestinal – CholelithiasisCholelithiasis– Non-alcoholic fatty liver Non-alcoholic fatty liver
diseasedisease– Gastro-esophageal Gastro-esophageal
refluxreflux• EndocrineEndocrine
– Insulin resistance/Type Insulin resistance/Type II DiabetesII Diabetes• Acanthosis nigricansAcanthosis nigricans
– Menstrual abnormalitiesMenstrual abnormalities– Polycystic ovary Polycystic ovary
syndromesyndrome– HypercoricismHypercoricism
24

Significance of ProblemSignificance of Problem
• 80% of obese 80% of obese adolescents will adolescents will become obese become obese adultsadults
25

Significance:Significance: What about their future?What about their future?
Leading Causes of Death in the US
Cause of Death Cause of Death Death rate/100,000Death rate/100,000
Heart disease 258.2Cancer 200.9Cerebrovascular disease 60.9
Minino, Arias, Kochanek, Murphy, & Minino, Arias, Kochanek, Murphy, & Smith 2002Smith 2002
26

Economic ConsequencesEconomic Consequences
• Obesity increased 30% in last 20 years
• Medical expenses for obesity = 9.1% of US medical expenditure
• Direct and indirect costs in US– $78.5 billion in 1998– $92.6 billion in 2002
Finkelstein, Fiebelkorn, & Finkelstein, Fiebelkorn, & Wang(2003). Health Affairs Wang(2003). Health Affairs (Millwood).(Millwood). 27

Etiology: FamilyEtiology: Family
Whitaker, et al.(1997). NEJM, Whitaker, et al.(1997). NEJM, 337(13). 337(13).
Cohort of 854 mostly white subjects followed up to age 21-29 years
Odds Ratio
Maternal obesity 3.6 (2.1-5.9)
Paternal obesity 2.9 (1.7-4.9)
Two obese parents 13.6 ( 3.7-50.4)
28
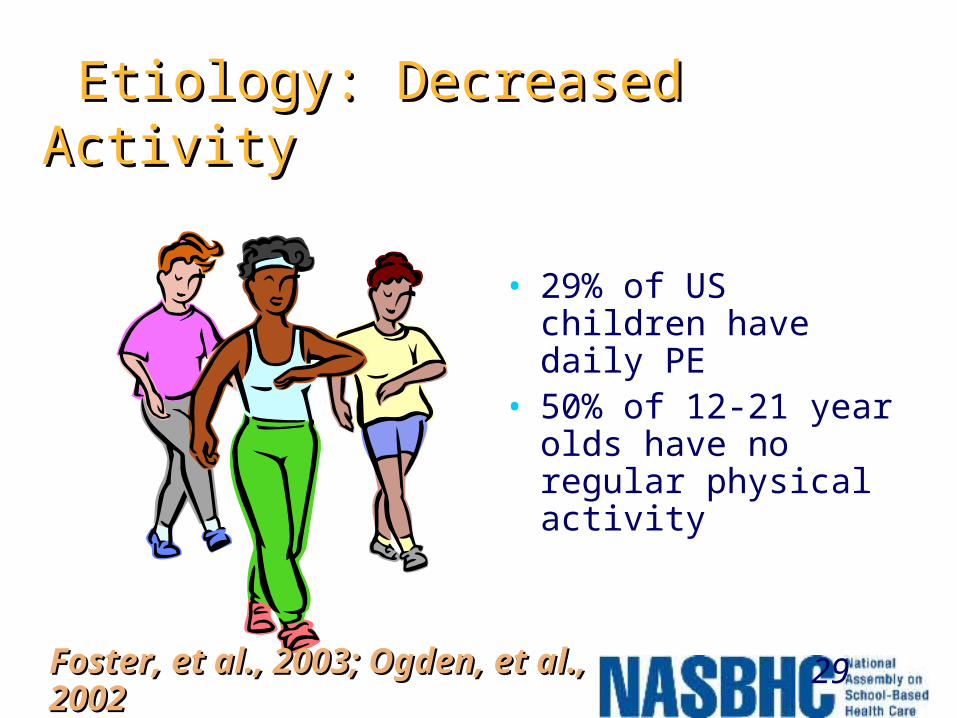
Etiology: Decreased ActivityEtiology: Decreased Activity
• 29% of US children have daily PE
• 50% of 12-21 year olds have no regular physical activity
Foster, et al., 2003; Ogden, et al., Foster, et al., 2003; Ogden, et al., 20022002
29

0 100 200 300 400 500 600 700
Ch.Chip Cookie
Cooked Pasta
Muffin
SteakBagel
Hamburger
Beer
Actual vs. USDA Portion Sizes (%)
Etiology: Portion Size ComparisonsEtiology: Portion Size Comparisons
Young and Nestle (2002) Am J Public Health. 2(2):246-249.
30

Restaurant Mean Size Ratio (US/France)
McDonald’s 1.28 Hard Rock Café 0.92 Pizza Hut 1.32 Haagen Dazs 1.42 Local Chinese 1.72 French Bistro 1.17
Rozin et al., (2003).Physiological Rozin et al., (2003).Physiological Science. 14(5):450-4. Science. 14(5):450-4.
On average, American portions were 25% larger!On average, American portions were 25% larger!
Etiology Portion Sizes: Etiology Portion Sizes: Paris vs. PhiladelphiaParis vs. Philadelphia
31

0
1
2
3
4
5
0-2 >2-3 >3-4 >4-5 >5
TV Viewing (Hrs/day)
Od
d O
verw
eig
ht
Etiology: InactivityEtiology: Inactivity
TV Viewing Predicts Childhood OverweightTV Viewing Predicts Childhood Overweight
Gortmaker et al. (1996) Arch Gortmaker et al. (1996) Arch Pediatr Adolesc Med. 150(4):356-Pediatr Adolesc Med. 150(4):356-
6262. 32

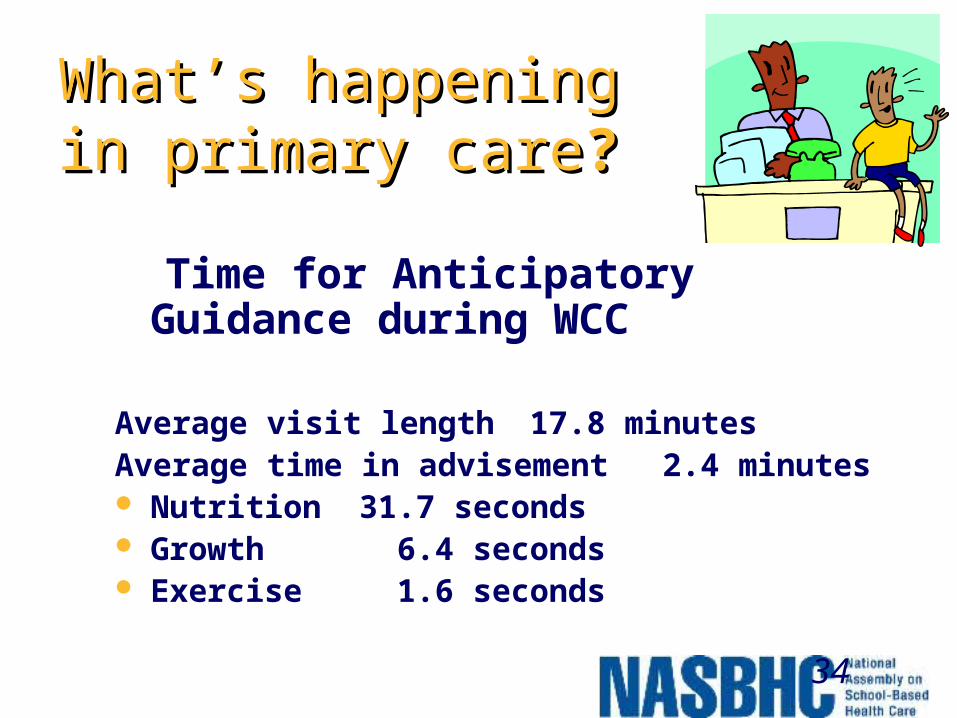
What’s happening in What’s happening in primary careprimary care??
Time for Anticipatory Guidance during WCC Average visit length 17.8 minutesAverage time in advisement 2.4 minutes Nutrition 31.7 seconds Growth 6.4 seconds Exercise 1.6 seconds
Goldstein, Dworkin, & Bernstein, 199934