Embed Size (px)
Citation preview
C3 Evaluation of Cutoff Walls’ Impact on Groundwater Recharge
(Kleinfelder)

72834/DEN9R043 Page 1 of 14 April 21, 2009 Copyright 2009 Kleinfelder West, Inc.
December 19, 2007 Revised April 21, 2009 File No.: 72834 Mr. Timothy Washburn SAFCA 1007 7th Street, 7th Floor Sacramento, CA 95814 Subject: Evaluation of Cutoff Walls Impact on Groundwater Recharge Sacramento River East Levee
Natomas Levee Improvement Project Sacramento and Sutter Counties, California Dear Mr. Washburn: This Memorandum is a revised version of a draft memorandum submitted to you on December 19, 2007. The analyses and data presented in December 2007 memo have been converted to the North American Vertical Datum (NAVD 88). The updated memorandum does not reflect any changes to the proposed remedial design and/or site subsurface characterization model that may have occurred since December 2007. One of the design alternatives considered for remediation of the Sacramento River East Levee from Reach 1 to Reach 20 includes construction of cutoff walls through an adjacent levee. These soil-bentonite (SB) walls are proposed to mitigate underseepage concerns and reduce exit seepage gradients to the acceptable levels, according to the established project criteria. A concern has been raised that the SB walls could potentially impede seepage from the river through the levee foundation and adversely impact groundwater recharge landward of the levee. To address these concerns, we have performed simplified seepage analyses to estimate seepage flow from the river into the aquifer under both existing conditions and with cutoff walls in place. Based on the design recommendations provided by Kleinfelder, the SB wall material should have permeability of about 5x10⁻⁷ cm/sec or lower and will extend at least 5 feet into a fine grained layer(s) underneath the permeable near surface foundation layer. To account for the variability of the slurry and the potential for construction defects, for this study the SB wall was modeled with and average overall permeability of 1x10⁻⁶ cm/sec.

72834/DEN9R043 Page 2 of 14 April 21, 2009 Copyright 2009 Kleinfelder West, Inc.
In addition, we have evaluated potential seepage loss from the proposed Giant Garter Snake ditch. This new 2 mile long unlined canal will be located approximately 500 to 1,000 feet landward of the levee toe and will follow the existing levee alignment between Stations 200+00 and 305+00. In general, the canal will be filled with water during summer month and will be dry during the winter months. During periods of time when the canal is filled with water, seepage through its bottom and side slopes may temporarily affect the groundwater table in the area. General Assumptions
• Idealized stratigraphic models at Stations 27+00, 70+00, 217+00, and 353+00 were selected to represent the range of subsurface conditions along the Sacramento River East Levee. Analyses at Station 217+00 are based on the stratigraphy model developed by URS, as presented in the URS “Draft Subsurface Investigation Report for Sacramento River East Levee, Natomas General Reevaluation Report” prepared for US Army Corps of Engineers, Sacramento District, dated 18 July 2007. Analyses at Stations 27+00, 70+00, and 353+00 are based on the models developed by Kleinfelder as presented in the Draft Basis of Design Report (Kleinfelder, 2007).
• Total length and location of the SB wall were estimated based on the information provided in the Final Draft Basis of Design Report dated December 18, 2007 and in the Alternatives Analysis Report for Seepage Mitigation Revision 1 dated September 24, 2007. Two representative cross-sections (Stations 70+00 and 353+00) have been selected to represent the proposed wall locations and depths.
• Seepage analyses were completed using steady state and transient analysis procedures with the finite element program SEEP/W version 6.17, provided with the GeoStudio 2004 package. These analyses do not account for 3-D effects, such as flow around the cutoff wall.
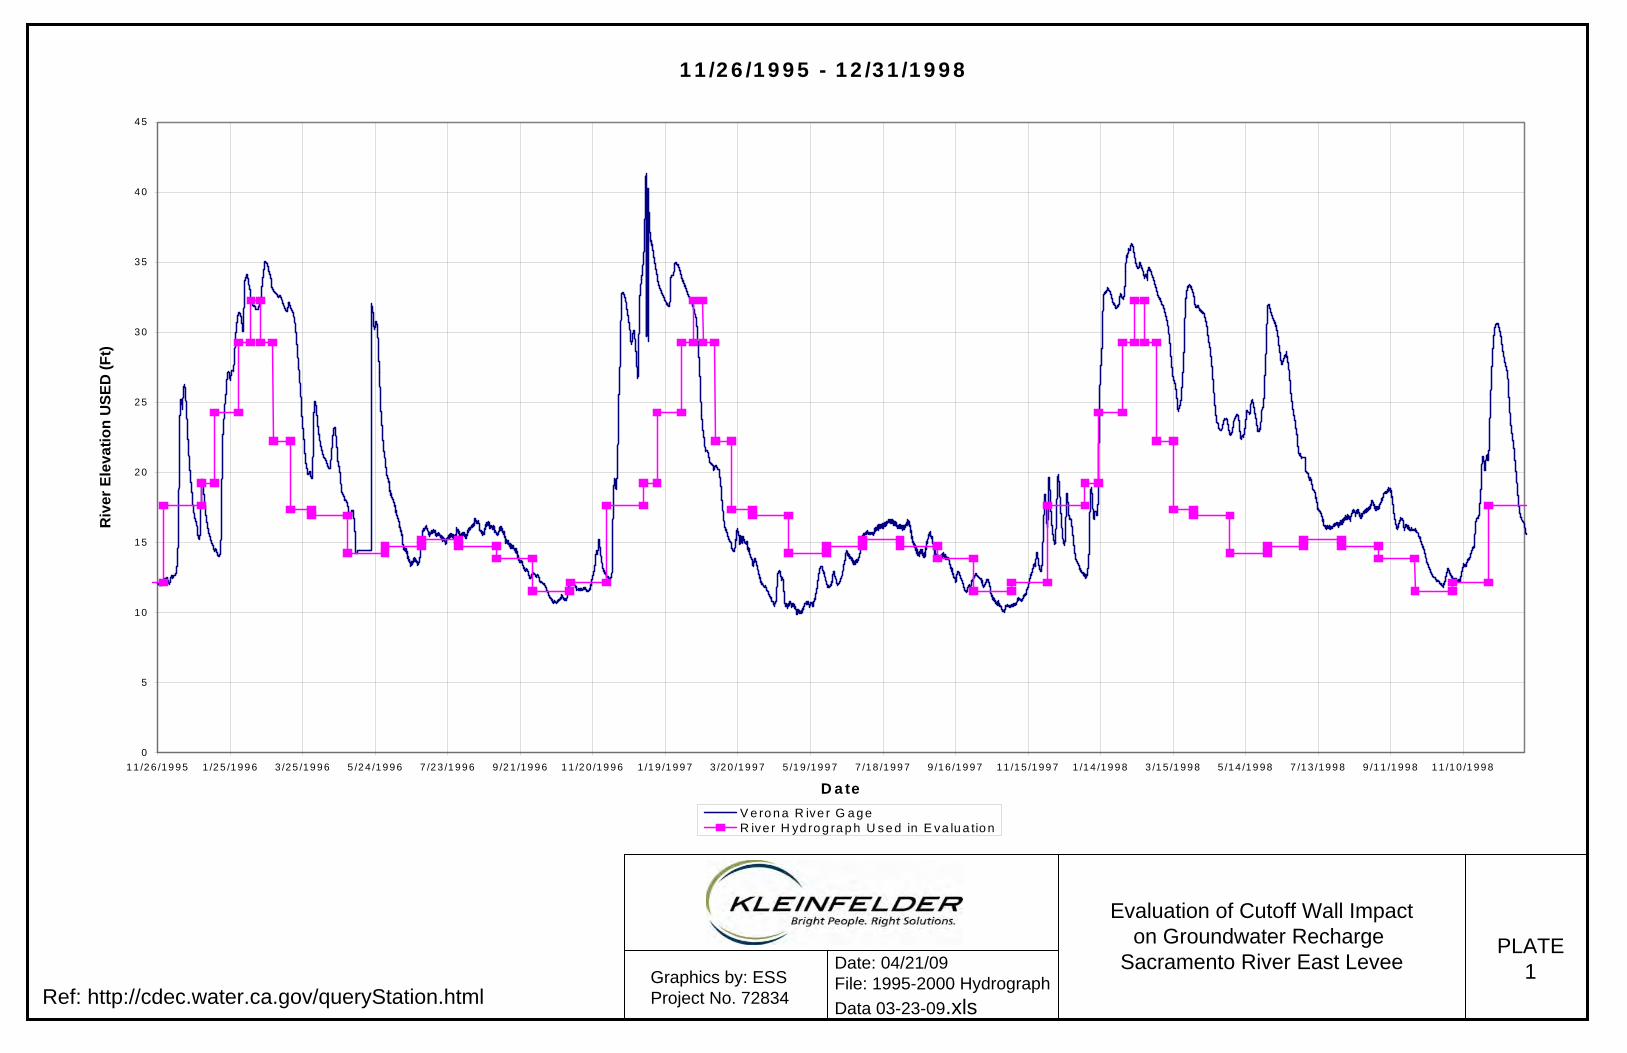
• Typical seasonal river level fluctuations were estimated based on the information provided by the Department of Water Resources (DWR), Division of Flood Management (http://cdec.water.ca.gov/queryStation.html) for the Sacramento River gage at Verona. River stage data recorded at Verona from 11/26/1995 to 11/26/2007 are presented on Plates 1 through 5 and summarized in a tabular form on Plate 6.
• Elevation of the groundwater table landward of the levee was estimated based on piezometer data obtained from “Final Observation Wells Report II: for Reaches North and South of Powerline Road”, prepared by URS.
• All elevations in this memorandum are referenced in North American Vertical Datum (NAVD 88). Elevations referenced in previous reports and other sources of information are based on the National Geodetic Vertical Datum (NGVD 29). To correct from NGVD29 datum to NAVD88 datum elevations should be adjusted by 2.28 feet (NAVD88 = NGVD29 + 2.28 feet).
• River gage data reported by DWR was in the United States Engineering Datum (USED). In the Sacramento and San Joaquin River Basins, the adjustment from USED to NGVD29 varies from gaging station to gaging station within a range of 2.48 feet to 3.2 feet. According to the DWR website, the commonly used adjustment, when not otherwise known, is 3.0 feet. Elevations reported in USED

72834/DEN9R043 Page 3 of 14 April 21, 2009 Copyright 2009 Kleinfelder West, Inc.
are approximately 3 feet higher than elevations reported in NGVD29 and 0.72 feet lower than elevations reported in NAVD88.
• Seepage parameters selected for this study are consistent with those presented in the Basis of Design Report. Permeability values used in each analysis case are shown on plates presenting the results.
• Only recharge due to seepage from the river was considered. The model does not account for flow into or out of the system due to precipitation, pumping or regional groundwater flow that maybe occurring from a direction parallel to the levee axis.
Analysis Approach We have performed simplified seepage analyses to estimate seepage flow from the river into the aquifer under both existing conditions and with cutoff walls in place we have further evaluated the impact of the proposed canal construction and operation based on the methodology outlined below. The following sections of this memo discuss analysis assumptions and details and present the results.
1. Review available historical data and develop representative average river level and ground water table hydrographs.
2. Perform series of steady state seepage analyses at four representative cross-sections to estimate seepage through levee foundation under the existing conditions as a function of river elevation. Boundary conditions used in steady state seepage modeling simulations are defined below. Fixed-head boundary conditions set to the water surface elevations were applied along the boundary nodes of the upstream slope, river bottom, and the upstream (riverside) vertical edge of the model. Nodes along the bottom of the model were modeled as no flow boundary (zero total flux boundary condition). Infinite elements with fixed-head boundary conditions were used along the right vertical edge of the model. The total head along the vertical edge was set to an estimated groundwater table elevation landward of the levee. The landside slope of the levee and the ground surface were modeled as potential seepage exit surfaces.
3. Using results from Steps 1 and 2 for each representative cross-section estimate seepage flow under the existing conditions over a typical year report seepage quantities in acre-feet per year per 1,000 feet of levee.
4. Using results from Step 3 and subsurface condition profiles at the landside toe of the levee, estimate seepage flow under the existing conditions over the entire length of the levee. Report seepage quantities in acre-feet per year.
5. Perform series steady state seepage analyses at two representative cross-sections (Stations 70+00 and 353+00) to estimate seepage through the levee foundation with a cutoff wall in place as a function of river elevation.
6. Using results from Steps 1 and 5, for Stations 70+00 and 353+00 estimate seepage flow with a cutoff wall in place over a typical year. Report seepage quantities in acre-feet per year per 1,000 feet of levee.
7. Using results from Steps 4 and 6, calculate reduction in seepage quantities at Stations 70+00 and 353+00 due to the cutoff wall.

72834/DEN9R043 Page 4 of 14 April 21, 2009 Copyright 2009 Kleinfelder West, Inc.
8. Using river and groundwater table hydrographs from Step 1, perform transient seepage analyses at Station 70+00 with and without the cutoff wall. The purpose of this analysis is two-fold: 1) better understand the impact of the cutoff wall on the recharge of the aquifer throughout the year; 2) verify percent reduction estimated based on the steady state analysis.
9. Using results from Steps 4 and 7 and subsurface condition profiles at the landside toe of the levee, estimate impact of the cutoff wall construction over the entire length of the levee. Report seepage quantities in acre-feet per year.
10. Perform transient analysis at Station 70+00 with the cutoff wall and canal to estimate seepage from the canal during a typical year.

72834/DEN9R043 Page 5 of 14 April 21, 2009 Copyright 2009 Kleinfelder West, Inc.
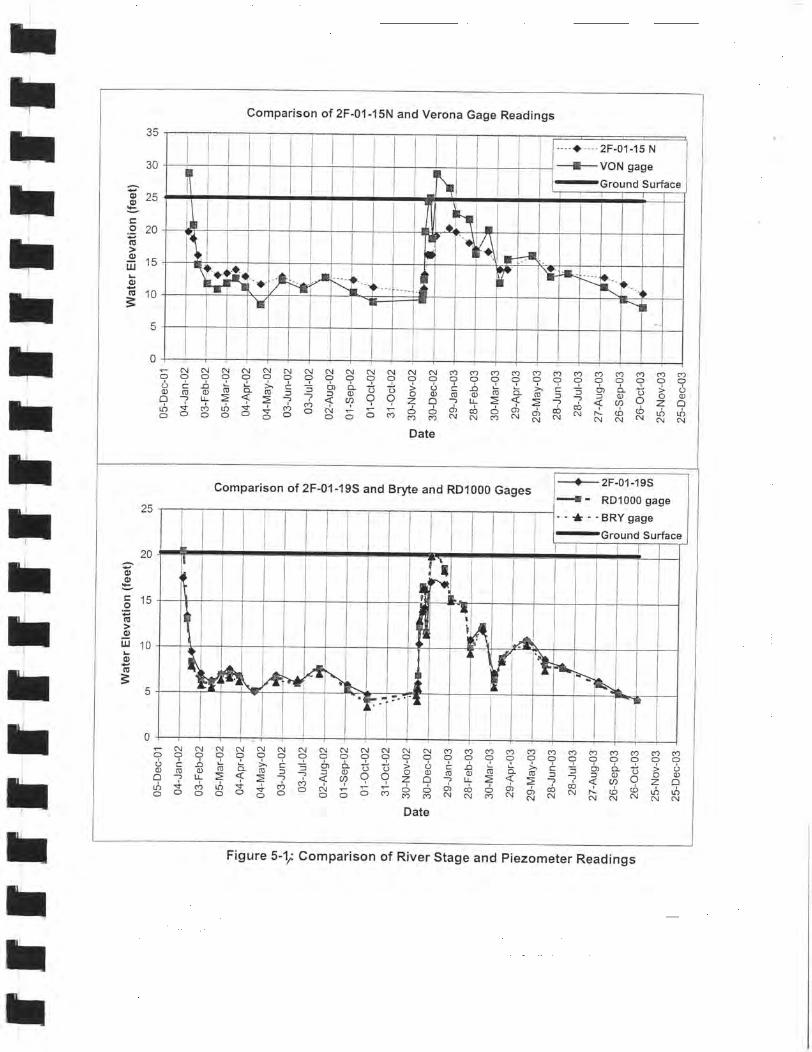
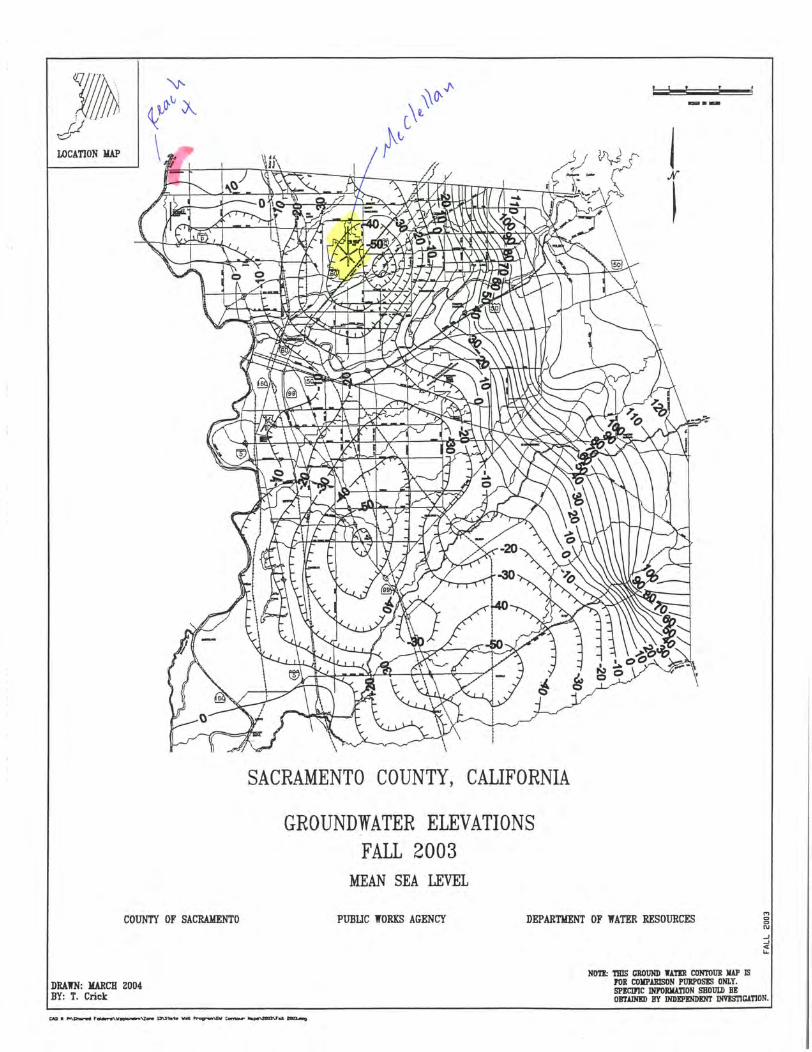
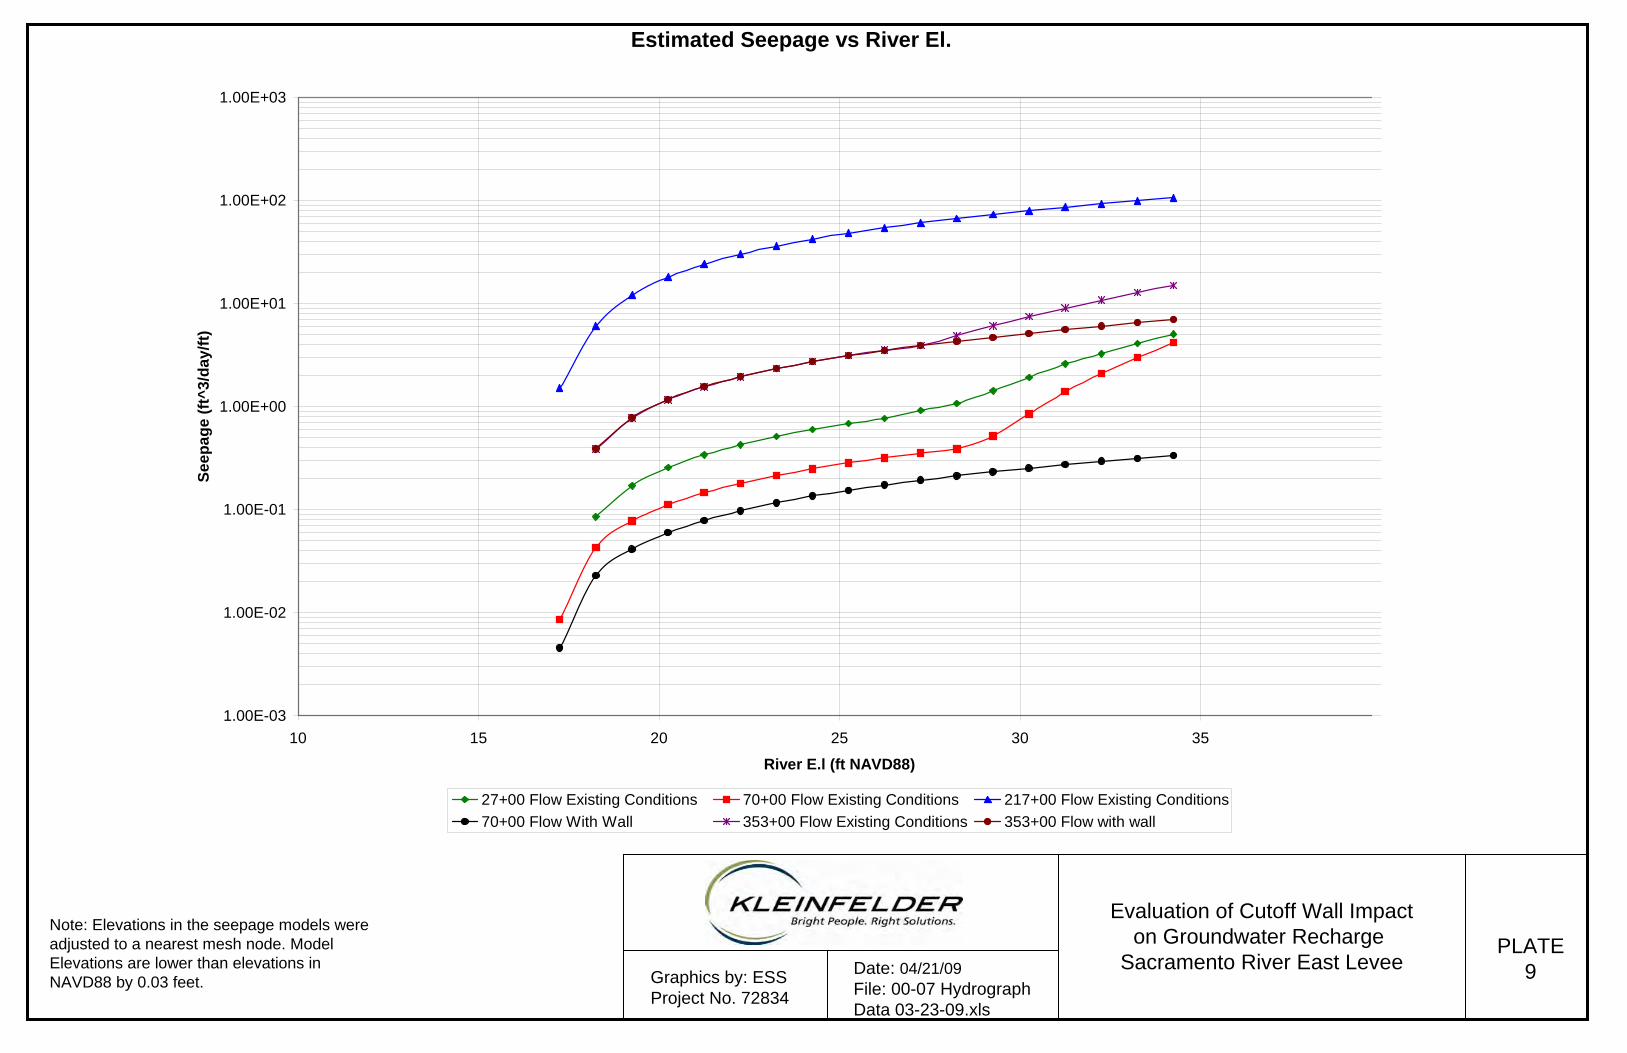
Analysis Results Step1 Historical data recorded by the Sacramento River gage station at Verona from 11/26/1995 to 11/26/2007 are plotted on Plates 1 through 5. We have estimated typical number of days per year that river level remains at a given elevation as presented on Plate 6. The water surface rarely exceeds Elevation 35. The highest water surface included in our analyses was El. 34.25. Based on historical data, the water surface remains at this level approximately 1% of the year. We have also developed a representative (approximately average) annual river hydrograph (river level as a function of time) as shown graphically on Plate 7 and in tabular format on Plate 8. Transient seepage analyses utilized this hydrograph as a time-dependent boundary condition on the river side of the model. Data from piezometer 2F-01-15N located north of Powerline Road indicates that the ground water elevation varies throughout the year from about 5 to 15 feet below ground level (see Attachment A). Based on the piezometer data, we have developed a representative groundwater table hydrograph as shown on Plate 7. Transient seepage analyses utilized this hydrograph as a time-dependent boundary condition on the landside of the model. For our steady state analyses we have set the groundwater table at 7 feet below ground surface, or Elevation 17.25.. Our assumption of Elevation 17.25 is also supported by the groundwater contour maps from County of Sacramento, Department of Water Resources for the spring and fall. The groundwater contours immediately landward of the levee near Reach 4B indicate groundwater elevations greater than 10 feet but generally less than 20. Steps 2 and 3 Estimated seepage quantities through the levee foundation as a function of river elevation under the existing conditions (no cutoff wall) at Stations 27+00, 70+00, 217+00, and 353+00 are summarized in Table 1 and presented on Plate 9. A range of river levels above the ground water table was considered in the analyses. As discussed in Step 1, the highest river level considered was El. 34.25. Seepage analyses results for WSE at Elevation 34.25 are presented graphically on Plates 10 through 13. As shown in Table1 and graphically on Plate 9, the seepage quantities increase two orders of magnitude as the river level rises from Elevation 17.25 to 34.25. These results also indicate Station 217+00 provides the greatest contribution to the aquifer recharge landward of the levee. For a given river stage, estimated seepage quantities at Station 217+00 are approximately 100 times greater than the estimated quantities at the other three stations. Seepage quantities at Stations 27+00, 70+00, and 353+00 are approximately the same order of magnitude. The higher seepage quantities at Station 217+00 are primarily due to the presence of thick highly permeably sand and gravel layers in the foundation.

72834/DEN9R043 Page 6 of 14 April 21, 2009 Copyright 2009 Kleinfelder West, Inc.
The second result worth noting is the aquifer only recharges when the river level is above the groundwater elevation. When the river elevation is below the groundwater table (Elevation 17.25), the direction of the seepage flow in the model is reversed, indicating flow out of the aquifer.
Table 1 Estimated Seepage Quantities Versus River Stage
Existing Conditions
Model Elevation
27+00 Flow Existing
Conditions
70+00 Flow Existing
Conditions
217+00 Flow Existing
Conditions
353+00 Flow Existing conditions
17.25 -4.98E-11 8.61E-03 1.51E+00 -3.69E-12 18.25 8.53E-02 4.31E-02 6.06E+00 3.88E-01 19.25 1.71E-01 7.75E-02 1.21E+01 7.78E-01 20.25 2.56E-01 1.12E-01 1.82E+01 1.17E+00 21.25 3.41E-01 1.46E-01 2.42E+01 1.56E+00 22.25 4.26E-01 1.81E-01 3.03E+01 1.95E+00 23.25 5.13E-01 2.15E-01 3.63E+01 2.35E+00 24.25 5.99E-01 2.50E-01 4.24E+01 2.74E+00 25.25 6.84E-01 2.85E-01 4.85E+01 3.14E+00 26.25 7.70E-01 3.19E-01 5.45E+01 3.53E+00 27.25 9.24E-01 3.54E-01 6.07E+01 3.92E+00 28.25 1.08E+00 3.89E-01 6.68E+01 4.87E+00 29.25 1.43E+00 5.17E-01 7.33E+01 6.09E+00 30.25 1.93E+00 8.47E-01 7.97E+01 7.47E+00 31.25 2.60E+00 1.40E+00 8.62E+01 9.05E+00 32.25 3.26E+00 2.10E+00 9.28E+01 1.08E+01 33.25 4.08E+00 2.99E+00 9.95E+01 1.28E+01 34.25 5.07E+00 4.21E+00 1.06E+02 1.51E+01
Total Flux Acre
ft/yr/1000ft 3.9 2.6 129.4 13.2
Notes: 1. All fluxes in ft^3/day/ft unless noted otherwise.
2. Elevations in the seepage models were adjusted to a nearest mesh node. Model Elevations are lower than elevations in NAVD88 by 0.03 feet.
Step 4 The total length of the Sacramento River East Levee between Station 0+00 (Reach 1) and Station 960+00 (Reach 20) is approximately 18.1 miles. The general profile for the subsurface conditions along the levee crown/landside toe is provided in Attachment B. In general, the subsurface conditions profile is comprised of five units. These strata listed in order of increasing depth include: existing levee, surficial clay/fine grain soil blanket, silty and clayey sand layer, clean sand layer, gravel layer, and a lower clay/lower permeability soil region. As shown in Table 2, conditions at Station 27+00 are representative of approximately 1.8 miles or 11 percent of the entire length of the Sacramento River East Levee. Conditions at Station 70+00 are representative of

72834/DEN9R043 Page 7 of 14 April 21, 2009 Copyright 2009 Kleinfelder West, Inc.
approximately 4 miles or 23 percent of the entire length of the Sacramento River East Levee. Conditions at Station 217+00 are representative of approximately 7.6 miles or 42 percent of the entire length of the Sacramento River East Levee. Conditions at Station 353+00 are representative of approximately 4.7 miles or 24 percent of the entire length of the Sacramento River East Levee. Accordingly, the total estimated flow from the Sacramento River through the levee foundation between Station 0+00 and Station 960+00 is approximately 5,650 acre-feet per year.
Table 2
Estimated Seepage Quantities, Entire East Levee Existing Conditions
Reach Stations Representative
Station Length of Stretch (ft)
Seepage without Cutoff Wall (ac-
ft/yr) 1 00+00 to 48+00 27+00 4,800 19 2 48+00 to 100+00 70+00 5,200 14 3 100+00 to 110+00 70+00 1,000 3
4a 110+00 to 120+00 70+00 1,000 3 4a 120+00 to 190+00 353+00 7,000 95 4b 190+00 to 228+00 217+00 3,800 490 5a 228+00 to 263+00 70+00 3,500 10 5b 263+00 to 280+00 27+00 1,700 6 6 280+00 to 330+00 217+00 5,000 650 7 330+00 to 345+00 353+00 1,500 20 7 345+00 to 362+00 353+00 1,700 23 8 362+00 to 402+00 353+00 4,000 55
9a 402+00 to 430+00 353+00 2,800 38 9b 430+00 to 468+10 353+00 3,810 50 10 468+10 to 495+00 217+00 2,690 350 11 495+00 to 635+00 217+00 14,000 1810 12 635+00 to 640+00 217+00 500 65 12 640+00 to 667+00 70+00 2,700 7 13 667+00 to 700+00 353+00 3,300 45 14 700+00 to 732+00 70+00 3,200 8 15 732+00 to 780+00 217+00 4,800 620 16 780+00 to 832+00 217+00 5,200 675 17 832+00 to 842+00 217+00 1,000 130 18 842+00 to 857+00 217+00 1,500 195
19a 857+00 to 875+00 217+00 1,800 235 19b 875+00 to 925+00 70+00 5,000 15 20a 925+00 to 925+50 27+00 50 .2 20b 925+50 to 960+00 27+00 3,450 13
Total Seepage ac-ft/year 5,650 Steps 5 and 6 Cutoff soil-bentonite (SB) walls are currently proposed at thirteen locations along the east levee, as summarized in Table 3. The total length of the proposed SB walls is

72834/DEN9R043 Page 8 of 14 April 21, 2009 Copyright 2009 Kleinfelder West, Inc.
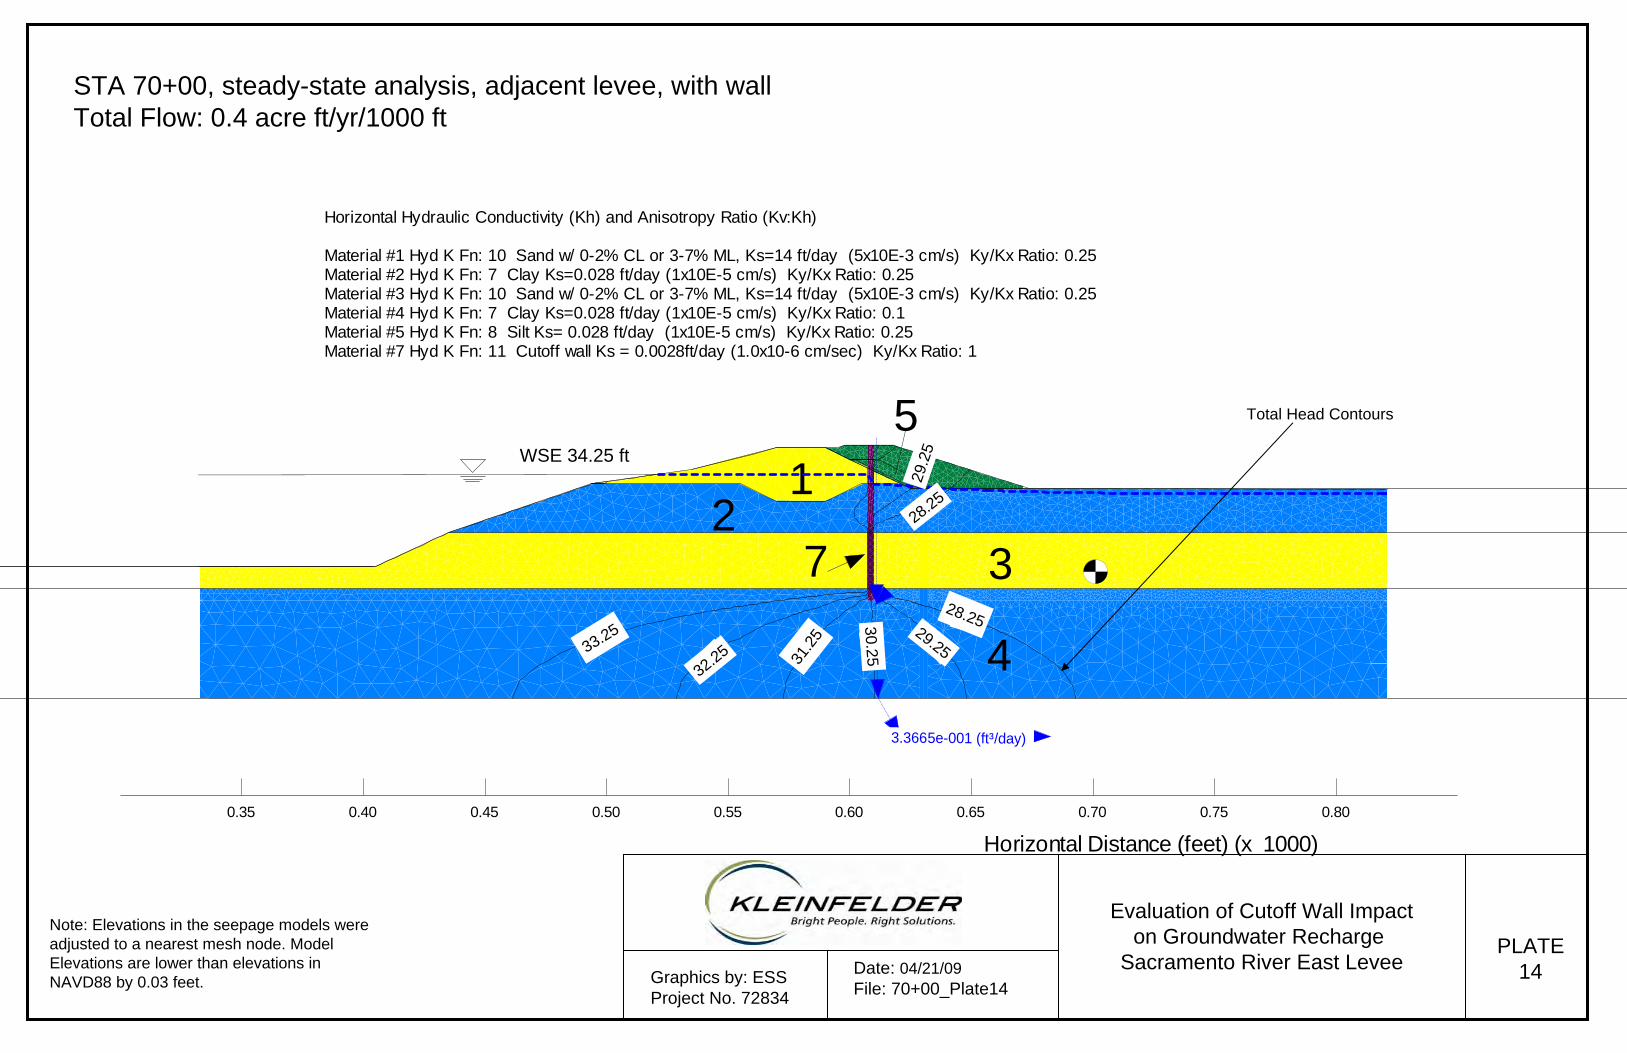
approximately 8 miles. The proposed depth of the wall varies from location to location based on the subsurface conditions and the required underseepage mitigation. Idealized cross-sections at Stations 70+00 and 353+00 were selected to represent the range of conditions at the proposed cutoff wall locations. At Station 70+00 where the surficial clay blanket is relatively thin and the underlying permeable layer is relatively shallow, the wall would completely penetrate the sand layer and key into the clay layer beneath. On the other hand at Station 353+00, only a partially penetrating cutoff wall is required. Proposed depth of the wall relative to the estimated bottom of the permeable layer at each location is presented in Table 3.
Table 3
Proposed Cutoff Wall Locations
Reach Stations Length
of Stretch
Proposed depth of
wall, Elevation
Depth of Sand layer,
Elevation
Representative station for wall
impact evaluation
2 48+00 to 100+00 5,200 -25 -25 70+00 3 100+00 to110+00 1,000 -25 -10 70+00 6 280+00 to 330+00 5,000 -70 -65 70+00 7 330+00 to 362+00 3,200 -60 -50 70+00 8 362+00 to 402+00 4,000 -60 -50 70+00 9 430+00 to 468+00 3,800 -70 -45 70+00
10 468+10 to 495+00 2,690 -25 -70 353+00 13 667+00 to 700+00 3,300 -20 -100 353+00 15 732+00 to 780+00 4,800 -10 -100 353+00 17 832+00 to 842+00 1,000 -25 -100 353+00 18 842+00 to 857+00 1,500 -25 -100 353+00
19a 857+00 to 875+00 1,800 -25 -100 353+00 19b 875+00 to 925+00 5,000 -25 -40 353+00
We have performed a series of steady state seepage analyses to estimate seepage quantities through the levee foundation with an SB wall in place. The analyses results for Stations 70+00 and 353+00 with the river WSE at Elevation 34.25 are presented on Plates 14 and 15. Total flow through a flux section located immediately landward of the SB wall was calculated with and without the cutoff wall in place. The two results were compared to estimate the groundwater recharge effects of the cutoff wall. Seepage quantities as a function of river stage are summarized in Table 4.

72834/DEN9R043 Page 9 of 14 April 21, 2009 Copyright 2009 Kleinfelder West, Inc.
Table 4
Estimated Seepage Quantities versus River Stage With and Without Cutoff Wall
River
Elevation (ft)
70+00 Flow Existing
Conditions
70+00 Flow With Cutoff Wall
353+00 Flow Existing
Conditions
353+00 Flow With Cutoff Wall
17.25 8.61E-03 4.56E-03 -3.69E-12 -5.97E-13 18.25 4.31E-02 2.29E-02 3.89E-01 3.90E-01 19.25 7.75E-02 4.14E-02 7.78E-01 7.80E-01 20.25 1.12E-01 6.00E-02 1.17E+00 1.17E+00 21.25 1.46E-01 7.87E-02 1.56E+00 1.56E+00 22.25 1.81E-01 9.75E-02 1.96E+00 1.96E+00 23.25 2.15E-01 1.16E-01 2.35E+00 2.35E+00

72834/DEN9R043 Page 10 of 14 April 21, 2009 Copyright 2009 Kleinfelder West, Inc.
Table 4 (Cont.)
River Elevation
(ft)
70+00 Flow Existing
Conditions
70+00 Flow With Cutoff
Wall
353+00 Flow Existing
Conditions 353+00 Flow
With Cutoff Wall 24.25 2.50E-01 1.36E-01 2.74E+00 2.74E+00 25.25 2.85E-01 1.55E-01 3.14E+00 3.13E+00 26.25 3.19E-01 1.74E-01 3.53E+00 3.52E+00 27.25 3.54E-01 1.93E-01 3.92E+00 3.92E+00 28.25 3.89E-01 2.13E-01 4.87E+00 4.31E+00 29.25 5.17E-01 2.33E-01 6.09E+00 4.70E+00 30.25 8.47E-01 2.54E-01 7.47E+00 5.12E+00 31.25 1.40E+00 2.75E-01 9.05E+00 5.59E+00 32.25 2.10E+00 2.95E-01 1.08E+01 6.06E+00 33.25 2.99E+00 3.16E-01 1.28E+01 6.54E+00 34.25 4.21E+00 3.37E-01 1.51E+01 7.02E+00
Total Flux Acre
ft/yr/1000ft 2.6 0.4 13.4 8.4
Notes: 1. All fluxes in ft^3/day/ft unless noted otherwise.
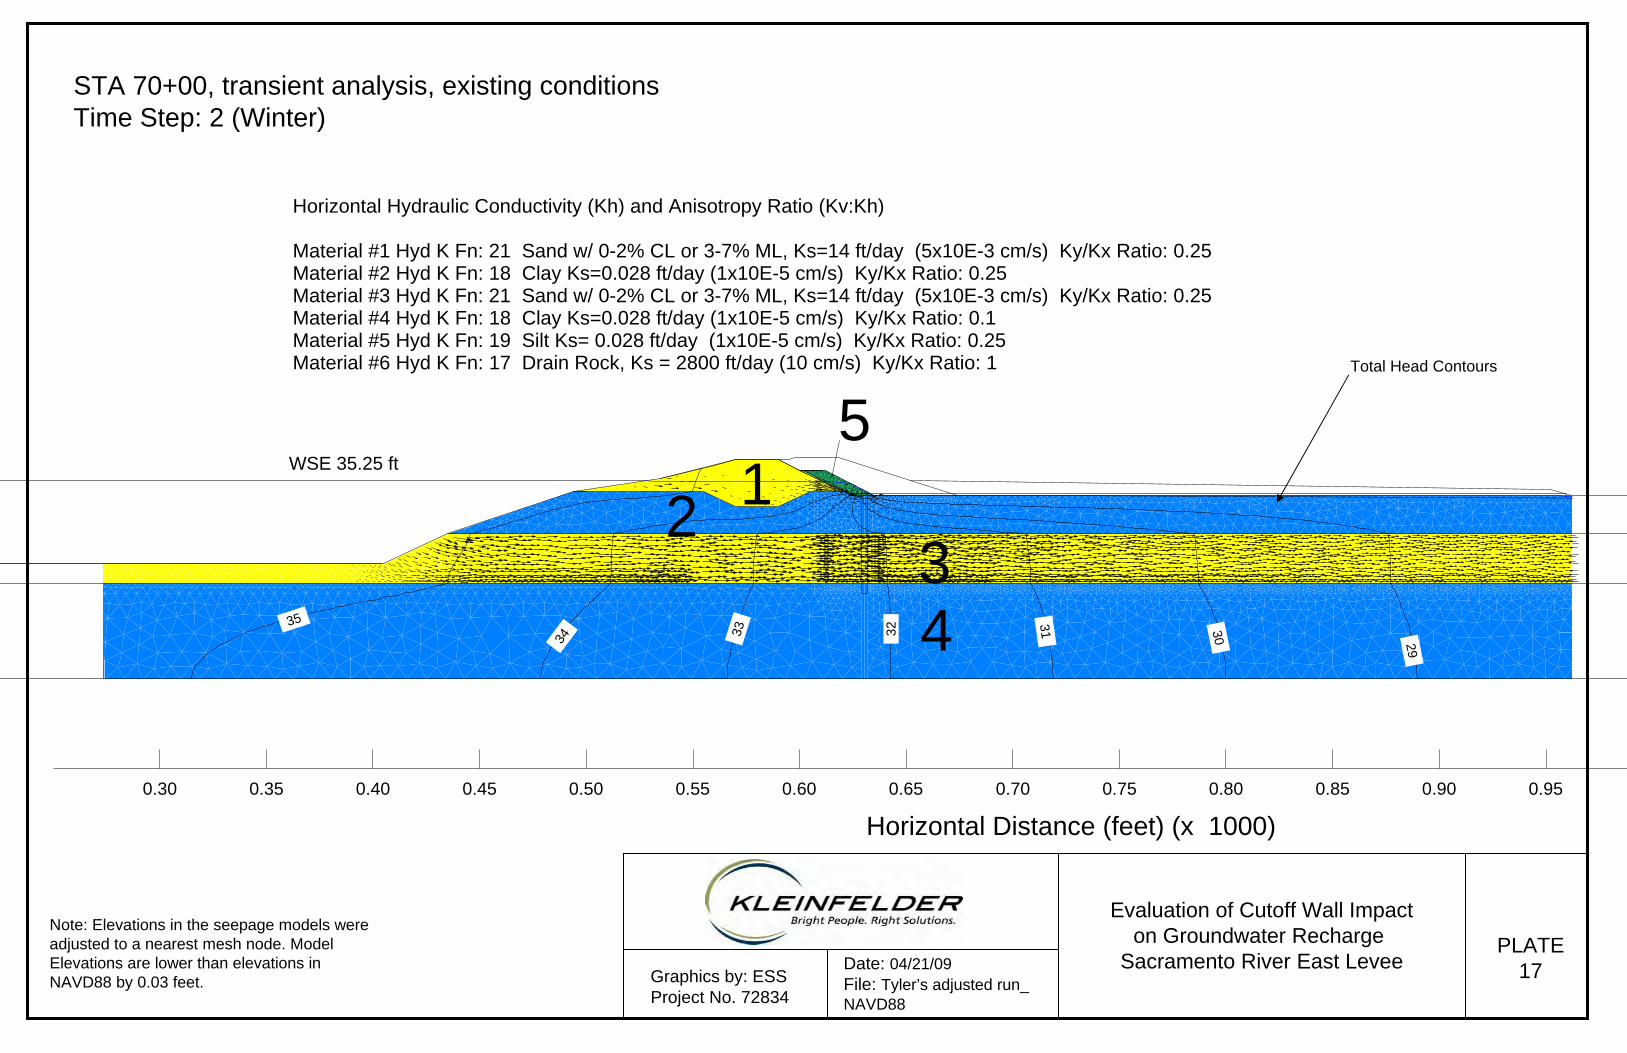
2. Elevations in the seepage models were adjusted to a nearest mesh node. Step 7 Based on the results of steady state seepage analyses presented in Table 4, the cutoff wall could potentially reduce seepage through the foundation by 40 to 85 percent depending on the subsurface conditions and the proposed depth of the wall. At the locations where the wall fully penetrates the permeable sand layer (Station 70+00) seepage quantities could be reduced by approximately 85 percent. At the locations, where the cutoff is shallow and only partially penetrates the sand layer (Station 353+00), the reduction would be approximately 40 percent. Step 8 To verify and validate steady state seepage analyses described above, we have performed transient seepage analyses for Station 70+00. The purpose of these analyses was to better understand effects of seasonal groundwater table fluctuations on the estimated seepage quantities with and without the cutoff wall and more accurately model typical river conditions throughout the year. Time-dependent boundary conditions assigned to the riverside and the landside of the model as shown on Plate 16 and summarized in a tabular form on Plate 8 were used in these analyses. Seepage quantity computations were performed at 34 time steps, starting in February and ending a year later. Transient seepage analyses results are presented on Plates 17 through 20. Existing seepage flow regime during typical winter and summer conditions is illustrated on Plates

72834/DEN9R043 Page 11 of 14 April 21, 2009 Copyright 2009 Kleinfelder West, Inc.
17 and 18 respectively. Seepage conditions with the cutoff wall in place are shown on Plates 19 and 20. The plates show calculated seepage velocity vectors which illustrate the direction and the amount of flow - the larger the arrow, the higher the velocity and the larger the flow. A consistent scale was used on all four plates for easier visual comparison. The results indicate seepage occurs primarily through the permeable foundation sand layer and the existing sand levee. The flow is significantly higher during the elevated river stages (winter). Further, conditions may exist during the year when the river water surface is lower than the groundwater table. During these periods of time, the direction of the flow is reversed indicating seepage flow toward the river as illustrated on Plate 18. Seepage quantities through the levee foundation with and without the cutoff wall as a function of time are presented on Plate 21. Positive seepage quantities indicate flow from the river landward of the levee while the negative sign indicates flow in the opposite direction. As shown on Plate 21, construction of the cutoff wall impedes flow in both direction and as a result may prevent flow into the river during the summer months. Based on the transient seepage analyses, flow through the levee foundation at Station 70+00 without the wall is estimated at 5.6 acre-ft/year per 1,000 feet of the levee. Seepage through the levee foundation with the wall in place is approximately 1.7 acre-ft/year per 1,000 feet. Compared to the steady state analyses results for the same station, the transient seepage analyses indicate higher seepage quantities. For example, as shown in Table 4, steady-state seepage quantities estimated for Station 70+00 are 2.6 acre-ft/year per 1,000 feet for the existing conditions and approximately 0.4 acre-ft/year per 1,000 feet of the levee with the cutoff wall in place. The estimated reduction in flow due to the wall is comparable for both types of analyses. Based on the transient analysis, the seepage quantities would be reduced by about 70% compared to 85% estimated from the steady-state seepage analyses. Accordingly, we conclude the steady state seepage analyses conservatively approximate the effect of the cutoff walls. Step 9 The overall effect of the cutoff wall construction can be estimated based on the information presented in Table 5.
Table 5 Estimated Seepage Quantities through Levee Foundation
Reaches 1 through 20
Reach Stations
Representative
Station
Stretch
Length (ft)
Seepage
without Cutoff Wall (ac-ft/yr)
Percent reduction based on
cross section
Seepage with
Cutoff Wall (ac-
ft/yr)
Is Cutoff Wall Proposed at
this Location?
1 00+00 to 48+00 27+00 4,800 19 0 19 N 2 48+00 to 100+00 70+00 5,200 14 85 2 Y 3 100+00 to 110+00 70+00 1,000 3 85 .4 Y
4a 110+00 to 120+00 70+00 1,000 3 0 3 N

72834/DEN9R043 Page 12 of 14 April 21, 2009 Copyright 2009 Kleinfelder West, Inc.
Table 5 (Cont.)
Reach Stations
Representative
Station
Stretch
Length (ft)
Seepage
without Cutoff Wall (ac-ft/yr)
Percent reduction based on
cross section
Seepage with
Cutoff Wall (ac-
ft/yr)
Is Cutoff Wall Proposed at
this Location?
4a 120+00 to 190+00 353+00 7,000 95 0 95 N 4b 190+00 to 228+00 217+00 3,800 490 0 490 N 5a 228+00 to 263+00 70+00 3,500 10 0 10 N 5b 263+00 to 280+00 27+00 1,700 6 0 6 N 6 280+00 to 330+00 217+00 5,000 650 85 100 Y
7a 330+00 to 345+00 353+00 1,500 20 85 3 Y 7b 345+00 to 362+00 353+00 1,700 23 85 3 Y 8 362+00 to 402+00 353+00 4,000 55 85 8 Y 9 402+00 to 430+00 353+00 2,800 38 38 N 9 430+00 to 468+10 353+00 3,800 50 85 8 Y
10 468+10 to 495+00 217+00 2,690 350 40 210 Y 11 495+00 to 635+00 217+00 14,000 1810 0 1810 N 12 635+00 to 640+00 217+00 500 65 0 65 N 12 640+00 to 667+00 70+00 2,700 7 0 7 N 13 667+00 to 700+00 353+00 3,300 45 40 30 Y 14 700+00 to 732+00 70+00 3,200 8 0 8 N 15 732+00 to 780+00 217+00 4,800 620 40 375 Y 16 780+00 to 832+00 217+00 5,200 675 0 675 N 17 832+00 to 842+00 217+00 1,000 130 40 80 Y 18 842+00 to 857+00 217+00 1,500 195 40 120 Y
19a 857+00 to 875+00 217+00 1,800 235 40 140 Y 19b 875+00 to 925+00 70+00 5,000 15 40 8 Y 20a 925+00 to 925+50 27+00 50 .2 0 .2 N 20b 925+50 to 960+00 27+00 3,550 13 0 13 N
Total Seepage 5,650 4,330 The results presented in Table 5 indicate the construction of cutoff walls could potentially reduce the groundwater aquifer recharge landward of the levee by approximately 20-25%. Seepage through the levee foundation without the wall is estimated at 5,650 acre-feet per year. Seepage with the SB cutoff wall in place is approximately 4,330 acre-feet per year. The resulting impact to the groundwater recharge is approximately 1,300 acre-feet per year. In our opinion, these results are likely conservative and represent the upper-bound estimate. The actual impact is likely lower, due to 3-D effects that cannot be assessed with the existing modeling. Step 10 A new 2 mile long canal will be constructed along the east levee between Stations 200+00 and 305+00. This canal, shown in plan in Attachment C, will be located approximately 500 to 1,000 feet landward of the levee toe and will follow the existing

72834/DEN9R043 Page 13 of 14 April 21, 2009 Copyright 2009 Kleinfelder West, Inc.
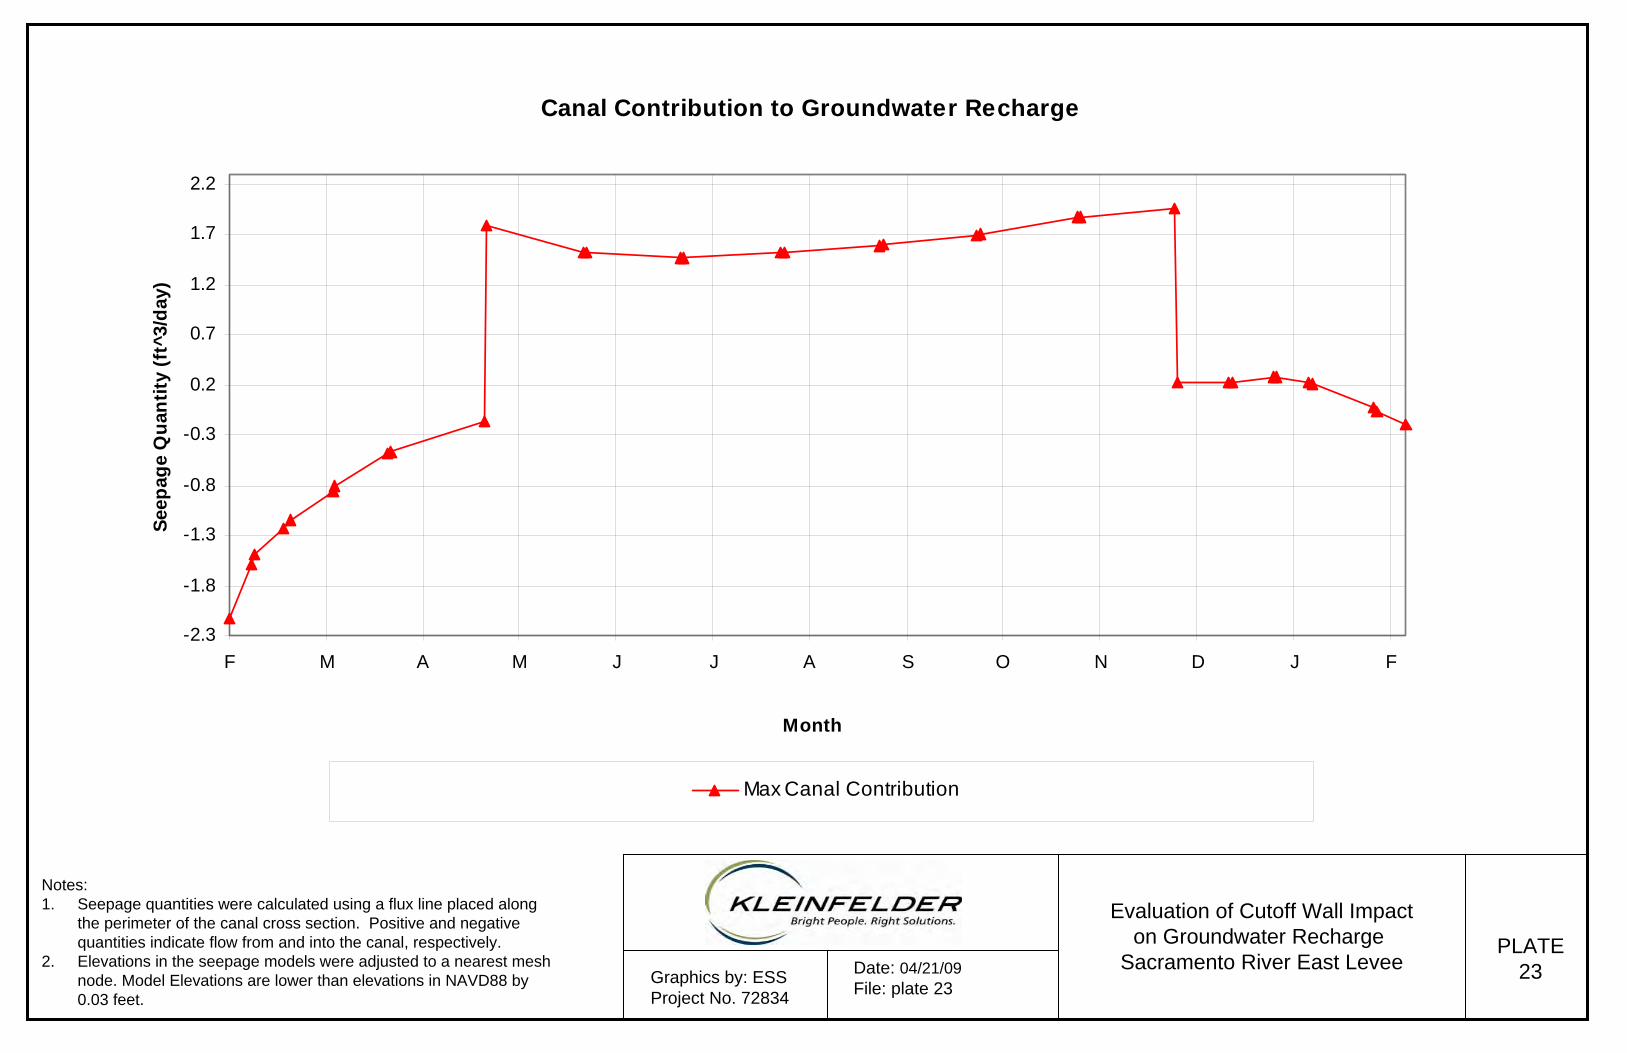
levee alignment. In general, the canal will be filled with water during summer months and will be dry during the winter months (See Plate 7). We have evaluated the impact of the canal operation on the groundwater conditions in the area. Transient analyses were performed to estimate seepage quantities from and into the canal at various times throughout the year. The analyses were performed for Station 70+00 with a cutoff wall in place. The canal cross-section was incorporated into the transient analysis model described in Step 8 above as a 8 feet deep and 10 feet wide ditch with 3H:1V side slopes positioned 1,000 ft landward of the levee. The canal was assumed to be filled with up to 5 feet of water from May through November and was allowed to seep in the winter, modeled as a free seepage discharge face. The canal operation was modeled as another time-dependent boundary condition applied, as shown on Plate 22. The canal will be excavated through the surficial clay blanket which consists primarily of CL with some CH and ML soils with percent fines between 50 and 70 percent. The permeability of this layer is estimated at 10-5 cm/sec. This permeability was assigned to the surface layer to represent base-case conditions. The clay blanket thickness varies across the site and excavation of the canal may result in a complete removal of the surficial clay at some locations. To account for variability in subsurface conditions and the possibility of a complete removal of the clay blanket, we have conducted a sensitivity analysis with permeability of the surface layer increased by one order of magnitude (10-4 cm/sec). The results of this analysis provide an upper bound estimate of seepage losses from the canal. Seepage quantities were calculated using a flux line placed along the perimeter of canal cross-section. Positive and negative quantities indicate flow from and into the ditch, respectively. The estimated seepage quantities as a function of time are shown on Plate 23. Based on the results of the transient analyses, seepage loss is estimated at 1.4 acre-t/year per 1,000 feet of the canal for base-case conditions. Only positive flow (flow from the canal) was considered in these computations. Seepage loss over the entire length of the canal is estimated at 15 acre-ft per year. The upper bound estimate is approximately 90 acre-ft per year. We have also evaluated the combined impact of the cutoff wall construction and the canal operation on the groundwater table in the vicinity of the levee. This evaluation was performed based on the results of transient seepage analysis described in Steps 8 and 10. Seepage quantities as a function of time are shown graphically on Plate 24. Positive and negative quantities indicate flow from and into the river, respectively. Seepage quantities were calculated using a flux line placed immediately landside of the cutoff wall. In addition, groundwater table elevation was estimated as a function of time at the location halfway between the existing levee and the proposed canal. The results, provided on Plate 25, indicate minimal impact of the canal during winter months. However, during summer months groundwater table elevation in the immediate vicinity of the proposed wall locations could increase by as much as 3 feet. This increase is likely due to the combined effect of the cutoff wall preventing backflow into the river and the additional inflow from the canal.

72834/DEN9R043 Page 14 of 14 April 21, 2009 Copyright 2009 Kleinfelder West, Inc.
Conclusions The key findings and conclusions presented in this memorandum are as follows:
• Under the existing conditions seepage from the Sacramento River through the levee foundation along Sacramento River East Levee between Stations 00+00 and 960+00 is estimated to be about 5,650 acre-ft/year.
• At the proposed wall locations seepage flow could be reduced locally by up 85 percent, depending on stratigraphy and proposed wall depth.
• The overall impact of the proposed cutoff walls is estimated at approximately 1,300 acre-ft/year (20 percent reduction of the total recharge rate)
• The cutoff wall could impede seepage flow towards the river in the summer months when the river level is low.
• Construction of an irrigation canal may increase aquifer recharge by approximately 15 to 90 acre-ft per year.
• Construction of the cutoff wall and the canal may locally increase the groundwater levels up to 3 feet in the summer months.
Due to the limitations of the model, the analyses can only provide an order-of-magnitude estimate of the seepage quantities. Additional analyses with a three-dimensional model such as MODFLOW are recommended to properly characterize groundwater flow regime in the area account for 3-Dimensional effects and quantify the impact of the proposed SB cutoff wall on the aquifer recharge. If you have questions regarding this design or require additional information, please contact either Elena Sossenkina at (303) 237-6601 or the undersigned. Sincerely, KLEINFELDER WEST, INC.
Keith A. Ferguson, PE Principal Engineer

PLATES
1 1 /2 6 /1 9 9 5 - 1 2 /3 1 /1 9 9 8
0
5
10
15
20
25
30
35
40
45
1 1 /2 6 /19 95 1 /2 5 /1 99 6 3 /25 /19 96 5 /24 /199 6 7 /2 3 /1 996 9 /2 1 /19 96 1 1 /2 0 /19 96 1 /1 9 /1 99 7 3 /20 /19 97 5 /19 /19 97 7 /18 /199 7 9 /1 6 /19 97 11 /15 /1 99 7 1 /14 /1 9 9 8 3 /1 5 /1 99 8 5 /14 /19 98 7 /13 /199 8 9 /11 /1 99 8 11 /10 /1 99 8
D a te
Riv
er E
leva
tion
USE
D (F
t)
V e ro n a R ive r G a g eR ive r H yd ro g ra p h U se d in E va lu a tio n
Evaluation of Cutoff Wall Impacton Groundwater Recharge
Sacramento River East LeveePLATE
1Graphics by: ESSProject No. 72834
Date: 04/21/09File: 1995-2000 Hydrograph Data 03-23-09.xlsRef: http://cdec.water.ca.gov/queryStation.html

Evaluation of Cutoff Wall Impacton Groundwater Recharge
Sacramento River East LeveePLATE
2Graphics by: ESSProject No. 72834
Date: 04/21/09File: 1995-2000 HydrographData 03-23-09.xlsRef: http://cdec.water.ca.gov/queryStation.html
0 1 /0 1 /1 9 9 9 - 1 1 /2 6 /2 0 0 0
0
5
10
15
20
25
30
35
40
45
1 /1 /199 9 3 /2 /19 99 5 /1 /1 99 9 6 /3 0 /1 99 9 8 /29 /19 99 10 /28 /199 9 1 2 /2 7 /19 99 2 /2 5 /20 00 4 /2 5 /2 00 0 6 /2 4 /2 00 0 8 /23 /20 00 1 0 /22 /20 00
D a te
Riv
er E
leva
tion
USE
D (f
t)
V e ro n a R ive r G a g eR ive r H yd ro g ra p h U se d in E va lu a tio n

Evaluation of Cutoff Wall Impacton Groundwater Recharge
Sacramento River East LeveePLATE
3Graphics by: ESSProject No. 72834
Date: 04/21/09File: 00-07 HydrographData 03-2309.xlsRef: http://cdec.water.ca.gov/queryStation.html
1 1 /2 6 /2 0 0 0 - 1 2 /3 1 /2 0 0 3
0
5
10
15
20
25
30
35
40
45
1 1 /2 6 /20 00 1 /2 5 /20 01 3 /26 /2 00 1 5 /2 5 /2 001 7 /24 /20 01 9 /2 2 /2 00 1 11 /21 /2 00 1 1 /20 /2 00 2 3 /2 1 /20 02 5 /2 0 /20 02 7 /19 /200 2 9 /1 7 /2 002 11 /1 6 /2 00 2 1 /1 5 /2 0 0 3 3 /1 6 /20 03 5 /15 /2 00 3 7 /1 4 /20 03 9 /12 /200 3 1 1 /11 /20 03
D a te
Riv
er E
leva
tion
USE
D (f
t)
R ive r H yd ro g ra p hV e ro n a R ive r G a g e

Evaluation of Cutoff Wall Impacton Groundwater Recharge
Sacramento River East LeveePLATE
4Graphics by: ESSProject No. 72834
Date: 04/21/09File:00-07 HydrographData 03-2309.xlsRef: http://cdec.water.ca.gov/queryStation.html
6
0 1 /0 1 /2 0 0 4 - 1 2 /3 1 /2 0 0 6
0
5
1 0
1 5
2 0
2 5
3 0
3 5
4 0
1 /1 /20 04 3 /1 /20 04 4 /3 0 /20 04 6 /2 9 /2 004 8 /28 /2 00 4 1 0 /2 7 /20 04 12 /2 6 /2 00 4 2 /2 4 /20 05 4 /2 5 /20 05 6 /2 4 /2 00 5 8 /23 /200 5 1 0 /2 2 /20 05 12 /21 /2 00 5 2 /1 9 /2 00 6 4 /2 0 /20 06 6 /19 /2 00 6 8 /18 /20 06 10 /1 7 /2 006 12 /16 /2 00 6
D a te
Riv
er E
leva
tion
USE
D (f
t)
V e ro n a R ive r G a g eR ive r H yd ro g ra p h

Evaluation of Cutoff Wall Impacton Groundwater Recharge
Sacramento River East LeveePLATE
5Graphics by: ESSProject No. 72834
Date: 04/21/09File: 00-07 HydrographData 03-2309.xlsRef: http://cdec.water.ca.gov/queryStation.html
0 1 /0 1 /2 0 0 7 - 1 1 /2 6 /2 0 0 7
0 .0 0
5 .0 0
1 0 .0 0
1 5 .0 0
2 0 .0 0
2 5 .0 0
3 0 .0 0
3 5 .0 0
4 0 .0 0
4 5 .0 0
1 /1 /20 07 3 /2 /20 07 5 /1 /2 00 7 6 /30 /2 00 7 8 /2 9 /2 007 1 0 /28 /20 07 12 /27 /2 00 7 2 /25 /20 08 4 /25 /2 00 8 6 /24 /2 00 8 8 /2 3 /2 008 1 0 /22 /20 08 12 /21 /2 00 8 2 /1 9 /20 09 4 /20 /200 9 6 /19 /200 9 8 /1 8 /2 00 9 1 0 /1 7 /20 09 12 /16 /2
D a te
Riv
er E
leva
tion
USE
D (f
t)
V e ro n a R ive r G a g eR ive r H yd ro g ra p h

Evaluation of Cutoff Wall Impacton Groundwater Recharge
Sacramento River East LeveePLATE
6Graphics by: ESSProject No. 72834
Date: 04/21/09File: SacRiverCutoffWallEval_04-07-09.ppt
00.03961.522
0.40.13871.921
00.04161.724
00.04051.423
0.40.13771.820
10.23682.319
30.835133.518
51.434205.417
102.933297.816
102.632401115
41.2314512.514
30.8304512.313
30.7294512.412
30.828308.211
41.02741.210
30.82620.59
41.22500.08
Days per year river at El.
% of days per year river at given El.
ElevationDays per year river at El.
% of days per year river at given El.
Elevation
Sacramento River Elevation in Ft
Notes: 1. Historical river elevations in Plates 1-5 are reported in the USED
datum. Elevations reported above are using NAVD88 datum. Satisticsare based on data from the Verona River Gage obtained from http://cdec.water.ca.gov/queryStation.html from the period 11/26/1995-11/26/2007.
2. Elevations in the seepage models were adjusted to a nearest meshnode. Model Elevations are lower than elevations in NAVD88 by 0.03 feet.

Evaluation of Cutoff Wall Impacton Groundwater Recharge
Sacramento River East LeveePLATE
7Graphics by: ESSProject No. 72834
Date: 04/21/09File: TransientTimeStepElevs_03-20-09
Groundwater, River, and Canal Hydrographs
0
5
10
15
20
25
30
35
40
11/1 12/1 1/1 2/1 3/1 4/1 5/1 6/1 7/1 8/1 9/1 10/1 11/1
Month
Elev
atio
n (ft
NA
VD 8
8)
River Elevation Ground Water Elevation Canal Elevation
Note: Elevations in the seepage models were adjusted to a nearest mesh node. Model Elevations are lower than elevations in NAVD88 by 0.03 feet.

Evaluation of Cutoff Wall Impacton Groundwater Recharge
Sacramento River East LeveePLATE
8Graphics by: ESSProject No. 72834
Date: 04/21/09File: TransientTimeStepElevs_03-23-09.xls
Transient Time Step Table
25.2515.7517.758/117
25.2516.2518.257/3116
25.2516.2518.257/115
25.2517.2517.756/3014
25.2517.2517.756/113
25.2517.2517.255/3112
25.2517.2517.255/111
20.2517.0019.954/3010
20.2517.0019.954/19
20.2517.7520.353/318
20.2517.7520.353/157
20.2520.2525.253/146
20.2520.2525.253/15
20.2520.7532.252/284
20.2520.7532.252/193
20.2521.2535.252/182
20.2521.2535.252/111
Canal Elevation
Ground Water
ElevationRiver
ElevationDateTime Step
20.2521.7532.252/1034
20.2521.7532.252/133
20.2523.2527.251/3132
20.2523.2527.251/1231
20.2521.7522.251/1130
20.2521.7522.251/129
20.2517.2520.6512/3128
20.2517.2520.6512/1827
20.2513.2520.6512/1726
20.2513.2520.6512/125
25.2513.7515.1511/3024
25.2513.7515.1511/123
25.2514.2514.5510/3122
25.2514.2514.5510/121
25.2515.2516.859/3020
25.2515.2516.859/119
25.2515.7517.758/3118
Canal Elevation
Ground Water
ElevationRiver
ElevationDateTime Step
Note: Elevations in the seepage models were adjusted to a nearest mesh node. Model Elevations are lower than elevations in NAVD88 by 0.03 feet.
Estimated Seepage vs River El.
1.00E-03
1.00E-02
1.00E-01
1.00E+00
1.00E+01
1.00E+02
1.00E+03
10 15 20 25 30 35
River E.l (ft NAVD88)
Seep
age
(ft^3
/day
/ft)
27+00 Flow Existing Conditions 70+00 Flow Existing Conditions 217+00 Flow Existing Conditions70+00 Flow With Wall 353+00 Flow Existing Conditions 353+00 Flow with wall
Evaluation of Cutoff Wall Impacton Groundwater Recharge
Sacramento River East LeveePLATE
9Graphics by: ESSProject No. 72834
Date: 04/21/09File: 00-07 HydrographData 03-23-09.xls
Note: Elevations in the seepage models were adjusted to a nearest mesh node. Model Elevations are lower than elevations in NAVD88 by 0.03 feet.

Evaluation of Cutoff Wall Impacton Groundwater Recharge
Sacramento River East LeveePLATE
10Graphics by: ESSProject No. 72834
Date: 04/21/09File: 27+00_Plate10
WSE 32 ft (NGVD29)
Hydraulic Conductivity (Kh) and Anisotropy Ratio (Kv:Kh)
Material #1 Hyd K Fn: 7 Sand w/ 0-2% CL or 3-7% ML, Ks=14 ft/day (5x10E-3 cm/s) Ky/Kx Ratio: 0.25Material #2 Hyd K Fn: 5 Clay Ks=0.028 ft/day (1x10E-5 cm/s) Ky/Kx Ratio: 0.25Material #3 Hyd K Fn: 7 Sand w/ 0-2% CL or 3-7% ML, Ks=14 ft/day (5x10E-3 cm/s) Ky/Kx Ratio: 0.25
1
2
3
26 27
28 29 30 31
5.0
7 48 e
+ 00 0
(ft³/
d ay)
Horizontal Distance (feet) (x 1000)0.35 0.40 0.45 0.50 0.55 0.60 0.65 0.70 0.75 0.80
Total Head Contours
STA 27+00, steady-state analysis, existing conditions Total Flow: 3.9 acre ft/yr/1000 ft
WSE 34.25 ft
33.25 32.25
31.25 30.25
29.2528.25
Note: Elevations in the seepage models were adjusted to a nearest mesh node. Model Elevations are lower than elevations in NAVD88 by 0.03 feet.

Evaluation of Cutoff Wall Impacton Groundwater Recharge
Sacramento River East LeveePLATE
11Graphics by: ESSProject No. 72834
Date: 04/21/09File: 70+00_Plate11
12
3
4
Horizontal Hydraulic Conductivity (Kh) and Anisotropy Ratio (Kv:Kh)
Material #1 Hyd K Fn: 21 Sand w/ 0-2% CL or 3-7% ML, Ks=14 ft/day (5x10E-3 cm/s) Ky/Kx Ratio: 0.25Material #2 Hyd K Fn: 18 Clay Ks=0.028 ft/day (1x10E-5 cm/s) Ky/Kx Ratio: 0.25Material #3 Hyd K Fn: 21 Sand w/ 0-2% CL or 3-7% ML, Ks=14 ft/day (5x10E-3 cm/s) Ky/Kx Ratio: 0.25Material #4 Hyd K Fn: 18 Clay Ks=0.028 ft/day (1x10E-5 cm/s) Ky/Kx Ratio: 0.1
WSE 32 ft (NGVD26)
27 28 29 30
31
4.2
062e
+000
(ft ³/
day)
Horizontal Distance (feet) (x 1000)0.35 0.40 0.45 0.50 0.55 0.60 0.65 0.70 0.75 0.80
Total Head Contours
STA 70+00, steady-state analysis, existing conditions Total Flow: 2.6 acre ft/yr/1000 ft
WSE 34.25 ft
33.2
5
32.25 30.25 31.25 33.25
Note: Elevations in the seepage models were adjusted to a nearest mesh node. Model Elevations are lower than elevations in NAVD88 by 0.03 feet.

Evaluation of Cutoff Wall Impacton Groundwater Recharge
Sacramento River East LeveePLATE
12Graphics by: ESSProject No. 72834
Date: 04/21/09File: 217+00_Plate12
30
31
32
33
1.0615e +002 ( ft ³ /da y)
-0.2 0.0 0.2
Total Head Contours
Gravel Kx = 283 ft/day, kx/ky = 10
WSE 34.25 ft
Sand-silty sand Kx = 56ft/day, kx/ky = 4
Silty sand Kx = 11.2 ft/day, kx/ky = 4
Sandy Silt kx = .56ft/day, kx/ky = 1
Weather Clay BlanketKx = .028ft/day, kx/ky = 4
Sand-silty sand Kx = 56ft/day, kx/ky = 4
STA 217+00, steady-state analysis, existing conditions Total Flow: 129 acre ft/yr/1000 ftRef: URS model 217+00 from Sac Levees report 2007
Horizontal Distance (feet) (x 1000)
Note: Elevations in the seepage models were adjusted to a nearest mesh node. Model Elevations are lower than elevations in NAVD88 by 0.03 feet.

Evaluation of Cutoff Wall Impacton Groundwater Recharge
Sacramento River East LeveePLATE
13Graphics by: ESSProject No. 72834
Date: 04/21/09File: 353+00_Plate13
Horizontal Hydraulic Conductivity (Kh) and Anisotropy Ratio (Kv:Kh)
Material #1 Hyd K Fn: 9 Sand w/ 0-2% CL or 3-7% ML, Ks=14 ft/day (5x10E-3 cm/s) Ky/Kx Ratio: 0.25Material #2 Hyd K Fn: 7 Silt Ks=0.56 ft/day (2x10E-4 cm/s) Ky/Kx Ratio: 1Material #3 Hyd K Fn: 5 Clay Ks=0.028 ft/day (1x10E-5 cm/s) Ky/Kx Ratio: 0.1Material #4 Hyd K Fn: 9 Sand w/ 0-2% CL or 3-7% ML, Ks=14 ft/day (5x10E-3 cm/s) Ky/Kx Ratio: 0.25Material #5 Hyd K Fn: 8 Drainage Rock Ks=2800 ft/day (10 cm/s) Ky/Kx Ratio: 1
WSE 32 ft (NGVD 26)
13
4
2
5 25 26 27
28
29
30
31
1.5
058e
+001
(ft³/
day)
0.35 0.40 0.45 0.50 0.55 0.60 0.65 0.70 0.75 0.80
Total Head Contours
STA 353+00, steady-state analysis, existing conditions Total Flow: 13.4 acre ft/yr/1000 ft
Horizontal Distance (feet) (x 1000)
WSE 34.25 ft
33.2
5
32.2
5
31.2
5
29.2528.25
27.25
30.25
Note: Elevations in the seepage models were adjusted to a nearest mesh node. Model Elevations are lower than elevations in NAVD88 by 0.03 feet.
Evaluation of Cutoff Wall Impacton Groundwater Recharge
Sacramento River East LeveePLATE
14Graphics by: ESSProject No. 72834
Date: 04/21/09File: 70+00_Plate14
12
3
4
Horizontal Hydraulic Conductivity (Kh) and Anisotropy Ratio (Kv:Kh)
Material #1 Hyd K Fn: 10 Sand w/ 0-2% CL or 3-7% ML, Ks=14 ft/day (5x10E-3 cm/s) Ky/Kx Ratio: 0.25Material #2 Hyd K Fn: 7 Clay Ks=0.028 ft/day (1x10E-5 cm/s) Ky/Kx Ratio: 0.25Material #3 Hyd K Fn: 10 Sand w/ 0-2% CL or 3-7% ML, Ks=14 ft/day (5x10E-3 cm/s) Ky/Kx Ratio: 0.25Material #4 Hyd K Fn: 7 Clay Ks=0.028 ft/day (1x10E-5 cm/s) Ky/Kx Ratio: 0.1Material #5 Hyd K Fn: 8 Silt Ks= 0.028 ft/day (1x10E-5 cm/s) Ky/Kx Ratio: 0.25Material #7 Hyd K Fn: 11 Cutoff wall Ks = 0.0028ft/day (1.0x10⁻⁶ cm/sec) Ky/Kx Ratio: 1
WSE 32 ft (NGVD26)
5
7
26
26
27
27
28 29
30
31
3.3665e-001 (ft³/day)
Horizontal Distance (feet) (x 1000)0.35 0.40 0.45 0.50 0.55 0.60 0.65 0.70 0.75 0.80
Total Head Contours
STA 70+00, steady-state analysis, adjacent levee, with wall Total Flow: 0.4 acre ft/yr/1000 ft
WSE 34.25 ft
33.25
32.25 31.25
30.25
29.25
28.25
28.25
29.2
5Note: Elevations in the seepage models were adjusted to a nearest mesh node. Model Elevations are lower than elevations in NAVD88 by 0.03 feet.

Evaluation of Cutoff Wall Impacton Groundwater Recharge
Sacramento River East LeveePLATE
15Graphics by: ESSProject No. 72834
Date: 04/21/09File: 353+00_Plate15
Horizontal Hydraulic Conductivity (Kh) and Anisotropy Ratio (Kv:Kh)
Material #1 Hyd K Fn: 9 Sand w/ 0-2% CL or 3-7% ML, Ks=14 ft/day (5x10E-3 cm/s) Ky/Kx Ratio: 0.25Material #2 Hyd K Fn: 7 Silt Ks=0.56 ft/day (2x10E-4 cm/s) Ky/Kx Ratio: 1Material #3 Hyd K Fn: 5 Clay Ks=0.028 ft/day (1x10E-5 cm/s) Ky/Kx Ratio: 0.1Material #4 Hyd K Fn: 9 Sand w/ 0-2% CL or 3-7% ML, Ks=14 ft/day (5x10E-3 cm/s) Ky/Kx Ratio: 0.25Material #6 Hyd K Fn: 10 Cutoff wall Ks = 0.0028 ft/day (1.0x10⁻⁶ cm/sec) Ky/Kx Ratio: 1
WSE 32 ft (NGVD 26) 13
4
2
6 25
28
30
31
7.0
223e
+000
(ft³/
day)
7.0
223e
+000
(ft³/
day)
0.35 0.40 0.45 0.50 0.55 0.60 0.65 0.70 0.75 0.80
Total Head Contours
STA 353+00, steady-state analysis, adjacent levee, with wall Total Flow: 8.4 acre ft/yr/1000 ft
Horizontal Distance (feet) (x 1000)
WSE 34.25 ft
33.2
5
32.2
5
27.25
30.25
Note: Elevations in the seepage models were adjusted to a nearest mesh node. Model Elevations are lower than elevations in NAVD88 by 0.03 feet.

Evaluation of Cutoff Wall Impacton Groundwater Recharge
Sacramento River East LeveePLATE
16Graphics by: ESSProject No. 72834
Date: 04/21/09File: 70+00_Plate16_BC
STA 70+00, boundary conditionsTransient analysis, existing conditions
func. #1 func. #2 func. #3
Note: Elevations in the seepage models were adjusted to a nearest mesh node. Model Elevations are lower than elevations in NAVD88 by 0.03 feet.
Groundwater, River, and Canal Hydrographs
0
5
10
15
20
25
30
35
40
11/1 12/1 1/1 2/1 3/1 4/1 5/1 6/1 7/1 8/1 9/1 10/1 11/1
Month
Elev
atio
n (ft
NA
VD 8
8)
River Elevation Ground Water Elevation Canal Elevation
1234
Horizontal Hydraulic Conductivity (Kh) and Anisotropy Ratio (Kv:Kh)
Material #1 Hyd K Fn: 21 Sand w/ 0-2% CL or 3-7% ML, Ks=14 ft/day (5x10E-3 cm/s) Ky/Kx Ratio: 0.25Material #2 Hyd K Fn: 18 Clay Ks=0.028 ft/day (1x10E-5 cm/s) Ky/Kx Ratio: 0.25Material #3 Hyd K Fn: 21 Sand w/ 0-2% CL or 3-7% ML, Ks=14 ft/day (5x10E-3 cm/s) Ky/Kx Ratio: 0.25Material #4 Hyd K Fn: 18 Clay Ks=0.028 ft/day (1x10E-5 cm/s) Ky/Kx Ratio: 0.1Material #5 Hyd K Fn: 19 Silt Ks= 0.028 ft/day (1x10E-5 cm/s) Ky/Kx Ratio: 0.25Material #6 Hyd K Fn: 17 Drain Rock, Ks = 2800 ft/day (10 cm/s) Ky/Kx Ratio: 1
5
29
30
31 32
33
34
35
Horizontal Distance (feet) (x 1000)0.30 0.35 0.40 0.45 0.50 0.55 0.60 0.65 0.70 0.75 0.80 0.85 0.90 0.95
Evaluation of Cutoff Wall Impacton Groundwater Recharge
Sacramento River East LeveePLATE
17Graphics by: ESSProject No. 72834
Date: 04/21/09File: Tyler’s adjusted run_NAVD88
Total Head Contours
STA 70+00, transient analysis, existing conditionsTime Step: 2 (Winter)
WSE 35.25 ft
Note: Elevations in the seepage models were adjusted to a nearest mesh node. Model Elevations are lower than elevations in NAVD88 by 0.03 feet.

1234
Horizontal Hydraulic Conductivity (Kh) and Anisotropy Ratio (Kv:Kh)
Material #1 Hyd K Fn: 21 Sand w/ 0-2% CL or 3-7% ML, Ks=14 ft/day (5x10E-3 cm/s) Ky/Kx Ratio: 0.25Material #2 Hyd K Fn: 18 Clay Ks=0.028 ft/day (1x10E-5 cm/s) Ky/Kx Ratio: 0.25Material #3 Hyd K Fn: 21 Sand w/ 0-2% CL or 3-7% ML, Ks=14 ft/day (5x10E-3 cm/s) Ky/Kx Ratio: 0.25Material #4 Hyd K Fn: 18 Clay Ks=0.028 ft/day (1x10E-5 cm/s) Ky/Kx Ratio: 0.1Material #5 Hyd K Fn: 19 Silt Ks= 0.028 ft/day (1x10E-5 cm/s) Ky/Kx Ratio: 0.25Material #6 Hyd K Fn: 17 Drain Rock, Ks = 2800 ft/day (10 cm/s) Ky/Kx Ratio: 1
5
18 19
20
21 24
29
Horizontal Distance (feet) (x 1000)0.25 0.30 0.35 0.40 0.45 0.50 0.55 0.60 0.65 0.70 0.75 0.80 0.85 0.90
Evaluation of Cutoff Wall Impacton Groundwater Recharge
Sacramento River East LeveePLATE
18Graphics by: ESSProject No. 72834
Date: 04/21/09File: Tyler’s adjusted run_NAVD88
Total Head Contours
STA 70+00, transient analysis, existing conditionsTime Step: 11 (Summer)
WSE 17.25 ft
Note: Elevations in the seepage models were adjusted to a nearest mesh node. Model Elevations are lower than elevations in NAVD88 by 0.03 feet.

1234
Horizontal Hydraulic Conductivity (Kh) and Anisotropy Ratio (Kv:Kh)
Material #1 Hyd K Fn: 21 Sand w/ 0-2% CL or 3-7% ML, Ks=14 ft/day (5x10E-3 cm/s) Ky/Kx Ratio: 0.25Material #2 Hyd K Fn: 18 Clay Ks=0.028 ft/day (1x10E-5 cm/s) Ky/Kx Ratio: 0.25Material #3 Hyd K Fn: 21 Sand w/ 0-2% CL or 3-7% ML, Ks=14 ft/day (5x10E-3 cm/s) Ky/Kx Ratio: 0.25Material #4 Hyd K Fn: 18 Clay Ks=0.028 ft/day (1x10E-5 cm/s) Ky/Kx Ratio: 0.1Material #5 Hyd K Fn: 19 Silt Ks= 0.028 ft/day (1x10E-5 cm/s) Ky/Kx Ratio: 0.25Material #6 Hyd K Fn: 17 Drain Rock, Ks = 2800 ft/day (10 cm/s) Ky/Kx Ratio: 1
5 25
26 27 28
29
30 31
32 3
3 34 35
Horizontal Distance (feet) (x 1000)30 0.35 0.40 0.45 0.50 0.55 0.60 0.65 0.70 0.75 0.80 0.85 0.90 0.95 1.00 1.05 1.10 1
Evaluation of Cutoff Wall Impacton Groundwater Recharge
Sacramento River East LeveePLATE
19Graphics by: ESSProject No. 72834
Date: 04/21/09File: Tyler’s Original NAVD88 Transient with canal
Total Head Contours
STA 70+00, transient analysis with cutoff wallTime Step: 2 (Winter)
WSE 35.25 ft
Note: Elevations in the seepage models were adjusted to a nearest mesh node. Model Elevations are lower than elevations in NAVD88 by 0.03 feet.

1234
Horizontal Hydraulic Conductivity (Kh) and Anisotropy Ratio (Kv:Kh)
Material #1 Hyd K Fn: 21 Sand w/ 0-2% CL or 3-7% ML, Ks=14 ft/day (5x10E-3 cm/s) Ky/Kx Ratio: 0.25Material #2 Hyd K Fn: 18 Clay Ks=0.028 ft/day (1x10E-5 cm/s) Ky/Kx Ratio: 0.25Material #3 Hyd K Fn: 21 Sand w/ 0-2% CL or 3-7% ML, Ks=14 ft/day (5x10E-3 cm/s) Ky/Kx Ratio: 0.25Material #4 Hyd K Fn: 18 Clay Ks=0.028 ft/day (1x10E-5 cm/s) Ky/Kx Ratio: 0.1Material #5 Hyd K Fn: 19 Silt Ks= 0.028 ft/day (1x10E-5 cm/s) Ky/Kx Ratio: 0.25Material #6 Hyd K Fn: 17 Drain Rock, Ks = 2800 ft/day (10 cm/s) Ky/Kx Ratio: 1
5
19
19
20
21
22 25
33
Horizontal Distance (feet) (x 1000)0.35 0.40 0.45 0.50 0.55 0.60 0.65 0.70 0.75 0.80 0.85 0.90 0.95 1.00 1.05 1.10 1.15
Evaluation of Cutoff Wall Impacton Groundwater Recharge
Sacramento River East LeveePLATE
20Graphics by: ESSProject No. 72834
Date: 04/21/09File: Tyler’s Original NAVD88 Transient with canal
Total Head Contours
STA 70+00, transient analysis with cutoff wallTime Step: 16 (Summer)
WSE 18.25 ft
Note: Elevations in the seepage models were adjusted to a nearest mesh node. Model Elevations are lower than elevations in NAVD88 by 0.03 feet.

Evaluation of Cutoff Wall Impacton Groundwater Recharge
Sacramento River East LeveePLATE
21Graphics by: ESSProject No. 72834
Date: 04/21/09File: plate 21
Notes: 1. Seepage quantities were calculated using a flux line placed approximately
40 feet from the landside of the cutoff wall. Positive and negative quantities indicate flow from and into the river, respectively.
2. Elevations in the seepage models were adjusted to a nearest mesh node. Model Elevations are lower than elevations in NAVD88 by 0.03 feet.
Cutoff Wall Impact on Seepage Quantities
-2
-1
0
1
2
3
4
5
6
F M A M J J A S O N D J F
Month
Seep
age
Qua
ntity
(ft^
3/da
y)
Existing Conditions (no cutoff wall and no canal) With Cutoff Wall and canal

Evaluation of Cutoff Wall Impacton Groundwater Recharge
Sacramento River East LeveePLATE
22Graphics by: ESSProject No. 72834
Date: 04/21/09File: 70+00-Plate22_BC
STA 70+00, boundary conditions, Transient analysis with cutoff wall and canal
12
3
4
1/200 AEP WSE = 41.7'5
Horizontal Distance (feet) (x 1000)0.00 0.05 0.10 0.15 0.20 0.25 0.30 0.35 0.40 0.45 0.50 0.55 0.60 0.65 0.70 0.75 0.80 0.85 0.90 0.95 1.00 1.05 1.10 1.15 1.20 1.25 1.30 1.35 1.40 1.45 1.50
Ele
vatio
n (fe
et)
-100
-80
-60
-40
-20
0
20
40
60
5 1.50 1.55 1.60 1.65 1.70 1.75 1.80 1.85 1.90 1.95 2.00 2.05 2.10 2.15 2.20 2.25 2.30 2.35 2.40 2.45 2.50 2.55 2.60-100
-80
-60
-40
-20
0
20
40
60
func. #1 func. #2 func. #3
Note: Elevations in the seepage models were adjusted to a nearest mesh node. Model Elevations are lower than elevations in NAVD88 by 0.03 feet.
Groundwater, River, and Canal Hydrographs
0
5
10
15
20
25
30
35
40
11/1 12/1 1/1 2/1 3/1 4/1 5/1 6/1 7/1 8/1 9/1 10/1 11/1
Month
Elev
atio
n (ft
NA
VD 8
8)
River Elevation Ground Water Elevation Canal Elevation
Evaluation of Cutoff Wall Impacton Groundwater Recharge
Sacramento River East LeveePLATE
23Graphics by: ESSProject No. 72834
Date: 04/21/09File: plate 23
Notes: 1. Seepage quantities were calculated using a flux line placed along
the perimeter of the canal cross section. Positive and negativequantities indicate flow from and into the canal, respectively.
2. Elevations in the seepage models were adjusted to a nearest meshnode. Model Elevations are lower than elevations in NAVD88 by 0.03 feet.
Canal Contribution to Groundwater Recharge
-2.3
-1.8
-1.3
-0.8
-0.3
0.2
0.7
1.2
1.7
2.2
F M A M J J A S O N D J F
Month
Seep
age
Qua
ntity
(ft^
3/da
y)
Max Canal Contribution

Evaluation of Cutoff Wall Impacton Groundwater Recharge
Sacramento River East LeveePLATE
24Graphics by: ESSProject No. 72834
Date: 04/21/09File: plate 24
Note: 1. Seepage quantities were calculated using a flux line placed
approximately 40 feet from the landside of the cutoff wall. Positive and negative quantities indicate flow from and into the river, respectively.
2. Elevations in the seepage models were adjusted to a nearest mesh node. Model Elevations are lower than elevations in NAVD88 by 0.03 feet.
Combined Impact of Cutoff Wall and Canal on Seepage Quantities
-1.0
-0.5
0.0
0.5
1.0
1.5
F M A M J J A S O N D J F
Month
Seep
age
Qua
ntity
(ft^
3/da
y)
Cutoff Wall and No Canal Cutoff Wall w ith Canal

Evaluation of Cutoff Wall Impacton Groundwater Recharge
Sacramento River East LeveePLATE
25Graphics by: ESSProject No. 72834
Date: 04/21/09File: plate 25
Note: 1. Groundwater table elevation estimated at the locations halfway
between the existing levee and the canal (~187 ft from levee toe).2. Elevations in the seepage models were adjusted to a nearest mesh
node. Model Elevations are lower than elevations in NAVD88 by 0.03 feet.
Estimated Groundwater Table Elevation
12
14
16
18
20
22
24
26
28
F M A M J J A S O N D J F
Month
Gro
undw
ater
Ele
vatio
n (N
AVD
88)
Cutoff Wall and Canal Existing Conditions

ATTACHMENT A
PIEZOMETER DATA AND
GROUNDWATER ELEVATION CONTOUR MAP