Embed Size (px)
Citation preview

CHAPTER 3 – AVIATION FORECASTS
Mammoth Yosemite Airport Layout Plan July 2011
3-1
CHAPTER 3. AVIATION FORECASTS
3-1 Introduction
The aviation forecasts provide estimates for future aviation demand at the airport. Projections of aviation demand are important in the planning process as they provide the basis for the following:
Documentation of the role of the airport and determination of the type aircraft to be accommodated in the future.
Evaluation of the capacity of existing airport facilities and their ability to accommodate designs.
Estimation of extent of airside and landside facilities required for future years.
3-2 Airport Role
Mammoth Yosemite Airport has previously served and will continue to serve as a general aviation airport that provides service for aircraft from the Central and Western United States to bring visitors to the recreation facilities available in the area, including skiing, fishing, and hiking, and access to Yosemite National Park. Recently airline service has been instituted and is growing rapidly, which serves airports in the western United States. The nearest commercial airport to Mammoth is Reno, Nevada, which is 170 miles to the north. A series of 90 hangars were constructed by the fixed base operator and sold to individual pilots for aircraft storage at the airport while they are off enjoying the recreation facilities. These hangars are in a pool, which is controlled and operated by the fixed base operator, providing covered storage space for visiting aircraft. Mammoth Yosemite Airport only has eight based aircraft - six single engine and two small twin-engine. The based aircraft population is not expected to change appreciably in the forecast period. The local operations at the airport are minimal. There are three other general aviation airports within 50 miles of Mammoth Yosemite Airport. According to F.A.A. Airport Master Records, Eastern Sierra Regional Airport in Bishop has 64 based aircraft, Lee Vining Airport has 1 based aircraft, and Bryant Field in Bridgeport has 1 based aircraft.
3-3 Projections
Mammoth Yosemite Airport is a commercial airport serving the Town of Mammoth Lakes and surrounding recreational areas. Aviation activities generally result from demand for access to the Mammoth Mountain Ski Area and

CHAPTER 3 – AVIATION FORECASTS
Mammoth Yosemite Airport Layout Plan July 2011
3-2
the summer recreation facilities including hiking, fishing, and access to Yosemite National Park. Previously these demands were satisfied by general aviation aircraft ranging in size from light single-engine propeller aircraft to large jets of the G V class. Airline operations began in 2008 during the winter months and have expanded rapidly since then. Aviation activity levels result from interaction of demand and supply factors. The demand for aviation is generally a function of demographic and economic activities, but at this airport recreation activities are the main attraction. Supply factors that influence activity levels include cost, competition, and regulations. There are very few aircraft based at this airport, but currently there is significant activity by general aviation aircraft bringing visitors to the area and recently by airlines bringing visitors to the area. The basic steps for forecasting aviation activity at this airport are presented herewith.
3-3.1 Aviation Activity Parameters and Measures to be Forecast The major activities and measured to be forecast include:
Based aircraft Annual Operations – Itinerant, Local, and Total Fleet Mix – Number and Type of Operations Enplaned Passengers on Commercial Aircraft Comparison of Airport Planning to TAF Forecasts Peak Operations Design Aircraft
3-3.2 Collect and Review Previous Airport Forecasts
Airport forecasts were prepared by Ricondo Associates in a report dated July 17, 2000. This study was conducted to determine airport requirements for the proposed institution of non-stop flights from Chicago and Dallas-Ft. Worth to Mammoth Yosemite Airport by American Airlines. The American Airlines service was curtailed because of environmental constraints and is replaced by shorter commercial flights, mainly from the Western United States. As a result, there is a different market that is being served and much of the forecast data presented in the Ricondo report will not be useful for this study.
3-3.3 Data Collection
Pertinent data available for all demographics used in these forecasts were collected and used in this study. The most recent Terminal Area Forecasts (TAF) were obtained from historical and forecast aviation activity for the entire United States, the F.A.A. Southwest Regional area, and the Mammoth Yosemite Airport. Forecasts presented in the California Aviation System Plan (CASP) were also obtained and reviewed. The data collected included the following:

CHAPTER 3 – AVIATION FORECASTS
Mammoth Yosemite Airport Layout Plan July 2011
3-3
Population – The population of the Town of Mammoth Lakes and all of
Mono County is very small and, as a result, the number of based aircraft at the airport is small and the influence of population on airport operations in this case is not significant.
Employment – The major employment in the area is service and government. As a result, employment in the area will not have a significant influence on aviation forecasts.
Enplaned Passengers – Mammoth Mountain is responsible for all airline contracts for service to the Mammoth Yosemite Airport. Mammoth Mountain has developed a plan for service by airlines for the period 2008 through 2027. This plan is included as Table No. 3-1. In this table they indicate total number of seats available and did not apply load factors. Load factors of approximately 60 percent have been utilized to convert seats to enplaned passengers. This conversion is included in Table No. 3-2. It will be noted that a major part of the airline operations is expected to occur in the late fall and winter months, which is the ski season at Mammoth Mountain. The spring/summer passengers are forecast to be one-third to one-half those in the winter. For comparative purposes, Table No. 3-2 also includes TAF historical and forecast enplaned passengers and aircraft operations for four other airports that serve similar needs as Mammoth Yosemite Airport.
Based Aircraft – Historical and forecast based aircraft data were collected from the F.A.A. TAF for the entire United States system, the F.A.A. Southwest Region, and the Mammoth Yosemite Airport. Historical and forecast based aircraft data for Mammoth Yosemite Airport were also collected from the California Aviation System Plan (CASP). These data are presented on Plate 3-1.
Annual Aircraft Operations – Historical and forecast annual aircraft operation data were obtained from the F.A.A. TAF for the entire United States system, the F.A.A. Southwest Region, and the Mammoth Yosemite Airport. Data were also collected from the CASP reports. These data are included on Plate 3-2.
Fleet Mix – Fleet mix data were acquired from the Airport and include the fleet mix for the itinerant and local general aviation activities. The general aviation fleet mix ranges from light single-engine propeller aircraft to light twin-engine propeller aircraft to the small jet powered aircraft, larger piston aircraft, and the large jet powered aircraft of the G V class. The fleet mix for the airlines will be determined by the contracts between the airline and Mammoth Mountain and are indicated in Table No. 3-1. It will be noted that currently the airlines are using Q400 aircraft and RJ 700 aircraft.

CHAPTER 3 – AVIATION FORECASTS
Mammoth Yosemite Airport Layout Plan July 2011
3-4
They anticipate that in upcoming years they will add B 737 and A 319 aircraft.
Helicopter Operations and Based Helicopters – There are no based helicopters at the airport.
3-3.4 Forecast Methods
Regression and trend analyses were conducted using population as the comparable feature. Share analyses were used with share of based aircraft and operations compared to the total National and Western Pacific Region numbers. In all evaluations historical data were used to develop a reasonable relationship between the number of based aircraft or number of aircraft operations per unit of population. This ratio was applied to the forecast population data available from local agencies. In the share analysis the historical share of total aircraft based at Mammoth Yosemite Airport compared to those based at either the total U.S. airports or the F.A.A. Southern Regional Airports was determined. This ratio was applied to the TAF forecasts for the total U.S. based aircraft and operations and the total Southwest Region based aircraft and operations. For the airline operations, both enplaned passengers and operations, the forecasts prepared by Mammoth Mountain were used and these were compared with historical data from similar airports throughout the United States starting with the time that airline service began at each airport. The airports included in this comparative study were Yampa Valley Airport, Eagle County Regional Airport and Aspen-Pitkin County Airport located in Colorado, and Glacier Park International located in Montana. All of these airports serve major skiing facilities similar to Mammoth Mountain and many of them also serve summer recreation facilities and national parks similar to Mammoth.
3-3.5 Evaluation of Forecasts
The historical data and forecast data for based fixed wing aircraft and local annual operations of fixed wing aircraft are presented graphically for each analysis method used. These data are shown on Plate 3-1 for based aircraft and Plate 3-2 for annual aircraft operations of fixed wing aircraft. 3-3.5.1 Based Aircraft – Fixed Wing
On Plate 3-1 historic and forecast data for based fixed wing aircraft are shown as developed from County population, percent of national market share, and percent of Western Pacific Regional market share. The California Aviation System Plan forecasts are also included. The TAF historical and forecast data are shown on this plate and indicate a significant number of based aircraft up until 2003, at which time it

CHAPTER 3 – AVIATION FORECASTS
Mammoth Yosemite Airport Layout Plan July 2011
3-5
dropped to eight and then by 2008 to four. TAF forecasts stay steady at four for the 20-year forecast period.
There are currently 8 aircraft based at the airport – 6 single engine propeller-driven aircraft and 2 small twin-engine propeller-drive aircraft. The number of based aircraft over the past 10 years is reported to have ranged from 6 to 8. The population of Mono County is not expected to rise significantly and the type work available in Mono County is largely service and government, which does not lead to the development of plane ownership. MMH Forecasts (Brandley) have been presented on Plate 3-1 and show an increase of 2 based aircraft over the next 20 years. It is difficult to forecast such small increases.
3-3.5.2 Annual Operations – Fixed Wing Aircraft
On Plate 3-2 historical and forecast data for annual operations of fixed wing aircraft are shown. On this graph the forecasts include those by TAF, California Aviation System Plan, percent of national market share, percent of Western Pacific Region market share, and the MMH Forecasts – Brandley. It will be noted that the TAF forecasts show 24,000 operations in the early 1990s dropping to 16,000 to 17,000 from 1994 to 2006, and then dropping to 7,405 in 2009 and continuing at that level through the forecast period to 2030. The CASP shows a gradual increase from 14,000 in 1995 to 16,000 in 2020.
The Airport Forecast begins in 2010 with the same annual operations as the TAF forecasts but increases significantly over the next 20 years to 15,000 in 2030. This increase is brought about by the introduction of the airline service and additional itinerant aircraft operations from various areas in the Western United States. Based on past experience and proposed development at the airport, they are conservative.
3-3.5.3 Enplaned Passengers and Airline Operations
Annual enplaned passenger and annual airline operation forecasts for Mammoth Yosemite Airport were prepared based on projections by Mammoth Mountain for proposed airline agreements. These forecasts are shown on Plate 3-3. On this plate the historical enplanements and forecast enplanements for comparable airports including Yampa Valley, Eagle County Regional, Aspen-Pitkin County, and Glacier Park International are also included. It will be noted that the rate of growth of airline passenger enplanements for each of these airports was essentially the same as for Mammoth Yosemite Airport, showing a rapid growth in the first five years after start of operation and then leveling off to a steady growth thereafter. The similarity of growth

CHAPTER 3 – AVIATION FORECASTS
Mammoth Yosemite Airport Layout Plan July 2011
3-6
patterns tends to validate the forecasts for annual enplanements at Mammoth Yosemite Airport.
On Plate 3-4 the annual airline operations, both historical and forecast, are presented for Mammoth Yosemite Airport and for the same comparable airports. It will again be noted that the growth curve for Mammoth Yosemite Airport parallels the growth curve for these other airports, thus validating the data for Mammoth Yosemite Airport. On Plate 3-5 the total airport operations, both historical and forecast, are presented for Mammoth Yosemite Airport and for the same comparable airports. It will be noted that the MMH growth curve is similar to that of the other airports.
3-3.5.4 Helicopters – Based Helicopters and Helicopter Operations
There are currently no based helicopters at the airport and none are forecast for this airport.
3-3.5.5 Fleet Mix
The fleet mix for the itinerant general aviation operations that exist today and are forecast to continue over the forecast period ranges from the small single-engine propeller-driven aircraft to the small twin-engine and larger twin-engine propeller driven aircraft. There are also significant numbers of jet-powered aircraft operating at the airport ranging from the small jet aircraft to the larger aircraft of the Falcon 50 and G V class. This fleet mix is expected to be maintained over the forecast period, but the number of larger aircraft with relation to the total fleet mix is expected to increase somewhat. The existing and anticipated fleet mix for the airline operations are shown in Table No. 3-1. In 2010 Alaska Airlines were flying the Q400 aircraft and United/Skywest Airlines were flying the RJ 700 aircraft. In Table No. 3-1 the type aircraft and city to be served are shown for each year through the forecast period. It is anticipated that airlines will add the Boeing 737 and the A 319 to their fleet in later years. A graphical presentation showing the anticipated annual operations for each airline aircraft is shown in Plate 3-6.
Mammoth Yosemite Airport has kept records of the number of aircraft turbine visits between 1999 and 2010. These data are presented in Plate 3-2. It will be noted that there was a steady increase from 300 to over 1,400 visits between 1999 and 2006, then a decrease through 2008 to 930, and then a continuing increase beyond that point. The growth over the forecast period is expected to be similar to the
CHAPTER 3 – AVIATION FORECASTS
Mammoth Yosemite Airport Layout Plan July 2011
3-7
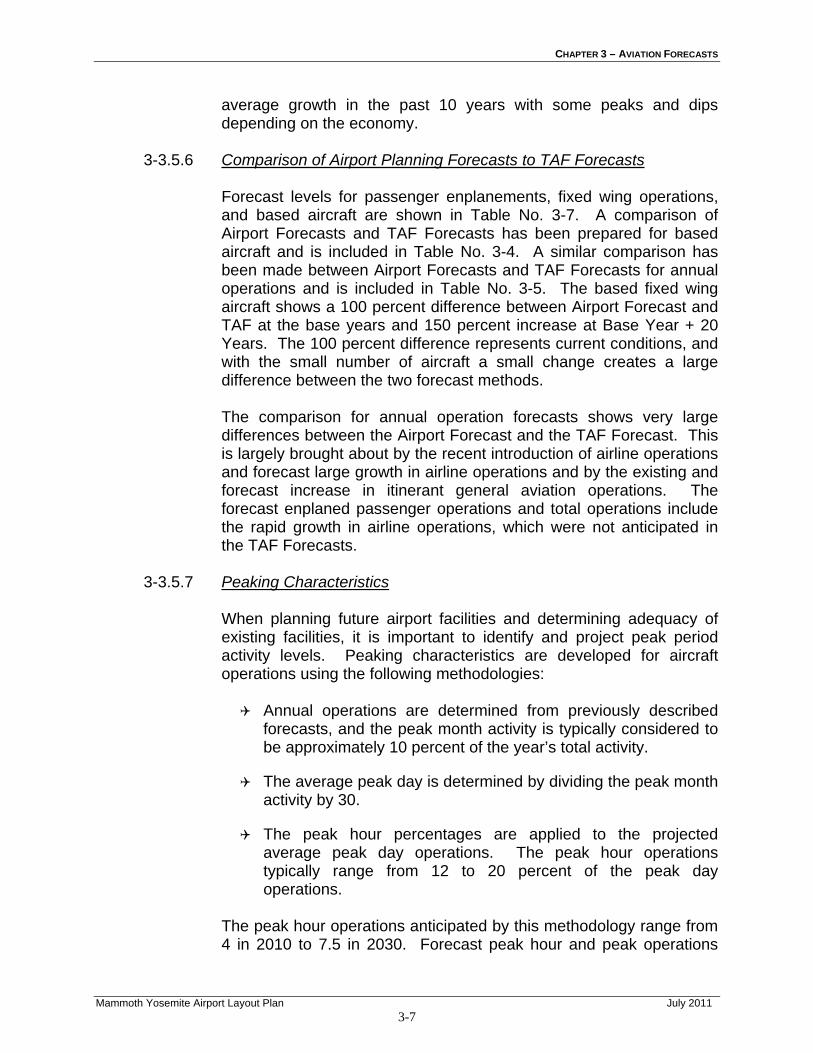
average growth in the past 10 years with some peaks and dips depending on the economy.
3-3.5.6 Comparison of Airport Planning Forecasts to TAF Forecasts
Forecast levels for passenger enplanements, fixed wing operations, and based aircraft are shown in Table No. 3-7. A comparison of Airport Forecasts and TAF Forecasts has been prepared for based aircraft and is included in Table No. 3-4. A similar comparison has been made between Airport Forecasts and TAF Forecasts for annual operations and is included in Table No. 3-5. The based fixed wing aircraft shows a 100 percent difference between Airport Forecast and TAF at the base years and 150 percent increase at Base Year + 20 Years. The 100 percent difference represents current conditions, and with the small number of aircraft a small change creates a large difference between the two forecast methods. The comparison for annual operation forecasts shows very large differences between the Airport Forecast and the TAF Forecast. This is largely brought about by the recent introduction of airline operations and forecast large growth in airline operations and by the existing and forecast increase in itinerant general aviation operations. The forecast enplaned passenger operations and total operations include the rapid growth in airline operations, which were not anticipated in the TAF Forecasts.
3-3.5.7 Peaking Characteristics
When planning future airport facilities and determining adequacy of existing facilities, it is important to identify and project peak period activity levels. Peaking characteristics are developed for aircraft operations using the following methodologies:
Annual operations are determined from previously described
forecasts, and the peak month activity is typically considered to be approximately 10 percent of the year’s total activity.
The average peak day is determined by dividing the peak month activity by 30.
The peak hour percentages are applied to the projected average peak day operations. The peak hour operations typically range from 12 to 20 percent of the peak day operations.
The peak hour operations anticipated by this methodology range from 4 in 2010 to 7.5 in 2030. Forecast peak hour and peak operations

CHAPTER 3 – AVIATION FORECASTS
Mammoth Yosemite Airport Layout Plan July 2011
3-8
indicate that the existing runway will adequately serve the forecast aircraft during the forecast period.
3-3.5.8 Design Aircraft
F.A.A. defines the design aircraft for planning purposes to be the largest aircraft group that has more than 500 operations per year. The aircraft operated by the airlines will meet this requirement and be the design aircraft. The design aircraft as of the base year 2010 will be the RJ 700 or Q400. The design aircraft after 2018 will be the B 737 or A 319.

TABLE NO. 3-1MMH Growth Plan 2008 to 2027
Early Winter/Winter Scheduled Air Service2008-09 2009-10 2010-11 2011-12 2012-13
Aircraft Total Seats Total Seats Total Seats Total Seats Total Seats
City Type Seats Airline Operations Per Season Operations Per Season Operations Per Season Operations Per Season Operations Per Season
LAX Q-400 76 QX 115 8740 115 8740 143 10868 143 10868 143 10868LAX Q-400 76 QX 115 8740 115 8740 115 8740 115 8740SNA RJ 66 TBD 0 0SAN Q-400 76 QX 0 0 115 8740 115 8740SFO RJ 66 UA 115 7590 115 7590 115 7590SFO RJ 66 UA 115 7590 115 7590SJC Q-400 76 QX 115 8740 115 8740 115 8740 115 8740SEA 737 124 AS 0 0PDX Q-400 76 QX 0 16 1216RNO Q-400 76 QX 115 8740LAS RJ 70 US 0PHX RJ 70 US 0 0 115 8050PHX RJ 70 US 0Totals 115 8740 460 34960 488 35938 718 52268 849 61534
300% 3% 45% 18%
Spring/Summer/Fall Scheduled Air Service2008-09 2009-10 2010-11 2011-12 2012-13
Aircraft Total Seats Total Seats Total Seats Total Seats Total Seats
City Type Seats Airline Operations Per Season Operations Per Season Operations Per Season Operations Per Season Operations Per Season
LAX Q-400 76 QX 173 13148 173 13148 173 13148 222 16872LAX Q-400 76 QX 82 6232 82 6232 82 6232SNA RJ 66 TBDSAN RJ 66 TBDSFO RJ 66 UA 82 5412 82 5412SFO RJ 66 UASJC Q-400 76 QXSEA 737 124 ASPDX Q-400 76 QXRNO Q-400 76 QXLAS RJ 70 USPHX RJ 70 US 0 0PHX RJ 70 USTotals 0 0 173 13148 255 19380 337 24792 386 28516
47% 28% 15%
Total Year Round Scheduled Air Service2008-09 2009-10 2010-11 2011-12 2012-13
Aircraft Total Seats Total Seats Total Seats Total Seats Total Seats
City Type Seats Airline Operations Per Season Operations Per Season Operations Per Season Operations Per Season Operations Per Season
LAX Q-400 76 QX 115 8740 288 21888 316 24016 316 24016 365 27740LAX Q-400 76 QX 115 8740 197 14972 197 14972 197 14972SNA RJ 66 TBD 0 0SAN Q-400 76 QX 115 8740 115 8740 115 8740SFO RJ 66 UA 115 7590 197 13002 197 13002SFO RJ 66 UA 115 7590 115 7590SJC Q-400 76 QX 115 8740 115 8740 115 8740 115 8740SEA 737 124 AS 0 0PDX Q-400 76 QX 0 0 16 1216RNO Q-400 76 QX 115 8740 0LAS RJ 70 US 0 0PHX RJ 70 US 0 0 115 8050PHX RJ 70 US 0 0Totals 115 8740 633 48108 858 64058 1055 77060 1235 90050
450% 33% 20% 17%Season Days Dates Season Days
Winter Season 115 Dec 17 to April 10 Winter Season 115
Spring/Summer Season 173 April 10 to Sept 30 Spring/Summer Season 173
Fall Season 49 Oct 1 to Nov 18 Fall Season 49
Early Winter Season 28 Nov 19 to Dec 16 Early Winter Season 28
Summer only 82 June 15 to Sept 4 Totals 365
Seasonal day counts will vary some from year to year
Ops Seasons and Days Ops Seasons and Days Ops Seasons and Days
16 Winter - One Weekend Day only 115 Winter Daily 173 Spring Summer Daily
28 Early Winter 131 Winter Daily + One Weekend Day 197 Winter Daily +Summer only
32 Winter - Two Weekend Days 143 Early Winter + Winter Daily 222 Spring Summer and Fall Daily
82 Summer Daily 147 Winter Daily + Two Weekend Days 230 Winter 2X Daily
3-9

TABLE NO. 3-1MMH Growth Plan 2008 to 2027
Early Winter/Winter Scheduled Air Service2013-14 2014-15 2015-16 2016-17 2017-18
Aircraft Total Seats Total Seats Total Seats Total Seats Total Seats
City Type Seats Airline Operations Per Season Operations Per Season Operations Per Season Operations Per Season Operations Per Season
LAX Q-400 76 QX 143 10868 143 10868 143 10868 143 10868 143 10868LAX Q-400 76 QX 115 8740 115 8740 115 8740 115 8740 115 8740SNA RJ 66 TBD 115 7590 115 7590 115 7590 115 7590 115 7590SAN Q-400 76 TBD 115 8740 115 8740 115 8740 115 8740 115 8740SFO RJ 66 UA 115 7590 115 7590 115 7590 115 7590 115 7590SFO A319 124 UA 0 0 32 3968 48 5952 48 5952 115 14260DEN A319 124 UA 0 0 0 0 16 1984 32 3968SJC Q-400 76 QX 143 10868 143 10868 143 10868 143 10868 143 10868SEA 737 124 AS 16 1984 16 1984 32 3968 32 3968 32 3968PDX Q-400 76 QX 32 2432 115 8740 115 8740 131 9956 131 9956LAS RJ 70 US 0 0 0 0 0 115 8050 115 8050PHX RJ 70 US 115 8050 115 8050 115 8050 115 8050 115 8050PHX RJ 70 US 16 1120 32 2240 115 8050 131 9170 147 10290Totals 61534 925 67982 1056 79378 1171 89156 1334 101526 1433 112938
10% 17% 12% 14% 11%
Spring/Summer/Fall Scheduled Air Service2013-14 2014-15 2015-16 2016-17 2017-18
Aircraft Total Seats Total Seats Total Seats Total Seats Total Seats
City Type Seats Airline Operations Per Season Operations Per Season Operations Per Season Operations Per Season Operations Per Season
LAX Q-400 76 QX 222 16872 222 16872 222 16872 222 16872 222 16872LAX Q-400 76 QX 82 6232 82 6232 82 6232 82 6232 82 6232SNA RJ 66 TBD 0 0 0 0 0 0 82 5412SAN RJ 66 TBD 0 0 82 5412 82 5412SFO RJ 66 UA 82 5412 82 5412 82 5412 82 5412 82 5412SFO RJ 66 UA 82 5412 82 5412 82 5412 82 5412DEN A319 70 UASJC Q-400 76 QX 0 0 0 0 0 0 0 0SEA 737 124 ASPDX Q-400 76 QXLAS RJ 70 US 0 0 0 82 5740 82 5740 82 5740PHX RJ 70 US 82 5740 82 5740 82 5740 82 5740 82 5740PHX RJ 70 USTotals 28516 468 34256 550 39668 632 45408 714 50820 796 56232
20% 16% 14% 12% 11%
Total Year Round Scheduled Air Service2013-14 2014-15 2015-16 2016-17 2017-18
Aircraft Total Seats Total Seats Total Seats Total Seats Total Seats
City Type Seats Airline Operations Per Season Operations Per Season Operations Per Season Operations Per Season Operations Per Season
LAX Q-400 76 QX 365 27740 365 27740 365 27740 365 27740 365 27740LAX Q-400 76 QX 197 14972 197 14972 197 14972 197 14972 197 14972SNA RJ 66 TBD 115 7590 115 7590 115 7590 115 7590 197 13002SAN RJ 66 TBD 115 8740 115 8740 115 8740 197 14152 197 14152SFO RJ 66 UA 197 13002 197 13002 197 13002 197 13002 197 13002SFO MIX 66 UA 0 0 114 9380 130 11364 130 11364 197 19672DEN A319 70 UA 0 0 0 0 0 0 16 1984 32 3968SJC Q-400 76 QX 143 10868 143 10868 143 10868 143 10868 143 10868SEA 737 124 AS 16 1984 16 1984 32 3968 32 3968 32 3968PDX Q-400 76 QX 16 2432 32 8740 48 8740 131 9956 131 9956LAS RJ 70 US 0 0 0 0 82 5740 197 13790 197 13790PHX RJ 70 US 197 13790 197 13790 197 13790 197 13790 197 13790PHX RJ 70 US 16 1120 32 2240 115 8050 131 9170 147 10290Totals 90050 1377 102238 1523 119046 1736 134564 2048 152346 2229 169170
14% 16% 13% 13% 11%Season Days Dates Season Days
Winter Season 115 Dec 17 to April 10 Winter Season 115
Spring/Summer Season 173 April 10 to Sept 30 Spring/Summer Season 173
Fall Season 49 Oct 1 to Nov 18 Fall Season 49
Early Winter Season 28 Nov 19 to Dec 16 Early Winter Season 28
Summer only 82 June 15 to Sept 4 Totals 365
Seasonal day counts will vary some from year to year
Ops Seasons and Days Ops Seasons and Days Ops Seasons and Days
16 Winter - One Weekend Day only 115 Winter Daily 173 Spring Summer Daily
28 Early Winter 131 Winter Daily + One Weekend Day 197 Winter Daily +Summer only
32 Winter - Two Weekend Days 143 Early Winter + Winter Daily 222 Spring Summer and Fall Daily
82 Summer Daily 147 Winter Daily + Two Weekend Days 230 Winter 2X Daily
3-10
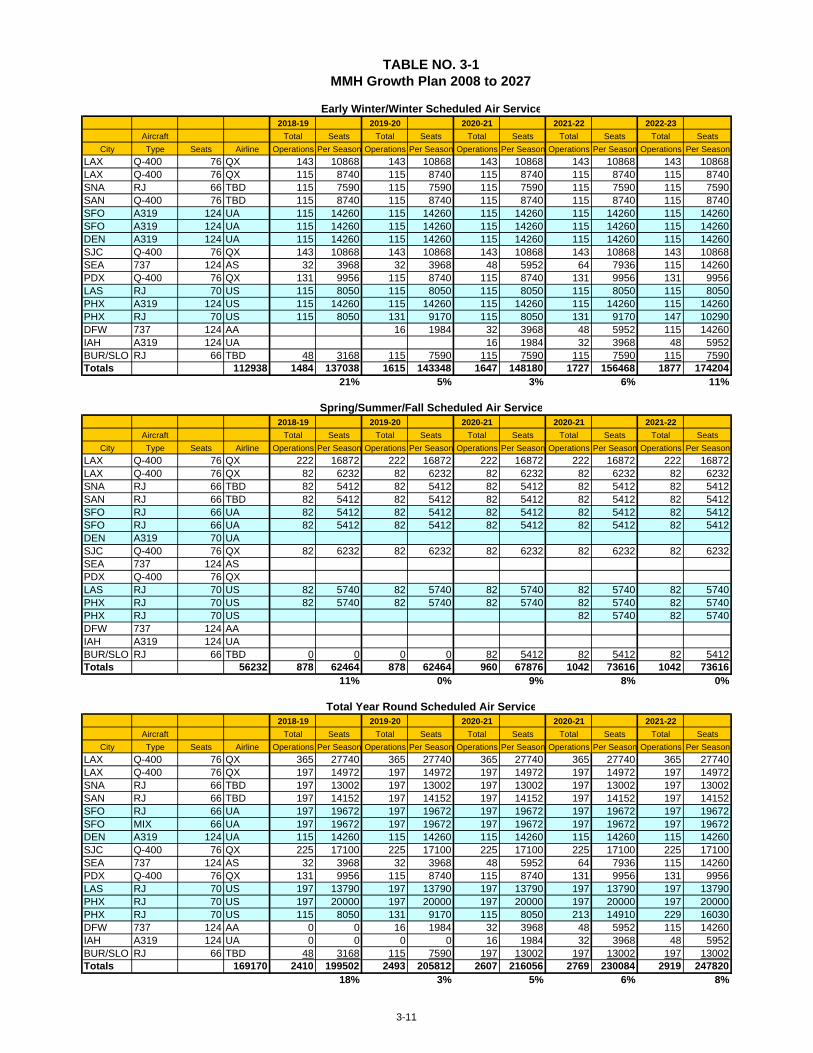
TABLE NO. 3-1MMH Growth Plan 2008 to 2027
Early Winter/Winter Scheduled Air Service2018-19 2019-20 2020-21 2021-22 2022-23
Aircraft Total Seats Total Seats Total Seats Total Seats Total Seats
City Type Seats Airline Operations Per Season Operations Per Season Operations Per Season Operations Per Season Operations Per Season
LAX Q-400 76 QX 143 10868 143 10868 143 10868 143 10868 143 10868LAX Q-400 76 QX 115 8740 115 8740 115 8740 115 8740 115 8740SNA RJ 66 TBD 115 7590 115 7590 115 7590 115 7590 115 7590SAN Q-400 76 TBD 115 8740 115 8740 115 8740 115 8740 115 8740SFO A319 124 UA 115 14260 115 14260 115 14260 115 14260 115 14260SFO A319 124 UA 115 14260 115 14260 115 14260 115 14260 115 14260DEN A319 124 UA 115 14260 115 14260 115 14260 115 14260 115 14260SJC Q-400 76 QX 143 10868 143 10868 143 10868 143 10868 143 10868SEA 737 124 AS 32 3968 32 3968 48 5952 64 7936 115 14260PDX Q-400 76 QX 131 9956 115 8740 115 8740 131 9956 131 9956LAS RJ 70 US 115 8050 115 8050 115 8050 115 8050 115 8050PHX A319 124 US 115 14260 115 14260 115 14260 115 14260 115 14260PHX RJ 70 US 115 8050 131 9170 115 8050 131 9170 147 10290DFW 737 124 AA 16 1984 32 3968 48 5952 115 14260IAH A319 124 UA 16 1984 32 3968 48 5952BUR/SLO RJ 66 TBD 48 3168 115 7590 115 7590 115 7590 115 7590Totals 112938 1484 137038 1615 143348 1647 148180 1727 156468 1877 174204
21% 5% 3% 6% 11%
Spring/Summer/Fall Scheduled Air Service2018-19 2019-20 2020-21 2020-21 2021-22
Aircraft Total Seats Total Seats Total Seats Total Seats Total Seats
City Type Seats Airline Operations Per Season Operations Per Season Operations Per Season Operations Per Season Operations Per Season
LAX Q-400 76 QX 222 16872 222 16872 222 16872 222 16872 222 16872LAX Q-400 76 QX 82 6232 82 6232 82 6232 82 6232 82 6232SNA RJ 66 TBD 82 5412 82 5412 82 5412 82 5412 82 5412SAN RJ 66 TBD 82 5412 82 5412 82 5412 82 5412 82 5412SFO RJ 66 UA 82 5412 82 5412 82 5412 82 5412 82 5412SFO RJ 66 UA 82 5412 82 5412 82 5412 82 5412 82 5412DEN A319 70 UASJC Q-400 76 QX 82 6232 82 6232 82 6232 82 6232 82 6232SEA 737 124 ASPDX Q-400 76 QXLAS RJ 70 US 82 5740 82 5740 82 5740 82 5740 82 5740PHX RJ 70 US 82 5740 82 5740 82 5740 82 5740 82 5740PHX RJ 70 US 82 5740 82 5740DFW 737 124 AAIAH A319 124 UABUR/SLO RJ 66 TBD 0 0 0 0 82 5412 82 5412 82 5412Totals 56232 878 62464 878 62464 960 67876 1042 73616 1042 73616
11% 0% 9% 8% 0%
Total Year Round Scheduled Air Service2018-19 2019-20 2020-21 2020-21 2021-22
Aircraft Total Seats Total Seats Total Seats Total Seats Total Seats
City Type Seats Airline Operations Per Season Operations Per Season Operations Per Season Operations Per Season Operations Per Season
LAX Q-400 76 QX 365 27740 365 27740 365 27740 365 27740 365 27740LAX Q-400 76 QX 197 14972 197 14972 197 14972 197 14972 197 14972SNA RJ 66 TBD 197 13002 197 13002 197 13002 197 13002 197 13002SAN RJ 66 TBD 197 14152 197 14152 197 14152 197 14152 197 14152SFO RJ 66 UA 197 19672 197 19672 197 19672 197 19672 197 19672SFO MIX 66 UA 197 19672 197 19672 197 19672 197 19672 197 19672DEN A319 124 UA 115 14260 115 14260 115 14260 115 14260 115 14260SJC Q-400 76 QX 225 17100 225 17100 225 17100 225 17100 225 17100SEA 737 124 AS 32 3968 32 3968 48 5952 64 7936 115 14260PDX Q-400 76 QX 131 9956 115 8740 115 8740 131 9956 131 9956LAS RJ 70 US 197 13790 197 13790 197 13790 197 13790 197 13790PHX RJ 70 US 197 20000 197 20000 197 20000 197 20000 197 20000PHX RJ 70 US 115 8050 131 9170 115 8050 213 14910 229 16030DFW 737 124 AA 0 0 16 1984 32 3968 48 5952 115 14260IAH A319 124 UA 0 0 0 0 16 1984 32 3968 48 5952BUR/SLO RJ 66 TBD 48 3168 115 7590 197 13002 197 13002 197 13002Totals 169170 2410 199502 2493 205812 2607 216056 2769 230084 2919 247820
18% 3% 5% 6% 8%
3-11

TABLE NO. 3-1MMH Growth Plan 2008 to 2027
Early Winter/Winter Scheduled Air Service2023-24 2024-25 2025-26 2026-27 2027-28
Aircraft Total Seats Total Seats Total Seats Total Seats Total Seats
City Type Seats Airline Operations Per Season Operations Per Season Operations Per Season Operations Per Season Operations Per Season
LAX Q-400 76 QX 143 10868 143 10868 143 10868 143 10868 143 10868LAX Q-400 76 QX 115 8740 115 8740 115 8740 115 8740 115 8740SNA RJ 66 TBD 115 7590 115 7590 115 7590 115 7590 115 7590SAN Q-400 76 TBD 115 8740 115 8740 115 8740 115 8740 115 8740SFO A319 124 UA 115 14260 115 14260 115 14260 115 14260 115 14260SFO A319 124 UA 115 14260 115 14260 115 14260 115 14260 115 14260DEN A319 124 UA 115 14260 115 14260 115 14260 115 14260 115 14260SJC Q-400 76 QX 143 10868 143 10868 143 10868 143 10868 143 10868SEA 737 124 AS 115 14260 115 14260 115 14260 115 14260 115 14260PDX Q-400 76 QX 131 9956 131 9956 131 9956 131 9956 131 9956LAS RJ 70 US 115 8050 115 8050 115 8050 115 8050 115 8050PHX A319 124 US 115 14260 115 14260 115 14260 115 14260 115 14260PHX RJ 70 US 147 10290 147 10290 147 10290 147 10290 147 10290DFW 737 124 AA 115 14260 115 14260 115 14260 115 14260 115 14260IAH A319 124 UA 48 5952 48 5952 48 5952 48 5952 48 5952BUR/SLORJ 66 TBD 115 7590 115 7590 115 7590 115 7590 115 7590Totals 174204 1877 174204 1877 174204 1877 174204 1877 174204 1877 174204
0% 0% 0% 0% 0%
Spring/Summer/Fall Scheduled Air Service2023-24 2024-25 2025-26 2026-27 2027-28
Aircraft Total Seats Total Seats Total Seats Total Seats Total Seats
City Type Seats Airline Operations Per Season Operations Per Season Operations Per Season Operations Per Season Operations Per Season
LAX Q-400 76 QX 222 16872 222 16872 222 16872 222 16872 222 16872LAX Q-400 76 QX 82 6232 82 6232 82 6232 82 6232 82 6232SNA RJ 66 TBD 82 5412 82 5412 82 5412 82 5412 82 5412SAN RJ 66 TBD 82 5412 82 5412 82 5412 82 5412 82 5412SFO RJ 66 UA 82 5412 82 5412 82 5412 82 5412 82 5412SFO RJ 66 UA 82 5412 82 5412 82 5412 82 5412 82 5412DEN A319 70 UA 0SJC Q-400 76 QX 82 6232 82 6232 82 6232 82 6232 82 6232SEA 737 124 AS 0PDX Q-400 76 QX 0LAS RJ 70 US 82 5740 82 5740 82 5740 82 5740 82 5740PHX RJ 70 US 82 5740 82 5740 82 5740 82 5740 82 5740PHX RJ 70 US 82 5740 82 5740 82 5740 82 5740 82 5740DFW 737 124 AA 0IAH A319 124 UA 0BUR/SLORJ 66 TBD 82 5412 82 5412 82 5412 82 5412 82 5412Totals 73616 1042 73616 1042 73616 1042 73616 1042 73616 1042 73616
0% 0% 0% 0% 0%
Total Year Round Scheduled Air Service2023-24 2024-25 2025-26 2026-27 2027-28
Aircraft Total Seats Total Seats Total Seats Total Seats Total Seats
City Type Seats Airline Operations Per Season Operations Per Season Operations Per Season Operations Per Season Operations Per Season
LAX Q-400 76 QX 365 27740 365 27740 365 27740 365 27740 365 27740LAX Q-400 76 QX 197 14972 197 14972 197 14972 197 14972 197 14972SNA RJ 66 TBD 197 13002 197 13002 197 13002 197 13002 197 13002SAN RJ 66 TBD 197 14152 197 14152 197 14152 197 14152 197 14152SFO RJ 66 UA 197 19672 197 19672 197 19672 197 19672 197 19672SFO MIX 66 UA 197 19672 197 19672 197 19672 197 19672 197 19672DEN A319 124 UA 115 14260 115 14260 115 14260 115 14260 115 14260SJC Q-400 76 QX 225 17100 225 17100 225 17100 225 17100 225 17100SEA 737 124 AS 115 14260 115 14260 115 14260 115 14260 115 14260PDX Q-400 76 QX 131 9956 131 9956 131 9956 131 9956 131 9956LAS RJ 70 US 197 13790 197 13790 197 13790 197 13790 197 13790PHX RJ 70 US 197 20000 197 20000 197 20000 197 20000 197 20000PHX RJ 70 US 229 16030 229 16030 229 16030 229 16030 229 16030DFW 737 124 AA 115 14260 115 14260 115 14260 115 14260 115 14260IAH A319 124 UA 48 5952 48 5952 48 5952 48 5952 48 5952BUR/SLORJ 66 TBD 197 13002 197 13002 197 13002 197 13002 197 13002Totals 247820 2919 247820 2919 247820 2919 247820 2919 247820 2919 247820
0% 0% 0% 0% 0%
3-12
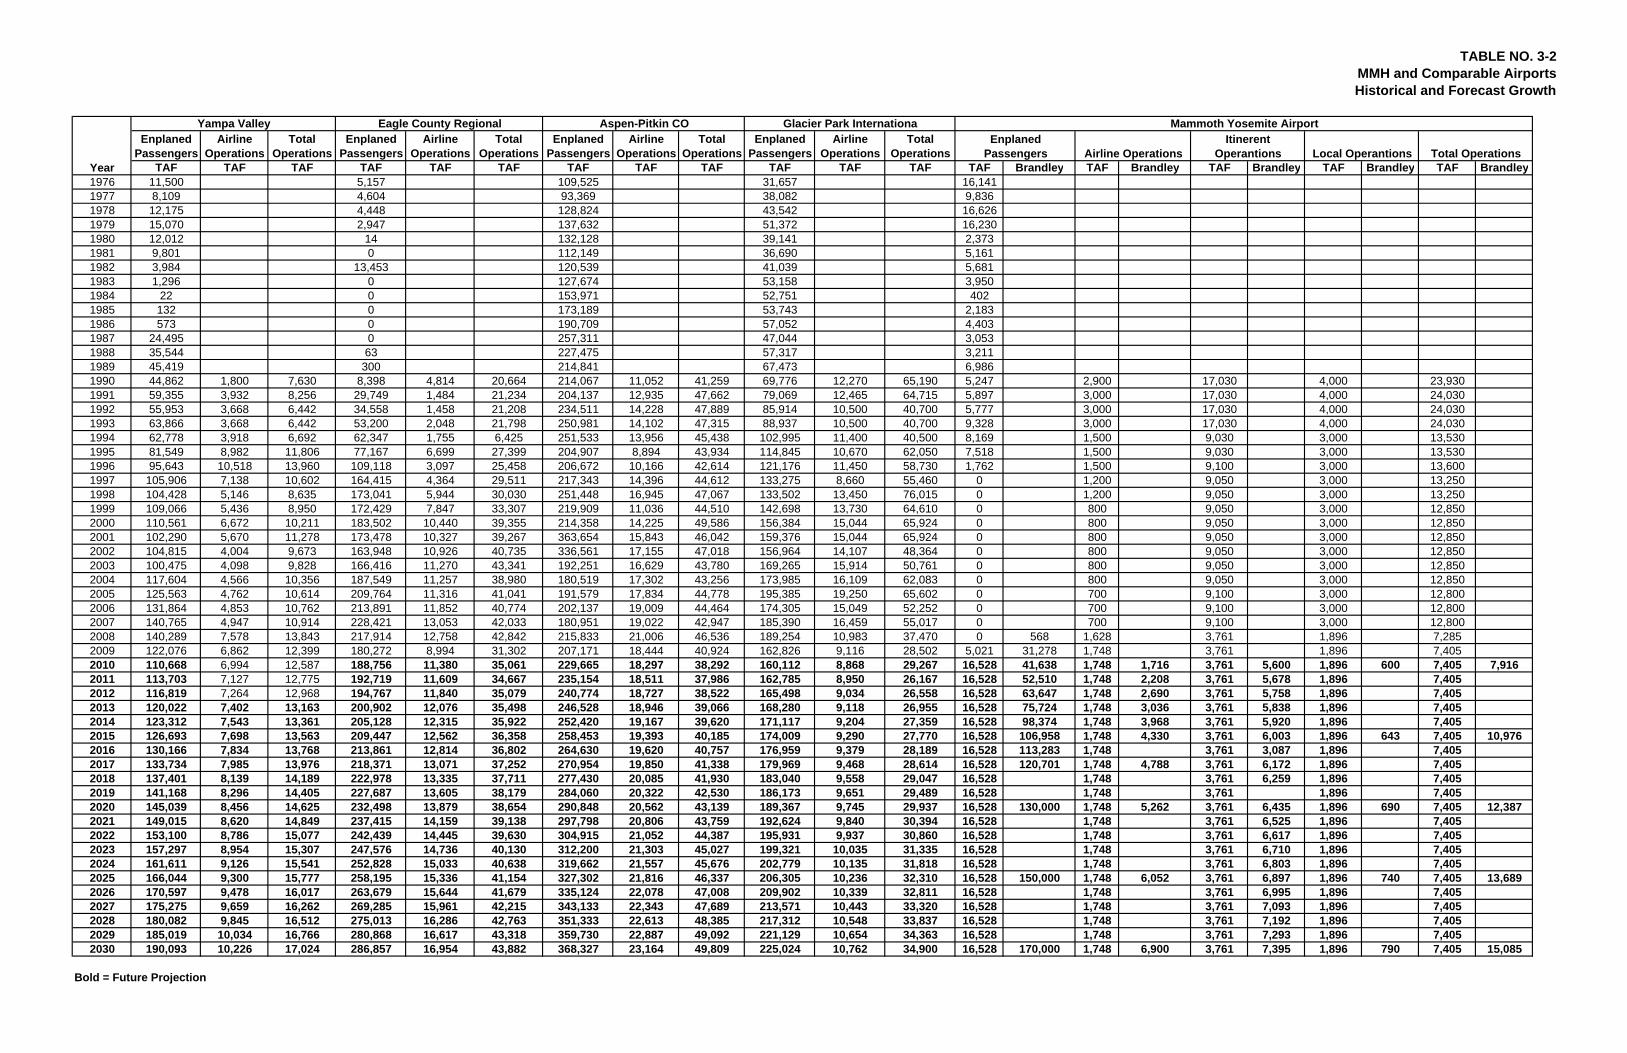
TABLE NO. 3-2MMH and Comparable AirportsHistorical and Forecast Growth
Enplaned Passengers
Airline Operations
Total Operations
Enplaned Passengers
Airline Operations
Total Operations
Enplaned Passengers
Airline Operations
Total Operations
Enplaned Passengers
Airline Operations
Total Operations
TAF TAF TAF TAF TAF TAF TAF TAF TAF TAF TAF TAF TAF Brandley TAF Brandley TAF Brandley TAF Brandley TAF Brandley1976 11,500 5,157 109,525 31,657 16,1411977 8,109 4,604 93,369 38,082 9,8361978 12,175 4,448 128,824 43,542 16,6261979 15,070 2,947 137,632 51,372 16,2301980 12,012 14 132,128 39,141 2,3731981 9,801 0 112,149 36,690 5,1611982 3,984 13,453 120,539 41,039 5,6811983 1,296 0 127,674 53,158 3,9501984 22 0 153,971 52,751 4021985 132 0 173,189 53,743 2,1831986 573 0 190,709 57,052 4,4031987 24,495 0 257,311 47,044 3,0531988 35,544 63 227,475 57,317 3,2111989 45,419 300 214,841 67,473 6,9861990 44,862 1,800 7,630 8,398 4,814 20,664 214,067 11,052 41,259 69,776 12,270 65,190 5,247 2,900 17,030 4,000 23,9301991 59,355 3,932 8,256 29,749 1,484 21,234 204,137 12,935 47,662 79,069 12,465 64,715 5,897 3,000 17,030 4,000 24,0301992 55,953 3,668 6,442 34,558 1,458 21,208 234,511 14,228 47,889 85,914 10,500 40,700 5,777 3,000 17,030 4,000 24,0301993 63,866 3,668 6,442 53,200 2,048 21,798 250,981 14,102 47,315 88,937 10,500 40,700 9,328 3,000 17,030 4,000 24,0301994 62,778 3,918 6,692 62,347 1,755 6,425 251,533 13,956 45,438 102,995 11,400 40,500 8,169 1,500 9,030 3,000 13,5301995 81,549 8,982 11,806 77,167 6,699 27,399 204,907 8,894 43,934 114,845 10,670 62,050 7,518 1,500 9,030 3,000 13,5301996 95,643 10,518 13,960 109,118 3,097 25,458 206,672 10,166 42,614 121,176 11,450 58,730 1,762 1,500 9,100 3,000 13,6001997 105,906 7,138 10,602 164,415 4,364 29,511 217,343 14,396 44,612 133,275 8,660 55,460 0 1,200 9,050 3,000 13,2501998 104,428 5,146 8,635 173,041 5,944 30,030 251,448 16,945 47,067 133,502 13,450 76,015 0 1,200 9,050 3,000 13,2501999 109,066 5,436 8,950 172,429 7,847 33,307 219,909 11,036 44,510 142,698 13,730 64,610 0 800 9,050 3,000 12,8502000 110,561 6,672 10,211 183,502 10,440 39,355 214,358 14,225 49,586 156,384 15,044 65,924 0 800 9,050 3,000 12,8502001 102,290 5,670 11,278 173,478 10,327 39,267 363,654 15,843 46,042 159,376 15,044 65,924 0 800 9,050 3,000 12,8502002 104,815 4,004 9,673 163,948 10,926 40,735 336,561 17,155 47,018 156,964 14,107 48,364 0 800 9,050 3,000 12,8502003 100,475 4,098 9,828 166,416 11,270 43,341 192,251 16,629 43,780 169,265 15,914 50,761 0 800 9,050 3,000 12,8502004 117,604 4,566 10,356 187,549 11,257 38,980 180,519 17,302 43,256 173,985 16,109 62,083 0 800 9,050 3,000 12,8502005 125,563 4,762 10,614 209,764 11,316 41,041 191,579 17,834 44,778 195,385 19,250 65,602 0 700 9,100 3,000 12,8002006 131,864 4,853 10,762 213,891 11,852 40,774 202,137 19,009 44,464 174,305 15,049 52,252 0 700 9,100 3,000 12,8002007 140,765 4,947 10,914 228,421 13,053 42,033 180,951 19,022 42,947 185,390 16,459 55,017 0 700 9,100 3,000 12,8002008 140,289 7,578 13,843 217,914 12,758 42,842 215,833 21,006 46,536 189,254 10,983 37,470 0 568 1,628 3,761 1,896 7,2852009 122,076 6,862 12,399 180,272 8,994 31,302 207,171 18,444 40,924 162,826 9,116 28,502 5,021 31,278 1,748 3,761 1,896 7,4052010 110,668 6,994 12,587 188,756 11,380 35,061 229,665 18,297 38,292 160,112 8,868 29,267 16,528 41,638 1,748 1,716 3,761 5,600 1,896 600 7,405 7,9162011 113,703 7,127 12,775 192,719 11,609 34,667 235,154 18,511 37,986 162,785 8,950 26,167 16,528 52,510 1,748 2,208 3,761 5,678 1,896 7,4052012 116,819 7,264 12,968 194,767 11,840 35,079 240,774 18,727 38,522 165,498 9,034 26,558 16,528 63,647 1,748 2,690 3,761 5,758 1,896 7,4052013 120,022 7,402 13,163 200,902 12,076 35,498 246,528 18,946 39,066 168,280 9,118 26,955 16,528 75,724 1,748 3,036 3,761 5,838 1,896 7,4052014 123,312 7,543 13,361 205,128 12,315 35,922 252,420 19,167 39,620 171,117 9,204 27,359 16,528 98,374 1,748 3,968 3,761 5,920 1,896 7,4052015 126,693 7,698 13,563 209,447 12,562 36,358 258,453 19,393 40,185 174,009 9,290 27,770 16,528 106,958 1,748 4,330 3,761 6,003 1,896 643 7,405 10,9762016 130,166 7,834 13,768 213,861 12,814 36,802 264,630 19,620 40,757 176,959 9,379 28,189 16,528 113,283 1,748 3,761 3,087 1,896 7,4052017 133,734 7,985 13,976 218,371 13,071 37,252 270,954 19,850 41,338 179,969 9,468 28,614 16,528 120,701 1,748 4,788 3,761 6,172 1,896 7,4052018 137,401 8,139 14,189 222,978 13,335 37,711 277,430 20,085 41,930 183,040 9,558 29,047 16,528 1,748 3,761 6,259 1,896 7,4052019 141,168 8,296 14,405 227,687 13,605 38,179 284,060 20,322 42,530 186,173 9,651 29,489 16,528 1,748 3,761 1,896 7,4052020 145,039 8,456 14,625 232,498 13,879 38,654 290,848 20,562 43,139 189,367 9,745 29,937 16,528 130,000 1,748 5,262 3,761 6,435 1,896 690 7,405 12,3872021 149,015 8,620 14,849 237,415 14,159 39,138 297,798 20,806 43,759 192,624 9,840 30,394 16,528 1,748 3,761 6,525 1,896 7,4052022 153,100 8,786 15,077 242,439 14,445 39,630 304,915 21,052 44,387 195,931 9,937 30,860 16,528 1,748 3,761 6,617 1,896 7,4052023 157,297 8,954 15,307 247,576 14,736 40,130 312,200 21,303 45,027 199,321 10,035 31,335 16,528 1,748 3,761 6,710 1,896 7,4052024 161,611 9,126 15,541 252,828 15,033 40,638 319,662 21,557 45,676 202,779 10,135 31,818 16,528 1,748 3,761 6,803 1,896 7,4052025 166,044 9,300 15,777 258,195 15,336 41,154 327,302 21,816 46,337 206,305 10,236 32,310 16,528 150,000 1,748 6,052 3,761 6,897 1,896 740 7,405 13,6892026 170,597 9,478 16,017 263,679 15,644 41,679 335,124 22,078 47,008 209,902 10,339 32,811 16,528 1,748 3,761 6,995 1,896 7,4052027 175,275 9,659 16,262 269,285 15,961 42,215 343,133 22,343 47,689 213,571 10,443 33,320 16,528 1,748 3,761 7,093 1,896 7,4052028 180,082 9,845 16,512 275,013 16,286 42,763 351,333 22,613 48,385 217,312 10,548 33,837 16,528 1,748 3,761 7,192 1,896 7,4052029 185,019 10,034 16,766 280,868 16,617 43,318 359,730 22,887 49,092 221,129 10,654 34,363 16,528 1,748 3,761 7,293 1,896 7,4052030 190,093 10,226 17,024 286,857 16,954 43,882 368,327 23,164 49,809 225,024 10,762 34,900 16,528 170,000 1,748 6,900 3,761 7,395 1,896 790 7,405 15,085
Bold = Future Projection
Total Operations
Mammoth Yosemite AirportAspen-Pitkin CO Glacier Park InternationaItinerent
Operantions Local OperantionsEnplaned
Passengers Airline OperationsYear
Yampa Valley Eagle County Regional

CHAPTER 3 – AVIATION FORECASTS
Mammoth Yosemite Airport Layout Plan July 2011
3-14
Base Yr. Level Base Yr. + 1 Yr. Base Yr. + 5 Yrs. Base Yr. + 10 Yrs.Base Yr. + 15 Yrs. Base Yr. to +20Passenger Enplanements Air Carrier 35,000 45,000 107,000 130,000 160,000 180,000 Commuter 0 0 0 0 0 0 TOTAL 35,000 45,000 107,000 130,000 160,000 180,000Operations - Fixed Wing Itinerant Air carrier 1,716 2,110 3,400 5,100 5,900 6,800 Commuter/air taxi 0 0 0 0 0 0 Total Commercial Operations 1,716 2,110 3,400 5,100 5,900 6,800 General aviation 5,880 5,990 7,080 7,300 7,540 7,900 Military 0 0 0 0 0 0 Local General aviation 320 320 320 360 360 400 Military 0 0 0 0 0 0 TOTAL OPERATIONS 7,916 8,420 10,800 12,760 13,800 15,100Instrument Operations 2.9 3.0 3.5 6.4 6.9 7.5Peak Hour Operations 0 0 0 0 0 0Cargo/mail (enplaned + deplaned tons)Based Aircraft - Fixed Wing Single Engine (Nonjet) 6 6 6 7 7 8 Multi Engine (Nonjet) 2 2 2 2 2 2 Jet Engine 0 0 0 0 0 0 Other 0 0 0 0 0 0 TOTAL 8 8 8 9 9 10Helicopter* Based helicopters 0 0 0 0 0 0 Helicopter operations 0 0 0 0 0 0TAF Total OperationsTAF Based Aircraft
Base Yr. Level Base Yr. + 1 Yr. Base Yr. + 5 Yrs. Base Yr. + 10 Yrs.Base Yr. + 15 Yrs. Base Yr. to +20 Base Yr. to +5Average aircraft size (seats) Air carrier 76 76 76 84 90 83 76 Commuter 0 0 0 0 0 0 0 Air taxi 0 0 0 0 0 0 0Average enplaning load factor 54 56 61 61 61 57.5 57.5 Air carrier 54 56 61 61 61 57.5 57.5 Commuter 0 0 0 0 0 0 0 Air taxi 0 0 0 0 0 0 0GA operations per based aircraft
Sources: F.A.A. Terminal Area Forecasts (TAF) Mammoth Yosemite AirportPrepared by: Reinard W. Brandley, Consulting Airport Engineer
Table No. 3-3MMH Summarization and Documentation of Airport Planning Forecasts
Average Annual
*Note: Helicopter based and operations are not included in data for total operations.
Annual Operations
A. Forecast LevelsBase Year: 2010
B. Operational Factors

CHAPTER 3 – AVIATION FORECASTS
Mammoth Yosemite Airport Layout Plan July 2011
3-15
TAFTotal Based Aircraft - Fixed Wing Base yr. - 2010 2010 8 4 100.0 Base yr. + 5 yrs. 2015 8 4 100.0 Base yr. + 10 yrs. 2020 9 4 125.0 Base yr. + 15 yrs. 2025 9 4 125.0 Base yr. + 20 yrs. 2030 10 4 150.0
Note: TAF data is on a U.S. government fiscal year basis (October through September).
Reason for discrepancy: 1. TAF assumed no increase in forecast annual operations since 1995. 2. Normal growth of airport operations expected to relate to population and employment growth.
Sources: F.A.A. Terminal Area Forecasts (TAF) Mammoth Yosemite Airport (MMH)
Prepared by: Reinard W. Brandley, Consulting Airport Engineer
YearAirport
ForecastAF/TAF (% Difference)
Table No. 3-4
of Based Fixed Wing Aircraft
Mammoth Yosemite Airport (MMH)Comparison of Airport Planning and TAF Forecasts

CHAPTER 3 – AVIATION FORECASTS
Mammoth Yosemite Airport Layout Plan July 2011
3-16
TAFPassenger Enplanements Base yr. - 2010 2010 35,000 16,528 212 Base yr. + 5 yrs. 2015 107,000 16,528 647 Base yr. + 10 yrs. 2020 130,000 16,528 787 Base yr. + 15 yrs. 2025 160,000 16,528 968
Commercial Operations Base yr. - 2010 2010 1,716 120 1,430 Base yr. + 5 yrs. 2015 3,400 120 2,833 Base yr. + 10 yrs. 2020 5,100 120 4,250 Base yr. + 15 yrs. 2025 5,900 120 4,917
Total Operations Base yr. - 2010 2010 7,916 7,405 107 Base yr. + 5 yrs. 2015 10,800 7,405 146 Base yr. + 10 yrs. 2020 12,760 7,405 172 Base yr. + 15 yrs. 2025 13,800 7,405 186 Base yr. + 20 yrs. 2030 15,100 7,405 204
Note: TAF data is on a U.S. government fiscal year basis (October through September).
Reason for discrepancy: 1. TAF assumed no increase in forecast annual operations since 1995. 2. Normal growth of airport operations expected to relate to population and employment growth.
Sources: F.A.A. Terminal Area Forecasts (TAF) Mammoth Yosemite Airport (MMH)
Prepared by: Reinard W. Brandley, Consulting Airport Engineer
Airport ForecastYear
AF/TAF (% Difference)
Table No. 3-5
of Annual Operations - Fixed Wing Aircraft
Mammoth Yosemite Airport (MMH)Comparison of Airport Planning and TAF Forecasts