Embed Size (px)
Citation preview

ENVIRONMENTAL EDUCATION AND PERCEPTIONS IN EASTERN NEPAL:
ANALYSIS OF STUDENT DRAWINGS
By
Sara D. Keinath
Submitted in partial fulfillment of the requirements for the degree of Master of Science in Forestry
Michigan Technological University 2004

ii
The project paper: “Environmental Education and Perceptions in Eastern Nepal: Analysis
of Student Drawings” is hereby approved in partial fulfillment of the requirement for the
Degree of MASTER OF SCIENCE IN FORESTRY.
School of Forest Resources and Environmental Science
Signatures
Advisor: __________________________________
Blair D. Orr
Dean: __________________________________
Margaret R. Gale
Date: __________________________________

iii
TABLE OF CONTENTS LIST OF FIGURES ACKNOWLEDGEMENTS
iv vi
CHAPTER 1 INTRODUCTION CHAPTER 2 NEPAL Geography and Climate People and Culture Agriculture-based Economy History and Current Situation Education System
1 5 14 19 22 26
CHAPTER 3 STUDY AREA: MECHI ZONE CHAPTER 4 ENVIRONMENTAL EDUCATION CHAPTER 5 METHODOLOGY AND DATA Literature Review Study Design
33 45 49 53
CHAPTER 6 RESULTS AND DISCUSSION Description Interpretation CHAPTER 7 CONCLUSIONS AND RECOMMENDATIONS
60 66 78
LITERATURE CITED APPENDIX A APPENDIX B
81 89 90

iv
LIST OF FIGURES Page Figure 1: Class 8 students in Jhapa 1 Figure 2: Reference map of Asia 6 Figure 3: Major geographical regions of Nepal 7 Figure 4: Langtang National Park 8 Figure 5: The middle hills 9 Figure 6: The Terai 10 Figure 7: Royal Chitwan National Park 12 Figure 8: Lumbini, the birthplace of Buddha 13 Figure 9: Road during monsoon season 14 Figure 10: Rai neighbors 15 Figure 11: An urban Nepali family 16 Figure 12: Plowing in the hills 19 Figure 13: Livestock in a smallholder mixed farming system 20 Figure 14: Flooded fields in the Terai 21 Figure 15: Class 4 students 27 Figure 16: School assembly at a private school 28 Figure 17: A private school student in upper Kindergarten 29 Figure 18: Uniforms and material cost extra money 30 Figure 19: The number of girls attending school in on the rise 31 Figure 20: A Nepali boy gets ready for school 32 Figure 21: Map of Mechi Zone 34 Figure 22: Delays are frequent on the roads 35 Figure 23: Chiya bhari in Ilam 36 Figure 24: Cardamom in a Community Forest 37 Figure 25: Women harvest allo 38 Figure 26: Limbu matriarch 40 Figure 27: Trekking in the Kanchenjunga region 42 Figure 28: Panchthar district 43 Figure 29: Living in Panchthar district 43 Figure 30: Harvesting chiya in Panchthar 44 Figure 31: Students draw in shifts at the larger schools 55 Figure 32: Students all draw at once in the smaller schools 55 Figure 33: Students draw their environment 57 Figure 34: Example of the present environment 60 Figure 35: Example of the past environment 61 Figure 36: Depiction of future environment 62 Figure 37: Example of biased perspective 64 Figure 38: Example of x-ray vision 64 Figure 39: Example of visual realism 65 Figure 40: Cultivated landscapes 67 Figure 41: Wilderness-type landscapes 68 Figure 42: Identification of local environmental elements in Ilam 69 Figure 43: Identification of local environment in Taplejung 69

v
Figure 44: Mountains, birds, trees, houses and rivers are common in the posters
71
Figure 45: Depiction of environmental problem 71 Figure 46: Illustration from textbook 73 Figure 47: Student vision of the future 73 Figure 48: Scenes with no interactions 74 Figure 49: Example of an interaction: bird eating a fish 75 Figure 50: Example of an interaction: man cutting down a tree 75 Figure 51: Identified environmental problems 75 Figure 52: Students are enthusiastic to learn 80

vi
ACKNOWLEDGEMENTS
Bear with me, I have a story to tell. One steamy July morning in Nepal…
Drew and I realize there’s trouble right away – the air is unusually quiet and there is no traffic. Birtamod, a pit-stop town on the East-West highway, is never this still. As soon as we ask, we come to know that there’s a bhand (general strike). The neighbor tells us it is a gadi bhand (vehicle strike), but it looks like all the stores are closed, too.
This is a considerable problem, because I need to buy more brown paper for today’s activity, the second of my research activities at Drew’s school. We search everywhere Drew knows of for an open store – we finally find one, but they don’t have big brown paper, they don’t have newsprint, they don’t have cardboard (poster board), they don’t have chart paper – what to do? There are no other stores open.
I ask Drew how far away Kakarbhitta is. One of my rolls of butcher paper is in Melanie’s dhera (apartment) in Kakarbhitta. He says “Not far – when the buses are running.” Oh, yeah. “Well, maybe we can get a taxi for a couple hundred rupees.” “I think that may be our only option at this point, so let’s see if we can find a taxi.”
We roam the streets of Birtamod looking for a taxi. Nothing, nothing. We see only rickshaws on the road and one random Tata truck. The sun beats down on the unusual silence.
Drew thinks maybe he knows a guy who could arrange a taxi, so we go to an eyeglasses store that is half-open. His friend the shopkeeper thinks there may be something near the police station, so we walk back towards the police station – Birtamod really isn’t that big, so by now we’ve walked back and forth on the same main roads several times.
In the vicinity of the police station we ask a police officer where we can get a taxi, but he doesn’t know anything. In fact, he turns out to be the most unhelpful police officer we’ve ever met; he will barely even move his lips to speak to us, let alone actually give us any real information. He just grunts and picks his teeth. Drew and I don’t see any taxis nearby, so we walk down the road.
As we walk, Drew muses out loud, “You know, the school might not even be open today. A lot of the teachers live far enough away that they might not be able to make it to school, though I suppose some of them may walk.” Great, so we may pay through the nose for a taxi to Kakarbhitta and back just to get my paper, and the school might be closed?! Arg. But we can’t call to check if the school will be open or closed, because it’s just after 9:00 now, and no one will be there till 10:00. (My activity is supposed to start at 11:00.)
If there’s no school today, I’m in big trouble – Friday is a half day, which means nothing gets done, and next week summer vacation starts. Maybe I could double up and do two activities on Thursday, but that would mean commandeering a lot of class time right before vacation starts, and I don’t know if the teachers would be willing to give up so much time. Quite a pickle, as Drew says.
We keep walking. Suddenly we see a vehicle up ahead, but as we get closer we notice it has a ‘Shuva Beeha’ banner on the hood, meaning it’s for a wedding. As we stand in the road wondering where our next brilliant idea is going to come from, an astute Nepali approaches us asking where we want to go. “Kakarbhitta.” He looks at his watch,

vii
looks back up at us, says, “Gadima janay?” (Go in the car?) We ask how much – after much haggling, we agree on Rs. 700 for going and returning, as well as a promise to be less than a minute in Kakarbhitta because he has to get back by 10:00 to pick up the bride for the wedding. We leave at 9:20.
A few minutes down the road, Drew turns to me from the front seat. “Hmm, I hope Melanie’s still home when we get there. We’re really rolling a lot of dice today, aren’t we?!”
We speed down the road like nobody’s business and get to Kakarbhitta in 20 minutes (a 40 minute bus ride on a good day) where we rush into Melanie’s dhera (she is home), grab the paper, throw a few explanatory phrases over our shoulders as we run back out, and leave a very confused Melanie behind us as we jump into the Shuva Beeha cab and speed away. We make it back to Birtamod just at 10:00.
We run to the dal bhat didi (woman who cooks the traditional Nepali meal), shovel down khanna (food), flag down a rickshaw and bargain for him to take us to Garamani. As we start down the road, awkwardly wedged into the small rickshaw seat, we take stock of the situation: we have the paper now, we will still make it to school on time, and we even had a chance to eat. However, we don’t know whether the school will actually be open when we get there. One more roll of the dice.
Just then, the sky opens up and it starts raining – within minutes the wind picks up and the rickshaw driver is really struggling. I pull out my rain jacket and drape it over my backpack and the top of the paper tube and a little bit of me. The rain sheets down harder. The poor rickshaw wallah is working his darndest to move us forward, inch by painful inch, in the driving headwind.
Drew yells, “What should we do?” I can’t see anything at this point because my glasses are full of rain; I say, “I don’t know, do you think we should stop? Is there a place to stop?” “I don’t see anything, but the driver is really struggling, and we’re getting soaked…” He asks the driver if he wants to keep going, and the driver says yes yes we’ll keep going. We keep going.
Drew forewarns me, “This is just another reason for them to close school – the classrooms don’t have any glass windows, so when it rains heavy like this it can be really miserable – they either keep the windows open for light and everything gets wet, or they close the windows and their only source of light.”
We keep going. The ride seems to take all day. I’m completely soaked through and I just keep thinking that I just paid Rs. 700 for this paper and now it’s going to get wet and ruined, so I tug at my raincoat to cover more of it.
Drew turns to me: “Look at all the obstacles we maneuvered this morning -- wow, we are really dedicated to this project!”
And all I can do is laugh, because the picture of us at that moment is so ridiculous. Drew ticks off our challenges on his fingers: “First a bhand, stores closed, no buses, crazy drive to Kakarbhitta, now this rain… only to find the school…’ he pauses as we approach the school and I chant open open please be open under my breath – “Open! Yes, it’s open!” he yells as if his favorite team just made a goal and punches the air. We pay the rickshaw driver double and Drew tells him where to find a good cup of chiya (tea).
We walk into the school just at 11:00 to excited greetings from teachers and students alike. “You are so wet” exclaims the headmaster……

viii
The journey of my graduate school experience was much like this story. There were a lot of challenges and bumps in the road, and eventually making it had a bit to do with luck, some to do with pure stubbornness, and a lot to do with kind friends and strangers helping out. It has been a long journey, and I would like to extend my deepest gratitude to those who assisted me along the way.
To my amazing parents, thank you for putting up with me for so long. Your unconditional support of my choices means everything to me. Thank you for your wise words and helpful advice (even if I don’t always follow it), and your eternal interest in my many adventures. You are my roots, you are my wings. To my big little brother, my new sister-in-law, my many grandparents, and the rest of my extended family: thank you for your love, support, hugs and hearty meals.
To my fantastic friends, thank you for all the good times and bits of assistance and encouragement along the way. Thanks for the letters and packages, the books, the therapy sessions over a cup of coffee or chiya, words of cheer, and most of all for staying by my side through all the craziness. Specific thanks go to Curtis Hartenstine, Eloy Guzman, and Drew Westbury for helping me with the data collection phase. For stimulating conversations, lots of laughs, great meals and for inspiring me in so many ways, thanks go to the Peace Corps Volunteers I was lucky enough to cross paths with.
To the many wonderful Nepalis who took me in at various points in my journey, thank you for your generosity of spirit and friendship. The talented staff of Peace Corps/Nepal, most especially my Program Officer Dinesh Karki, deserve tremendous thanks for so much help in the beginning of this project and throughout my service. Thank you to the principals and teachers who opened their school doors to me, and to the students for their enthusiasm and smiles. Nepal is a special place in the universe, and I only hope my words can do her justice.
To the patchwork of teachers and professors I have had the honor of working with, thank you for sharing your knowledge and experiences. To the remarkable staff members in the Forestry building and the dedicated Inter-Library Loan staff, thank you for your hard work and all the logistical support. To my committee members Peg Gale, Mary Hindelang, Ann Maclean, and Tom Van Dam, thank you for your insight and guidance at various points.
And to the advisor extraordinaire, Blair Orr, I owe more thanks than could ever be expressed. Thank you for sharing your stories and knowledge; for Ambassador pizza and Suomi breakfasts; for wise words and advice on so many topics (again, even if I don’t always listen); for the endless articles; for your honesty, understanding, patience, sneakiness, and dry sense of humor; for the roaring tiger; and for helping me to see the path as well as realizing that it didn’t always have to be straight and narrow.
Thank you, all of you. Truly, I couldn’t have done this without any of you. This paper, the final outcome of my graduate project, is also very similar to the
story: it might be long, perhaps a bit dry at points, and the path from the initial conception through to the conclusions is rather bongotingo (twisty-turny), but I believe it is ultimately worth it in the end.

1
Chapter 1: Introduction
“Angrezhi-ma, batabaran ke ho?” In English, what is batabaran? I hold up my
hands in inquiry.
“ENVIRONMENT!” sixty kids scream at once.
“Ho ta ni.” It is so, I smile. They know they have the right answer, so they smile,
too. I am standing in front of a small classroom which is holding sixty expectant faces
(Figure 1), more if you count the extra students crowding every window for a glimpse of
Figure 1: Class 8 students in Jhapa
the new bideshi (foreigner). After a few more introductory words, I start them on their
activity, and then I stand back. I watch them draw mountains and trees and houses, and I
think about how I came to be standing here in a new kurta (Nepali tunic) on a muggy
monsoon morning. I shrug off the memory of the crowded bus that almost fell apart and
think even further back.

2
Living in Nepal as a Peace Corps Volunteer, I involved myself in many projects
over the course of my service. One of these projects was teaching English and
environmental education to class 4 students. As I was technically still a graduate student
at Michigan Tech, Blair sent me an endless supply of journal articles to read. I diligently
read the articles. I studiously thought critically and theoretically about the curriculum.
And one day while I was helping Saraswati count trees in English class, I started
wondering what she saw, what she thought. What did all of this talk of environmental
education mean to her?
These initial questions formed the basis of my research. Environmental education
in Nepal is a fairly new idea, and already there are many governmental and non-
governmental programs designed around it. Most students have by now had some
environmental education, and I was curious what their perceptions were. I developed this
study to specifically examine how Nepali students conceptualize the environment.
From this we can improve the environmental education curriculum as well as better
understand our children.
By this point I had already been living in Nepal for over a year and a half, and I
had been teaching in the schools as well as simply being a continual observer of Nepali
life. I hypothesized that given the rural lifestyle of the majority of students in my area,
their perceptions of the environment would be largely colored by their immediate
environment. Living lifestyles structured by agriculture and weather as well as utilizing
the forests for many needs, I thought that the students’ perceptions would be different
than those presented in their textbooks.

3
In order to study children’s perceptions, I conducted research at five schools in
Eastern Nepal. At each school, I directed a series of activities with class 8 students that
focused on the students drawing pictures of the environment. Allowing students to draw
their ideas is a way to see what children are thinking and is a fairly painless, even fun,
data collection method. It is also beneficial when dealing with subjects of a foreign
culture, as it greatly diminishes the language barrier.
This paper is the organization and analysis of these research efforts. It is
organized into seven chapters, of which this is the first. The next chapter gives a general
background of Nepal, as the situation is significantly different than in the United States.
Several aspects of Nepal are briefly discussed to give the reader a general understanding
of the geographical and cultural context I was working in. These aspects include
geography and climate, people and culture, the agriculture-based economy, and history
and the current political situation. An overview of the education system is also sketched
out as it is the background for this study.
Chapter 3 gives the reader an introduction to the study area, the far eastern zone
of Nepal. The research was conducted in this zone because of its ease of accessibility. I
was living in eastern Nepal at the time and so was able to reach each study site in a day or
less (see Appendix A for details on each school). Chapter 4 looks more closely at
environmental education in Nepal. These two chapters outline the specifics of the
situation in which this research was conducted.
Methodology and data are presented in Chapter 5. First I review the literature in
the field of environmental education that is specific to children’s perceptions. Then I
describe in detail my study and how the research was carried out. The data for this study

4
are in the form of digital pictures of the original posters, and they are contained in
Appendix B.
The results are presented and discussed in Chapter 6. Several themes which
emerged from the data are explained. These themes are also a springboard for
interpreting the data and discussing the outcomes. Using all these bits of information, we
can begin to piece together a picture of the students’ conceptions.
Once we have an understanding of the students’ conceptions, we can bring it back
to the question of curriculum development. Chapter 7 discusses the conclusions and
recommendations garnered from this study.

5
Chapter 2: Nepal
GEOGRAPHY AND CLIMATE
Nepal is a small landlocked country located in South Asia between India and
southwest China (Figure 2). Home to eight of the world’s ten highest peaks, the Himals
define much of life in Nepal: human habitation, weather patterns, the paths of political
history. From the world’s highest point (Mt. Everest, 8, 848 m) and some of the world’s
steepest mountains, the landscape quickly gives way to foothills and the lowland Terai
(flat plain area) at 300 m elevation, all within 100 miles (Savada 1993, Shrestha 2002).
Nepal, slightly larger than Bangladesh or the state of Arkansas, is about 140,800
square kilometers (CIA 2003a), and is similar in shape to Tennessee. From north to
south, Nepal is divided into three major physiographic areas: the high mountains, the
middle hills, and the Terai (Figure 3). Accordingly, each of these areas corresponds with
a distinct ecological zone: alpine, temperate, and subtropical (Mehta 1994).
The high mountains, those over 4,000 meters in altitude, are the northernmost
area, containing the steepest areas of the country. The snow-capped peaks which make
Nepal famous are the most striking characteristic of this region. There are several
national parks and conservation areas in the mountains, including the popular Annapurna
Conservation Area, Langtang National Park north of Kathmandu (Figure 4), Sagarmatha
National Park in the Everest area, and Kanchanjunga Conservation Area in the far east.
Glaciers in this region are the source for all major rivers in Nepal. Rivers cut deep gorges
through the mountains and hills on their courses to the Ganges river system in India,
eventually to drain into the Bay of Bengal (Negi 1994).

6
Figure 2: Reference map of Asia (UT Library Online 2004)

7
Figure 3: Major geographical regions of Nepal (after Chapagain et al. 2002)

8
Figure 4: Langtang National Park
Although popular for mountain climbers, these areas are not easy places to live.
With only 5 percent of the country’s total cultivatable land, just under 8 percent of the
population lives here; population density is 33 people per square kilometer (CBS 2002,
Shrestha 2002). Agriculture is limited by altitude, steepness of slopes, and harsh climate.
Inhabitants live mainly by grazing livestock and trading, with some farming areas in the
valleys and river basins (Savada 1993). There are few roads and most transportation is
done on foot; although there are also several airports, these are mainly for bideshi
(foreign) trekkers and climbers. The climate of the mountains is generally colder than the
rest of the country; mean summer temperatures range between 3˚ and 15˚ C, winter
temperatures between -3˚ and 6˚ C (Chapagain et al. 2002).

9
The temperate middle hills compose the middle band of the country, with
altitudes between 1,000 and 4,000 meters (Figure 5). This region is actually made up of
Figure 5: The middle hills
two major ranges, the Mahabharat Lekh and Siwalik (or Churia) Range. A large
percentage (44 percent) of the population lives here; likewise, population density is also
higher at 167 people per square kilometer (CBS 2002). The hills have traditionally been
the center of power and population for the various ethnic groups, sandwiched between the
inhospitable steep mountains and the ill-tempered malarial lowlands. The Kathmandu
valley, epicenter of most Nepali power struggles, is in this band of the country. Roads in
this region are crude, most often not paved, and subject to massive destruction during
monsoon landslides.
The slopes in the hills are heavily terraced and extensively cultivated. Agriculture
is the main economic activity, supplemented by livestock, foraging, and seasonal
migration of workers, although it is argued in some circles that the economic activity of
remittances from migrated workers outweighs that of agriculture (Seddon et al. 2002). A

10
variety of crops are grown, including rice (Orzya sativa), corn (Zea mays), millet
(Pennisetum glaucum), wheat (Triticum aestivum), mustard (Brassicaceae family),
soybeans (Glycine max) and other pulses, potatoes (Solanum tuberosum), cauliflower
(Brassica oleracea), and other vegetables (CBS 1993). Mean temperatures extend
between 12˚ and 27˚ C in the summer, and between 0˚ and 15˚ C in the winter
(Chapagain et al. 2002). Although the hills are known for their pleasant, temperate
climate, because of the tremendous variations in altitude, higher altitude areas of this
region experience the weather patterns more consistent of the mountains while low
altitudes experience weather patterns similar to the Terai.
The subtropical Terai is Nepal’s southernmost strip of land, geographically part
of the Ganges plain and formed by alluvial deposits (Figure 6). This area was an
uninhabited contiguous lowland forest until the 1950s, populated only by wild animals
(tigers, leopards, bears, rhinoceroses, buffaloes, crocodiles, snakes and scorpions; Hagen
et al. 1961), mosquitoes and malaria. Small groups of Tharu, the only indigenous group
Figure 6: The Terai region

11
to adapt to the conditions, were the only human inhabitants (Rose and Fisher 1970, Finlay
et al. 1999, Guneratne 1999). The government started widespread spraying of DDT in
the late 1950s and early 1960s, effectively controlling the mosquitoes and therefore the
malaria (Guneratne 1998, Heleniak 2002). This lead to the steady demise of the forest as
it was cleared for agriculture and human habitation. Inhabitants first immigrated from the
south, particularly North Indians fleeing natural disasters in their home villages. Later
people migrated from the hills in a series of resettlement schemes, as the government
attempted to mitigate population pressure in the hills (Guneratne 1998, Shrestha 2002). It
is now some of the most agriculturally productive land in Nepal, as well as housing the
largest proportion of the population, 48 percent, and the highest population density of 330
people per square kilometer (Bista 1991, CBS 2002).
As Nepal is a landlocked country, all imported goods must come in through India.
Thus, the Terai is the center of trading and commerce, an area buzzing with energy and
movement. The topography in the Terai is more conducive to infrastructure
development, and there is an extensive road and communication network in this area.
The major road of the country is the east-west highway, extending from Mahendranagar
in the far western Terai all the way through the lowlands to Kakarbhitta on the eastern
border. The east-west highway is the longest paved road in the country, as well as being
the best maintained.
The Terai contains several important natural areas, the most popular of which is
Royal Chitwan National Park (Figure 7), preserved as a hunting area for the royal family
until established as a park in 1973 and a World Heritage Site in 1984. Other important
areas include Royal Shuklaphanta Wildlife Refuge in the far west, Koshi Tappu Wildlife

12
Figure 7: Royal Chitwan National Park
Refuge in the east, and Lumbini, the birthplace of Buddha, in the central Terai (Figure 8).
Temperatures in the Terai vary from hot to hotter: mean winter temperatures range from
12˚ to 18˚ C, and mean summer temperatures from 24˚ to 30˚ C (Chapagain et al. 2002).
The major crops of the area include rice, corn, wheat and vegetables, as well as cash
crops of sugar cane (Saccharum officinarum L.), tobacco (Nicotiana tabacum) and
oilseeds (Brassicaceae family) (CBS 1993). Jute (Corchorus spp.) is also grown as a
cash crop in the eastern Terai, as cotton (Gossypium spp.) is in the western Terai
(Chapagain et al. 2002).
Countrywide, climate varies with altitude as well as from east to west, but the
most defining feature of climate in Nepal is the monsoon. Monsoon is a period of about

13
Figure 8: Lumbini, the birthplace of Buddha
three months which brings 80 percent of the annual rainfall (Chapagain et al. 2002). The
season is bookended by massive thunderstorms, some bringing severe winds and hail that
harm livestock, houses, and people (Rosoff 2003). Monsoon rains start falling in the east,
traveling north on tropical winds from the Bay of Bengal, and arc quickly westward.
Conversely, the autumn drying winds start from the west and move eastward, making the
monsoon season longest in the east (Savada 1993, Negi 1994).
Monsoon is an integral part of Nepali life; farmers have evolved their farming
systems to best utilize the heavy rainfall that falls in a short amount of time. The start of
monsoon season is anticipated every year with both eagerness and dread. Timing is
essential in paddy preparation; rice seedlings are transplanted in anticipation of the
forthcoming saturated field conditions. A late or short monsoon will mean poor paddy
(rice) production, the staple of most farmers’ livelihoods. However, monsoon also brings
destruction with it: landslides, soil erosion, and flooding, which can cause losses of life or

14
property. Transportation is often disrupted, turning this into a season of soggy patience
(Figure 9).
Figure 9: Road during monsoon season
PEOPLE AND CULTURE
Population
Nepal is the crossroads of cultures from north and south, as the current residents
are descended from migrant waves from both directions. Mongoloid tribes descended
southward initially, journeying to the fertile hill region from the cold, dry Tibetan Plateau
more than 2,500 years ago. The first people to arrive were the Kiratis (ancestors of the
present day Rai and Limbu groups, Figure 10), and are commonly believed to be the first
inhabitants of the Kathmandu valley, the first kingdom of the region, as well as the first
and only dynasty of Mongoloid origin, which lasted about 1,500 years. Following the
Kiratis came successive waves from the north, bringing the migrants that eventually
became today’s Tibeto-Burmese ethnic groups of Magars, Gurungs, Sherpas, and
Tamangs (Shrestha 2002, Savada 1993).

15
Figure 10: Rai neighbors
About 1,000 years ago, waves of migrating Indo-Aryans started arriving from the
south and quickly dominated the areas they occupied. These were mostly caste Hindus,
specifically high-caste Bahun (Brahmins) and Rajputs fleeing the Mughal (Muslim)
crusaders. First settling in the western regions of present-day Nepal, they eventually
came to take over the Kathmandu valley and political control of the region. Through
their influence, Hinduism and the caste system became central features of the culture
(Savada 1993, Finlay et al.1999).
While the caste Hindu settlements diffused among the hills and lowland areas of
Nepal, the Tibeto-Burmese ethnic groups tended to settle in distinct communal groups.
For example, the Newars settled in and around the Kathmandu Valley, the Sherpas reside
in the Solokhumbu (Mt. Everest) area and the Tamang are clustered north of Kathmandu
in the Langtang area. While people move around more now, these areas of settlement are
still used as reference points for a person’s or family’s origin. Regardless of where they
might currently live, a person originally from the hills is often called a pahari, while

16
someone from the Terai is referred to as a mahadeshi. This strong identification with
one’s home area comes from the traditional settling patterns, where all generations of a
family live in the same area.
According to the 2001 census, there are currently 23.1 million people in Nepal, 39
percent of which are under the age of 14 (CBS 2002). Average population density is 157
people per square kilometer, compared to 30 people per square kilometer in the United
States (CBS 2002, CIA 2003b). The urban population is about 14 percent of the total
population (CBS 2002) (Figure 11). Statistics for 2003 indicate infant mortality at about
Figure 11: An urban Nepali family
68 per 1,000 live births, compared to about 6 per 1,000 live births in the United States
(CIA 2003a, CIA 2003b, World Bank 2004). Despite the high infant mortality rate, the
growth rate presently stands at about 2.3 percent (Heleniak 2002, FNCCI 2004, World
Bank 2004). With an average life expectancy of 55 years, Nepal is still only one of 5
countries in the world where the life expectancy is shorter for females than for males
(UN-Habitat 1999, Jones 2001, NepalNet 2004, World Bank 2004).

17
Language and Religion
While Nepal is the only Hindu kingdom in the world and Nepali is the official
language, there are at least 70 different ethnic groups within the kingdom, each with their
own traditions, history, dress, and in many cases, religion and language or dialect (Sattaur
1996, Bista 2000). The major ethnic groups are Newar, Maithili, Tharu, Tamang,
Gurung, Magar, Rai, Limbu and Sherpa. There are also significant refugee populations,
both from Tibet and from Bhutan. About ten percent of the population is Buddhist (many
of them of Tibetan descent or refugees). As Nepal is the crossroads of cultures from
north and south, so is it the crossroads of religions. It is often difficult to tell the
difference between Hindu, Buddhist, and various ethnic groups’ customs, as they have
lived together so closely for so many years that customs and festivals coincide; even local
citizens sometimes have a hard time distinguishing between Hindu or Buddhist behaviors
(Bista 1991).
Nepali is widely understood and functions as a common language, although it is
estimated to be the second (or third) language for at least half the population
(Rajbhandari and Wilmut 2000). Being Sanskrit-based and written in the Devanagari
script, Nepali is linguistically close to Hindi; many Nepali speakers learn Hindi quickly
and easily. Other major languages of the country, most with their own scripts as well,
correspond with the major ethnic groups: Newari, Maithili, Bhojpuri, Tharu, and Rai and
Limbu (Bista 2000).

18
Caste System
The caste system is a hierarchy of status, based on ancient religious ideas. There
are four major jaat (castes) in the Hindu belief system; their relative status comes from
the belief that each caste was born from a part of the body of Brahma, the creator of the
universe. At the top of the ladder, Bahuns (Brahmins) were created from his head, and
they were traditionally priests and scholars. Chhetris, born from Brahma’s chest, were
warriors. Vaisya merchants and traders were born from his legs. The Sudra jaat is the
lowest caste, born from Brahma’s feet, traditionally the most spiritually dirty part of a
person’s body; Sudras were farmers, laborers, and artisans. Within each of these four
major categories are hundreds of sub-divisions as well (Savada 1993).
The caste system is structured around concepts of ritual status, purity, pollution,
and predetermination. Jaat is permanent, and dictates how a person lives their life. All
activities in a caste society are determined by this system: social, economic, legal,
religious, and political behaviors. Forms of address and manner of speaking change
depending upon who is part of a conversation. Marriages are arranged within caste
groups. Many groups have dietary and food preparation restrictions (Shrestha 2002).
The caste system was introduced to Nepal by the Indo-Aryan immigrant groups,
who imposed their ideas when they came into power. Although the Tibeto-Burmese
ethnic groups originally had a more communal system, they were included into the caste
system as part of the third category, with the merchants and traders. While they still lived
in relative isolation, they did not consider themselves as part of the caste system. With
increasing mobilization and mingling of cultural groups, as well as Hinduization of the
ethnic groups, they have become more integrated into the system (Savada 1993).
19
The caste system was legalized in 1854 and subsequently made illegal in 1963,
but it is still very much in use. The system has changed slightly over the years. The rules
are not quite as strict as they used to be, but they still form the framework of everyday
life in Nepal. The structure of the system still influences the order of life, from
household activities to the way communities interact (Bista 1991, Sattaur 1996).
AGRICULTURE-BASED ECONOMY
Nepal is one of the poorest countries in the world (Burch 1995, Sattaur 1996,
Finlay et al. 1999, Heleniak 2002, Shrestha 2002). While it is indisputable that the
country lacks sufficient resources for adequate health care and education, as well as a
plethora of other government priorities, it is also true that the majority of Nepal’s citizens
live primarily outside the cash economy as subsistence farmers.
It is estimated that 91 percent of the population is involved in agriculture in some
way (Europa 2000) (Figure 12). There are two different farming systems in Nepal,
Figure 12: Plowing in the hills

20
smallholder mixed farming in the hills, and lowland rice-based farming in the Terai.
Within both systems, the majority of people are subsistence farmers. The major crops
and methods of farming are slightly different in each, though some characteristics
overlap.
Smallholder mixed farming is a system involving both crop production and
animal husbandry, each holding about the same importance to the system. This is an
integrated system of livestock and agriculture, where the material inputs and outputs of
each component relate to each other. For example, a family may have two cows (Figure
13). The manure from the cows is spread on their fields as fertilizer. After the corn
Figure 13: Livestock in a smallholder mixed farming system

21
harvest, the corn stalks are used as fodder for the cows. In this way, each component is
helping to sustain the productivity of the other. This is the most ecologically sustainable
system after shifting cultivation, though it is threatened now by population pressure and
decreasing size of average land holding. Cash crops have recently become more popular
in these areas, most notably cardamom (Eletteria cardamomum) and tea (Camellia
sinensis) (Beets 1990, Sattaur 1996).
Although rice is grown in the hills, lowland rice-based farming is the primary
agricultural system in the Terai. Known as the bread-basket of Nepal, the Terai is largely
patchworked with rectangles of vibrant green, rice paddies dominating the landscape.
This labor intensive system involves flooded soils during the growing season (monsoon),
often with an irrigated second crop in the winter (Figure 14). Many farmers in the Terai
Figure 14: Flooded fields in the Terai
22
also have livestock, though their inputs and outputs do not integrate as closely with the
agronomic component as they do in the smallholder mixed system of the hills. As rice is
the major ingredient in the Nepali diet, it is inextricably linked with the culture; the
government therefore puts much significance on national self-sufficiency in rice
production. In recent years the system has had to deal with increased demand, as the
national population has become more urban (Beets 1990).
HISTORY AND CURRENT SITUATION
Often described as a yam caught between two boulders , Nepal’s history has been
a mix of influences from the boulder to the south, India, and the boulder to the north,
China. Although both boulders have contributed culture and population, over the years,
India has influenced Nepal more than China.
Legend has it that the Kathmandu Valley was once a vast lake. The goddess
Manjushree cut a deep gorge in the mountains to drain the valley for human habitation.
The Valley, a large flat area surrounded by hills and breathtaking views of the Himals, is
indeed a fine setting for such grand beginnings. Many scientists do agree that the Valley
was once under water; certainly no matter how the valley was formed, it is undisputable
that it has long been the center of Nepali power struggles.
Starting with the Kirati kingdom, the borders of Nepal were drawn and re-drawn
through a succession of dynasties and eras. The Licchavi period introduced a monetary
economy and an appreciation for art and architecture. The Malla period is known for
increased trade relations and steady growth, as well as intermittent threats from the south.

23
By the mid-1400s, the Valley was divided into three major kingdoms and the rest of the
country into 46 principalities (Finlay et al. 1999, Shrestha 2002).
Minor conquests and battles occurred over the next few hundred years, but it was
not until the 1700s that the country was united. This was accomplished in 1768 by
Prithvi Narayan Shah, now widely described as the ‘father of Nepal.’ From the kingdom
of Gorkha, Prithvi Narayan Shah first conquered the kingdoms of the Valley before
battling both the Chinese and the British powers. The Shah dynasty continued his dream
of a unified Nepal, taking control of all the principalities and uniting them under one flag
(Savada 1993, Shrestha 2002).
Nepal’s battles were far from over, though, as British India continued to cause
trouble; the Anglo-Nepalese War of 1814-1816 damaged Nepal in many ways, mainly in
the loss of territory and lives, but also politically and morally. With the treaty that ended
that war, Nepal lost a great deal of territory, including Sikkim in the east, most of the
lands in the Terai, and all lands west of the Kali River. Some of the Terai lands were
restored a few years later, however, as the British found the territory difficult to govern
and full of malaria (Savada 1993).
In the mid-1800s, a rising military commander and politician by the name of Jang
Bahadur Kunwar was part of a conspiracy that cumulated in a bloody massacre of most
other nobles and administrative courtiers. Jang Bahadur quickly took control of the
prime ministry, relegated the king to nominal status, and ran the country as a dictatorship.
Having been awarded the title Rana for military glory, he appended this as his last name,
and established the position of prime minister as hereditary. Thus began over a century
of Rana rule, often considered a dark period in Nepal’s history. This was a time of

24
repression and economic disaster for Nepal, and only the ruling family and allies
prospered. The only bright episodes of this time were the abolition of sati tradition (the
suicide of a widow by throwing herself on her husband’s funeral pyre) in 1920 and
slavery in 1924 (Bista 1991, Shrestha 2002).
The Shah dynasty returned to power in 1951 with King Mahendra promising
democracy and elections for the people. In 1959, B.P Koirala became the country’s first
elected prime minister, but his representative government lasted only a few years before
the king jailed him and his cabinet members. Mahendra, in an effort to maintain power
and his image of working with the people, introduced the panchayat system. This was a
system of village panchayats (councils) which chose representatives for the district
panchayats; district councils were represented at the National Panchayat, headed directly
by King Mahendra. While this looked like a representative government, it was in fact a
system of high-caste ‘good old boys.’ Corruption and the aristocracy flourished (Finlay
et al. 1999).
By the late 1980s, the pro-democracy movement was again gaining political
power and popular acceptance. The political situation deteriorated with the economic
embargo imposed by India in 1989. After numerous demonstrations, protests, and general
unrest, the monarchy, now under rule of Birendra, consented to a multi-party system. A
new constitution was adopted in 1990, revising the king’s role to a constitutional
monarch. The elections of 1991 were dominated by the Nepali Congress Party. The
ensuing years have been dominated by instability: prime ministers, governments, and
coalitions rise and fall faster than one can keep track. Although the system is still full of
infighting and is as corrupt as the days of the panchayat, the optimism of the people

25
rarely wanes (Shrestha 2002). A significant blow was dealt to the Nepali people on June
1st, 2001, when nine members of the royal family, including the King and Queen, were
massacred by the Crown Prince, who then fatally wounded himself.
In the mid-1990s, a group of communists became disillusioned with the slow
process of democracy, especially when their party did not do so well at the polls. A
faction broke from the main party and formed the People’s Movement. As they follow
the teachings of Mao Zhe Dong, they are commonly called the Maobadee (Maoists). The
movement went underground and has since become a guerrilla campaign against the
government. They gained most of their support in rural areas, and in some districts they
have near complete control. Maoist strongholds exist especially in the impoverished west
and more recently in more remote regions of the east.
The Maoists have issued several demands to the government, including such
mandates as a more equitable education system and more rights for dalits (former
untouchable castes). Increasingly upset with the state of the nation, they have resorted to
more and more violence over the years, from red-painted propaganda graffiti to pressure-
cooker bombs in government offices to high level assassinations. In 2001, it was not
unusual to hear of Maoists warning an office when it was going to be bombed; loss of life
was infrequent though loss of property was great. By 2003, it was more common to hear
that government officers had gone ‘missing’ or young men had fled their remote towns to
avoid being unwillingly conscripted. The movement is funded by the extortion of
teachers, shopkeepers, and government employees, as well as by robbery of government
offices and banks. Bhands (general strikes) are common occurrences, when the

26
Maobadee try to intimidate the government by showing they can bring the country to a
halt. This conflict is unending, and a constant factor of daily Nepali life.
EDUCATION SYSTEM
Under the Rana regime, education for the majority of people was non-existent, as
the Ranas knew an educated public would be a threat to their absolute power. Education
was for the ruling elites only, and schools in the Valley were established to groom their
children, typically sons, for government employment. The Rana family employed
English tutors for their children, establishing English-medium schooling as the preferred
method over traditional Sanskrit-based instruction; the higher status of English-medium
schools continues to this day (Bista 1991).
Nevertheless, small informal schools emerged in the hills as Gurkha soldiers,
many of whom learned to read and write while serving with the British Army, returned
home and taught their children and neighbors. (Savada 1993, Joshi and Anderson 1994)
By 1951, there were only about 300 primary schools and eleven secondary schools in the
country, and the literacy rate stood at about five percent (Savada 1993, Onta 2000, Stash
and Hannum 2001).
With the return of the monarchy came extensive educational reforms. A Ministry
of Education was created, as well as a National Education Planning Commission,
establishing education as a national priority for the first time. Primary education was
made free and compulsory in 1975; this was expanded to class 6 in 1991. By 1990, there
were 14,500 primary schools, 3,964 lower secondary schools, and 1,953 upper secondary

27
schools. In 1991, the literacy rate was 39.6 percent, and by 2001 it was up to 53.7
percent (Stash and Hannum 2001, MoE 2003).
Primary school is classes 1 through 5, lower secondary is classes 6 through 8,
upper secondary is classes 9 and 10. While class 4 students, for example, are
approximately corresponding in age to fourth graders in the United States, their learning
achievement more closely aligns with about second grade (Figure 15). At the end of
Figure 15: Class 4 students
class 10, students take an exam to earn their School Leaving Certificate (SLC), roughly
equivalent to a high school diploma in the United States. If they pass, students can
continue their education. The next advanced schools, called 10+2 or campus, offer more
focused studies in areas such as Science and Math, Arts and Commerce, and Computers.
After two years at 10+2, students earn a campus certificate, and might then continue their
studies at one of the higher education centers. Tribhuvan University in Kathmandu is the
main university, although there are also smaller institutes around the country for various
subjects, such as forestry and nursing.
28
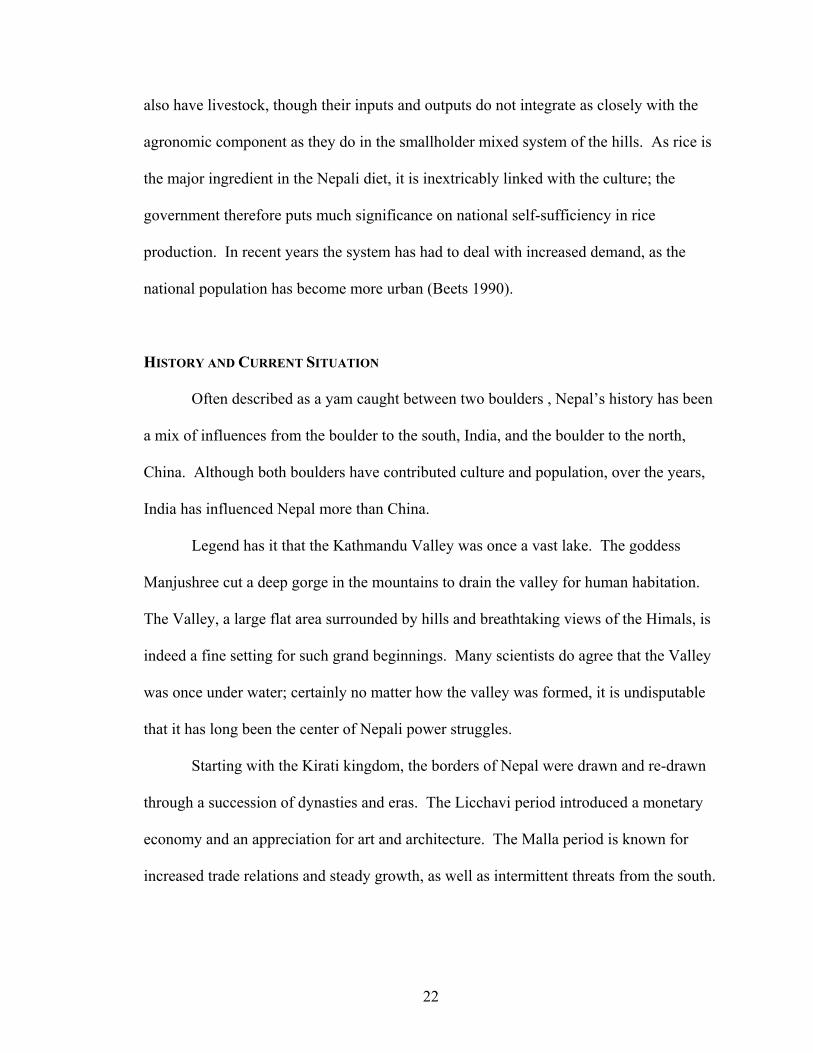
In the mid-1980s, the bureaucrats of the panchayat system were trying to
modernize and sell themselves to increasing numbers of discontented citizens. New
plans were outlined to ‘meet the basic needs of the people.’ As part of this, private
schools were allowed to open in the hopes of upgrading the quality of education (Figure
16). The number of private schools increased dramatically over the next 20 years.
Figure 16: School assembly at a private school
Currently there are approximately the same number of government as private schools, the
scales often tipping in favor of the private schools in more urban areas, and new private
schools are opening all the time (Onta 2000).
Private schools most often have more levels than the government schools, starting
with nursery classes, lower Kindergarten and upper Kindergarten (Figure 17). As private
schools are not required to follow the government curricula, they have different time
schedules and targets for certain subjects. For example, beginning English is first taught
in the government schools in class 4; in most private schools, it is first taught in

29
Figure 17: A private school student in upper Kindergarten
Kindergarten, with most classes taught in English by class 6. Private school students
have several advantages over those who attend government schools: the quality of
teaching is generally better at private schools, and the frequency of English usage helps
them when it comes time to take the SLC, as the directions and the majority of the exam
is written in English. Invariably, a higher percentage of private school students pass the
SLC than government school students (Onta 2000).
Many barriers exist between a child and an education, and discouraging statistics
of the system abound: only 70 percent of children are enrolled in primary school, and this
number drops to 30 percent in secondary school. Of those not enrolled, about two-thirds
are female. Within the children who start class 1, approximately 60 percent drop out

30
before reaching class 5. Repetition rate is high for those who manage to stay in school.
The fail rate of the SLC is over 60 percent (Onta 2000).
There are many reasons for these dismal figures, ranging from economic to
cultural. School enrollment and attendance varies with geographical area, season,
financial condition, and gender. Children in rural areas are less likely than urban children
to be enrolled in school, and their attrition rate is higher (Stash and Hannum 2001). Low
attendance at school is amplified during planting and harvesting times. Families often
need the labor of the children, and cannot spare them to go to school.
Economic barriers are a major hurdle for many families. Even though primary
government education is free, and the government is supposed to provide most textbooks,
there are still costs involved, including but not limited to school uniforms, materials, and
the loss of the student’s labor at home (Stash and Hannum 2001) (Figure 18). If a student
Figure 18: Uniforms and materials cost extra money
continues to secondary school, there are fees in addition to the need for uniforms, books
and materials. Private schools, predictably, cost more than government schools; the more
prestigious the school, the higher the fees. Although education became a national priority

31
in the 1950s and there have been numerous reforms since then, a quality education is still
only within the reach of the wealthy and powerful (Shrestha 2002).
If a family can afford to send a child to private school, they will. This is often a
sign of status and wealth. If they can only afford to send one child, generally a boy gets
preference. Traditionally, girls were not educated. When a girl gets married, she
becomes part of her husband’s family, no longer a member of her parents’ family.
Therefore, it is a short-term investment to educate a girl, as opposed to the long-term
investment in a boy’s education. This manner of thinking has been changing in recent
years, although modification has been slow. It is still believed that a boy does not marry
a girl with more education than himself, so the pool of potential husbands for a girl
shrinks as she continues in school. It is also considered more appropriate for boys to seek
non-farm employment than for girls. While enrollment numbers are still lower for girls,
there are signs of improvement: in 1998, while only three percent of women aged 45 to
49 had at least a primary school education, 22 percent of women aged 20 to 24 have some
education (Joshi and Anderson 1994, Mitchell 1998, Stash and Hannum 2001) (Figure
19).
Figure 19: The number of girls attending school is on the rise

32
Once children have overcome the barriers to school attendance, they still have to
contend with major challenges to the learning process. The teaching methods used in the
schools are governed by rote memorization, and many of the teachers are poorly trained.
Most children have numerous household duties before and after school, so they have
limited amounts of time to study. There is also a high rate of malnutrition among
children as well as a lack of awareness about proper nutrition and its effects on health;
malnutrition leads to decreased attention span and ability to learn. All of these issues add
up to significant hurdles for students and the national education system.
The good news is that awareness of the importance of education is increasing.
More and more parents send their children to school each year (Figure 20), and
educational issues remain a national priority. If dedicated teachers, administrators and
elected leaders steadily make valuable reforms, the quality of education in Nepal can
continue to improve.
Figure 20: A Nepali boy gets ready for school

33
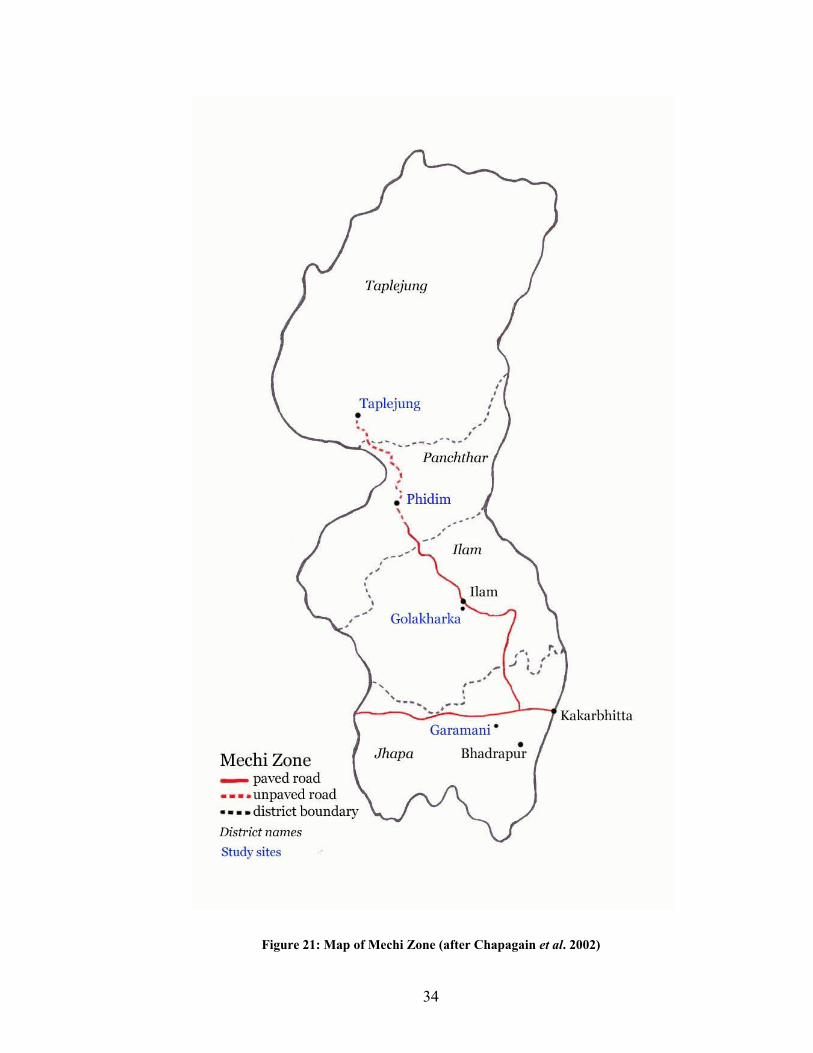
Chapter 3: Study area: Mechi Zone
The physical study area for this project was the far eastern section of Nepal,
known as the Mechi Zone. This region encompasses the four districts along Nepal’s
eastern border with India and involves each of the three major physiographic bands:
Taplejung district in the mountains, Panchthar and Ilam districts in the hills, and Jhapa
district in the Terai (Figure 21).
Transportation and Development
The east-west highway dissects Jhapa and ends at the border town of Kakarbhitta.
From this major highway, one major road extends north to connect the other three
districts. The north-south road starts from the roadhead at Charalie, about 30 km west of
Kakarbhitta. This road is paved up to a tiny village named Kanchi Dokan in Panchthar,
about 70 km north of Charalie. The unpaved road continues through Phidim, the district
center of Panchthar, and north to Taplejung district center, about another 70 km from the
paved road. The unpaved section of the road is deeply rutted and experiences frequent
landslides and mud pits during the monsoon. In non-monsoon months, the trip from
Charalie to Ilam takes about 3 hours, from Ilam to Phidim about 4 hours, and from
Phidim to Taplejung about 6 hours. During monsoon, the trip from Ilam to Phidim will
take at least 5 hours and from Phidim to Taplejung at least 8 hours, and frequently these
trips will last even longer (Figure 22).
Besides the major roads, there are numerous smaller roads in varying conditions
throughout the region. In Jhapa and Ilam, some of these roads are travelable by vehicles,
34
Figure 21: Map of Mechi Zone (after Chapagain et al. 2002)

35
Figure 22: Delays are frequent on the roads
but the majority of smaller roads in Panchthar and Taplejung are passable for foot traffic
only. There are also two airports in the region, one in Bhadrapur in Jhapa, and one in
Taplejung. Year-round, several flights depart from and arrive in Bhadrapur daily.
Flights into and out of Taplejung are more sporadic and seasonal, usually once a week
and sometimes daily flights in non-monsoon months. The airport closes during monsoon
due to the grass runway.
The development of Nepal can be visualized as a continuum, with the eastern
edge of the country on the more developed end of the range and the western section on
the lesser developed end of the scale. There are more roads, schools, industries and
communication networks in the east than in the west. Part of this is due to the people
living in each area: there are mostly caste Hindus in the west, and they are traditionally
more conservative than the mix of caste and ethnic groups in the east. The west has also
been repeatedly plagued with drought, crippling efforts to move beyond basic survival.

36
However, the main reason the east has more infrastructure and development is tea
production (Figure 23). Located in the ideal climate for growing tea, the same ecological
Figure 23: Chiya bhari (tea gardens) in Ilam
zone as Darjeeling, India, the eastern hills produce large amounts of tea. Together, Jhapa
and Ilam produce 97 percent of all tea in Nepal, nearly 5,000 metric tons every year (CBS
1993, Chapagain et al. 2002). It is believed that a large percentage of Darjeeling tea sold
worldwide is actually grown in Nepal (BBC 2001, Kathmandu Post 2001). Tea is the
driving force behind most development projects in the east, either from the capital
revenue or the motivation to improve the industry, for example building processing
factories and better roads.
Cardamom is also an important cash crop, though on a more localized level
(Figure 24). While tea is cultivated as a monoculture, cardamom is a non-timber forest

37
Figure 24: Cardamom in a Community Forest
product (NTFP), harvested in addition to other subsistence crops. Cardamom grows as
an understory plant in the forest. In the eastern hills of Nepal, it is either harvested from
a local forest or cultivated as part of an agroforestry system. For both cardamom and tea,
there is a significant time investment, and also the capital investment to get involved is
fairly high, as they both involve several processing steps. For those Nepalis who have
managed to invest in cardamom or tea, the profits are sizeable.
Because of increased population pressure, the environment of Nepal has
encountered some degradation. Issues of specific relevance to the east include soil
erosion, waste disposal, and deforestation. While there are occurrences of these issues in
all four districts of Mechi Zone, the problems are developing gradually. In the rural
areas, most problems are still small enough that the communities have not experienced
major inconveniences yet because of them. Small soil erosion control and waste disposal

38
projects do exist, but the only issue to have received major attention, due to its more
immediate effect on the resource needs of the population, is deforestation. This attention
comes in the form of a government program called community forestry.
Community Forestry
Nationwide, community forestry has been a success story for Nepal. This is
especially true for the eastern edge of the country, where there are hundreds of
Community Forests. Forests are an important source of many products of daily Nepali
life: fuel, fodder, construction material, compost material and NTFPs such as mushrooms
and medicinal plants (Figure 25). In the hills, forests were traditionally managed
Figure 25: Women harvest allo (stinging nettles), a non-timber forest product used for fiber

39
communally. Increasing population put pressure on the resource base, however, and
forests began to show signs of degradation. Attempting to avert further deforestation, the
Nepali government centralized all management of forests in the 1950s in order to bring
them under more active direction. Control of resources was concentrated amongst the
powerful, and access to resources was strictly regulated. Like the government, this
management system was very corrupt. This approach changed in the 1970s, when the
government started ‘handing over’ plots of forested land to the communities. This
practice, known as Community Forestry, involves the community members in
management and operation of the forests (Arnold and Campbell 1985, Adhikari et al.
2004).
Community Forest User Groups (CFUGs) are comprised of interested local
residents. Their elected leadership includes a president, vice president, treasurer and
secretary, and together they make decisions about the use of resources in their forest.
Often these decisions are about fuelwood and fodder collection regulations or group
projects such as cardamom or collection of lokta, a tree used to make a distinctive Nepali
paper as well as Japanese currency. The District Forest Office (DFO) Rangers offer
support in several ways; they are the CFUG’s contact within the government system, they
attend CFUG meetings, and they help with the formulation and revision of the
operational plans. The DFO also offers trainings for CFUG members in the technical
aspects of forest management, such as thinning and pruning, nursery bed management
and propagation techniques, NTFP management, income generation activities, and forest
protection.

40
Population
The eastern hills have been traditionally the home of the Rai and Limbu ethnic
groups (Figure 26). In the past 50 years, caste Hindus and other ethnic groups have
moved into these areas, and some migration has occurred of paharis (hill residents) going
Figure 26: Limbu matriarch
to the Terai looking for work, resulting in a broad mix of people now living in the east
(Bista 2000). Agriculture is the base of the economy, much as in the rest of the country;
84.3 percent of households own some agricultural land, livestock, or poultry (CBS 2002).
Other sectors include manufacturing, business, transportation, service, and teaching and
government jobs. The majority of people who earn their living primarily outside of
agriculture still own land and may work it in addition to their main job.

41
District Profiles
According to the 2001 Census, Jhapa has 688,000 residents, and it is also a main
thoroughfare for other Nepalis (CBS 2002). Any Mechi zone residents who want to
travel to other parts of the country must pass through the district. There is also a fair
amount of Nepali and Indian traffic crossing the border. Kakarbhitta is a bideshi border
crossing, so the area sees a few tourists on their way to or from Darjeeling and Sikkim.
Jhapa is also the commercial center of the region; a number of towns along the highway
are known for their abundant selection and low prices of commercial goods, including
appliances, entertainment goods, clothing and material, processed food goods, imported
produce, seeds, tree and plant seedlings, agricultural technology, and automotive parts.
Ilam, with a considerably smaller population of 282,800 people , is one of the
most popular domestic tourist destinations of Nepal, known for a pleasant climate, scenic
countryside, and charming picnic areas (CBS 2002). The chiya bhari (tea fields) are the
most famous landscape of the area and are occasionally used as movie backdrops. Even
though Jhapa produces more metric tons of tea per year, Ilam is more prominent within
Nepal for producing tea as well as for the picturesque chiya bhari in the hills. Other
significant products of Ilam include cheese, butter, ginger, and cardamom. There are also
a few religiously significant areas, most notably Maiphokari a few hours north of Ilam
district center. Ilam is also recognized as one of the wettest areas of Nepal, due to the
long monsoon season.
Taplejung, with the sparse population of 134,700 people, is the most remote
district in Mechi Zone (CBS 2002). It is a popular bideshi tourist destination, specifically

42
for those trekking to Kanchenjunga, the third highest mountain in the world (Figure 27),
or rafting down the Tamur river. Kanchenjunga itself is rarely summited, as it is
technically very difficult, believed to be more challenging than Everest. Many religious
pilgrims journey to Pathibhara, a significant temple on the way to Kanchenjunga.
Figure 27: Trekking in the Kanchenjunga region
Taplejung is noted within the country as having the most delicious tongba (fermented
millet drink), suketi (fried meat jerky), and churpi (dried cheese).
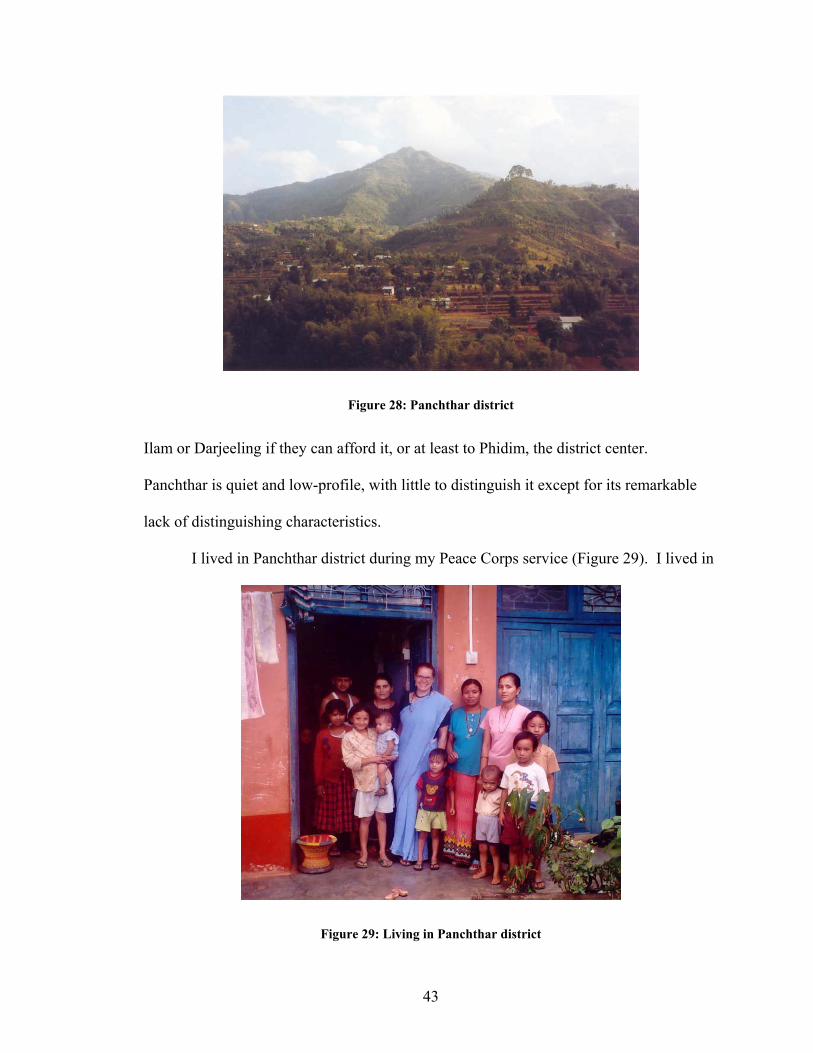
Panchthar is unobtrusively nestled between Ilam, Terrathum, Taplejung, and India
(Figure 28). Its population of 202,000 people sees few tourists, as domestic tourists do
not travel north of Ilam and most bideshi tourists either fly into Taplejung or hike up
from Basantapur, a city in the next district to the west, Terrathum (CBS 2002). There are
only a few tea plantations and processing plants, in addition to several successful projects
with cardamom and lokta. There is one cheese factory; most of the cheese is exported to
Kathmandu. Schools are of poor quality. Families send their children to study in either
43
Figure 28: Panchthar district
Ilam or Darjeeling if they can afford it, or at least to Phidim, the district center.
Panchthar is quiet and low-profile, with little to distinguish it except for its remarkable
lack of distinguishing characteristics.
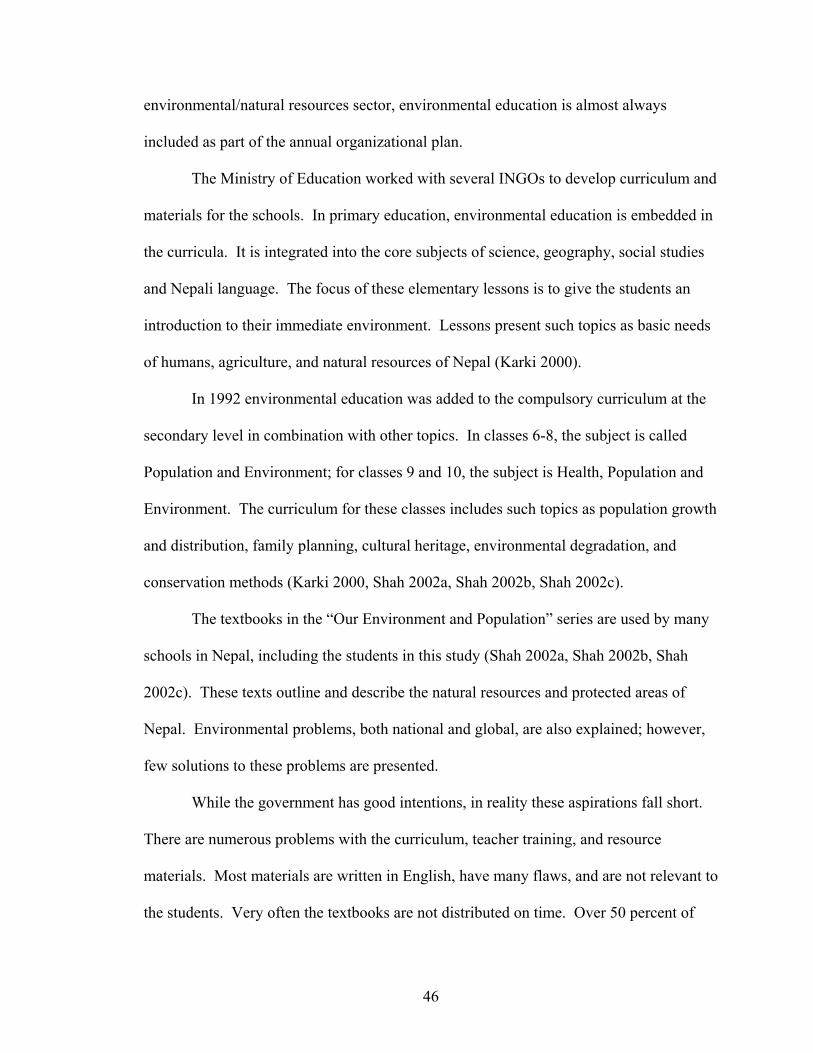
I lived in Panchthar district during my Peace Corps service (Figure 29). I lived in
Figure 29: Living in Panchthar district

44
two different locations within the district, first in Rabi, a small remote village, and then in
the district center, Phidim. I was sent as a Community Forestry Extensionist, and this
gave me the opportunity to interact with many different people. I also worked in the
school system teaching English. This introduced me to the school system and the
curriculum.
I observed and experienced a great many things during my time in Nepal. I
observed the farming systems and the farming schedules. I studied the distinct ecology
of each region. I monitored the weather patterns. I experienced the disruption of Maoist
bhands. I walked over landslides. I traveled the roads, picked the chiya (Figure 30),
attended the meetings, and ate the food. I observed the pressures the large population
puts on its forests and agricultural lands. And I wondered, given the importance of
agriculture and forest land to the people, what is taught in the way of environmental
education?
Figure 30: Harvesting chiya in Panchthar

45
Chapter 4: Environmental Education
As awareness of the degradation of the environment came to the forefront of
global consciousness over the past twenty years, recognition in Nepal of environmental
conditions also increased. In addition to deforestation, Nepal’s environmental problems
include soil erosion, lack of waste management, air pollution in the urban areas, and loss
of biodiversity (Burch 1995). One strategy to combat environmental degradation is
through environmental education. Several researchers believe this approach is one of the
most important (Alerby 2000, Yencken et al. 2000, Sudarmadi et al. 2001, Loughland et
al. 2002). As written in Agenda 21, the global environmental and development strategy
from the United Nations Conference on Environment and Development, “education is
critical for promoting sustainable development and improving the capacity of people to
address environment and development issues” (UNCED 1992).
Following the lead of Western countries, Nepal initiated curriculum development
and programs about environmental education. Environmental education in Nepal “aims
to make individuals aware of their environment and its problems and helps them to
understand the effect that human choices have on the environment” (Karki 2000).
Within the Kathmandu Valley, the subject of environmental education receives a
great deal of attention. At the national planning level, there have been many conferences
and workshops. Reports have been commissioned about the importance of environmental
education and its inclusion in the curriculum. Within non-governmental organizations
(NGOs) and international non-governmental organizations (INGOs) working in the
46
environmental/natural resources sector, environmental education is almost always
included as part of the annual organizational plan.
The Ministry of Education worked with several INGOs to develop curriculum and
materials for the schools. In primary education, environmental education is embedded in
the curricula. It is integrated into the core subjects of science, geography, social studies
and Nepali language. The focus of these elementary lessons is to give the students an
introduction to their immediate environment. Lessons present such topics as basic needs
of humans, agriculture, and natural resources of Nepal (Karki 2000).
In 1992 environmental education was added to the compulsory curriculum at the
secondary level in combination with other topics. In classes 6-8, the subject is called
Population and Environment; for classes 9 and 10, the subject is Health, Population and
Environment. The curriculum for these classes includes such topics as population growth
and distribution, family planning, cultural heritage, environmental degradation, and
conservation methods (Karki 2000, Shah 2002a, Shah 2002b, Shah 2002c).
The textbooks in the “Our Environment and Population” series are used by many
schools in Nepal, including the students in this study (Shah 2002a, Shah 2002b, Shah
2002c). These texts outline and describe the natural resources and protected areas of
Nepal. Environmental problems, both national and global, are also explained; however,
few solutions to these problems are presented.
While the government has good intentions, in reality these aspirations fall short.
There are numerous problems with the curriculum, teacher training, and resource
materials. Most materials are written in English, have many flaws, and are not relevant to
the students. Very often the textbooks are not distributed on time. Over 50 percent of

47
teachers are not trained in how to teach the new curriculum. Teachers complain that
there is no time to teach extra materials. Resource materials are expensive and frequently
not even available. Many facets of the program need to be addressed for it to be effective
in the future (Pande et al. 2001, Pande 2002).
To incorporate environmental education in non-formal education, many NGOs
and development workers set up eco-clubs, although they often disintegrate after the
volunteers leave. Nepal Forum of Environmental Journalists (NEFEJ) produce mass
media environmental education programs such as radio and television programs. There
are also several NGOs established specifically for environmental education. One
example is ECCA (Environmental Camps for Conservation Awareness), which holds day
camps for school-age children.
Within the Peace Corps/Nepal community, environmental education is a common
project amongst all sectors. In 2000, Peace Corps Volunteers put together an
environmental education resource book called Peace Pieces (Peace Corps/Nepal 2000).
The book contains useful activities for volunteers tailored to the Nepali situation, and
includes adapted activities from Project Wild, Project Learning Tree, and Project WET
(American Forest Foundation 1987, Watercourse and Western Regional Environmental
Education Council 1995, Council for Environmental Education 1996). Many volunteers
are involved in some aspect of environmental education, from formal teaching in schools
to eco-clubs or girls clubs to incorporating environmental education into other trainings
of community members.
On the part of the government, there has been a profusion of talk in support of
environmental education. Projects by development organizations about environmental

48
education have become too numerous to count. A few researchers have evaluated
students’ retention of the information (Pande and Karki 1998, Hikawa 1999, Pande et al.
2001). However, little to no attention has been paid to the perceptions of students, to
how they see their environment and what they understand as their place in it .
Because I worked with rural students at the local government primary school, I
wondered how their daily interactions with their immediate environment affected their
perceptions. Most of the students come from farming families, and the students
themselves are often involved with many of the agricultural activities. Their lives are
structured by the seasons and the weather and the needs of their crops and animals.
Many are members of Community Forests, using the forests to gather fuelwood, fodder,
and other non-timber forest products, as well as occasionally using timber. I thought
perhaps these relationships would give the students different perspectives than those
presented in their textbooks. I chose to structure my research in order to explore these
questions.

49
Chapter 5: Methodology and Data
LITERATURE REVIEW
Within the field of environmental education, the traditional emphasis of research
has been on the presentation of knowledge: what to teach and how to teach (Leeming et
al. 1993, Elliott 1995, Fien 1997, Culen and Volk 2000, Gough and Reid 2000,
Ballantyne et al. 2001). More recently, researchers have begun to explore how students
understand the environment. While there were some progressive studies of this kind in
the 1970s and 1980s, the majority of studies have been more recent (Maloney and Ward
1973, Brown et al. 1987, Loughland et al. 2002). Understanding prior knowledge and
perceptions is important because students learn new concepts based on what they already
know and understand. Their prior beliefs and knowledge provide the framework for
understanding new ideas (Kellogg 1979, Matthews 1992, Wals 1992, Robertson 1993).
Taking these initial conceptions into account, a teacher can design more effective
teaching strategies (Maloney and Ward 1973, Boyes and Stanisstreet 1993, Payne 1998,
Loughland et al. 2002). This is also true when developing curricula and programs.
Therefore, a more effective environmental education curriculum could be designed with
the knowledge and understanding of students’ perceptions.
Previous research has approached the study of children’s perceptions in a variety
of methods. Commonly, questionnaire surveys are employed. Several researchers asked
a wide range of questions of large numbers of subjects, using the answers to
quantitatively analyze their knowledge and attitudes and look for commonalities and
differences across regions and age groups (Gomez-Granell 1993, Batterham et al. 1996,
Yencken et al. 2000, Sudarmadi et al. 2001, Barraza and Walford 2002, Fien et al. 2002).

50
Interviews and focus group discussions have also been employed in order for students to
give more descriptive responses (Wals 1992, Boyes and Stanisstreet 1993, Palmer 1993,
Robertson 1993, Hillcoat et al. 1995, Payne 1998, Loughland et al. 2002). These studies
have yielded a great deal of useful information, both for the environmental education
field at large, and for educators in the particular regions. Specifically, they have raised
awareness that perceptions of students are significant; indeed an understanding of
children’s conceptions can lead the field in new directions as well as deepen current
knowledge (Wals 1992, Hillcoat et al. 1995, Payne 1998, Barraza and Walford 2002).
Another method to study students’ perceptions is by asking students to draw
pictures instead of answer questions. Drawing a picture is a way for students to visualize
their thoughts (Fleer 2002). Drawings are commonly used as tools in therapy with
children as well as analyzed in the field of psychology (Matthews 1985, Berger 1994,
Aronsson and Andersson 1996, Cohen and Ronen 1999). Children can express their
ideas in drawings often more easily than in words, especially when researchers are
studying complex concepts such as the effects of divorce (Berger 1994). Drawings
contain not only the knowledge of the student, but also their attitudes and beliefs
(Klepsch and Logie 1982, Chambers 1983, Crook 1985). Studying these drawings gives
researchers an understanding of the thoughts of the children, the way they see the world
around them, and the way they see their relationships to it (Crook 1985, Cohen and
Ronen 1999). Drawings have also been used in educational research to understand
feelings students have that they either will not or can not express in standardized surveys
(Tovey 1997, Haney et al. 1998, Nyquist et al. 1999).

51
Using drawings to study children’s perceptions has also been utilized within the
realm of environmental education (Brown et al. 1987, King 1995, Barraza 1999, Alerby
2000, Fleer 2002). In 1987, Brown et al. studied British children’s perceptions of nuclear
power plants by way of their drawings. Between the drawings, discussions with the
students, and discussions with the teachers, the researchers were able to piece together an
understanding of how the students perceived nuclear power plants, how these conceptions
changed over time, and how the media affected their perceptions. An important
observation from this study is the possibility of misinterpretation on the part of the
researchers because of lack of local knowledge. For example, the scarcity of human
figures in the drawings was originally interpreted as the perception of a nuclear power
plant being empty and alienating. But in discussions with the teachers, they were able to
understand that the students found drawing human figures difficult, and avoided it unless
specifically asked to do so. Gathering additional information is important for
understanding context and interpreting the thoughts behind the drawings.
In the early 1990s, King (1995) studied relationships between children and the
environmental crisis, examining both the messages adults receive from the media about
children and the messages children receive about the need to ‘save the planet.’ In order
to investigate the level of children’s concern about the environment, U.S. children ages
five to fifteen were asked to draw a picture of what they think when someone says ‘you
have to save the planet.’ From the results, categories of conceptions were outlined based
on the themes present in the drawings. The results showed that 87 percent of the children
were aware of the environmental crisis and nearly half portrayed someone taking action
for positive change.

52
Using these studies as a foundation, Barraza (1999) explored the environmental
conceptions that form in children’s minds as they undergo developmental changes
between the ages of seven and nine. Local and national environmental attitudes were
taken into account to see how much of an influence they might have. Drawings from
children in both England and Mexico were collected about what the earth would look like
to an alien, both now and in the future. Similar to King’s analysis, the results were
categorized based on the patterns that emerged. Even with this very open-ended drawing
assignment, a large percentage (36.7 percent) depicted major environmental problems. It
is also important to notice that while this study did not record any significant differences
between the drawings of children from the two cultures, it was mentioned that this may
have been because the children were from similar socio-economic conditions and had
similar access to information through television and computers.
Alerby’s research (2000) in Sweden also used drawings to interpret children’s
thoughts about the environment. Aged seven to sixteen, the schoolchildren were asked
to draw what they think about when they hear the word environment. The emphasis of
observation was not on what exactly had been drawn, but on what the student was
thinking about when the drawing was made. Four different themes were extracted from
the drawings: “thoughts which focus on the good world, thoughts which focus on the bad
world, thoughts which focus on the dialectics between the good and bad world, and
thoughts which focus on symbols and actions protecting the environment.” The majority
of drawings, approximately 50 percent, fell into the first category.
In Australia, Fleer (2002) investigated how children view the future
environments. Participants in the study, aged five to twelve years, were asked to either

53
draw or write about their ideas of what the environment would look like in the future,
when they would be grandparents. The results indicate that a majority of students have a
very negative view of the future, envisioning a world dominated by environmental
problems and technology.
Requesting students to draw pictures can yield a great deal of valuable
information. Analyzing such data can lead to useful insights about the way children
perceive the messages they are receiving, the attitudes that are being developed, the
outcomes of environmental and general education, and the effectiveness of particular
programs.
STUDY DESIGN
This study was designed in order to examine the conceptions Nepali students hold
of the environment. Using drawings as a window into children’s thoughts can be a
particularly constructive strategy. This is especially true when working in a foreign
culture, as language barriers can block effective communication and understanding.
Therefore, the method of drawing was chosen for the basis of this research.
Five schools were visited in Eastern Nepal in order to conduct the research: Durga
Secondary School in Garamani, Jhapa; Bhagawati Secondary School in Golakharka,
Ilam; Shree Nilkantha English Boarding School in Phidim, Panchthar; Mechi St. Mary’s
English Boarding School in Taplejung district center; and Oxford Model English
Boarding School, also in Taplejung district center (see Figure 21, page 34, for site
locations; see Appendix A for school attributes). Knowing fellow Peace Corps
Volunteers in these areas, I used them as key informants to choose the schools and

54
introduce me to the teachers and principals of the schools. Having key informants helped
quicken my acceptance into the schools and to understand the local situations (Bernard
2002). The Peace Corps Volunteers, while not native inhabitants, could effectively serve
as informants because they had lived in their communities long enough to understand
local customs and to be accepted as members of the community.
Living and working in Eastern Nepal for over two years, I made use of this
experience as an opportunity to observe and understand the way of life for Nepalis. I
utilized this information as the foundation for my research, both in the design and
analysis. I was also able to use my status as a participant observer and accepted member
of the community to gain access to local schools. This aided in the collection of
background information as well as in access to the study site in Phidim.
At each school, I conducted a series of three activities with class 8 students. A
total of 153 students participated in the study, between the ages of twelve and sixteen.
On the first day, I gave a brief introduction of myself and the activities. I stressed to the
students that there were no right or wrong answers, and that their work was not for their
school, but for mine. This was to elicit responses that were as close to true conceptions
as possible.
For the first activity, students were asked to think about the environment. Given
markers and paper, I then requested the students to draw what they think the environment
is. With the larger classes, this was accomplished in shifts (Figure 31), while in the
smaller schools the students were all able to draw at once (Figure 32).
While many other studies that examine students’ drawings asked children to each
draw a separate picture, for this study I provided long butcher paper to the students for

55
Figure 31: Students draw in shifts at the larger schools
Figure 32: Students all draw at once in the smaller schools

56
drawing. Nepali society in general and the school system in specific is based on a
communal attitude, and while copying of homework by classmates is commonplace, it is
rarely viewed negatively. Had I passed out individual pieces of paper to each student, I
expect I would have received in return the same picture over and over. Instead, with one
big poster to draw on, the students were able to share ideas and work together to make
one big picture. This is more in accordance with their communal nature.
At the end of the first day’s activity, the students were told of the second day’s
activity. As the second activity dealt with the environment of 50 years ago, the students
were instructed to ask questions of grandparents or older relatives about the past
environment. The majority of households in Nepal are comprised of many generations
all living together, so it is a reasonable expectation that the students involved in this study
would be able to easily ask questions of their grandparents. Hence, on the second day
they were requested to draw what the past environment looked like based on these
inquiries.
For the third activity, the students were encouraged to think of the future
environment, what they think the environment will look like after 50 years. Students then
drew this environment.
Students were allowed to talk amongst themselves while they were drawing, and
this they did freely. They shared markers as well as ideas. Sometimes I would see
several students working together on one drawing, although it was more common to see a
student making a distinct drawing. Short discussions were conducted after each session,
in order to clarify the themes brought up in the drawing period and to give the students a
chance to express themselves verbally.

57
I attempted to minimize any effects my presence might have on the students’
work. During the dialogues after the drawing sessions, I did not define terms or
otherwise lead these discussions, I simply allowed the students the chance to talk. The
only questions I asked during the activities were in order to clarify a drawing or to elicit
verbal explanations from the students. I repeatedly told the students there were no right
or wrong answers and that I was looking only for their own ideas.
At each school, I also interviewed the principals as well as asked many questions
of the supporting teachers in order to complete a picture of the school atmosphere. Notes
were taken on all interactions, including direct and overheard conversations with the
students. Gathering this local information helps put the results of the research into
context.
For the purposes of this study, picture and drawing refer to a specific student's
work, a part thereof, or the activity in general (Figure 33). Poster refers to the whole
Figure 33: Students draw their environment

58
mural from one school. A total of fifteen posters were collected, three each from five
schools.
For analysis of the data (the posters from each school), I studied each poster in
conjunction with the other posters from the same category. Levels of environmental
understanding were examined. I also looked for similarities and differences between
schools and between categories. Elements of the drawings were coded, and from these
codes, patterns and themes were identified (Emerson et al. 1995, Bernard 2002).
Observations from the school visits are also taken into account, in accordance with case
study research guidelines (Cohen and Manion 1994, Yin 1994).
In order to code the drawings, I pulled out ideas from the images present in the
posters. For example, I noticed a variety of wild animals, so I coded the posters for types
and frequency of wild animals depicted. Other coded groups included buildings,
environmental problems, relationships, and color choices. For each of the coded groups,
I noted the types and frequencies of each image on the posters.
From this analysis, themes emerged. I looked for patterns of images: repeated
elements or repeated structures of elements. Four major themes came out of these
patterns: positive vs. negative views, local vs. general scale, wilderness vs. cultivated
landscapes, and environmental relationships and problems. These themes are used to
interpret and discuss the results of the drawings, as well as to compare with the
environmental education textbooks.
By studying how students of a foreign culture conceptualize the term
environment, the method of analyzing student drawings can be particularly effective. I
chose this method for my research with Nepali schoolchildren, carried out at five

59
secondary schools in Mechi Zone of Nepal. For interpreting the data in the drawings, I
analyzed the content and patterns, using knowledge of local situations and the Nepali
education system to put the interpretations into context.
The data set for this study consists of fifteen posters, three each from five schools.
The posters range in length from 10 to 30 feet long. Digital photos of the posters are
available in Appendix B, as well as on the website
http://peacecorps.mtu.edu/NepalPosters.

60
Chapter 6: Results and Discussion
Fifteen posters, a total of 260 feet of drawings, were analyzed in this study. The
categories of present environment, past environment, and future environment are used to
describe the results. The behavior of the students and teachers are also described, as this
helps to explain the results. These results are then interpreted through the insight of each
theme to help us understand how Nepali students conceptualize the environment.
DESCRIPTION
The posters
The depictions of the present environment are full of images: trees, mountains,
flowers, houses, people, schools, temples, water taps, both wild and domesticated
animals, farm fields, sunshine and rain clouds (Figure 34). These pictures look like the
Figure 34: Example of the present environment
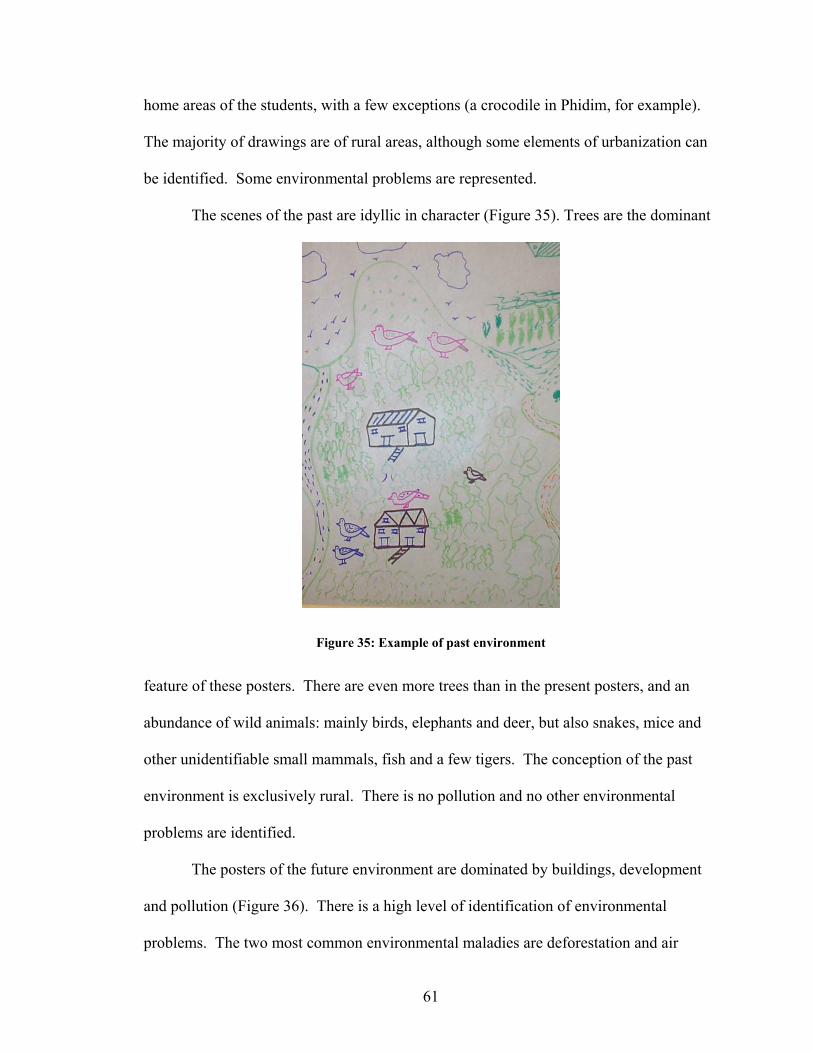
61
home areas of the students, with a few exceptions (a crocodile in Phidim, for example).
The majority of drawings are of rural areas, although some elements of urbanization can
be identified. Some environmental problems are represented.
The scenes of the past are idyllic in character (Figure 35). Trees are the dominant
Figure 35: Example of past environment
feature of these posters. There are even more trees than in the present posters, and an
abundance of wild animals: mainly birds, elephants and deer, but also snakes, mice and
other unidentifiable small mammals, fish and a few tigers. The conception of the past
environment is exclusively rural. There is no pollution and no other environmental
problems are identified.
The posters of the future environment are dominated by buildings, development
and pollution (Figure 36). There is a high level of identification of environmental
problems. The two most common environmental maladies are deforestation and air

62
Figure 36: Depiction of future environment
pollution, but others are identified as well: overcrowding, waste disposal, landslides,
diseased and dying trees, and industry waste being dumped into bodies of water.
Development is marked by big buildings, scores of roads, industries, helicopters and
airplanes, and hospitals. The depictions are almost entirely urban-based. When
environmental problems are depicted, both in the present environment and in the future
environment, the issues are the same as the ones described in the textbooks (Shah 2002a,
Shah 2002b, Shah 2002c).
The activities
When I first asked the students to draw pictures for me, they were quite hesitant.
It took some encouragement on my part to convince them to start drawing, and they kept
looking to me trying to figure out the right answers. Because the Nepali educational
system is so rigidly based on rote memorization, the students were quite confused with
what I was asking them to do. They assumed there were right and wrong answers. I had
to repeat several times that there were no right or wrong answers, that I just wanted them

63
to draw their thoughts. At the larger schools it helped to pick students to draw first,
otherwise no one started.
The teachers, too, had a hard time understanding what I was looking for. At each
school, almost every teacher would come watch my activity for at least a few minutes.
Many asked me what I was doing; after I explained the activity, they would often ask,
“And what’s the right answer?” Each school also had one or two teachers who would
directly instruct the students what they should be drawing. Everyone was very concerned
about getting the “right” answers.
The second and third activities started more smoothly, as by that time the students
understood how the activity would be structured and what to expect from me. I wouldn’t
tell them their drawings were bad or wrong, although I would occasionally ask questions.
Their discomfort outside of their normal school structure is demonstrated by their initial
hesitancy and endeavors to ascertain what I wanted, to obtain the correct answer.
Stages of drawing development
Researchers who have extensively studied drawings of children have delineated
stages of drawing development, which correspond with evolving mental conceptions
(Luquet 1927, Piaget 1969, Cox 1992, Malchiodi 1998, Golomb 2004). In general,
drawing abilities progress from beginning scribbles when a child is developing hand-eye
coordination and recognizing patterns, to more and more visually realistic depictions as
the child grows older. The drawings by Nepali students in this study are of widely
varying abilities, and many of the characteristics of different developmental stages are
found. Aspects of both intellectual realism, the depiction of children’s knowledge rather

64
than their perception, and visual realism, a more accurate depiction in correct
perspective, can be identified. While this study did not examine drawing abilities, it is
interesting to note the variety of abilities present in students of the same age group.
Within the data set, examples of intellectual realism include distorted perspectives
and transparent objects, or ‘x-ray vision’ (for example, Figures 37and 38). Children have
knowledge of the objects or scene they want to depict, but lack the ability to portray it
from a certain perspective. This stage is reported as being typical of younger students in
Western countries, generally from four to eight years of age (Golomb 2004). Although
most experts claim that the stages of development are universal and that there are no
differences between cultures in drawing abilities, they also note that increased exposure
and practice will help a child progress from one stage to another (Kellogg 1979, Thomas
and Silk 1990, Wales 1990).
Figure 37: Example of biased perspective; note the size of the flowers relative to the size of the houses
Figure 38: Example of x-ray vision

65
Examples of visual realism are much more rare in the data set. In this stage, the
viewpoint of the observer is taken into account, and relationships between elements of the
drawing are also considered (Figure 39).
Figure 39: Example of visual realism
A child’s choice of color is often used as a way to explain personality or
emotional states (Klepsch and Logie 1982, Malchiodi 1998, Golomb 2004). There was
not a high degree of choice involved in this study as there were only about eleven
different colors of marker and the students had to share. There are, however, examples
of the aspects of depiction described by Gardner (1980), where in early stages of
development the child is drawn to bright and primary colors. With developing maturity
comes an expanded approach to colors, attempting to depict each object as close to true
as possible, and eventually manipulating colors to evoke moods.
At the two larger schools in this study, the drawings utilized all the colors
available. The students traded markers amongst themselves quite often, so each picture
has many colors represented. At the smaller schools the students could be much more

66
selective about their color choices, as they had to share them with only a few other
students. Several of these students chose to work in only one or two colors. The single
color drawings of the present and past are predominately green, while those of the future
are black, brown and purple. I believe it is a common trait to choose green to symbolize
the environment and dark colors to symbolize a negative concept.
INTERPRETATION
The patterns that became apparent in the posters fell into four major themes.
These themes can be used to interpret and understand what is going on in the posters and
by further extension what is going on in the students’ conceptions.
Wilderness vs. cultivated landscapes
In a Western conception of 'environment,' wilderness areas take precedence, the
idea of the pristine forest ecosystem that needs to be preserved in its virgin status.
However, a Nepali student's immediate environment is much more cultivated, and this
shows up in their pictures. A majority of space of the pictures portray aspects of the
man-made environment. There is a high incidence of pictures of farm fields, pictures of
corn or rice or other cultivated plants. Many of the drawings of trees, too, are of
cultivated varieties, a chautara (stone resting place built around a planted tree, most often
a pipul tree) or a plantation (Figure 40). Potted plants, as much of a staple in Nepali
households as refrigerators are in American households, make a significant appearance in
the posters. There are many water taps and buildings such as houses, schools, and
temples. As there are also plenty of people drawn in the pictures, the students are

67
understanding that humans are a part of the environment. The 'wild' environment takes
up very little space in the posters, and we can infer that it also takes up little space in the
students' conceptions of the environment.
Figure 40: Cultivated landscapes, depicted in the present environment drawings
They understand, though, that it was not always like this. When asked about the
past environment, students reported that their grandparents told them there were fewer
people and houses, and more trees and wild animals. Their drawings of the past
environment reflect this perspective, which is much closer to the Western conception of
the wilderness environment. The differences between the present and past environment
drawings indicate that the students can conceptualize the difference between the less
developed environment and the more developed environment, even if they are not able to
put it into words (Figure 41). They can make the connection that it is their local
environment that has changed, as their grandparents also lived in the same area.

68
Figure 41: Wilderness-type environment, depicted in the past environment drawings
Local vs. general scale
There is a high level of identification of their local environment. Many pictures
mirror their local community, in terms of house structure, agriculture, and local
landmarks such as schools, temples, or chautaras. For example, on Ilam's present poster,
there is a drawing of a tree growing out of a barrel, a common sight on the streets of Ilam
bazaar (Figure 42). Another example from the Taplejung poster is the drawing of two
rivers coming together (see Figure 43), which is the local topography just down the hill
from Taplejung bazaar. Children often recreate familiar things and areas in their
drawings, consistent with the findings of Matthews (1992) and Barraza (1999). The
similarities to the local community were also remarked upon by other local residents
when they viewed the finished posters.

69
Figure 42: Identification of local environmental elements in Ilam
Figure 43: Identification of local environment in Taplejung: convergence of two rivers
There is one exception to these drawings of local elements: in Ilam, there was a
surprising number of elephants drawn, although there are no elephants in their local
environment. However, this was explained by a conversation with one of the teachers;
the class had just the previous week finished a unit about Chitwan National Park, a park
famous for its elephant population and the Elephant Breeding Center. Having just
discussed elephants, even in another environment, it makes sense that so many students
would then draw them.

70
It is also important to note that with very few exceptions, every child in the study
began each drawing with the mountains, even the students who lived in Jhapa. This
shows that the mountains are an inextricable part of the national identity of Nepali
students. Drawing the national symbols of the flag and the national flower also show this
association with the national identity.
However, when the students drew a polluted future, they indicated their pictures
were not of their local areas but of someplace else, often Kathmandu. This shows a
disconnect between identification of local environment and identification of
environmental problems. There is no indication that the students understand that
environmental problems may happen in their local area. In their minds, environmental
problems happen only in textbooks or other places.
Positive vs. negative views
With only a few exceptions, the drawings of the past and present environment are
very positive. There are bright colors, sunshine, happy people, vibrant flowers, and
national symbols (the flag and lollygurans, rhododendron, the national flower). Nearly
every student, without hesitation, started their drawing with the mountains. Life
dominates these pictures: trees, flowers and birds are ubiquitous. Rivers and houses are
also common (Figure 44).
Although there are a few identifications of environmental problems in the present
environment, there are not many associated feelings of worry or concern. The depictions
are of isolated incidences of problems, such as a person throwing away garbage,

71
Figure 44: Mountains, birds, trees, houses and rivers are common in the posters
surrounded by unaffected flowers and trees and birds. Another example is a drawing of
vehicles spewing smoke, slightly separated from the rest of the drawing of a positive
depiction of a homestead scene (Figure 45).
Figure 45: Depiction of environmental problem, disconnected from other elements
Drew, the Peace Corps Volunteer who helped me in Jhapa, told me of a
conversation he had with the teachers right before I arrived in town. He explained about
my research and the activities I would be conducting at the school. Right away, the
teachers thought they knew what the students were going to draw: the present

72
environment would have many problems, the past environment would have none, and in
the future, things would be cleaned up and the environment would be nice again.
This was not the case; Jhapa’s students, much the same as the students at the rest
of the schools, drew positive pictures of the past and present environment. In contrast,
the vision of the future is bleak. The drawings of the future environment contain many
negative pictures, and the overall tone is very pessimistic. The pictures show extensive
damage from pollution and overcrowding. When asked directly if they like this vision, if
this a place they would like to live, students time after time answered that they did not
like it, that it was not a good place to live “because of pollution and diseases.” However,
they do not feel they have any control over the path of the future. This sense of fatalism
comes from their culture: one is born into a certain caste, a certain occupation, and a
certain lifestyle. An individual does not have many choices in life, and so it is hard for a
student to see how they might make a difference in the course of the area’s future.
It is difficult for children in any culture to conceptualize the future. Picturing life
in 50 years is beyond the scope of understanding for a twelve year old. In order to
complete the assignment, then, they substitute ideas from other sources. When they have
difficulties imagining the future, they look to the ideas present in their textbooks. The
textbooks outline many environmental problems and issues. Some of the future
depictions drawn by the students are noticeably similar to illustrations in the text
describing current environmental problems (Figures 46 and 47).
What is most striking about this pessimism is that the students are not identifying
solutions for the environmental problems. The textbooks focus on the problems. The

73
Figure 46: Illustration from textbook (Shah 2002c)
Figure 47: Student vision of the future
students are taught to repeat what the textbooks say. The pessimism and lack of solutions
coupled with their culture’s fatalistic attitude create a hopeless picture of the future.

74
Environmental relationships, environmental problems
Most of the pictures are of single elements, with no visible relationship between
them. Even if a student has drawn a scene (Figure 48), in general the units of the
drawing, for example a tree and a bird, are not shown as having any relationship.
Figure 48: Scenes with no interactions
However, there were a few which depicted an interaction between two elements of the
environment (Figures 49 and 50). This indicates a higher level of understanding. For the
purposes of this study, a relationship or interaction is defined as when two pieces of a
drawing intentionally interact, such as a man cutting down a tree. This level of
understanding was most prominent among the private school students: 62.5 percent of the
private school students drew one or more interactions, while there are only fifteen total
examples of interactions on the public schools' posters, out of 121 students.

75
Figure 49: Example of an interaction: bird eating a fish Figure 50: Example of an interaction: man cutting down a tree
The private school students were also the only ones to delineate environmental
problems in the present environment. The problems they identified were: over-
development of town areas; garbage; air pollution from smoke, both from factories and
from vehicle emissions; and toilet waste being dumped into ponds (Figure 51). These
Figure 51: Identified environmental problems: industrial and toilet waste being dumped into a pond
depictions show no contact with their local environment scenes, often being drawn as an
urban setting. Both the depiction of relationships and of problems are indicative of a
higher level of comprehension.
The issues identified by the private school students in the present environment
and those depicted by all students in the future environment are the same issues described

76
in their textbooks (Shah 2002a, Shah 2002b, Shah 2002c). This shows that they
understand what the problems are and that they are absorbing what they are being told in
their textbooks. Yet the fact that they do not depict environmental problems in the
present local environment again points to the disconnect. There is no connection being
made between these environmental problems and their local environment. This is not
because there are no local environmental issues (see Chapter 3), so this demonstrates a
need for environmental education to bridge this gap.
SUMMARY
The students in this study drew a series of three posters, each depicting the
environment at a different time. Although the students were at five different schools in
four different districts, their pictures were remarkably similar. The depictions of the
present environment were chiefly positive, with a high level of identification of the local
environment and not many descriptions of environmental problems. The portrayals of
the past environment were dominated by dense forests and wild animals. The vision of
the future environment is rather pessimistic, full of environmental degradation and
sickness.
While the findings from a study of students from five schools are local and may
not generalize to the whole population of Nepali students, there are some interesting
outcomes. Using all the bits of information, we can piece together a picture of the
students’ conception of the environment.
There are varying levels of comprehension about what the environment is. In
general, the private school students have a much deeper comprehension of the term

77
environment, understanding that the environment is a series of relationships. However,
this higher level of comprehension does not affect their vision of the future. The students
from the private schools still have a pessimistic view of the future, and concur with the
government students that they have little to no control over what will happen. While this
fatalistic view is in accordance with Nepali culture in general, it should also be noted that
students in other countries have also indicated overwhelmingly pessimistic views of the
future (Barraza 1999, Fleer 2002).
Children in any culture will have difficulties visualizing the future. Picturing life
in 50 years is simply beyond something they can imagine, so ideas are substituted from
other sources. These sources may include messages from the media, their textbooks,
their community, and their parents and family.
The most striking realization is that there is a disconnect between identification of
local environment and identification of environmental problems. This shows the great
divide that exists for students between their immediate surroundings and what is taught to
them in schools. This disconnect is manifested in a few different ways. First, we see
local environments depicted without environmental problems, indicating that the students
do not think the problems happen in their area. We also see a vision of the future that is
dominated by environmental degradation but is not connected to the local community.
There is also a distinct lack of solutions formed by the students.
We can use this information in order to further develop the environmental
education curricula and to understand how messages from curricula are incorporated.
Now that disconnects in the students’ perceptions have been identified, the next task is to
build bridges.

78
Chapter 7: Conclusions and Recommendations
This study examined the conceptions of the environment held by Nepali students.
Research activities were conducted at five schools in Eastern Nepal, involving 153
students. At each school, the series of activities elicited drawings from the students. The
first activity asked the students to draw what they think the environment is like today.
The second activity focused on drawing the past environment, that of 50 years ago. The
last activity asked the students to envision the future environment, and draw what they
think it will look like in 50 years.
From the analysis of the posters in each category, patterns and themes surfaced
that help describe and interpret the drawings. Exploring the ideas of wilderness vs.
cultivated landscapes, local vs. general scale, positive vs. negative views, as well as
environmental relationships and environmental problems, the conceptions behind the
drawings become clearer. An understanding of the conceptions begins to take shape.
The most striking characteristic is the disconnect between identification of the local
environment, that which they see and experience every day, and identification of
environmental problems, the issues taught to them from the textbooks.
I originally hypothesized that the students’ perceptions would be different than
those presented in their textbooks because they live lifestyles structured by an agricultural
point of view. In the completed posters, however, the students presented conceptions
built from both of these sources. There was recognition of the local environment as well
as references to textbook issues, but there was no connection made between the two.

79
Understanding students’ initial conceptions and taking them into account, a
teacher can design more effective teaching strategies in addition to curriculum
components. While Nepal has made great strides in the fields of general and
environmental education, there still remains much to be done. The gap in students’
conceptions shown in this study provides an opportunity for environmental education.
Teachers can include more local examples when they teach environmental
education. For instance, if the book discusses soil erosion, a teacher could point out local
examples of landslides or gullies. Even better, the students could be taken on a field trip
to see local examples of environmental issues. The students would not only understand
the environmental topics as existent issues, they would also see how their local
community is being affected.
There need to be stronger elements of creativity and critical thinking skills built
into the curriculum. Students need to be taught how to think creatively so as to deal with
problems. There need to be opportunities for students to practice thinking creatively in
the school atmosphere so they have experience with this type of thinking for their lives
after school.
One of the big gaps in students’ perceptions is evidenced by their attitudes toward
the future: the future is polluted and they do not want to live there, but they see no
solutions to the problems. Environmental education needs to present the solutions as well
as the problems, and also give students practice with generating their own solutions. This
will not only strengthen their creative problem-solving skills, but may also positively
impact the actual problems.
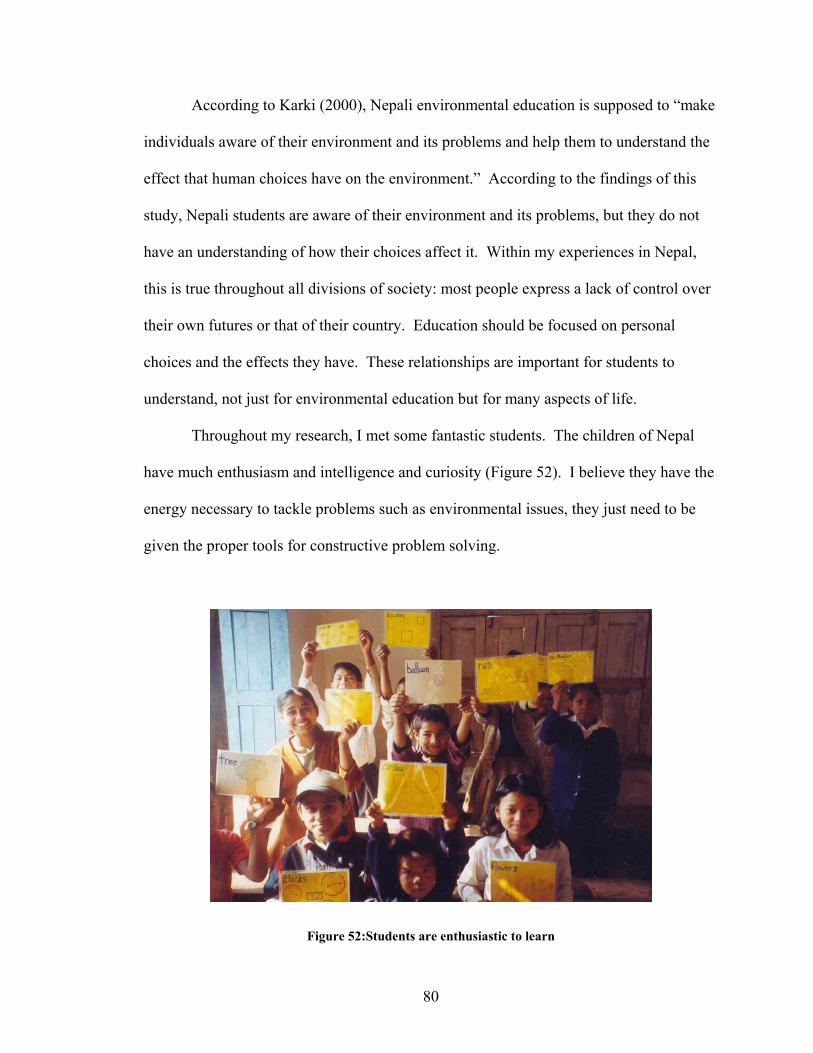
80
According to Karki (2000), Nepali environmental education is supposed to “make
individuals aware of their environment and its problems and help them to understand the
effect that human choices have on the environment.” According to the findings of this
study, Nepali students are aware of their environment and its problems, but they do not
have an understanding of how their choices affect it. Within my experiences in Nepal,
this is true throughout all divisions of society: most people express a lack of control over
their own futures or that of their country. Education should be focused on personal
choices and the effects they have. These relationships are important for students to
understand, not just for environmental education but for many aspects of life.
Throughout my research, I met some fantastic students. The children of Nepal
have much enthusiasm and intelligence and curiosity (Figure 52). I believe they have the
energy necessary to tackle problems such as environmental issues, they just need to be
given the proper tools for constructive problem solving.
Figure 52:Students are enthusiastic to learn
81
LITERATURE CITED
Adhikari, M., S. Nagata and M. Adhikari. 2004. Rural Household and Forest: an evaluation of household’s dependency on community forest in Nepal. Journal of Forest Research: 9, pp. 33-44.
Alerby, E. 2000. A Way of Visualising Children’s and Young People’s Thoughts about
the Environment: a study of drawings. Environmental Education Research: 6 (3), pp. 205-222.
American Forest Foundation. 1987. Project Learning Tree: Environmental Education
Activity Guide. American Forest Foundation, Washington, D.C. Arnold, J.E.M. and J.G. Campbell. 1985. Collective Management of Hill Forests in
Nepal: The Community Forestry Development Project. in Proceedings of the Conference on Common Property Resource Management, April 21-26, 1985. National Academy Press, Washington, D.C.
Aronsson, K. and S. Andersson. 1996. Social Scaling in Children’s Drawings of
Classroom Life: A cultural comparative analysis of social scaling in Africa and Sweden. British Journal of Developmental Psychology: 14, pp. 301-314.
Ballantyne, R., J. Fien and J. Packer. 2001. School Environmental Education
Programme Impacts upon Student and Family Learning: a case study analysis. Environmental Education Research: 7 (1), pp. 23-37.
Barraza, L. 1999. Children’s Drawings about the Environment. Environmental
Education Research: 5 (1), pp. 49-66. Barraza, L. and R. Walford. 2002. Environmental Education: a comparison between
English and Mexican school children. Environmental Education Research: 8 (2), pp. 171-186.
Batterham, D., M. Stanisstreet, and E. Boyes. 1996. Kids, Cars and Conservation:
children’s ideas about the environmental impact of motor vehicles. International Journal of Science Education: 18 (3), pp. 347-354.
BBC News (British Broadcasting Corporation). 2001. Darjeeling tea growers at risk. 27
July 2001. http://news.bbc.co.uk/2/hi/business/1456988.stm. Beets, W.C. 1990. Raising and Sustaining Productivity of Smallholder Farming Systems
in the Tropics: A Handbook of Sustainable Agricultural Development. AgBé Publishing, Alkmaar, Holland.
Berger, R. 1994. Children Draw Their Stepfamilies. Journal of Family Psychotherapy:
5 (4), pp. 33-48.

82
Bernard, H.R. 2002. Research Methods in Anthropology. 3rd edition. Altamira Press, Walnut Creek, California.
Bista, D.B. 1991. Fatalism and Development: Nepal’s Struggle for Modernization.
Orient Longman, Calcutta. Bista, D.B. 2000. People of Nepal. Ratna Pustak Bhandar, Kathmandu. Boyes, E. and M. Stanisstreet. 1993. The ‘Greenhouse Effect’: children’s perceptions of
causes, consequences and cures. International Journal of Science Education: 15 (5), pp. 531-552.
Brown, J.M., J. Henderson and M.P. Armstrong. 1987. Children’s Perceptions of
Nuclear Power Stations as Revealed through their Drawings. Journal of Environmental Psychology: 7, pp. 189-199.
Burch, E. 1995. Ecocrisis in Nepal: The Role of Environmental Media. Mass
Communication Review: 22 (1), pp. 46-63. CBS (Central Bureau of Statistics). 1993. National Sample Census of Agriculture;
District Summary. Central Bureau of Statistics, National Planning Commission Secretariat, His Majesty’s Government of Nepal; Kathmandu.
CBS (Central Bureau of Statistics). 2002. Population Census 2001: National Report.
Central Bureau of Statistics, National Planning Commission Secretariat, His Majesty’s Government of Nepal; Kathmandu.
Chambers, D.W. 1983. Stereotypic Images of the Scientist: the Draw-A-Scientist Test.
Science Education: 67 (2), pp. 255-265. Chapagain, P.S., P.K. Ghimere, and R. Thapa. 2002. New Ekta School Atlas, 2nd edition.
Ekta Books; Kathmandu. CIA (Central Intelligence Agency). 2003a. The World Factbook – Nepal.
http://www.cia.gov/cia/publications/factbook/geos/np.html. Page last updated 18 December 2003.
CIA (Central Intelligence Agency). 2003b. The World Factbook – United States.
http://www.cia.gov/cia/publications/factbook/geos/us.html. Page last updated 18 December 2003.
Cohen, L and L. Manion. 1994. Research Methods in Education. 4th edition.
Routledge, New York.

83
Cohen, O. and T. Ronen. 1999. Young Children’s Adjustment to Their Parents’ Divorce as Reflected in Their Drawings. Journal of Divorce and Remarriage: 30 (1/2), pp. 47-70.
Council for Environmental Education. 1996. Project WILD: K-12 Activity Guide.
Bethesda, Maryland. Cox, M.V. 1992. Children’s Drawings. Penguin Books, New York. Crook, C. 1985. Knowledge and Appearance. in Visual Order; the nature and
development of pictorial representation, eds. N.H. Freeman and M.V. Cox. Cambridge University Press, Cambridge. pp. 248-265.
Culen, G. and T. Volk. 2000. Effects of an Extended Case Study on Environmental
Behavior and Associated Variables in Seventh- and Eighth-Grade Students. Journal of Environmental Education: 31 (2), pp. 9-15.
Elliot, J. 1995. The Politics of Environmental Education: a case-study. The Curriculum
Journal: 6 (3), pp. 377-393. Emerson, R.M., R.I. Fretz, and L.L. Shaw. 1995. Writing Ethnographic Fieldnotes. The
University of Chicago Press, Chicago. Europa (Europa Publications Limited). 2000. The Europa World Year Book. Europa
Publications Limited, London: 2, pp.2631-2648. Fien, J. 1997. Learning to Care: a Focus for Values in Health and Environmental
Education. Health Education Research: 12 (4), pp. 437-447. Fien, J., I. Teh-Cheong Poh Ai, D. Yencken, H. Sykes, and D. Treagust. 2002. Youth
Environmental Attitudes in Australia and Brunei: implications for education. The Environmentalist: 22, pp. 205-216.
Finlay, H., R. Everist, and T. Wheeler. 1999. Lonely Planet: Nepal. Lonely Planet
Publications, Melbourne. Fleer, M. 2002. Curriculum Compartmentalisation?: a futures perspective on
environmental education. Environmental Education Research: 8 (2), pp. 137-154. FNCCI (Federation of Nepalese Chambers of Commerce and Industry). 2004. Facts and
Figures about Nepal. http://www.fncci.org/ginfo.php. Page visited 24 February 2004.
Gardner, H. 1980. Artful Scribbles: The Significance of Children’s Drawings. Basic
Books, New York.

84
Golomb, C. 2004. The Child’s Creation of a Pictorial World. 2nd Edition. Lawrence Erlbaum Associates, Mahwah, New Jersey.
Gomez-Granell, C. 1993. Development of Conceptual Knowledge and Attitudes about
Energy and the Environment. International Journal of Science Education: 15 (5), pp. 553-565.
Gough, S. and A. Reid. 2000. Environmental Education Research as Profession, as
Science, as Art and as Craft: Implications for Guidelines in Qualitative Research. Environmental Education Research: 6 (1), pp. 47-57.
Guneratne, A. 1998. Modernization, the State, and the Construction of a Tharu Identity
in Nepal. The Journal of Asian Studies: 57 (3), pp. 749-773. Guneratne, K.B. 1999. In the Circle of the Dance; Notes of an Outsider in Nepal.
Cornell University Press, New York. Hagen, T., F.T. Wahlen and W.R. Corti. 1961. Nepal: The Kingdom in the Himalayas.
Kümmerly & Frey, Geographical Publishers, Berne, Switzerland. Haney, W., M. Russell, C. Gulek, and E. Fierros. 1998. Drawing on Education: Using
Student Drawings to Promote Middle School Improvement. Schools in the Middle: February 1998, pp. 38-43.
Heleniak, T. 2002. Population Growth Continues to Hinder Nepal’s Economic Progress.
Population Today: 30 (5), pp. 3, 6. Hikawa, H. 1999. Attitudes toward Waste Management and Perceptions of
Environmental Education in Pokhara, Nepal. MS thesis, Michigan State University.
Hillcoat, , J., K. Forge, J. Fien, and E. Baker. 1995. ‘I Think It’s Great that Someone Is
Listening to Us…’: young people and the environment. Environmental Education Research: 1 (2), pp. 159-171.
Jones, J. 2001. Around the Globe, Women Outlive Men. Population Today: 29 (6), p 6. Jones, R.L. and S.K. Jones. 1976. The Himalayan Woman: A Study of Limbu Women in
Marriage and Divorce. Mayfield Publishing Company, Palo Alto, California. Joshi, G.P. and J. Anderson. 1994. Female Motivation in the Patriarchal School: an
analysis of primary textbooks and school organization in Nepal, and some strategies for change. Gender and Education: 6 (2), pp. 169-181.

85
Karki, U. 2000. Environmental Education. in Environmental Education Source Book for Bachelor of Education Programme, eds. Badri Pande, Sharada Maharjan, Vidyadhar Shakya, Uddhab Karki. IUCN Nepal, Kathmandu.
Kathmandu Post. 2001. Sailing rough for tea industry. 29 November 2001.
http://www.nepalnews.com.np/contents/englishdaily/ktmpost/2001/nov/nov29/economy1.htm.
Kellogg, R. 1979. Children’s Drawings, Children’s Minds. Avon Books, New York. King, D.L. 1995. Doing Their Share to Save the Planet: Children and Environmental
Crisis. Rutgers University Press, New Brunswick, New Jersey. Klepsch, M. and L. Logie. 1982. Children Draw and Tell: An Introduction to the
Projective Uses of Children’s Human Figure Drawings. Brunner/Mazel, New York.
Leeming, F., W. Dwyer, B. Porter, and M. Cobern. 1993. Outcome Research in
Environmental Education: A Critical Review. Journal of Environmental Education: 24 (4), pp. 8-21.
Loughland, T., A. Reid and P. Petocz. 2002. Young People’s Conceptions of
Environment: a phenomenographic analysis. Environmental Education Research: 8 (2), pp. 187-197.
Luquet, G-H. 1927. Le Dessin Enfantin (Children’s Drawings). translated by A.
Costall, 2001. Free Association Books, London. Malchiodi, C. 1998. Understanding Children’s Drawings. Guilford Press, New York. Maloney, M. and M. Ward. 1973. Ecology: Let’s Hear from the People: An objective
scale for the measurement of ecological attitudes and knowledge. American Psychologist: 28, pp. 583-586.
Matthews, M.H. 1985. Young Children’s Representations of the Environment: A
comparison of techniques. Journal of Environmental Psychology: 5, pp. 261-278. Matthews, M.H. 1992. Making Sense of Place: children’s understanding of large-scale
environments. Barnes and Noble, Savage, Maryland. Mehta, J.N. 1994. Status of Environmental Education in Nepal.
http://www.geocities.com/jaimehta223/article5.html. Visited 13 January 2004. Mitchell, J.D. 1998. Female Education Gaining Ground. in Vital Signs 1998: The
Environmental Trends that are Shaping Our Future, eds. L. Brown, M. Renner, C. Flavin, and L. Starke. W.W. Norton & Company, New York. pp. 154-155.

86
MoE (Ministry of Education). 2003. Education Statistics. http://www.moe.gov.np/stats/index.php. Ministry of Education and Sports, His Majesty’s Government of Nepal, Kathmandu, Nepal. Last updated on 3 March 2004.
Negi, S. 1994. Forests and Forestry in Nepal. Ashish Publishing House, New Delhi. NepalNet (Network for sustainable development in Nepal). 2004. Population in Nepal.
http://www.nepalnet.org.np/socio/pop.htm. Page visited 24 February 2004. NSA (Nepalese Student Association). 2002.
http://www.southalabama.edu/nepal/ngeography.htm. Page last updated 3 November 2002.
Nyquist, J., L. Manning, D. Wulff, A. Austin, J. Sprague, P. Fraser, C. Calcagno, and B.
Woodford. 1999. On the Road to Becoming a Professor: The Graduate Student Experience. Change: 31 (3), pp. 18-27.
Onta, P. 2000. Nepal Education: Finding a Ray of Hope. Economic and Political
Weekly: 35 (47), pp.4093-4096. Palmer, J. 1993. From Santa Claus to Sustainability: emergent understanding of
concepts and issues in environmental science. International Journal of Science Education: 15 (5), pp. 487-495.
Pande, B. 2002. Interview by Sara Keinath. September 11. IUCN Nepal office,
Bakhundole, Lalitpur, Nepal. Pande, B. and U. Karki. 1998. Primary School Student Achievement in Environmental
Education. IUCN Nepal, Kathmandu. Pande, B., B. Thapa, and U. Karki, eds. 2001. Achievement of Secondary School
Students in Population and Environmental Education. IUCN Nepal, Kathmandu. Payne, P. 1998. Children’s Conceptions of Nature. Australian Journal of
Environmental Education: 14, pp. 19-26. Peace Corps/Nepal. 2000. Peace Pieces: An Environmental Education Toolkit. Peace
Corps/Nepal, Kathmandu. Piaget, J. 1969. The Child’s Conception of the World. J. and A. Tomlinson, translators.
Littlefield, Adams & Co., Totowa, New Jersey. Rajbhandari, P. and J. Wilmut. 2000. Assessment in Nepal. Assessment in Education: 7
(2); pp.255-269.

87
Robertson, A. 1993. Eliciting Students’ Understandings: Necessary Steps in Environmental Education. Australian Journal of Environmental Education: 9, pp.95-114.
Rose, L. and M. Fisher. 1970. The Politics of Nepal: Persistence and Change in an
Asian Monarchy. Cornell University Press, Ithaca, NY. Rosoff, Y. 2003. Himalayan Thunder. Weatherwise: 56 (4), pp. 13-19.
Sattaur, O. 1996. Nepal: New Horizons? Oxfam Publications, Oxford, UK. Savada, A.M., ed. 1993. Nepal and Bhutan: country studies. 3rd Edition. Library of
Congress, Research Division, Washington, D.C. Seddon, D., J. Adhikari and G. Gurung. 2002. Foreign Labor Migration and the
Remittance Economy of Nepal. Critical Asian Studies: 34 (1), pp. 19-40. Shah, R.K. 2002a. Our Environment and Population; Class VI, 4th edition. Ekta Books,
Kathmandu. Shah, R.K. 2002b. Our Environment and Population; Class VII, 3rd edition. Ekta
Books, Kathmandu. Shah, R.K. 2002c. Our Environment and Population; Class VIII, 3rd edition. Ekta
Books, Kathmandu. Shrestha, N.R. 2002. Nepal and Bangladesh: A Global Studies Handbook. ABC-CLIO,
Santa Barbara, California. Stash, S. and E. Hannum. 2001. Who Goes to School? Educational Stratification by
Gender, Caste, and Ethnicity in Nepal. Comparative Education Review: 45 (3), pp. 354-378.
Sudarmadi, S., S. Suzuki, T. Kawada, H. Netti, S. Soemantri and A. Tugaswati. 2001. A
Survey of Perception, Knowledge, Awareness, and Attitude in Regard to Environmental Problems in a Sample of Two Different Social Groups in Jakarta, Indonesia. Environment, Development and Sustainability: 3, 169-183.
Thomas, G. and A. Silk. 1990. An Introduction to the Psychology of Children’s
Drawings. New York University Press, New York. Tovey, R. 1997. Draw a Picture: How Students See Their Teachers. Principal: 76 (5),
pp. 36-38.

88
UNCED (United Nations Conference on Environment and Development). 1992. Agenda 21: Programme of Action for Sustainable Development; The final text of agreements negotiated by governments at the United Nations Conference on Environment and Development, 3-14 June 1992, Rio de Janeiro, Brazil. UN Department of Public Information, New York.
UN-Habitat. 1999. Nepal Demography and Conditions.
http://www.unhabitat.org/habrdd/conditions/socentasia/nepal.htm. Page last updated 12 July 1999.
UT (University of Texas) Library Online. 2004. Reference maps of Asia.
http://www.lib.utexas.edu/maps/asia.html. Page last modified 10 February 2004. Wales, R. 1990. Children’s Pictures. in Understanding Children, eds. R. Grieve and M.
Hughes. Basil Blackwell, Cambridge, Massachusetts. pp.140-155. Wals, A. 1992. Young Adolescents’ Perceptions of Environmental Issues: Implications
for Environmental Education in Urban Settings. Australian Journal of Environmental Education: 8, pp. 45-58.
Watercourse and Western Regional Environmental Education Council. 1995. Project
WET (Water Education for Teachers); curriculum and activity guide. Bozeman, MT.
World Bank. 2004. World Development Indicators Database: Nepal Country Profile.
http://devdata.worldbank.org/external/CPProfile.asp?SelectedCountry=NPL&CCODE=NPL&CNAME=Nepal&PTYPE=CP. Page visited 24 February 2004.
Yencken, D., J. Fien and H. Sykes, eds. 2000. Environment, Education and Society in
the Asia-Pacific: Local traditions and global discourses. Routledge, London. Yin, R.K. 1994. Case Study Research: Design and Methods. 2nd edition. Sage
Publications, Thousand Oaks, California.

89
APPENDIX A: SCHOOL ATTRIBUTES
School Type of school
Number of students
Environmental attitude Professions of parents
How far students walk to school
Durga Secondary School; Garamani, Jhapa
government 62, one section of class 8
(1150 total)
Just started teaching EE 3 yrs ago, no extra-curricular EE programs
Farmers, masons, carpenters, laborers
As far away as 7 km (2 hr walk, but buses are available)
Bhagawati Secondary School; Golakharka, Ilam
government 59, class 8 (445 total)
Many short-term volunteer EE projects: built incinerator, painted mural, improved toilet, Eco-Club; but most projects fizzle after volunteer leaves
Farmers As far away as 3 hr walk, average 20 min
Shree Nilkantha English Boarding School; Phidim, Panchthar
private 11, class 8 (300 total)
No extra EE programs Teachers, doctors, officers, farmers
As far away as 40 min, average 15 min
Mechi St. Mary’s English Boarding School; Taplejung
private 15, class 8 (320 total)
Celebrate World Environment Day, clean up school grounds occasionally, have a trash pit
Farmers, teachers, army
As far away as 1 ½ hrs, average 20 min
Oxford Model English Boarding School; Taplejung
private 6, class 8 (300 total)
Had one tree-planting exercise Shopkeepers, teachers, doctors, farmers
As far away as 1 hr, average 30 min

90
APPENDIX B: DATA SET
Digital photos of the original posters are located on this CD. Posters are organized by school name first, then by activity category (past, present and future). There are two copies of the pictures in two different formats: folder names indicated with a 1 are photos taken with a flash, while folder names indicated with a 2 are photos taken with a document setting. The flash pictures are sometimes dark, but are closer to true representations of color. The document pictures have a higher contrast. Photos can also be found at the website: http://peacecorps.mtu.edu/NepalPosters.