Embed Size (px)
Citation preview

U.S. GEOLOGICAL SURVEY—MINERALS INFORMATION 1
CEMENTBy Hendrik G. van Oss
Cement is the binding agent in concrete and mortars and is properties. Portland cement is almost always gray, but if care isthus a critical component of the construction industry. As shown taken to burn only iron-free raw materials, a more valuablein tables 1 through 3, overall production of (portland and version, white cement, can be obtained. Masonry cements aremasonry) cement in the United States declined about 1% in broadly similar to portland cements and can be made from the1995 to about 77 million metric tons, of which 95% was same clinker; chemical and other admixtures commonly areportland cement. The United States remained the world's third introduced during grinding to adjust the cement's finallargest cement producer; world output was estimated to have properties. increased 3% in 1995 to about 1.4 billion tons. Portland cement can be interground with pozzolans to
In contrast to production, overall U.S. cement consumption produce a variety of so-called blended cements. These areincreased modestly, with a large increase in imports more than included under the portland cement designation in this report.offsetting the drop in production. Exports increased significantly Pozzolans are materials, such as certain rocks (mainly tuffs) andin 1995 but remained a small fraction of total U.S. cement industrial byproducts (e.g., granulated blast furnace slag, fly ash,commerce. Plant valuation of U.S. cement shipments (from silica fume), that exhibit hydraulic cementitious properties whenmills) in 1995, including those in Puerto Rico, was almost $5.5 finely ground and mixed with free lime. Although popularbillion and total shipments were worth about $6 billion. Both overseas, blended cement production in the United States inwere up about 10% from the values in 1994, reflecting a 1995 remained small, particularly that by the cementsignificant unit price increase for the year. Using typical cement- manufacturers themselves. The majority of production ofto-concrete mass ratios, the value (delivered) of concrete in the blended cement, and hence consumption of pozzolans, actuallyUnited States in 1995 was estimated at about $22 billion. was by U.S. concrete manufacturers. The term masonry cement
In this report, “cement” refers exclusively to hydraulic also is used broadly in this report and includes portland lime andcement, which is cement that will set and harden under water, plastic cements.and which is overwhelmingly the dominant category of cement The data shown in tables 1 through 7, and 10 through 15,manufactured in the United States and elsewhere in the world. were compiled from annual U.S. Bureau of Mines (USBM) andFurther, unless otherwise stated, only the portland and masonry U.S. Geological Survey (USGS) questionnaires sent tovarieties of hydraulic cement are covered in this report. Notably, domestic clinker and cement manufacturing plants andwith the exception of the trade tables, pure pozzolan cements importers. In 1995, responses were received from 124 of theand aluminous cements are not included; these account for only 130 facilities canvassed; the responding facilities accounted fora small fraction of the total U.S. cement market. 99% of total U.S. cement production and shipments. In 1994,
Concrete is a controlled mixture of cement, fine and coarse responses were received for 126 of 131 facilities surveyed,aggregates, and water that, through complex cement hydration recording 96% of total apparent production and shipments.reactions, hardens into a rocklike mass of specifiable properties. Estimates were incorporated for the nonrespondents, based onCement use largely mirrors the concrete market, which is served monthly shipments data and/or past annual data. During thein the United States by more than 3,000 concrete manufacturers. compilation of tables, data remained unavailable even forMortar is a mixture of masonry or similar cement, fine estimation purposes for one small plant in Nevada thataggregate, and water that is used to bind together building commenced operations in 1995 and which was thus not includedblocks, such as bricks and stones. in the tables. Subsequent information shows that its production
Strictly, portland cement is an interground mixture of would not significantly alter the tabulations shown. Concreteportland cement clinker and about 5% gypsum. The clinker producers were not surveyed and hence the true production andmainly is composed of calcium silicates and is made through consumption of blended cement in the United States iscontrolled burning at high temperature of a measured blend of underrepresented in this report.calcareous rocks (usually limestone) with lesser quantities of Not all returned annual cement questionnaires were fullysilicious, aluminous, and ferriferous materials. The blend is completed. Where followup inquiries were unsuccessful,adjusted according to the chemical composition of the raw estimates were made for any missing data and incorporated intomaterials and the type of portland cement desired. In the United the aggregated totals. For 1995, the missing data (and thus theStates, there are basically five types (Types I through V) of estimates) in most cases constituted only very small percentagesportland cement, denoting such properties as high sulfate of the aggregated totals. The introduced estimation errors areresistance, high early strength, etc. Elsewhere in the world, other thus considered insignificant. An important exception, asdesignations may be used for portland cements of similar discussed in the Consumption section, is for portland cement
1

2 U.S. GEOLOGICAL SURVEY—MINERALS INFORMATION
shipments by customer type (see table 14), where the cement April.producers readily admit to having incomplete knowledge.
As in previous years, there is an important discrepancybetween the shipments data in the annual tables enumeratedabove and the shipments-to-final-customers data in tables 8 and Like other heavy industries, the cement industry is affected9. Tables 8 and 9 differ from the rest in that they are derived by any number of Government economic and related policies,from monthly shipments surveys of cement companies. As a including periodic investigations into the cement industry'smeasure of cement consumption, these monthly-based data are general business practices. The latest of these, an 18-monthpreferred, for reasons discussed in more detail under the antitrust investigation by the Justice Department, was droppedConsumption section. Integration of tables 8 and 9 data with the without comment in November 1995. In recent years,other tables has not been done to avoid creating additional Government policies of most concern to the cement industryinternal inconsistencies. have been those relating to trade (cement imports) and
Tables 16-20 show nonproprietary trade data from the environmental issues.Bureau of the Census in lieu of the proprietary data collected Most of the cement trade issues have revolved around recentthrough the USGS monthly questionnaires. World production previous determinations of cement dumping by Japanese anddata shown in table 21 were developed by USGS country Mexican cement companies and the resulting imposition ofspecialists from a variety of sources. antidumping tariffs on imports from these countries. These
Some data are presented for State groupings or “districts” tariffs have dramatically reduced cement and clinker importswhere required to protect proprietary data. Certain major from both countries and were under appeal by the Mexicancement-producing States have been subdivided along county company involved. U.S. administrative reviews in 1995lines to provide additional market information. confirmed the earlier tariffs; further reviews were expected to be2
The data in this report generally support conclusions in concluded in 1996 as were the findings of a North Americancompany annual reports and the trade literature that 1995 was Free Trade Agreement (NAFTA) appeals panel.overall a good year for the U.S. cement industry. Where not The Environmental Protection Agency (EPA) was studyingconstrained by repairs, most plants operated at high capacity a number of environmental issues related to cementutilization levels. Domestic output of cement was inadequate to manufacturing; these deliberations were of vital interest to themeet demand, which led to price increases and significantly industry. Apart from the mining of 120 to 125 million tons perimproved company revenues. Imports increased to make up for year of cement raw materials, most cement environmental issuesthe shortfall, but this had little dampening effect on prices. This relate to the manufacture of clinker. Clinker kilns burn largewas in marked contrast to the high import levels in the 1980's, quantities of fossil and/or other organic fuels towhen cheap imports were used to undercut domestic production. thermochemically break down (calcine) calcareous rocks andThe difference in 1995 reflected post-1990 antidumping tariffs instigate other clinker-forming chemical reactions. Bothand the fact that, in the interim, more than one-half of the U.S. combustion and calcination evolve large quantities of carbonclinker production capacity has become foreign-owned. dioxide—a so-called greenhouse gas—and some form of carbon
A modest number of plant ownership and/or operational tax on fuels and electricity to reduce these emissions was underchanges took place during the year. Lafarge Corp. completed consideration by the EPA, in line with enacted or plannedpurchase of the National Portland Cement grinding plant near carbon taxes on Western European producers. The productionTampa, FL, from a subsidiary of Vencemos Pertigalete of cost increases from the imposition of carbon taxes likely wouldVenezuela. Lone Star Industries Inc. sold its 50% holdings in be high, as there is no known practical way to significantly3
Hawaiian Cement to KRC Holdings, Inc. Medusa Cement reduce the calcination component of carbon dioxide emissions4
Corp. sold its Orlando, FL, terminal to Conrad Yelvington, Inc.; in clinker manufacture. Consumption of cement derived fromthe terminal services are contracted to Tarmac America Inc.'s clinker can be reduced through increased use of pozzolanPennsuco operation in Florida. Tarmac had purchased the extenders (as blended cement) but, to some degree, such use is5
Pennsuco plant the previous year. Southdown Inc. bought constrained by cement specifications in existing constructionEastern Cement's Florida terminal. codes. 6
UNICEM SpA of Italy became the 100% owner of RC Increasingly stringent Government restrictions on fuel-Cement Co., Inc. through the purchase of the 33% stake in RC derived emissions of so-called NO and SO , and of dioxins andCement held by Italcimenti SpA. Sunbelt Cement took over furans, are of concern to the industry, particularly to the degree7
management of the Gulf Coast Portland Cement Co. terminal that changing emission limits necessitate changes in testingand grinding plant, near Houston, TX, from their mutual parent procedures, equipment, and operating practices. These limitscompany, Cemex S.A. of Mexico. Although the grinding plant also affect the ability of plants to inexpensively utilize wastewas taken out of (cement) operation in May 1995, the facility fuels. continued to operate as a terminal. Similarly, Lehigh Portland Another major waste product of clinker manufacturing is8
Cement Co. operated its Cementon, NY, facility solely as a cement kiln dust (CKD), made up of particles of clinker,terminal in 1995, having idled its clinker and grinding lines the incompletely reacted raw materials and solid fuels, and materialprevious year. Essroc Corp. idled its Egypt, PA, plant in eroded from the kiln's refractory brick lining. Almost all CKD9
10
Legislation and Government Programs
x x
U.S. GEOLOGICAL SURVEY—MINERALS INFORMATION 3
is captured either by electrostatic precipitation or baghouse portland cement plants making both clinker and cement, and 7filtration, either for reuse as kiln feed or a soil conditioner for dedicated grinding plants. Table 2 shows the number of plants,farms, or for storage in a landfill. Nevertheless, worries remain reported portland cement production, capacity, and yearendregarding unacceptable levels in some CKD of hazardous trace stockpiles, on a district basis, with the single Nevada exceptionelement or organic contaminants, such as chromium chemicals noted beforehand. from refractory bricks, and nickel and vanadium from fossil As shown in table 2, portland cement production in 1995 fellfuels. Objections have been raised by environmental groups and 1.4% to about 73.3 million tons. Grinding capacity for thecommercial waste incineration companies to perceived risks of country remained essentially unchanged, although there werecontaminant emissions arising from the cement industry's regional differences resulting, for example, from grinding plantincreasing use of waste fuels. closures in New York in late 1994 and in southern Texas early
Under amendments to the Resource Conservation and in 1995, and various upgrades of some grinding facilitiesRecovery Act (RCRA) in 1980, the EPA was instructed to study elsewhere. There continued to be significant excess grindingso-called Bevill (amendment) wastes, including CKD, to see if capacity. End of year cement stockpiles rose significantly to 5.4such were to be regulated under the hazardous waste provisions million tons in part because of winter weather downturns inof RCRA. The EPA completed its Report to Congress on CKD construction coupled with excess imports. The top five portlandlate in 1993; in this, CKD was described as posing little cement producer States, in descending order, were California,environmental or health risk, but some ground water Texas, Pennsylvania, Michigan, and Missouri.contamination problems owing to CKD mismanagement were The USGS annual surveys no longer break out productionidentified. The EPA issued an associated regulatory tonnages by type of portland cement, but it may be presumeddetermination in January 1995 that reaffirmed the risk that output was proportional to the reported shipments of eachconclusions of the 1993 Report, and proposed, under the type (see table 15). It may thus be assumed that Types I and IIauthority of RCRA Subtitle C (hazardous wastes), drafting in accounted for about 90% of total reported portland cementconsultation with interested stakeholders a tailored set of production. As previously noted, data on blended cementmanagement standards for CKD. Importantly, the 1995 production (and shipments) are incomplete owing to a lack ofdetermination ruled that the standards need not be the stringent information from the concrete sector.ones in Subtitle C; that is, CKD was not ruled to be a hazardous Cement companies in the United States ranged from small,waste. A perceived lack of rigor in the determinations language single plant operations, each accounting for less than 0.5% ofprompted the cement industry, in March 1995, to present to total U.S. production capacity, to large multiplant corporations,EPA a so-called Enforceable Agreement that laid out standards ranging from 3% to almost 13% of U.S. capacity. In 1995, thefor CKD management. The EPA reviewed the industry proposal top 10 portland cement producers, combined, accounted forbut, in November 1995, professed itself uncertain of its 57.6% of total U.S. output and 58.5% of total cement grindingauthority under RCRA to sign such an agreement. Further action capacity. Their combined grinding capacity utilization averagedon this issue was envisioned for 1996. 79.5%. The top 10 companies, in declining order of production,
Production
In 1995, cement was produced in 37 States and in Puerto and California Portland Cement Co. Rico by a total of 46 companies, including one State agency.Production and related data are shown in tables 2 through 4. Thetables exclude one plant in Nevada that commenced productionin 1995 but for which data were unavailable at the time of tablecompilation. Including this facility, by yearend 1995 there werea total of 118 cement plants in operation.
A number of cement companies were modernizing and/orupgrading their plants, in many cases to reduce energy and othercosts. Royal Cement Co., Inc. commenced commercialoperations at its Logandale, NV, plant. Installed clinkercapacity, according to the company, was 200,000 tons per year.Two companies announced plans to construct new, as opposedto replacement, kilns. Florida Rock Industries was planning tobuild a 750,000-ton-per-year integrated facility at Newberry,FL, that was expected to be on-line in 1998. Florida Crushed11
Stone Co. announced that it would be adding a second kiln to itsexisting Brooksville, FL, plant. The new kiln would double theplant's cement capacity to about 1.2 million tons per year.12
Portland Cement.—At yearend, there were 111 integrated
were Holnam, Inc.; Lafarge Corp.; Southdown, Inc.; Ash GroveCement Co.; Blue Circle Inc.; Essroc Materials, Inc.; Lone StarIndustries, Inc.; Lehigh Portland Cement Co.; Medusa Corp.;
Masonry Cement.—Production of masonry cement, asshown in table 3, was essentially stagnant in 1995 atapproximately 3.6 million tons—about 5% of total U.S. cementoutput. Yearend stockpiles increased modestly. Masonrycement, as in 1994, was produced by 32 companies, at 84 plantsnationwide.
Clinker.—District information for clinker production andcapacity, excepting that for one new plant in Nevada, is given intable 4. Including the Nevada facility and 2 plants in PuertoRico, clinker was produced in 1995 by 111 integrated cementplants operating a total of 207 kilns. Most clinker continued tobe made by dry-process kilns. Clinker production in 1995increased about 2% over that in 1994 to about 70 million tons.Of the top five clinker-producing States, the largest continuedto be California, followed by Texas, Pennsylvania, Missouri, andMichigan.
There was a slight increase in overall kiln capacityutilization in 1995. Unlike the portland cement grindingcapacities shown in table 2, which were reported to the USGS

4 U.S. GEOLOGICAL SURVEY—MINERALS INFORMATION
on a plant basis, the clinker capacities shown in table 4 were small component of total fuel use. Consumption of rubber tirescalculated by the USGS based on each kiln's reported daily for fuel increased 32%, but that of other solid waste fuelscapacity and number of days reported for the year as scheduled dropped 8%. downtime. Not included were any idle kilns requiring more than Electricity consumption data are dominated by the demandsa few months to restart. The average operational kiln capacity in of the grinding circuits of cement mills. As shown in table 7, per1995 was about 371,000 tons per year, virtually unchanged unit electricity consumption did not significantly change infrom that in 1994. 1995.
The top 5 companies had almost 38% of both clinkercapacity and production and the top 10 had 59% of capacity and62% of production, respectively. The top 10 companies, indeclining order of clinker capacity, were Holnam, Inc.; Lafarge Shipment data for cement are used to approximate cementCorp.; Southdown, Inc.; Ash Grove Cement Co.; Blue Circle consumption levels in the United States. Only shipments to finalInc.; Essroc Materials, Inc.; Medusa Corp.; Lone Star Industries, customers are considered to represent “true” consumption.Inc.; Lehigh Portland Cement Co.; and California Portland Shipments from a mill to other cement plants or distributionCement Co. terminals of the same company, and those to other cement
Consumption of Raw Materials and Energy.—The nonfuelraw material mix used to produce cement, most of which wentinto producing the clinker component, is shown in table 5. Asexpected, almost 85% of the mix was calcareous rocks and theconsumption increase thereof in 1995 mirrored that of clinkernoted above. Among aluminous feeds, there was a 21% drop inshale consumption in 1995 that evidently was balanced, in termsof alumina credits, by an almost doubling of other aluminousfeeds such as bauxite and alumina. The shale decrease appearsalso to have diminished the iron oxide and silica balances in theclinker meal feed. The iron oxide deficit appears to have beencounterbalanced by the significant increase shown in table 5 forferrous feeds, and possibly by the increase in tonnage of wastetires (some of which contain steel belting) burned as kiln fuel asshown in table 6. Any silica deficit resulting from the reducedconsumption of shale appears to have been offset by the increasein purely silicious feeds.
Pozzolan consumption, to the degree split out in table 5,increased 32% in 1995. This would support a qualitativeincrease in blended cement production, and such is suggested bythe apparent increase of at least 70% in blended cementsshipments shown in table 15. However, no stoichiometricconclusions can be drawn because there are no uniqueproportions of pozzolans in blended cements. Further, thepozzolan consumption shown in table 5 greatly exceeds thatneeded to account for the blended cement shipments. Thus itappears that much of the pozzolan consumption shown was askiln feed rather than for blended cements.
Fuel consumption, largely reflecting kiln operation, is shownin table 6. Coal use fell about 6% in 1995, only slightly offset bythe footnoted 49% increase in the use of coke and a 6% increasein petroleum coke. Fuel oil consumption fell about 15%.Although the data are not shown on a State basis, there were noobvious regional or company trends in these shifts. In contrast,overall natural gas consumption increased by almost 65%, withespecially large increases noted in Arkansas, Oklahoma, andTexas, and only a few States showing declines—mainly in theGreat Lakes region. Overall consumption of liquid waste fuels(such as recycled/used oils and solvents) increased dramatically,despite the fact that about half of the reporting districts actuallyreported small declines. Solid wastes continued to be only a
Consumption
companies, are left uncounted until they are transferred to a finalcustomer. “Final customer” is as indicated by the cementproducer(s) and ignores the possibility that said customer (likelya concrete manufacturer) might put some cement into stockpilesextending beyond yearend (to be “consumed” the followingyear) or might resell cement to other users. However, althoughthere are no data available on such storage or transfers, it islikely that the overall tonnage would involve no more than about5% of any 1 month's shipments and would balance out over aperiod of months.
Cement shipments and derived data are given in tables 8through 15. Two data collection methodologies are represented.Tables 8 and 9 are based on monthly shipment surveys ofcement company headquarters. These forms generally arereturned on a consolidated basis—one form covering all of thecompany's plants and, importantly, its terminals. In contrast,tables 10 through 15 were collected from general annual surveysof individual plants and certain, but not all, terminals.
Over the years, shipment data from the two sets of tableshave shown significantly different totals, for reasons not fullyunderstood. For example, per table 11, portland cementshipments by producers to final customers in 1995 totaled76.414 million tons, including imported cement and clinker, andincluding Puerto Rico. Masonry cement shipments (see table12) totaled 3.510 million tons. In contrast, the data for 1995 intable 8 show total portland cement shipments to final customersof 84.724 million tons, and masonry shipments of 3.243 milliontons. Both sets of tables purport to include shipments ofimported cement.
Differences are also seen on a State or district level.However, these are to be expected because whereas tables 8 and9 show the district destinations of the shipments to finalcustomers, tables 11, 12, and 14 show the originating districtsof the cement shipments to final customers.
The functional reason for the discrepancy in totals appearsto be in the data collection methodology. The monthly data(totaled in tables 8 and 9) are those used each month byindividual cement companies for their own marketing analyses.There traditionally has been a more complete and promptresponse by company headquarters to the monthlyquestionnaires than by individual plants to the lengthier annual

U.S. GEOLOGICAL SURVEY—MINERALS INFORMATION 5
surveys. The difference in total shipment tonnages is believed portland cement (all types), another for white portland, andlargely to reflect the activities of certain cement distribution another for masonry cement. Accordingly, the calculated unitterminals. Annual shipment data submitted by the manufacturing values shown should be viewed as price indices rather than asfacilities themselves would include shipments (including actual prices for some specific type of cement. It may beimports by the plant) to final customers via distribution assumed that the values shown for gray portland cement areterminals. However, the data could be incomplete because the dominated by those for Types I and II.plants might be unaware of some shipments by terminals of As shown in table 11, the total value of portland cementstockpiled material, or of cement imported directly by the shipments from mills rose 10% to almost $5.2 billion. If theterminals. Consolidated company monthly shipment data (tables average price shown is applied to the total shipments by8 and 9) would track both plant and terminal activity and are destination shown in table 8, the figure rises to about $5.7thus considered “better” consumption data. billion. Although masonry cement shipments from mills rose in
Although yielding the preferred consumption data, the overall value 5.5% to about $300 million (see table 12), themonthly-based shipments surveys do not query details such as same price applied to table 8 data would total about $278type of portland cement shipped, type of transportation used, million only. The lower value for table 8 reflects a significantlyand cement value. These data are available only from the annual lower tonnage in that table. This suggests that some shipmentssurveys. For this reason, and to maintain internal consistency to to final customers reported by individual mills (table 12) maythe degree possible, the annual-based shipment data are retained have in fact gone into stockpiles at terminals.for tables 10 through 15. As shown in table 13, prices at the plant for gray portland
National Consumption.—As shown in table 8, overallportland cement consumption, defined as shipments to finalcustomers in the United States, increased slightly in 1995 toabout 82.9 million tons, excluding Puerto Rico. Exports alsoincreased slightly, but remained a small component of the totalmarket. Of the total shipments, those originating in the UnitedStates declined about 3% to about 71.8 million tons, in line with Engineering News Record (ENR). The data represent a surveythe decline in production shown in table 2. More than offsetting of customers (likely to be ready mixed concrete producers forthe decline was a 30% increase in portland cement imports portland cement and building supply depots for masonry) in 20(shown in table 8 as shipments of foreign origin). Overall, the cities in the United States. The ENR 20-city average deliveredconsumption pattern reflected an increase in multiple-family price in 1995 for Type I portland converts to $75.78 per metricresidential construction and public construction. Partly offsetting ton, with a range over the year of only $3.52 per ton. Pricesthis was a drop in single-family residential construction—this showed a general increase from January to December ($77.82).type of construction is sensitive to short-term changes in interest The ENR city data show a number of regional price differences,rates, which increased modestly in 1995. some of which differ significantly from those district (ex-plant)
Regional consumption of portland cement was mixed (see data shown in table 11. The variations probably reflect regionaltable 9). Winter and/or wet weather-related declines were seen differences in shipment methods and local per-kilometer costsin the Northeast and Midwest. The South showed a large for the same. The 20-city average masonry cement price for theincrease and continued to be the dominant consumption region year was $4.33 per bag (literally converts to $136.37 per metricfor the country. The greatest growth in the South was in ton) and ranged only $0.35 per bag over the year.Georgia, related in part to preparatory construction for the 1996 Table 10 shows portland cement shipments from mills bySummer Olympics. In the West, strong growth was seen in most method of transportation. As in previous years, bulk shipmentsof the Mountain States, owing in part to rapid population dominated deliveries to both terminals and final customers.growth, much of it at the expense of California. Several of the Trucks were by far the preferred form of cement deliveries toMountain States, especially Nevada, also had strong demand for final customers.cement in their burgeoning mining sectors. Colorado showed themost significant decline in the region, but even this was largelya return to more normal consumption patterns following thecompletion of Denver's new airport. As shown in table 8, thelargest five portland-cement-consuming States, in decliningorder, were Texas, California, Florida, Ohio, and Georgia.
Masonry cement consumption fell slightly in 1995, withsmall declines seen in most States and/or regions.
Prices.—The price or value data shown in tables 11 through accounting by some mills, the inherent problem is that knowing13 represent ex-plant valuations by the mill. Unlike shipment a customer's identity (type) is not necessarily the same thing astonnages by type (table 15), the USGS annual surveys do not knowing a customer's use(s) for the cement. Qualitativequery the values by type of portland cement. Instead, the values knowledge of a customer's uses of cement does not equate toare supplied as totals for all shipments—one total for gray quantitative knowledge. Quantitative knowledge does not
cement rose 11% in 1995 to $66.89 per ton, and 8% formasonry cement to $85.64 per ton. Only white portland cementshowed a decline, and that of only about 1% to $174.66 per ton.
The only data for domestic delivered prices for cement arethose for Type I portland (per short ton) and masonry cement(per 70-pound bag) published monthly by the journal
Cement Customer Types.—Although presented inunrounded form, the data in table 14—on portland cementshipments by customer type—are probably the least reliable ofall the data collected by the USGS annual cement survey. Thislack of reliability is not because of a lack of cooperation by theindustry in providing data, but reflects the fact that thequestionnaire asks for more details than most cement plants orcompanies have. Disregarding incomplete or incompatible

6 U.S. GEOLOGICAL SURVEY—MINERALS INFORMATION
eliminate conflicts in assigning tonnages to the 15 use(r)categories on the questionnaire.
For example, it may be known that a certain ready mixed Bureau of the Census trade data on hydraulic cement andconcrete customer used X tons of cement (in ready mixed clinker, including pozzolan and aluminous cements, are shownconcrete) for road paving contracts. The dilemma for the cement in tables 16 through 20. As can be inferred from some valuecompany is whether to register those tons under the ready mixed entries, the material traded included high value specialtycategory or under road paving. Another example would be the cements.“government agencies” use category on the questionnaire— Total exports of cement and clinker rose significantly inperhaps some government cement purchases really are for ready 1995 (see table 16) but, overall, continued to be very smallmixed concrete, or road paving, or other duplicative use(s). And compared to imports. By comparison with table 8, about 65%there is an “Other” category on the questionnaire that some of total export tonnage was of portland and/or masonry cement.cement plants use as a catchall. Further, although generally Most of the exports went to Canada.listed as exact tonnages, some data back-calculate to simple As shown in table 17, total imports of cement and clinker(broad) percentages of the total shipments—the breakdown increased almost 23% by tonnage in 1995, due in part to abeing the “best guess” of that cement plant. In a few instances, generally strong dollar during the year and shortfalls in suppliesthe apportioning appears to have been guided by past from domestic sources. The cement component of imports wasbreakdowns published by the USBM. about 11 million tons, or about 80% of the total. This is about
Within these limitations, it is still clear from table 14 that the 5% less than the import component of portland and masonrydominant customer type/use for portland cement in 1995, as in cement shipments to final customers in table 8. The difference,previous years, was for ready mixed concrete. As listed, cement if not just an artifact of different data sources, would appear tofor ready mixed concrete (customers) accounted for about 61% indicate a component of stockpiled material in sales to finalof total cement shipments (56% in 1994). However, it is likely customers of imported cement. Canada was the largest source ofthat 50% to 60% of total shipments listed as “Government and cement plus clinker imports, accounting for 35% of the total.miscellaneous” also are ready mixed concrete, which would then Imports from Canada were up 15% in 1995. Other majorhave that use accounting for about 70% of total shipments. The sources were Spain, up 12%; Venezuela, up 79%; and Greece,(footnoted) breakout of the “Contractors” category likely up 36%. Imports from Mexico, although up 33%, were still wellunderstates true consumption for road paving—some cement for below levels prior to the imposition of antidumping tariffs.this purpose no doubt resides under the “Government and Clinker imports rose 29% in 1995 (see table 18) and weremiscellaneous” and “ready mixed concrete” categories. In dominated by material from Canada. Imports by customs districtcontrast, the data for concrete products manufacturers, buildings are given in table 19.materials dealers, and oil well cement use are probably fairly The white cement component of imports in 1995 totaledaccurate. Overall, the usage breakdowns are broadly similar to about 0.4 million tons (see table 20). The top five sourcesthose in 1994. were Canada, at about 38% of the imports; Denmark, 20%;
The district-level breakdowns of shipments, by customer Spain, 17%; Mexico, 14%; and Colombia, 5%.type, in table 14 reflect the origin of the cement. Accordingly,they are only an indirect regional indicator of portland cementusage.
Types of Portland Cement Consumed.—General use(Types I and II) portland continued to dominate cementconsumption, accounting for almost 91% of total portlandcement shipments from mills shown in table 15. Types I throughV together accounted for about 97% of total portland cementshipments for both 1994 and 1995. Shipments, by type, werelargely unchanged in 1995 for most types of portland cement.Oil well cement consumption declined significantly in 1995,reflecting lackluster demand by the petroleum explorationindustry. Blended cement shipments rose almost 80% but stillaccounted for only about 1% of total portland cement shipments.However, as previously noted, the blended cement dataunderrepresent true consumption because they exclude suchcements mixed by concrete manufacturers. Data on thisconsumption are very incomplete and estimates would be furtherlimited by the wide range of permissible pozzolan contents inblended cements.
Foreign Trade
13
World Review
World hydraulic cement production, which likely includeda much higher component of blended cements than was the casein the United States, was estimated to have risen 3% in 1995 toabout 1.4 billion tons (see table 21). China was overwhelminglythe dominant cement producer, with about 31% of total worldoutput. The remaining top 10 producers, in descending order ofproduction, were Japan, the United States, India, the Republicof Korea, Germany, Russia, Italy, Turkey, and Thailand.
It is evident from even a cursory review of the 1995 cementtrade literature that the centers of new cement plant constructionare now firmly entrenched outside of Western Europe, theUnited States, and Canada. Worldwide, literally dozens of newplants—seemingly all of them boasting state-of-the-arttechnologies and many of them very large—were either underconstruction or in advanced stages of planning. Another trendevident was that of privatization of state-owned facilities.
Although home to most of the world's largest cementcompanies, Western Europe's cement consumption wasstagnating in 1995 and most capital investment in the industry

U.S. GEOLOGICAL SURVEY—MINERALS INFORMATION 7
there was on plant modernization. In contrast, a number of both modest production constraint for 1996 could be the growth seennew plants and plant upgrades were underway in several Eastern in 1995 of yearend cement stockpiles. In both the near andEuropean countries. A lot of Western European capital was longer terms, the availability of public construction funding willmoving into Eastern Europe and the former Soviet Union, in be important, including disruptions caused by any shifting ofstep with privatization opportunities and liberalized investment project authority from the Federal to the State level. For theand taxation laws, and in line with the perception that these underpenetrated road paving market, an important factor will becountries not only had significant market growth potential but the degree to which the cement industry can persuadecould also provide inexpensive cement for export. construction planners to emphasize long-term costs, where
Many countries in the Middle East and some in North Africa concrete has an advantage, over short-term costs, where asphaltwere expanding or upgrading their cement capacities, for is cheaper.reasons of low energy costs (e.g., Persian Gulf region), abundant A dilemma for the U.S. cement industry is the degree andraw materials (e.g., Iran and Turkey), or strategic locations with timetable for upgrading its clinker manufacturing capacity. Arespect to exports (e.g., Saudi Arabia and Turkey). Much of the large percentage of current U.S. capacity is installed either inexpansion was geared toward exports. Iran and Turkey probably wet kilns or in old, small-capacity, dry kilns. These are relativelyhad the greatest domestic demand potentials. In much of Africa, energy-inefficient and have higher per-unit production coststhe cement industry was less active. Probably the greatest than modern, high-capacity plants. The cost differential is likelygrowth potential was in South Africa, where public spending on to grow in the future. To remain competitive, these older plantshousing was expected to increase dramatically. Although will need (costly) equipment upgrades or replacements, but suchrecommissioning of mothballed production capacity in South may not be economical given increased availability of low-costAfrica was likely, installation of new capacity was less certain, cement for importation. And much of this imported material isgiven market disruptions anticipated from the mandated likely to be sourced from modern plants owned by the samedissolution of the controlling cement cartel scheduled for giant European cement firms that currently dominate the U.S.September 1996. industry.
In Latin America, new capacity was being added in a A critical factor for the U.S. cement industry will be futurenumber of countries, especially Brazil and Mexico, both to meet restrictive environmental legislation, particularly any governingburgeoning domestic demand and for exports. Most notably, the industry's ability to cheaply utilize waste fuels and any thatCemex S.A. of Mexico brought on line in 1995 its Tepeaca restrict or tax carbon dioxide emissions. Given increasingplant which, at 3.1-million-ton-per-year capacity, was reportedly cooperative participation of the U.S. Government in the globalone of the largest single-kiln operations in the world. environmental debate, some form of future U.S. carbon dioxide
The other major area of growth in cement capacity and regulation is possible. Such would lead to higher cementdemand was Asia, particularly in China, India, Indonesia, the production costs and would put U.S. cement at increasingPhilippines, and Vietnam. Japan and Taiwan were among the competitive disadvantage to imports from countries lackingfew Asian countries expected to experience significant declines equivalent legislation. Absent tariff protection from suchin production, Japan because of rising production costs and a imports, some shutdown of domestic capacity could occur.slowing economy, and Taiwan because of rapid exhaustion of Environmental cost increases could lead to a significant rise incement raw materials reserves. For some high-growth countries, production and consumption of blended cements in the Unitedespecially Indonesia, the rapid growth in cement capacity States. Although partial substitution of pozzolans for portlandplanned over the next 4 years was predicted to lead to large cement reduces the per-unit environmental costs of finishedsurpluses. These surpluses, anticipated to be available at low cement production, the advantage is partly illusory becausecost, are expected to become a major factor in world cement (synthetic) pozzolan production itself has an environmental cost,trade and could constrain expansion programs in Europe and albeit assigned to other industries, such as iron- andNorth America. steelmaking.
Outlook
World cement demand and production is anticipated to growsteadily at 2% to 4% over the next decade, with the developingworld generating and absorbing much of the increase. Demandcould grow even more if current research to find new uses forcement is successful—particularly for high-strengthcement/concrete substitutes for other construction materials.
Cement production and demand in the United States isanticipated to grow only modestly in both the near andintermediate terms. In the near term, an important constraint islikely to be interest rates, which especially influence theimportant single-family residential construction market. A
Minerals information activities of the former U.S. Bureau of1
Mines were transferred to the U.S. Geological Survey in Jan. 1996.State subdivisions are as follows:2
California, northern.—Counties north of San Luis Obispo andKern Counties and west of Inyo and Mono Counties.
California, southern.—Inyo, Kern, Mono, San Luis Obispo, andall counties further south.
Chicago, metropolitan.—Cook, DuPage, Kane, Kendall, Lake, McHenry, and Will Counties in Illinois.
Illinois.—All other counties in the State.New York, eastern.—All counties east of Broome, Chenango,
Lewis, Madison, Oneida, and St. Lawrence Counties, butexcluding counties within Metropolitan New York.

8 U.S. GEOLOGICAL SURVEY—MINERALS INFORMATION
New York, western.—Broome, Chenango, Lewis, Madison,Oneida, and St. Lawrence Counties, and all those furtherwest.
New York, metropolitan.—The five counties of New York City(Bronx, Kings, New York, Queens, and Richmond) plusNassau, Rockland, Suffolk, and Westchester Counties.
Pennsylvania, eastern.—All counties east of Centre, Clinton,Franklin, Huntingdon, and Potter Counties.
Pennsylvania, western.—Centre, Clinton, Franklin, Huntingdon,and Potter Counties, and all those further west.
Texas, northern.—All counties north of Burnet, Crockett, Jasper,Jeff Davis, Llano, Madison, Mason, Menard, Milam,Newton, Pecos, Polk, Robertson, San Jacinto, Schleicher,Tyler, Walker, and Williamson Counties.
Texas, southern.—The named counties above and all thosefurther south.
Lafarge Corp., 1995, Annual Report.3
Reuters News Service, Sept. 20, 1995, quoted in The Monitor,4
Portland Cement Assoc. July 1995.Rock Products Cement Edition, May 1995, p. 9.5
———. July 1996, pp. 35-36. Publishing, Chicago. (Annual).6
Reuters News Service, July 10, 1995, quoted in The Monitor,7
Portland Cement Assoc. May 1995.Sunbelt Cement, tel. communication to USGS.8
Company report to the USGS, 1996.9
Company report to the USGS, 1996.10
International Cement Review, Mar. 1995, p. 12.11
———. Dec. 1995, p. 5.12
Bureau of the Census, data quoted in: Cement in Jan. 1996,13
Mineral Industry Surveys, USGS, table 5.
OTHER SOURCES OF INFORMATION
U.S. Bureau of Mines PublicationsCement. Ch. in Minerals Yearbook, 1994
Johnson, W. Cement. Ch. in Mineral Facts and Problems.USBM Bull. 675, 1985, p. 121-131
U.S. Geological Survey PublicationsCement. Ch. in Minerals Yearbook.Cement. Ch. in Mineral Commodity Summaries, annual.Cement. Mineral Industry Surveys, monthly.Hubbard, H.A. and G.E. Erickson. Limestone and Dolomite.
Ch. in United States Mineral Resources. USGS Prof. Paper820, wd. by D.A. Brobst and W.P. Pratt, 1973, p. 357-364.
Other SourcesCembureau—The European Cement Association, Brussels,
Belgium: World Cement Directory 1996Portland Cement Association, Skokie, IL: U.S. and Canadian
Portland Cement Industry: Plant Information Summary(Annual).
Portland Cement Association, Skokie, IL: The Monitor(Monthly).
Rock Products: North American Cement Directory; Intertec
Concrete Products. Engineering News Record.Industrial Minerals. International Cement Review.Rock Products (incl. Cement Edition).World Cement. Zement-Kalk-Gyps International.

TABLE 1SALIENT CEMENT STATISTICS
(Thousand metric tons unless otherwise specified)
1991 1992 1993 1994 1995United States 1/ Production 2/ 67,193 69,585 73,807 77,948 76,906 Shipments from mills 2/ 3/ 68,999 69,203 74,079 4/ 80,490 4/ 79,924 4/ Value 2/ 3/ thousands 3,832,096 3,779,286 4,174,818 4/ 4,981,017 4/ 5,471,268 4/ Average value per ton 2/ 3/ 5/ 56 55 56 4/ 62 4/ 68 4/ Stocks at mills, 2/ Dec. 31 6,009 5,272 4,788 4,805 5,813 Exports 6/ 633 746 625 633 759 Imports for consumption 4/ 6/ 7,893 6,166 7,060 11,303 13,848 Consumption, apparent 7/ 72,413 r/ 74,124 r/ 79,198 r/ 86,370 r/ 86,612World: Production e/ 1,181,793 r/ 1,239,683 r/ 1,301,527 r/ 1,380,052 r/ 1,421,342e/ Estimated. r/ Revised.1/ Excludes Puerto Rico.2/ Portland and masonry cement only. Includes imported cement, and cement made from imported clinker.3/ Shipments calculated based on annual survey of plants; may differ from tables 8 and 9, which are based on consolidated company monthly data.4/ Includes Puerto Rico.5/ Value received, f.o.b. mill.6/ Hydraulic cement plus clinker.7/ Production of cement plus imports of cement (excluding clinker) minus exports of cement minus change in stocks.
TABLE 2PORTLAND CEMENT PRODUCTION, CAPACITY, AND STOCKS IN THE UNITED STATES, BY DISTRICT 1/
(Thousand metric tons unless otherwise specified)
1994 1995Capacity 2/ Stocks 3/ Capacity 2/ Stocks 3/
Plants Produc- Finish Percent at mills, Plants Produc- Finish Percent at mills,District active tion 4/ grinding utilized Dec. 31 active tion 4/ grinding utilized Dec. 31
New York and Maine 5 3,005 4,141 72.6 217 4 2,937 3,937 74.6 317Pennsylvania, eastern 8 4,014 4,878 82.3 196 8 4,045 5,019 80.6 355Pennsylvania, western 4 1,616 2,009 80.4 111 4 1,565 2,009 77.9 146Illinois 4 2,585 3,217 80.4 127 4 2,559 3,379 75.7 210Indiana 4 2,291 2,867 79.9 116 4 2,328 2,597 89.6 253Michigan 5 5,160 6,532 79.0 226 5 5,399 6,999 77.1 336Ohio 3 1,054 1,588 66.4 37 3 1,049 1,588 66.1 94Iowa, Nebraska, South Dakota 6 3,891 5,758 67.6 291 5 3,724 5,576 66.8 364Kansas 4 1,644 1,801 91.3 127 4 1,725 1,774 97.2 185Missouri 5 4,725 5,059 93.4 340 5 4,362 5,059 86.2 395Florida 6 3,371 4,382 76.9 291 6 3,166 4,382 72.3 195Georgia and South Carolina 5 3,256 4,599 70.8 154 5 3,226 4,587 70.3 187Maryland, Virginia, West Virginia 6 3,237 3,987 81.2 203 6 3,079 4,018 76.6 358Alabama 5 3,976 4,573 86.9 268 5 4,091 4,755 86.0 261Kentucky, Mississippi, Tennessee 4 1,983 2,128 93.2 139 4 2,107 2,474 85.2 216Arkansas and Oklahoma 4 2,434 2,694 90.3 166 4 2,544 2,717 93.6 202Texas, northern 6 3,809 4,512 84.4 209 6 3,807 4,512 84.4 229Texas, southern 6 4,815 5,529 87.1 182 5 5/ 4,285 4,717 90.8 227Arizona and New Mexico 3 1,967 2,288 86.0 51 3 2,061 2,333 88.3 47Colorado and Wyoming 4 1,822 2,377 76.7 97 4 1,851 2,377 77.9 90Idaho, Montana, Nevada, Utah 6 2,180 2,422 90.0 174 6 6/ 2,206 2,445 90.2 155Alaska, Hawaii, Oregon, Washington 4 1,861 2,295 81.1 180 4 1,824 2,295 79.5 179California, northern 3 2,616 2,776 94.2 141 3 2,554 2,867 89.1 107California, southern 8 7,023 7,933 88.5 258 8 6,808 7,899 86.2 250 Total or average 7/ 118 74,335 90,346 82.3 4,301 115 6/ 73,303 90,316 81.2 5,358Puerto Rico 2 1,405 1,956 71.8 31 2 1,414 2,004 70.6 401/ Includes Puerto Rico. Includes data for three white cement facilities as follows: California (1), Pennsylvania (1), and Texas (1). Includes data for grinding plants asfollows: California (1), Florida (2), Iowa (1), Michigan (1), Ohio (1), Pennsylvania (1), and Texas (1).2/ Grinding capacity based on fineness necessary to grind Types I and II cement, making allowance for downtime required for maintenance.3/ Includes imported cement. 4/ Includes cement produced from imported clinker.5/ One additional plant was operational January through April; data for it are included in tonnages shown.6/ Excludes one plant that commenced production in 1995 but for which data were unavailable at the time of data compilation.7/ Data may not add to totals shown because of independent rounding.

TABLE 3MASONRY CEMENT PRODUCTION AND STOCKS IN THE UNITED STATES, BY DISTRICT 1/
(Thousand metric tons unless otherwise specified)
1994 1995 Stocks 2/ Stocks 2/
Plants at mills, Plants at mills,District active Production Dec. 31 active Production Dec. 31
New York and Maine 5 89 17 4 100 18Pennsylvania, eastern 6 161 25 6 186 38Pennsylvania, western 4 84 13 4 81 13Illinois 1 W W 1 -- W Indiana 4 W 31 4 W W Michigan 5 235 24 5 229 26Ohio 2 W W 2 W W Iowa, Nebraska, South Dakota 4 58 12 4 51 17Kansas 3 24 W 3 31 10Missouri 1 W W 1 W W Florida 4 400 W 4 383 31Georgia and South Carolina 4 417 39 4 436 43Maryland, Virginia, West Virginia 6 571 52 6 528 79Alabama 5 312 36 5 306 45Kentucky, Mississippi, Tennessee 3 105 11 3 108 15Arkansas and Oklahoma 4 104 14 4 110 19Texas, northern 4 106 10 4 W 8Texas, southern 5 151 15 5 98 7Arizona and New Mexico 3 W W 3 W W Colorado and Wyoming 2 W W 2 W W Idaho, Montana, Nevada, Utah 4 W W 4 W W Alaska, Hawaii, Oregon, Washington 2 W 2 2 W 2California, northern 1 W W 1 W W California, southern 2 W W 3 149 W Total or average 3/ 84 3,613 400 84 3,603 455W Withheld to avoid disclosing company proprietary data; included in "Total or average."1/ Puerto Rico did not produce any masonry cement.2/ Includes imported cement.3/ Data may not add to totals shown because of independent rounding.
TABLE 4CLINKER CAPACITY AND PRODUCTION IN THE UNITED STATES IN 1995, BY DISTRICT
Average ApparentDaily number annual Produc-
Active plants 1/ capacity of days capacity 2/ tion 3/Process used Number (thousand mainte- (thousand (thousand Percent
District Wet Dry Both Total of kilns metric tons) nance metric tons) metric tons) utilizedNew York and Maine 3 1 -- 4 5 9 61 2,904 2,915 100.4Pennsylvania, eastern 2 5 -- 7 14 13 30 4,461 4,245 95.2Pennsylvania, western 3 1 -- 4 8 6 37 1,942 1,711 88.1Illinois -- 4 -- 4 8 8 33 2,508 2,345 93.5Indiana 2 2 -- 4 8 8 28 2,854 2,435 85.3Michigan 1 2 -- 3 8 13 27 4,464 4,150 93.0Ohio 1 1 -- 2 3 3 16 1,094 902 82.4Iowa, Nebraska, South Dakota -- 4 1 5 9 13 49 4,120 3,472 84.3Kansas 2 2 -- 4 11 6 41 1,796 1,643 91.5Missouri 2 3 -- 5 7 13 35 4,349 4,160 95.7Florida 2 2 -- 4 7 9 34 2,992 2,787 93.1Georgia and South Carolina 2 2 1 5 11 11 35 3,722 3,250 87.3Maryland, Virginia, West Virginia 2 3 -- 5 15 11 19 3,726 3,096 83.1Alabama -- 5 -- 5 7 14 31 4,462 3,683 82.5Kentucky, Mississippi, Tennessee 2 2 -- 4 5 6 21 2,161 2,096 97.0Arkansas and Oklahoma 2 2 -- 4 10 8 28 2,609 2,500 95.8Texas, northern 3 3 -- 6 14 12 38 3,903 3,688 94.5Texas, southern -- 4 1 5 6 13 29 4,263 4,174 97.9Arizona and New Mexico -- 3 -- 3 9 6 13 2,267 1,975 87.1Colorado and Wyoming 1 3 -- 4 6 6 28 1,986 1,840 92.6Idaho, Montana, Nevada, Utah 4 2 -- 6 9 6 28 2,016 2,090 103.7Alaska, Hawaii, Oregon, Washington 1 3 -- 4 4 4 45 1,372 1,600 116.6California, northern -- 3 -- 3 3 9 55 2,589 2,553 98.6California, southern -- 8 -- 8 17 22 47 7,145 6,674 93.4 Total or average 4/ 35 70 3 108 204 232 33 75,702 69,983 92.4Puerto Rico -- 2 -- 2 2 5 W 1,583 1,274 80.5W Withheld to avoid disclosing company proprietary data.1/ Includes white cement producing facilities.2/ Calculated, based on individual company data, using 365 days minus reported days for maintenance multiplied by the reported 24 hour capacity.3/ Includes production reported for plants that shut down during the year.4/ Data may not add to totals shown because of independent rounding.

TABLE 5RAW MATERIALS USED IN PRODUCING CEMENT
IN THE UNITED STATES 1/ 2/ 3/
(Thousand metric tons)
Raw materials 1994 1995 Calcareous: Limestone (includes aragonite, marble, chalk) 78,427 80,142 Cement rock (includes marl) 24,243 24,164 Coral 675 680Aluminous: Clay 4,189 4,294 Shale 5,514 4,378 Other (includes staurolite, bauxite, aluminum dross, alumina, volcanic material, other) 500 967Siliceous: Sand and calcium silicate 2,095 2,210 Sandstone, quartzite, other 588 741Ferrous: Iron ore, pyrites, millscale, other 1,186 1,523Other: Gypsum and anhydrite 3,873 3,997 Blast furnace slag 33 130 Fly ash 1,125 1,396 Other, n.e.c. 135 82 Total 4/ 122,582 124,7041/ Includes Puerto Rico.2/ Nonfuel materials only.3/ Includes portland and masonry cement.4/ Data may not add to totals shown because of independent rounding.
TABLE 6CLINKER PRODUCED AND FUEL CONSUMED BY THE CEMENT INDUSTRY 1/
IN THE UNITED STATES, 2/ BY PROCESS
Clinker produced Fuel consumed Waste fuelQuantity Coal Oil Natural gas Tires Solid Liquid
Plants (thousand Percent (thousand (thousand (thousand (thousand (thousand (thousandKiln process active metric tons) of total metric tons) liters) cubic meters) metric tons) metric tons) liters)
1994: Wet 36 18,605 26.7 3,197 10,913 174,815 26 58 369,078 Dry 71 49,333 70.7 6,984 37,858 411,657 90 16 230,577 Both 3 1,849 2.6 303 -- 63,676 4 -- -- Total 3/ 110 69,787 100.0 10,484 4/ 48,771 650,148 120 74 599,6551995: Wet 35 18,775 26.3 2,965 13,624 327,798 31 62 626,436 Dry 72 50,529 70.9 6,954 28,190 635,786 122 6 258,150 Both 3 1,953 2.7 253 -- 105,459 5 -- -- Total 3/ 110 71,257 100.0 10,171 5/ 41,814 1,069,044 158 68 884,5861/ Includes portland and masonry cement.2/ Includes Puerto Rico.3/ Data may not add to totals shown because of independent rounding.4/ Includes 305,000 tons of coke and 1,389,000 tons of petroleum coke.5/ Includes 455,000 tons of coke and 1,475,000 tons of petroleum coke.
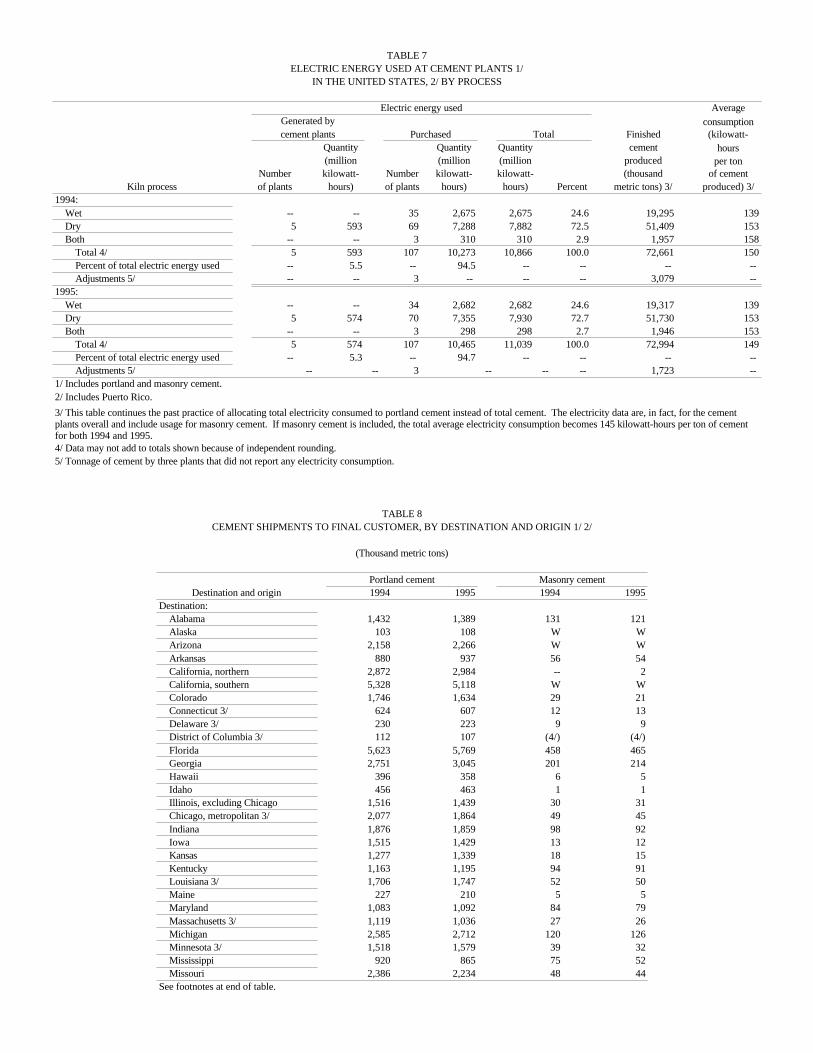
TABLE 7ELECTRIC ENERGY USED AT CEMENT PLANTS 1/
IN THE UNITED STATES, 2/ BY PROCESS
Electric energy used AverageGenerated by consumptioncement plants Purchased Total Finished (kilowatt-
Quantity Quantity Quantity cement hours(million (million (million produced per ton
Number kilowatt- Number kilowatt- kilowatt- (thousand of cementKiln process of plants hours) of plants hours) hours) Percent metric tons) 3/ produced) 3/
1994: Wet -- -- 35 2,675 2,675 24.6 19,295 139 Dry 5 593 69 7,288 7,882 72.5 51,409 153 Both -- -- 3 310 310 2.9 1,957 158 Total 4/ 5 593 107 10,273 10,866 100.0 72,661 150 Percent of total electric energy used -- 5.5 -- 94.5 -- -- -- -- Adjustments 5/ -- -- 3 -- -- -- 3,079 -- 1995: Wet -- -- 34 2,682 2,682 24.6 19,317 139 Dry 5 574 70 7,355 7,930 72.7 51,730 153 Both -- -- 3 298 298 2.7 1,946 153 Total 4/ 5 574 107 10,465 11,039 100.0 72,994 149 Percent of total electric energy used -- 5.3 -- 94.7 -- -- -- -- Adjustments 5/ -- -- 3 -- -- -- 1,723 -- 1/ Includes portland and masonry cement.2/ Includes Puerto Rico.
3/ This table continues the past practice of allocating total electricity consumed to portland cement instead of total cement. The electricity data are, in fact, for the cementplants overall and include usage for masonry cement. If masonry cement is included, the total average electricity consumption becomes 145 kilowatt-hours per ton of cementfor both 1994 and 1995.4/ Data may not add to totals shown because of independent rounding.5/ Tonnage of cement by three plants that did not report any electricity consumption.
TABLE 8CEMENT SHIPMENTS TO FINAL CUSTOMER, BY DESTINATION AND ORIGIN 1/ 2/
(Thousand metric tons)
Portland cement Masonry cementDestination and origin 1994 1995 1994 1995
Destination: Alabama 1,432 1,389 131 121 Alaska 103 108 W W Arizona 2,158 2,266 W W Arkansas 880 937 56 54 California, northern 2,872 2,984 -- 2 California, southern 5,328 5,118 W W Colorado 1,746 1,634 29 21 Connecticut 3/ 624 607 12 13 Delaware 3/ 230 223 9 9 District of Columbia 3/ 112 107 (4/) (4/) Florida 5,623 5,769 458 465 Georgia 2,751 3,045 201 214 Hawaii 396 358 6 5 Idaho 456 463 1 1 Illinois, excluding Chicago 1,516 1,439 30 31 Chicago, metropolitan 3/ 2,077 1,864 49 45 Indiana 1,876 1,859 98 92 Iowa 1,515 1,429 13 12 Kansas 1,277 1,339 18 15 Kentucky 1,163 1,195 94 91 Louisiana 3/ 1,706 1,747 52 50 Maine 227 210 5 5 Maryland 1,083 1,092 84 79 Massachusetts 3/ 1,119 1,036 27 26 Michigan 2,585 2,712 120 126 Minnesota 3/ 1,518 1,579 39 32 Mississippi 920 865 75 52 Missouri 2,386 2,234 48 44See footnotes at end of table.

TABLE 8-ContinuedCEMENT SHIPMENTS TO FINAL CUSTOMER, BY DESTINATION AND ORIGIN 1/ 2/
(Thousand metric tons)
Portland cement Masonry cementDestination and origin 1994 1995 1994 1995
Montana 278 274 1 1 Nebraska 1,014 982 12 9 Nevada 1,358 1,483 (4/) (4/) New Hampshire 3/ 242 256 7 7 New Jersey 3/ 1,427 1,410 62 57 New Mexico 665 708 6 7 New York, eastern 514 491 22 29 New York, western 821 754 33 31 New York, metropolitan 3/ 1,010 1,078 38 39 North Carolina 3/ 2,151 2,218 253 263 North Dakota 3/ 245 310 3 3 Ohio 3,482 3,533 199 181 Oklahoma 1,114 1,105 43 38 Oregon 946 1,027 (4/) (4/) Pennsylvania, eastern 1,967 1,806 61 57 Pennsylvania, western 1,102 1,002 73 66 Rhode Island 3/ 152 117 3 3 South Carolina 981 1,035 113 106 South Dakota 338 302 5 4 Tennessee 1,711 1,805 187 193 Texas, northern 3,817 4,115 134 146 Texas, southern 4,053 4,225 108 91 Utah 1,020 1,286 2 2 Vermont 3/ 101 105 3 3 Virginia 1,716 1,757 146 138 Washington 1,723 1,669 6 6 West Virginia 437 412 33 30 Wisconsin 1,889 1,838 41 35 Wyoming 275 215 2 1 U.S. total 5/ 82,232 82,925 3,250 3,150 Foreign countries 6/ 377 393 75 93 Puerto Rico 1,392 1,405 -- -- Total shipment 5/ 84,001 84,724 3,325 3,243Origin: United States 7/ 73,739 r/ 71,750 3,283 3,185 Puerto Rico 1,392 1,405 -- -- Foreign 8/ 8,870 11,568 42 57 Total shipment 5/ 84,001 84,724 3,325 3,243r/ Revised. W Withheld to avoid disclosing company proprietary data; included with "Foreign countries."1/ Includes cement produced from imported clinker and imported cement shipped by domestic producers, Canadiancement manufacturers, and other importers. Includes Puerto Rico.2/ Data are developed from monthly consolidated surveys of shipments by company and may differ from data in tables in1, 10, 11, 12, 14, and 15, which are from annual surveys of individual plants.3/ Has no cement producing plants.4/ Less than 1/2 unit.5/ Data may not add to totals shown because of independent rounding.6/ Includes shipments to U.S. possessions and territories. Includes States indicated by the symbol W.7/ Includes cement produced from imported clinker by domestic producers.8/ Imported cement distributed in the United States by domestic producers, Canadian cement manufacturers, and otherimporters.

TABLE 9CEMENT SHIPMENTS, BY DESTINATION (REGION AND SUBREGION) 1/ 2/
Portland cement Masonry cement Thousand Percent of Thousand Percent of
Region and metric tons grand total metric tons grand totalsubregion 1994 1995 1994 1995 1994 1995 1994 1995
Northeast: New England 3/ 2,466 2,330 3 3 57 56 2 2 Middle Atlantic 4/ 6,841 6,540 8 8 289 278 9 9 Total 5/ 9,307 8,870 11 11 346 334 11 11South: Atlantic 6/ 15,084 15,658 19 19 1,297 1,303 40 41 East Central 7/ 5,226 5,255 6 6 487 457 15 15 West Central 8/ 11,570 12,129 15 15 392 379 12 12 Total 5/ 31,881 33,042 39 40 2,176 2,139 67 68Midwest: East 9/ 13,425 13,245 16 16 537 511 17 16 West 10/ 8,294 8,174 9 10 137 120 4 4 Total 5/ 21,719 21,419 25 26 674 631 21 20West: Mountain 11/ 7,956 8,330 10 10 42 32 1 1 Pacific 12/ 11,368 11,264 14 14 12 12 (13/) (13/) Total 5/ 19,325 19,594 24 24 54 44 2 1 Grand total 5/ 82,232 82,925 100 100 3,250 3,150 100 1001/ Includes imported cement shipped by importers. Excludes Puerto Rico.2/ Data are developed from monthly consolidated surveys of shipments by company and may differ from data in tables 1, 10, 11, 12, 14, and 15,which are from annual surveys of individual plants.3/ New England includes: Connecticut, Maine, Massachusetts, New Hampshire, Rhode Island, and Vermont.4/ Middle Atlantic includes: New Jersey, New York, and Pennsylvania.5/ Data may not add to totals shown because of independent rounding.6/ Atlantic includes: Delaware, District of Columbia, Florida, Georgia, Maryland, North Carolina, South Carolina, Virginia, and West Virginia.7/ East Central includes: Alabama, Kentucky, Mississippi, and Tennessee.8/ West Central includes: Arkansas, Louisiana, Oklahoma, and Texas.9/ East Includes: Illinois, Indiana, Michigan, Ohio, and Wisconsin.10/ West includes: Iowa, Kansas, Minnesota, Missouri, Nebraska, North Dakota, and South Dakota.11/ Mountain region includes: Arizona, Colorado, Idaho, Montana, Nevada, New Mexico, Utah, and Wyoming.12/ Pacific region includes: Alaska, California, Hawaii, Oregon, and Washington.13/ Less than 1/2 unit.
TABLE 10SHIPMENTS OF PORTLAND CEMENT FROM MILLS IN THE UNITED STATES, 1/ IN BULK AND
IN CONTAINERS, BY TYPE OF CARRIER
(Thousand metric tons)
Shipments from Shipments to ultimate consumerplant to terminal From plant to consumer From terminal to consumer Total
In In In In In In shipments to bulk containers 2/ bulk containers 2/ bulk containers 2/ consumer 3/ 4/
1994: Railroad 8,871 56 3,205 419 840 15 4,479 Truck 2,667 124 41,701 2,010 25,712 818 70,241 Barge and boat 8,046 -- 659 3 294 -- 956 Other 5/ 1,742 -- 643 36 533 16 1,228 Total 3/ 21,326 180 46,208 2,468 27,378 849 76,9031995: Railroad 10,388 64 2,396 377 951 78 3,803 Truck 2,763 222 43,917 1,922 25,964 645 72,449 Barge and boat 7,898 -- 105 26 32 -- 162 Other 5/ 1,853 -- -- -- -- -- -- Total 3/ 22,902 286 46,418 2,325 26,947 723 76,4141/ Includes Puerto Rico. Includes imported cement and cement made from foreign clinker.2/ Includes bags and jumbo bags.3/ Data may not add to totals shown because of independent rounding.4/ Shipments calculated based on annual survey of plants; may differ from tables 8 and 9, which are based on consolidated companymonthly data.5/ Includes cement used at plant.

TABLE 11PORTLAND CEMENT SHIPPED BY PRODUCERS IN THE UNITED STATES, BY DISTRICT 1/ 2/ 3/
1994 1995Quantity Quantity(thousand Value Average (thousand Value Average
District metric tons) 4/ (thousands) per ton metric tons) 4/ (thousands) per tonNew York and Maine 3,099 $163,141 $52.64 2,916 $230,337 $78.99Pennsylvania, eastern 4,141 221,121 53.40 3,899 241,352 61.90Pennsylvania, western 1,520 95,171 62.61 1,486 99,139 66.72Illinois 2,524 147,721 58.53 1,651 109,030 66.04Indiana 2,293 132,487 57.78 2,510 154,462 61.54Michigan 5,135 329,409 64.15 5,098 340,461 66.78Ohio 1,063 70,273 66.11 985 68,237 69.28Iowa, Nebraska, South Dakota 3,722 239,483 64.34 3,790 262,662 69.30Kansas 1,708 104,988 61.47 1,703 107,345 63.03Missouri 5,054 283,013 56.00 4,778 295,352 61.81Florida and Puerto Rico 5,242 395,381 75.43 5,604 451,319 80.54Georgia and South Carolina 3,334 215,100 64.52 3,296 236,681 71.81Maryland, Virginia, West Virginia 3,338 185,519 55.58 3,262 214,854 65.87Alabama 3,839 239,220 62.31 3,910 272,509 69.70Kentucky, Mississippi, Tennessee 2,323 144,977 62.41 2,346 156,550 66.73Arkansas and Oklahoma 2,401 140,899 58.68 2,506 158,566 63.27Texas, northern 3,350 192,328 57.41 3,556 228,525 64.26Texas, southern 4,872 242,347 49.74 4,908 293,380 59.78Arizona and New Mexico 1,932 126,565 65.51 2,309 160,069 69.32Colorado and Wyoming 1,951 135,254 69.33 1,841 149,462 81.19Idaho, Montana, Nevada, Utah 2,341 175,730 75.07 2,432 185,221 76.16Alaska, Hawaii, Oregon, Washington 1,568 124,158 79.18 1,520 136,987 90.12California, northern 1,933 123,062 63.66 2,032 139,534 68.67California, southern 6,341 339,231 53.50 6,212 357,611 57.57 Total 5/ 6/ 7/ or average 76,903 4,696,198 61.07 76,414 5,170,697 67.671/ Includes data for three white cement facilities as follows: California (1), Pennsylvania (1), and Texas (1). Includes data for grinding plants as follows:California (1), Florida (2), Iowa (1), Michigan (1), Ohio (1), Pennsylvania (1), and Texas (1).2/ Includes cement produced from imported clinker.3/ Cement imported and distributed by domestic producers only.4/ Shipments calculated based on annual survey of plants; may differ from tables 8 and 9, which are based on consolidated company monthly data.5/ Data may not add to totals shown because of independent rounding.6/ Does not include cement consumed at plant.7/ Total includes imports shipped to final customers.
TABLE 12MASONRY CEMENT SHIPPED BY PRODUCERS IN THE UNITED STATES, BY DISTRICT 1/
1994 1995Quantity Quantity(thousand Value Average (thousand Value Average
District metric tons) 2/ (thousands) per ton metric tons) 2/ (thousands) per tonNew York and Maine 91 $6,823 $75.21 87 $6,986 $80.30Pennsylvania, eastern 187 13,518 72.34 180 13,211 73.39Pennsylvania, western 83 7,658 92.76 80 7,394 92.43Illinois, Indiana, Michigan, Ohio 723 60,056 83.06 678 59,226 87.35Iowa, Kansas, Missouri, Nebraska, South Dakota 206 12,852 62.41 189 12,678 67.08Florida 358 31,022 86.57 415 38,023 91.62Georgia and South Carolina 396 36,406 91.83 413 40,351 97.70Maryland, Virginia, West Virginia 531 35,151 66.23 480 36,395 75.82Alabama 317 29,401 92.86 302 30,277 100.25Kentucky, Mississippi, Tennessee 119 8,848 74.45 117 9,476 80.99Arkansas, Oklahoma, Texas 354 26,075 73.70 290 24,368 84.03Arizona, Colorado, Idaho, Montana, Nevada, New Mexico, Utah, Wyoming 110 8,821 80.36 111 9,099 81.97Alaska, California, Hawaii, Oregon, Washington 110 7,738 70.49 165 12,288 74.47 Total 3/ 4/ or average 3,587 284,819 79.40 3,510 300,571 85.631/ Excludes Puerto Rico (does not produce masonry cement).2/ Shipments calculated based on annual survey of plants; may differ from tables 8 and 9, which are based on consolidated company monthly data.3/ Data may not add to totals shown because of independent rounding.4/ Total includes imports shipped by independent importers.

TABLE 13AVERAGE MILL VALUE OF CEMENT IN THE UNITED STATES 1/
(Per metric ton)
Gray White All Prepared Allportland portland portland masonry classes
Year cement cement cement cement 2/ of cement1994 60.28 177.04 61.07 79.40 61.881995 66.89 174.66 67.67 85.64 68.461/ Includes Puerto Rico. Mill value is the actual value of sales to customers, f.o.b. plant,less all discounts and allowances, less all freight charges from producing plant todistribution terminal if any, less total cost of operating terminal, if any, less cost of paperbags and pallets.
2/ Masonry cement made at cement plants only.
TABLE 14PORTLAND CEMENT SHIPMENTS IN 1995, BY DISTRICT OF ORIGIN AND TYPE OF CUSTOMER 1/ 2/
(Thousand metric tons)
Ready Concrete Building Oil well, Government mixed product material mining, and
District of origin concrete manufacturers 3/ Contractors 4/ dealers waste 5/ miscellaneous 6/ Total 7/New York and Maine 1,732 322 48 119 -- 696 2,916Pennsylvania, eastern 1,594 644 135 216 25 1,284 3,899Pennsylvania, western 911 175 140 75 16 168 1,486Illinois 1,296 229 65 16 15 30 1,651Indiana 1,990 372 45 80 11 13 2,510Michigan 2,102 595 208 248 14 1,932 5,098Ohio 698 187 49 34 6 13 985Iowa, Nebraska, South Dakota 2,722 497 342 82 34 112 3,790Kansas 1,167 119 175 35 20 187 1,703Missouri 2,799 351 461 112 -- 1,054 4,778Florida and Puerto Rico 2,168 583 206 632 -- 2,013 5,604Georgia and South Carolina 2,344 606 181 119 2 44 3,296Maryland, Virginia, West Virginia 2,279 615 227 112 7 22 3,262Alabama 1,643 419 210 245 -- 1,393 3,910Kentucky, Mississippi, Tennessee 1,863 279 110 67 3 24 2,346Arkansas and Oklahoma 1,343 91 358 37 40 636 2,506Texas, northern 1,932 215 494 106 389 419 3,556Texas, southern 3,121 266 316 123 139 944 4,908Arizona and New Mexico 1,721 252 168 50 30 89 2,309Colorado and Wyoming 1,481 150 127 67 16 -- 1,841Idaho, Montana, Nevada, Utah 1,849 220 212 25 52 75 2,432Alaska, Hawaii, Oregon, Washington 919 98 148 79 -- 274 1,520California, northern 1,584 243 103 46 45 12 2,032California, southern 4,306 920 225 160 117 485 6,212 Total 7/ 46,772 8,762 4,758 3,198 978 11,946 76,4141/ Includes imports shipped by independent importers.2/ Shipments calculated based on annual survey of plants; may differ from tables 8 and 9, which are based on consolidated company monthly data.3/ Concrete product manufacturers in thousand metric tons include: brick/ block-1,519; precast-1,063; pipe-711; and others-5,317. Remainder includesunspecified amounts of brick/ block, precast, and pipe.4/ Contractors in thousand metric tons include: road paving-1,740; soil cement-577 and other-2,237. Remainder includes unspecified amounts of roadpaving, and soil cement.5/ Oil well, mining, and waste included in thousand metric tons: oil well drilling-713; mining-81; and waste stabilization-184.6/ Includes shipments designated as going to "unspecified" customers.7/ Data may not add to totals shown because of independent rounding.

TABLE 15PORTLAND CEMENT SHIPPED FROM PLANTS
IN THE UNITED STATES, 1/ 2/ BY TYPE
1994 1995Quantity Quantity(thousand (thousand
Type metric tons) metric tons)General use and moderate heat (Types I and II), (Gray) 69,810 69,247High early strength (Type III) 2,618 2,658Sulfate resisting (Type V) 1,763 1,694Block 463 493Oil well 937 750White 519 549Blended: Portland-slag and portland pozzolan 422 754 Other blended cement 3/ W 63Expansive W W Regulated fast setting W W Miscellaneous 4/ 304 155 Total 5/ 6/ 76,903 76,414W Withheld to avoid disclosing company proprietary data; included in "Total."1/ Includes Puerto Rico.2/ Shipments calculated based on annual survey of plants; may differ from tables 8 and 9,which are based on consolidated company monthly data.3/ Includes blends with fly ash and silica fume.4/ Includes waterproof and lowheat (Type IV).5/ Data may not add to totals shown because of independent rounding.6/ Does not include cement consumed at plant.
TABLE 16U.S. EXPORTS OF HYDRAULIC CEMENT AND CEMENT CLINKER, 1/ BY COUNTRY
(Thousand metric tons and thousand dollars)
1994 1995Country of destination Quantity Value 2/ Quantity Value 2/
Bahamas, The 9 546 3 282Canada 510 35,272 582 40,434Ghana (3/) 31 (3/) 6Mexico 62 4,221 17 1,871Netherlands 1 223 1 230Other 52 4,896 156 10,153 Total 4/ 633 45,189 759 52,9751/ Includes portland and masonry cement.
2/ Free alongside ship (f.a.s.) value. The value of exports at the U.S. seaport, or border port ofexport, based on the transaction price, including inland freight, insurance, and other charges incurredin placing the merchandise alongside the carrier at the U.S. port of exportation. The value excludesthe cost of loading.
3/ Less than 1/2 unit.4/ Data may not add to totals shown because of independent rounding.
Source: Bureau of the Census.

TABLE 17U.S. IMPORTS FOR CONSUMPTION OF HYDRAULIC CEMENT AND CLINKER, 1/ BY COUNTRY
(Thousand metric tons and thousand dollars)
1994 1995Value Value
Country of origin Quantity Customs 2/ C.i.f. 3/ Quantity Customs 2/ C.i.f. 3/Canada 4,268 168,603 183,314 4,886 198,056 217,926Colombia 709 24,830 31,351 804 30,993 38,026France 474 27,088 32,538 508 24,639 30,905Greece 914 31,919 44,060 1,245 44,326 61,549Japan 14 668 891 (4/) 352 415Mexico 640 25,573 31,097 850 31,938 39,491Spain 1,342 54,585 64,771 1,501 56,336 71,906Venezuela 803 32,735 42,090 1,435 56,965 71,317Other 2,139 77,036 107,620 2,618 97,458 137,990 Total 5/ 11,303 443,038 537,731 13,848 541,064 669,5251/ Includes portland, masonry, and other hydraulic cements. Includes Puerto Rico.2/ Customs value: price actually paid or payable for merchandise when sold for exportation to the United States, excludingU.S. import duties, freight, insurance, and other charges incurred in bringing the merchandise to the United States.3/ C.i.f. (Cost, insurance and freight): import value represents the customs value plus insurance, freight, and other deliverycharges to the first port of entry. It is computed by adding "freight" to the "customs value."4/ Less than 1/2 unit.5/ Data may not add to totals shown because of independent rounding.
Source: Bureau of the Census.
TABLE 18U.S. IMPORTS FOR CONSUMPTION OF CLINKER, 1/ BY COUNTRY
(Thousand metric tons and thousand dollars)
1994 1995Value Value
Country Quantity Customs 2/ C.i.f. 3/ Quantity Customs 2/ C.i.f. 3/Australia 103 3,675 5,414 114 4,534 6,177Canada 913 31,674 32,261 1,375 46,658 50,560Colombia 212 6,370 7,914 139 4,785 5,834France 154 13,535 15,319 163 8,062 10,061Greece -- -- -- 104 3,308 4,709Mexico (4/) 7 8 -- -- -- New Zealand 27 837 1,253 22 680 1,043Spain 33 912 1,262 -- -- -- Other 766 22,773 31,540 940 30,646 41,356 Total 5/ 2,208 79,783 94,970 2,858 98,674 119,7421/ For all types of hydraulic cement.2/ Customs value: price actually paid or payable for merchandise when sold for exportation to the United States, excludingU.S. import duties, freight, insurance, and other charges incurred in bringing the merchandise to the United States.3/ C.i.f. (Cost, insurance and freight): import value represents the customs value plus insurance, freight, and other deliverycharges to the first port of entry. It is computed by adding "freight" to the "customs value."4/ Less than 1/2 unit.5/ Data may not add to totals shown because of independent rounding.
Source: Bureau of the Census.
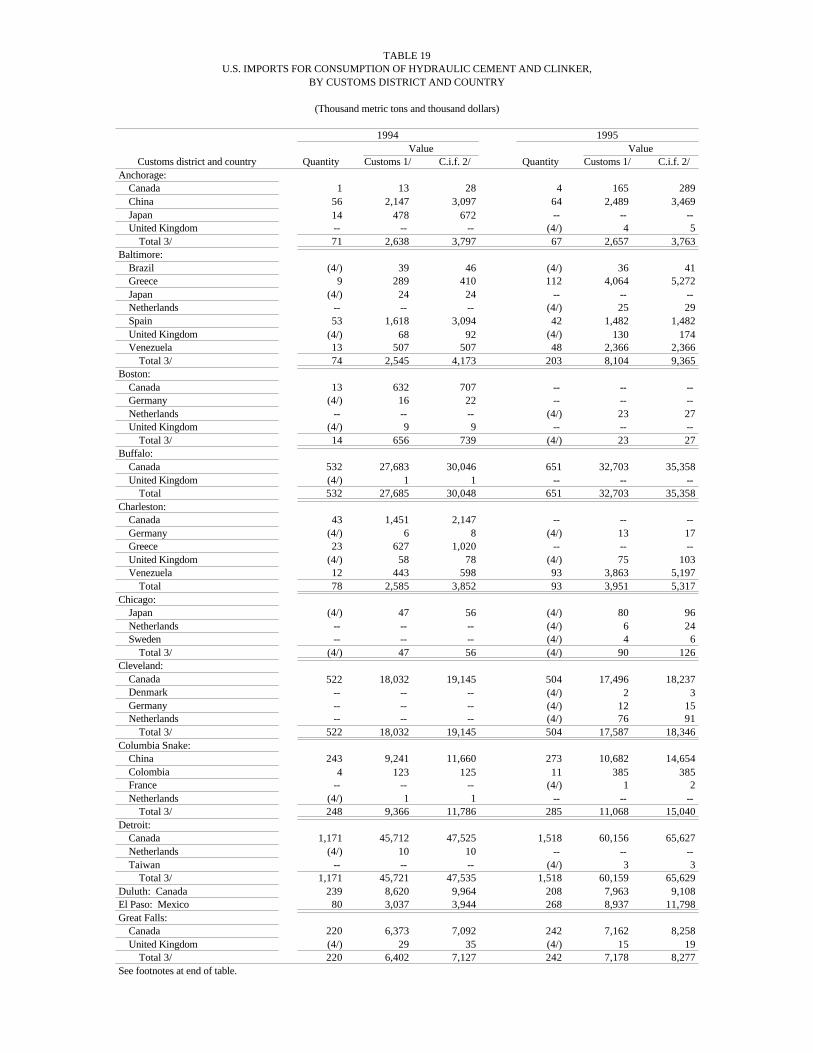
TABLE 19U.S. IMPORTS FOR CONSUMPTION OF HYDRAULIC CEMENT AND CLINKER,
BY CUSTOMS DISTRICT AND COUNTRY
(Thousand metric tons and thousand dollars)
1994 1995Value Value
Customs district and country Quantity Customs 1/ C.i.f. 2/ Quantity Customs 1/ C.i.f. 2/Anchorage: Canada 1 13 28 4 165 289 China 56 2,147 3,097 64 2,489 3,469 Japan 14 478 672 -- -- -- United Kingdom -- -- -- (4/) 4 5 Total 3/ 71 2,638 3,797 67 2,657 3,763Baltimore: Brazil (4/) 39 46 (4/) 36 41 Greece 9 289 410 112 4,064 5,272 Japan (4/) 24 24 -- -- -- Netherlands -- -- -- (4/) 25 29 Spain 53 1,618 3,094 42 1,482 1,482 United Kingdom (4/) 68 92 (4/) 130 174 Venezuela 13 507 507 48 2,366 2,366 Total 3/ 74 2,545 4,173 203 8,104 9,365Boston: Canada 13 632 707 -- -- -- Germany (4/) 16 22 -- -- -- Netherlands -- -- -- (4/) 23 27 United Kingdom (4/) 9 9 -- -- -- Total 3/ 14 656 739 (4/) 23 27Buffalo: Canada 532 27,683 30,046 651 32,703 35,358 United Kingdom (4/) 1 1 -- -- -- Total 532 27,685 30,048 651 32,703 35,358Charleston: Canada 43 1,451 2,147 -- -- -- Germany (4/) 6 8 (4/) 13 17 Greece 23 627 1,020 -- -- -- United Kingdom (4/) 58 78 (4/) 75 103 Venezuela 12 443 598 93 3,863 5,197 Total 78 2,585 3,852 93 3,951 5,317Chicago: Japan (4/) 47 56 (4/) 80 96 Netherlands -- -- -- (4/) 6 24 Sweden -- -- -- (4/) 4 6 Total 3/ (4/) 47 56 (4/) 90 126Cleveland: Canada 522 18,032 19,145 504 17,496 18,237 Denmark -- -- -- (4/) 2 3 Germany -- -- -- (4/) 12 15 Netherlands -- -- -- (4/) 76 91 Total 3/ 522 18,032 19,145 504 17,587 18,346Columbia Snake: China 243 9,241 11,660 273 10,682 14,654 Colombia 4 123 125 11 385 385 France -- -- -- (4/) 1 2 Netherlands (4/) 1 1 -- -- -- Total 3/ 248 9,366 11,786 285 11,068 15,040Detroit: Canada 1,171 45,712 47,525 1,518 60,156 65,627 Netherlands (4/) 10 10 -- -- -- Taiwan -- -- -- (4/) 3 3 Total 3/ 1,171 45,721 47,535 1,518 60,159 65,629Duluth: Canada 239 8,620 9,964 208 7,963 9,108El Paso: Mexico 80 3,037 3,944 268 8,937 11,798Great Falls: Canada 220 6,373 7,092 242 7,162 8,258 United Kingdom (4/) 29 35 (4/) 15 19 Total 3/ 220 6,402 7,127 242 7,178 8,277See footnotes at end of table.

TABLE 19--ContinuedU.S. IMPORTS FOR CONSUMPTION OF HYDRAULIC CEMENT AND CLINKER,
BY CUSTOMS DISTRICT AND COUNTRY
(Thousand metric tons and thousand dollars)
1994 1995Value Value
Customs district and country Quantity Customs 1/ C.i.f. 2/ Quantity Customs 1/ C.i.f. 2/Honolulu: Australia 103 3,675 5,414 114 4,534 6,177 France -- -- -- (4/) 12 17 New Zealand 27 837 1,253 22 680 1,043 Venezuela 26 814 1,404 -- -- -- Total 157 5,326 8,071 137 5,227 7,237Houston-Galveston: Colombia 7 324 438 24 884 1,380 Denmark 6 308 309 -- -- -- France 68 2,868 3,219 -- -- -- Japan (4/) 70 82 (4/) 65 77 Spain 529 21,811 23,203 574 19,985 25,750 Switzerland 33 1,404 1,734 -- -- -- United Kingdom (4/) 23 31 (4/) 50 63 Total 644 26,807 29,016 598 20,984 27,270Laredo: China -- -- -- (4/) 3 4 Mexico 48 3,978 4,560 51 4,755 5,211 Total 49 3,978 4,560 52 4,758 5,215Los Angeles: Croatia -- -- -- 1 165 251 France (4/) 22 26 -- -- -- Japan (4/) 50 57 (4/) 70 79 Mexico 355 13,393 15,811 225 8,229 10,049 New Zealand -- -- -- (4/) 265 332 Spain 24 828 1,103 -- -- -- United Kingdom -- -- -- (4/) 5 8 Total 3/ 380 14,293 16,996 227 8,734 10,719Miami: Belgium 3 251 340 3 251 340 Brazil -- -- -- (4/) 5 5 Colombia 306 11,523 14,636 224 9,221 11,509 Denmark 31 1,886 2,841 22 1,119 1,949 Germany -- -- -- (4/) 9 12 Greece 35 1,275 1,647 -- -- -- Norway 64 2,275 2,892 -- -- -- Spain 288 13,331 15,364 350 15,732 19,364 Sweden 158 4,425 6,469 337 10,044 14,118 United Kingdom (4/) 3 3 -- -- -- Venezuela 47 1,755 2,336 63 2,170 3,040 Total 3/ 932 36,724 46,527 999 38,550 50,337Milwaukee: Canada 179 6,056 6,226 188 6,361 6,561 Germany (4/) 1 2 -- -- -- Total 3/ 179 6,057 6,228 188 6,361 6,561Minneapolis: Germany (4/) 25 26 (4/) 11 13Mobile: Bulgaria 56 1,407 2,201 162 4,315 6,811 France 54 1,491 1,843 63 1,936 2,064 Greece -- -- -- 69 2,086 2,947 Macao 24 619 850 -- -- -- Morocco 20 543 778 -- -- -- Tunisia -- -- -- 25 695 1,055 Venezuela -- -- -- 82 2,705 3,601 Total 3/ 155 4,060 5,673 401 11,737 16,478New Orleans: Bulgaria 24 599 917 35 874 1,338 Canada -- -- -- 145 4,293 5,745 Colombia 43 1,610 2,197 169 6,414 8,528 Croatia -- -- -- 5 605 885 Denmark 103 3,618 5,438 -- -- -- See footnotes at end of table.

TABLE 19--ContinuedU.S. IMPORTS FOR CONSUMPTION OF HYDRAULIC CEMENT AND CLINKER,
BY CUSTOMS DISTRICT AND COUNTRY
(Thousand metric tons and thousand dollars)
1994 1995Value Value
Customs district and country Quantity Customs 1/ C.i.f. 2/ Quantity Customs 1/ C.i.f. 2/New Orleans:--continued France 230 9,741 12,755 400 15,359 20,497 Greece 363 12,486 17,357 359 12,560 17,385 Italy 179 6,165 8,612 362 14,440 20,044 Netherlands -- -- -- (4/) 6 8 Norway -- -- -- 103 3,548 5,180 Spain 99 3,613 4,726 37 1,360 1,771 Sweden -- -- -- 39 1,302 1,887 Tunisia 26 741 1,115 52 1,462 2,111 Turkey 474 14,162 20,311 213 6,530 9,702 Ukraine 34 900 1,247 -- -- -- Venezuela 34 1,351 1,826 6 278 369 Total 3/ 1,612 54,988 76,500 1,928 69,033 95,448New York: France -- -- -- (4/) 5 6 Greece 300 11,102 15,300 182 6,652 8,952 Netherlands (4/) 107 114 (4/) 79 83 Norway 78 2,522 3,496 245 9,348 12,684 Spain 208 8,157 10,614 218 8,246 10,472 United Kingdom (4/) 10 11 (4/) 50 61 Total 3/ 586 21,899 29,535 645 24,379 32,258Nogales: Mexico 156 5,110 6,724 303 9,733 12,117Norfolk: Croatia -- -- -- (4/) 4 9 Denmark 117 5,865 7,198 236 9,366 12,245 France 84 11,740 12,998 45 7,294 8,282 Greece 183 6,140 8,325 492 17,908 25,466 Netherlands (4/) 16 17 (4/) 144 161 Spain (4/) 180 199 -- -- -- United Kingdom -- -- -- (4/) 8 11 Venezuela 33 1,260 1,701 -- -- -- Total 3/ 418 25,200 30,438 773 34,725 46,175Ogdensburg: Canada 408 13,246 14,688 353 12,446 13,752 United Kingdom -- -- -- (4/) 12 12 Total 408 13,246 14,688 354 12,458 13,764Pembina: Canada 120 5,104 5,983 167 7,024 8,104Philadelphia: Germany (4/) 6 15 (4/) 76 89 Japan -- -- -- (4/) 54 65 New Zealand -- -- -- (4/) 66 85 Total (4/) 6 15 (4/) 196 239Portland: Bulgaria 28 733 1,028 -- -- -- Canada 10 469 622 8 410 526 Total 38 1,201 1,649 8 410 526Providence: Spain -- -- -- 35 1,247 1,464San Diego: Mexico 1 56 58 3 281 312 Spain 28 1,261 1,545 -- -- -- Total 3/ 29 1,317 1,603 3 281 312San Francisco: China (4/) 2 2 -- -- -- France (4/) 32 37 (4/) 30 34 Japan -- -- -- (4/) 36 44 New Zealand 1 738 977 1 1,138 1,417 United Kingdom -- -- -- (4/) 15 16 Total 3/ 1 771 1,016 1 1,220 1,512San Juan: Belgium 10 838 1,418 12 931 1,582 Canada -- -- -- 26 937 1,578See footnotes at end of table.

TABLE 19--ContinuedU.S. IMPORTS FOR CONSUMPTION OF HYDRAULIC CEMENT AND CLINKER,
BY CUSTOMS DISTRICT AND COUNTRY
(Thousand metric tons and thousand dollars)
1994 1995Value Value
Customs district and country Quantity Customs 1/ C.i.f. 2/ Quantity Customs 1/ C.i.f. 2/San Juan:--continued Colombia (4/) 22 29 42 1,720 1,872 Denmark 13 1,157 1,853 9 754 1,260 Germany (4/) 5 5 -- -- -- Mexico -- -- -- (4/) 3 4 Netherlands -- -- -- (4/) 28 49 Spain (4/) 7 8 (4/) 8 11 Turkey (4/) 4 7 -- -- -- Venezuela -- -- -- (4/) 2 2 Total 3/ 23 2,033 3,319 90 4,383 6,358Savannah: Bahamas, The -- -- -- 6 244 247 Bulgaria -- -- -- 24 643 1,049 Denmark -- -- -- 3 162 298 Greece -- -- -- 30 1,056 1,525 United Kingdom -- -- -- 30 749 1,246 Venezuela -- -- -- 91 3,274 3,691 Total 3/ -- -- -- 184 6,127 8,057Seattle: Canada 663 31,141 33,400 762 36,158 38,719 China 17 646 896 (4/) 9 11 Colombia 100 3,349 3,963 149 5,457 5,540 Japan -- -- -- (4/) 46 54 Total 3/ 780 35,136 38,259 911 41,671 44,323St. Albans: Canada 78 2,699 3,543 110 4,780 6,065 Netherlands (4/) 102 116 (4/) 117 136 Total 3/ 79 2,801 3,660 110 4,897 6,201Tampa: Canada 44 481 877 -- -- -- Colombia 241 7,531 9,427 184 6,911 8,812 Denmark 79 4,510 6,931 58 3,712 5,894 France 37 1,195 1,661 (4/) 3 3 Spain 113 3,779 4,915 244 8,275 11,591 Sweden 79 2,721 3,705 152 5,147 7,154 Turkey 38 1,248 1,616 -- -- -- Venezuela 450 17,578 22,406 883 34,960 43,529 Total 3/ 1,081 39,043 51,538 1,522 59,008 76,983U.S. Virgin Islands: Colombia 8 348 536 -- -- -- Martinique 4 28 30 -- -- -- Netherlands Antilles -- -- -- 2 64 67 Panama -- -- -- 4 73 98 Trinidad and Tobago 8 284 337 -- -- -- Venezuela 49 3,683 4,130 32 1,628 1,847 Total 3/ 70 4,343 5,034 38 1,765 2,012Washington: Netherlands (4/) 3 4 -- -- -- Wilmington: Canada 25 893 1,321 -- -- -- Netherlands -- -- -- (4/) 7 13 Venezuela 139 5,344 7,183 139 5,719 7,675 Total 3/ 164 6,237 8,503 139 5,726 7,688 Grand total 3/ 11,303 443,038 537,731 13,848 541,064 669,5251/ Customs value: price actually paid or payable for merchandise when sold for exportation to the United States, excluding U.S. importduties, freight, insurance, and other charges incurred in bringing the merchandise to the United States.2/ C.i.f. (Cost, insurance and freight): import value represents the customs value plus insurance, freight, and other delivery charges to thefirst port of entry. It is computed by adding "freight" to the "customs value."3/ Data may not add to totals shown because of independent rounding.4/ Less than 1/2 unit.
Source: Bureau of the Census.

TABLE 20U.S. IMPORTS FOR CONSUMPTION OF HYDRAULIC CEMENT AND CLINKER 1/
(Thousand metric tons and thousand dollars)
Gray hydraulic cement White portland cement Hydraulic cement clinker Total 2/Value Value Value Value
Year Quantity (customs) Quantity (customs) Quantity (customs) Quantity (customs)1994 8,635 329,012 459 34,243 2,208 79,783 11,303 443,0381995 10,554 407,537 436 34,854 2,858 98,674 13,848 541,0641/ Includes Puerto Rico.2/ Data may not add to totals shown because of independent rounding.
Source: Bureau of the Census.
TABLE 21HYDRAULIC CEMENT: WORLD PRODUCTION BY COUNTRY 1/
(Thousand metric tons)
Country 1991 1992 1993 1994 1995 e/Afghanistan e/ 112 115 115 115 115Albania e/ 600 200 200 200 200Algeria 6,319 6,400 6,400 e/ 6,060 r/ 6,200Angola e/ 260 300 250 300 300Argentina 3,399 5,051 5,647 6,306 r/ 6,400Armenia 2/ XX 400 r/ 200 100 r/ 200Australia 6,108 5,412 5,500 e/ 6,000 e/ 6,000Austria 5,016 5,031 4,941 5,000 e/ 5,000Azerbaijan 2/ XX 800 r/ 600 r/ 500 r/ 200Bahrain 150 220 225 225 e/ 225Bangladesh 3/ 275 273 275 280 e/ 280Barbados 200 e/ 175 e/ 62 r/ 78 r/ 80Belarus 2/ XX 2,300 r/ 1,900 r/ 1,488 r/ 1,235 4/Belgium 7,184 8,073 7,612 r/ 8,000 e/ 8,000Benin e/ 320 370 380 380 380Bhutan 116 116 108 120 e/ 140Bolivia 592 600 654 r/ 708 r/ 700Bosnia and Herzegovina e/ 5/ XX 150 150 150 150Brazil 27,490 23,903 r/ 24,843 r/ 25,229 r/ 25,500Bulgaria 2,374 2,132 r/ 2,007 r/ 2,200 r/ 2,100Burma 443 r/ 464 r/ 400 r/ 470 r/ 517 4/Cameroon 521 r/ 519 r/ 520 r/ e/ 520 r/ e/ 520Canada 9,396 5,698 6,672 10,584 r/ 10,722 4/Chile 2,251 2,645 3,021 r/ 2,995 r/ 3,000China 252,610 308,220 367,880 421,180 r/ 445,610 4/Colombia 6,302 6,807 7,930 r/ 9,322 r/ 9,624 4/Congo 103 115 114 e/ 114 e/ 100Costa Rica 700 e/ 700 e/ 860 r/ 940 r/ 990Côte d'Ivoire e/ 500 510 500 500 500Croatia 5/ XX 1,768 1,683 1,700 e/ 1,700Cuba 2,000 e/ 2,000 e/ 1,049 r/ 1,081 r/ 1,200Cyprus 1,134 1,131 1,089 1,053 r/ 1,021 4/Czech Republic 6/ XX XX 5,393 5,303 4,825 4/Czechoslovakia 7/ 8,299 8,500 XX XX XXDenmark (sales) 2,016 2,072 2,270 2,430 r/ 2,000Dominican Republic 1,235 r/ 1,365 r/ 1,271 r/ 1,276 r/ 1,453 4/Ecuador 2,300 e/ 2,250 e/ 2,098 r/ 2,164 r/ 2,300Egypt 16,427 17,000 16,000 16,000 e/ 16,000El Salvador 680 419 861 850 875Eritrea e/ XX XX 30 300 r/ 350Estonia e/ 2/ XX 600 500 402 r/ 4/ 417 4/Ethiopia 290 300 270 e/ 260 611 4/Fiji 79 84 80 94 78 4/Finland 1,324 1,129 835 864 r/ 900France 26,507 21,165 20,464 r/ 21,296 r/ 21,000Gabon 117 116 132 126 e/ 130Georgia 2/ XX 500 r/ 300 r/ 100 r/ 100Germany 34,396 37,529 36,649 40,380 40,000See footnotes at end of table.

TABLE 21--ContinuedHYDRAULIC CEMENT: WORLD PRODUCTION BY COUNTRY 1/
(Thousand metric tons)
Country 1991 1992 1993 1994 1995 e/Ghana 750 1,024 1,203 1,346 1,400Greece 11,808 10,668 12,618 12,636 12,000Guadeloupe e/ 240 235 230 230 230Guatemala 1,440 1,400 e/ 1,119 r/ 1,480 1,560Haiti e/ 250 200 100 75 50Honduras 693 650 e/ 723 r/ 615 r/ 655Hong Kong 1,677 1,643 1,712 1,927 1,913 4/Hungary 2,529 2,236 2,533 2,813 3,000Iceland 106 100 86 81 r/ 82India e/ 51,000 50,000 53,812 4/ 60,000 r/ 70,000Indonesia 16,153 17,280 18,934 19,000 e/ 19,500Iran e/ 15,000 15,200 r/ 16,000 r/ 16,000 r/ 16,300Iraq e/ 5,000 10,000 12,000 15,000 r/ 18,000Ireland e/ 1,600 1,600 1,600 1,550 1,500Israel e/ 3,550 3,500 3,500 3,500 3,500Italy 40,806 41,347 34,771 r/ 33,192 r/ 35,000Jamaica 384 r/ 475 r/ 451 445 r/ 523 4/Japan 89,564 88,253 88,046 91,624 r/ 90,474 4/Jordan 1,363 r/ 3,134 r/ 3,514 r/ 4,000 r/ e/ 4,000Kazakstan 2/ XX 6,400 r/ 4,000 r/ 2,000 r/ 1,800Kenya 1,423 1,508 1,417 r/ 1,420 r/ e/ 1,500Korea, North e/ 16,000 17,000 17,000 17,000 17,000Korea, Republic of 34,999 44,444 47,313 50,730 r/ 55,130 4/Kuwait 98 r/ 533 r/ 500 e/ 1,000 r/ e/ 2,000Kyrgyzstan 2/ XX 1,100 r/ 700 r/ 400 r/ 300Latvia e/ 2/ XX 400 300 244 r/ 4/ 204 4/Lebanon e/ 900 1,500 r/ 2,500 r/ 2,800 r/ 3,000Liberia 2 8 8 e/ -- e/ --Libya 2,369 2,300 2,300 e/ 2,300 e/ 2,300Lithuania e/ 2/ XX 1,500 r/ 1,000 r/ 736 r/ 4/ 649 4/Luxembourg e/ 688 4/ 600 600 620 600Macedonia 5/ XX 516 r/ 499 r/ 486 r/ 500Madagascar e/ 60 60 60 60 60Malawi 120 112 127 122 r/ 139Malaysia 7,451 8,366 8,797 9,928 r/ 10,667 4/Mali e/ 20 20 20 20 20Martinique e/ 245 240 220 225 225Mauritania 105 122 111 374 375Mexico 25,100 26,880 27,120 29,700 23,971 4/Moldova 2/ XX 700 r/ 100 r/ 39 r/ 49 4/Mongolia 227 133 82 86 109 4/Morocco e/ 5,770 6,340 4/ 6,350 r/ 6,500 r/ 6,500Mozambique e/ 80 30 20 20 20Nepal 136 196 190 190 e/ 220Netherlands e/ 3,546 4/ 3,300 3,400 3,400 3,400New Caledonia 90 90 90 e/ 90 e/ 100New Zealand 576 579 600 e/ 700 r/ e/ 700Nicaragua 239 r/ 277 r/ 255 r/ 309 r/ 350Niger 20 29 29 e/ 30 e/ 30Nigeria e/ 3,500 3,500 3,500 2,600 r/ 4/ 2,600Norway 1,147 1,266 1,344 1,444 1,400Oman 995 970 1,000 1,200 r/ 1,400Pakistan 7,762 7,793 8,321 8,100 r/ 8,586 4/Panama 300 e/ 250 e/ 571 r/ 615 r/ 350Paraguay 326 e/ 326 e/ 490 r/ 570 r/ 570Peru e/ 2,200 2,089 4/ 2,089 2,100 2,100Philippines 6,913 6,667 r/ 7,962 9,600 9,800Poland 12,012 11,908 12,228 13,834 r/ 13,884 4/Portugal e/ 7,473 7,638 7,600 7,500 7,500Qatar 527 544 544 e/ 550 r/ e/ 580Romania 6,692 6,271 6,240 5,998 r/ 6,000Russia 2/ XX 61,700 r/ 49,900 r/ 37,200 r/ 36,400Rwanda e/ 60 60 60 10 5Saudi Arabia 11,371 15,324 r/ 15,300 e/ 16,000 e/ 16,000See footnotes at end of table.

TABLE 21--ContinuedHYDRAULIC CEMENT: WORLD PRODUCTION BY COUNTRY 1/
(Thousand metric tons)
Country 1991 1992 1993 1994 1995 e/Senegal 503 601 590 590 r/ e/ 590Serbia and Montenegro 5/ XX 2,036 1,088 1,612 1,696 4/Singapore e/ 2,000 1,900 1,900 1,900 1,900Slovakia e/ 6/ XX XX 2,500 2,500 2,500Slovenia e/ 5/ XX 950 950 1,000 1,000Somalia e/ 10 25 25 25 25South Africa 7,427 7,028 7,356 7,905 9,071 4/Spain (including Canary Islands) 25,119 r/ 24,615 r/ 22,878 r/ 25,150 r/ 25,000Sri Lanka 400 e/ 817 676 925 900Sudan e/ 170 250 250 250 250Suriname e/ 50 50 50 50 50Sweden 2,395 2,289 2,200 e/ 2,100 e/ 2,100Switzerland 4,700 4,260 4,000 e/ 4,000 e/ 4,000Syria 3,500 3,700 4,500 r/ 5,000 r/ e/ 6,000Taiwan 19,399 21,644 23,971 22,722 22,478 4/Tajikistan 2/ XX 400 r/ 300 r/ 200 100Tanzania e/ 540 540 540 490 r/ 800Thailand 18,054 21,832 26,870 28,000 e/ 26,500Togo 388 350 350 e/ 350 e/ 350Trinidad and Tobago 485 482 527 583 600Tunisia 4,009 r/ 3,999 r/ 4,269 r/ 4,300 r/ e/ 4,300Turkmenistan 2/ XX 1,100 r/ 1,100 r/ 700 r/ 400Turkey 26,091 28,607 31,241 r/ 29,493 r/ 33,153 4/Uganda e/ 50 50 50 r/ 125 r/ 130Ukraine 2/ XX 20,100 r/ 15,000 r/ 11,400 r/ 11,000U.S.S.R. 8/ 127,000 e/ XX XX XX XXUnited Arab Emirates 3,473 3,800 4,000 r/ e/ 5,000 r/ e/ 6,000United Kingdom 12,297 r/ 11,006 11,039 r/ 12,493 r/ 12,500United States (including Puerto Rico) 68,465 r/ 70,883 r/ 75,117 79,353 r/ 78,320 4/Uruguay e/ 500 500 500 700 r/ 600Uzbekistan 2/ XX 5,900 r/ 5,300 r/ 4,800 r/ 3,500Venezuela 6,337 6,585 6,842 6,900 e/ 6,900Vietnam e/ 3,000 5,000 6,500 7,200 7,500Yemen 850 800 800 e/ 800 e/ 1,000Yugoslavia 9/ 7,500 e/ XX XX XX XXZaire 250 e/ 174 149 150 e/ 100Zambia 367 347 e/ 350 e/ 280 r/ 300Zimbabwe e/ 865 4/ 900 1,000 900 1,000 Total e/ 10/ 1,181,793 r/ 1,239,683 r/ 1,301,527 r/ 1,380,052 r/ 1,421,342e/ Estimated. r/ Revised. XX Not applicable.1/ Table includes data available through Sept. 1996.2/ Formerly part of the U.S.S.R.; data were not reported separately until 1992.3/ Data are for the year ending June 30 of that stated.4/ Reported figure.5/ Formerly part of Yugoslavia; data were not reported separately until 1992.6/ Formerly part of Czechoslovakia; data were not reported separately until 1993.7/ Dissolved Dec. 31, 1992.8/ Dissolved in Dec. 1991.9/ Dissolved in Apr. 1992.10/ Data may not add to totals shown because of independent rounding.