Embed Size (px)
Citation preview

Electronic Supplementary Information
Achieving Very Bright Mechanoluminescence from Purely Organic Luminophores with Aggregation-Induced Emission by Crystal Design
Bingjia Xu,a,b Wenlang Li,a Jiajun He,a Sikai Wu,a Qiangzhong Zhu,b Zhiyong Yang,*a Yuan-Chun Wu,c Yi Zhang,*a Chongjun Jin,b Po-Yen Lu,c Zhenguo Chi,*a Siwei Liu,a Jiarui Xua and Martin R. Bryced
a PCFM Lab, GD HPPC Lab, Guangdong Engineering Technology Research Center for High-performance
Organic and Polymer Photoelectric Functional Films, State Key Laboratory of Optoelectronic Material and
Technologies, School of Chemistry and Chemical Engineering, Sun Yet-sen University, Guangzhou 510275,
China.
E-mail: [email protected]; [email protected]; [email protected]; Tel: +86 20
84112712.b State Key Laboratory of Optoelectronic Material and Technologies, School of Physics and Engineering,
Sun Yat-sen University, Guangzhou 510275, China.c Shenzhen China Star Optoelectronics Technology Co., Ltd, Guangdong, China.d Department of Chemistry, Durham University, Durham DH1 3LE, UK.
1. General experimental proceduresMaterials (2-bromoethene-1,1,2-triyl)tribenzene, 9H-fluoren-9-one, benzophenone, tetrakis(triphenyl
phosphine) palladium(0), Aliquat 336, (4-acetylphenyl)boronic acid, (4-formylphenyl)boronic acid and (3-
formylphenyl)boronic acid purchased from Alfa Aesar were used as received. The compounds 4-(1,2,2-
triphenylvinyl)benzaldehyde (p-P4A)1 and 9-(dibromomethylene)-9H-fluorene (FBr2)2, and (2,2-dibromo ethene-
1,1-diyl)dibenzene (P2Br2)2 were synthesized according to the literature methods. Ultra-pure water was used in
the experiments. All other reagents and solvents were purchased with analytical grade from Guangzhou
Jincheng Company (China) and used without further purification. The water/tetrahydrofuran mixtures with
different water fractions were prepared by slowly adding distilled water into the THF solution of the
samples under ultrasound at room temperature.
Characterization Proton and carbon NMR (1HNMR and 13CNMR) spectra were measured on a Mercury-Plus
300 spectrometer, a Bruker AVANCE 400 spectrometer or a Bruker AVANCE III spectrometer (CDCl3,
tetramethylsilane as the internal standard). The mass spectra were measured using Thermo spectrometers
(DSQ & MAT95XP-HRMS). The FT-IR spectra were obtained on a Nicolet NEXUS 670 spectrometer (KBr
pellet). The elemental analysis was performed with a Vario EL analyzer. The UV-visible absorption spectra
were determined on a Hitachi U-3900 spectrophotometer. The PL spectra were measured on an Ocean
Optics Maya Pro2000 instrument with a 365 nm Ocean Optics LLS-LED as the excitation source. Light was
introduced into the detector through an optical fiber. The ML spectra were collected from an Acton SP2750
spectrometer with a liquid-nitrogen-cooled CCD (SPEC-10, Princeton) as a power detector. ML images of p-
P4A, m-P4A and p-P4A2 were directly extracted from the supplementary movies (Videos S1, S2, S4 and S5)
captured by a digital camera (Nikon D5100) with an AF-S Nikkor 35mm f/1.8G DX camera lens. This method
is similar to the one employed in previous report.3 Herein, the movies were transcribed by the camera in
Electronic Supplementary Material (ESI) for Chemical Science.This journal is © The Royal Society of Chemistry 2016

an automatic mode with a capturing speed of 29 frames per second. The image of the capital letters “AITL”
was captured by the Nikon D5100 digital camera in a manual mode. The corresponding parameters were
set up as follows: aperture value f/2, exposure time 26 s, ISO 1600 and exposure compensation +0.3. The
thermal behaviors were determined by DSC at heating and cooling rates of 10 °C/min under N2 atmosphere
using a NETZSCH thermal analyzer (DSC 204F1). Wide-angle XRD measurements were performed at 293 K
using a Bruker X-ray diffractometer (D8 ADVANCE, Germany) with an X-ray source of Cu Kα (λ= 0.15406 nm)
at 40 kV and 40 mA at a scan rate of 4° (2θ)/min. The fluorescence quantum yields of solid powders were
measured in air on an integrating sphere (HAMAMATSU C11347) with a 330 nm UV light as the excitation
source. The quantum chemistry calculations were performed at the B3LYP/6-31G (d, p) level of theory
using the DFT method in the Gaussian 09 software.
The single crystals of all the target compounds were isolated from the mixtures of ethanol and CH2Cl2
through the method of solvent evaporation. X-ray diffraction data for the single crystals were collected
from a Bruker Smart 1000 CCD with Cu-K radiation ( =1.54178 Å) at 150(10) K. All the structures were
solved using direct methods following the difference Fourier syntheses. All non-hydrogen atoms were
anisotropically refined through least-squares on F2 using the SHELXTL program suite. The anisotropic
thermal parameters were assigned to all non-hydrogen atoms. The hydrogen atoms attached to carbon
were placed in idealized positions and refined using a riding model to the atom from which they were
attached. The pictures of the structures were produced using Diamond 3.2. CCDC 1468361, 1468362,
1468363, 1468364, and 1468365 contain the supplementary crystallographic data of m-P4A, p-FP2A, p-P4A,
p-P4A2, p-P4Ac for this paper, respectively.
References1 X. Q. Zhang, Z. G. Chi, H. Y. Li, B. J. Xu, X. F. Li, W. Zhou, S. W. Liu, Y. Zhang and J. R. Xu., Chem.-Asian J. 2011,
6, 808.
2 P. M. Donovan and L. T. Scott., J. Am. Chem. Soc., 2003, 126, 3108.
3 S. M. Jeong, S. Song, S. Lee, and N. Y. Ha., Adv. Mater., 2013, 25, 6194.
2. Synthesis
O
Br
Pd(PPh3)4 , K2CO3 (2 M.aq.)
BHO
HO
Aliquat 336, Toluene, 80 oC, 16 h
O
CH3
CH3
p-P4Ac
O
Pd(PPh3)4 , K2CO3 (2 M.aq.)
BHO
HO
Aliquat 336, Toluene, 80 oC, 16 h
O
H
H
p-P4A
Pd(PPh3)4 , K3PO4
BHO
HO
1,4-Dioxane, 80 oC, 16 h
OH
m-P4A
O H
O
Pd(PPh3)4 , K2CO3 (2 M.aq.)
BHO
HO
Aliquat 336, Toluene, 80 oC, 16 h
O
H
p-FP2A
Br Br BHO
HOH
FBr2
O
Pd(PPh3)4 , K2CO3 (2 M.aq.)
BHO
HO
Aliquat 336, Toluene, 80 oC, 16 h
O
H HBr Br
O
H
p-P4A2P2Br2
Scheme 1. Synthetic routes of the target compounds.

Synthesis of 4-(1,2,2-triphenylvinyl)benzaldehyde (p-P4A) [1] (2-bromoethene-1,1,2-triyl)tribenzene (1.00 g, 2.98
mmol) and (4-formylphenyl)boronic acid (0.49 g, 3.28 mmol) were dissolved in toluene (30 mL), and then 2 M
aqueous K2CO3 solution (4.5 mL) and Aliquat 336 (5 drops) were added. The mixture was stirred for 40 min under
an argon atmosphere at room temperature. Then the Pd(PPh3)4 catalyst was added, and the reaction mixture
was stirred at 80 ˚C for 16 h. After cooling to room temperature, the product was concentrated and purified by
silica gel column chromatography with dichloromethane/n-hexane (v/v=1:3). Compound p-P4A was obtained as a
yellow crystalline solid in 97% yield (1.04 g). 1H NMR (300 MHz, CDCl3) δ (ppm): 9.90-9.87 (s, 1 H); 7.64-7.57 (d,
J=8.4 Hz, 2 H); 7.22-7.16 (d, J=8.1 Hz, 2 H); 7.15-7.05 (m, 9 H); 7.05-6.96 (m, 6 H). EI-MS, m/z: [M]+ 360; calcd for
C27H20O 360. HRMS, m/z: [M]+ 360.1511; calcd for C27H20O 360.1514. Anal. Calc. for C27H20O: C 89.97%, H 5.59%;
found: C 89.91%, H 5.63%.
Synthesis of 1-(4-(1,2,2-triphenylvinyl)phenyl)ethanone (p-P4Ac) (2-bromoethene-1,1,2-triyl) tribenzene (1.00g,
2.98 mmol) and (4-acetylphenyl)boronic acid (0.54 g, 3.28 mmol) were dissolved in toluene (30 mL), and then 2
M aqueous K2CO3 solution (4.5 mL) and Aliquat 336 (5 drops) were added. The mixture was stirred for 40 min
under an argon atmosphere at room temperature. Then the Pd(PPh3)4 catalyst was added and the reaction
mixture was stirred at 80 ˚C for 16 h. After cooling to room temperature, the product was concentrated and
purified by silica gel column chromatography with dichloromethane/n-hexane (v/v=1:3). p-P4Ac was obtained as
a white crystalline solid in 94% yield (1.05 g). 1H NMR (300 MHz, CDCl3) δ (ppm): 7.72-7.64 (d, J=8.1 Hz, 2 H); 7.16-
7.06 (m, 11 H); 7.05-6.95 (m, 6 H); 2.57-2.50 (s, 3 H). 13C NMR (100 MHz, CDCl3) δ (ppm): 191.79, 146.66, 144.20,
143.55, 143.50, 141.69, 140.19, 137.29, 135.09, 132.00, 131.35, 131.31, 130.34, 130.18, 128.02, 127.81, 127.76,
127.66, 127.34, 126.64, 126.59, 126.55, 126.50. FT-IR (KBr) υ (cm-1): 3056, 3022, 1675, 1600, 1490, 1441, 1263,
763, 699. EI-MS, m/z: [M]+ 374; calcd for C28H22O 374. HRMS, m/z: [M]+ 374.1662; calcd for C28H22O 374.1671.
Anal. Calc. for C28H22O: C 89.81%, H 5.92%; found: C 89.84%, H 5.96%.
Synthesis of 4-((9H-fluoren-9-ylidene)(phenyl)methyl)benzaldehyde (p-FP2A) FBr2 (1.00g, 2.97mmol),
benzeneboronic acid (0.40g, 3.27mmol) and (4-formylphenyl)boronic acid (0.49g, 3.27mmol) were dissolved in
toluene (30 mL), and then 2 M aqueous K2CO3 solution (4 mL) and Aliquat 336 (5 drops) were added. The mixture
was stirred for 40 min under an argon atmosphere at room temperature. Then the Pd(PPh3)4 catalyst was added
and the reaction mixture was stirred at 80 ˚C for 16 h. After cooling to room temperature, the product was
concentrated and purified by silica gel column chromatography with dichloromethane/n-hexane (v/v=1:2). p-
FP2A was obtained as a pale yellow crystalline solid in 46% yield (0.49 g). 1H NMR (300 MHz, CDCl3) δ (ppm):
10.13-10.00 (s, 1 H); 7.98-7.88 (d, J=8.0 Hz, 2 H); 7.73-7.65 (d, J=7.5 Hz, 2 H); 7.61-7.54 (d, J=8.3 Hz, 2 H); 7.46-
7.40 (m, 3 H); 7.39-7.34 (m, 2 H); 7.29-7.21 (t, 2 H); 6.96-6.89 (m, 2 H); 6.64-6.58 (d, J=8.0 Hz, 2 H). 13C NMR (100
MHz, CDCl3) δ (ppm): 191.76, 149.22, 143.31, 142.12, 140.83, 140.67, 138.35, 138.08, 135.80, 135.31, 130.51,
130.18, 129.65, 129.06, 128.55, 128.18, 126.64, 126.56, 125.05, 124.84, 119.48, 119.36. FT-IR (KBr) υ (cm-1): 3052,
2841, 1700, 1598, 1437, 737, 698. EI-MS, m/z: [M]+ 358; calcd for C27H18O 358. HRMS, m/z: [M]+ 358.1354; calcd
for C27H18O 358.1358. Anal. Calc. for C27H18O: C 90.47%, H 5.06%; found: C 90.42%, H 5.09%.
Synthesis of 3-(1,2,2-triphenylvinyl)benzaldehyde (m-P4A) (2-bromoethene-1,1,2-triyl)tribenzene (1.23 g, 3.67
mmol) and (3-formylphenyl)boronic acid (0.50 g, 3.33 mmol) were dissolved in 1,4-dioxane (30 mL), and then
potassium phosphate (1.72g, 8.10 mmol) were added. The mixture was stirred for 40 min under an argon
atmosphere at room temperature. Then the Pd(PPh3)4 catalyst was added and the reaction mixture was stirred at

80 ˚C for 16 h. After cooling to room temperature, the product was concentrated and purified by silica gel column
chromatography with dichloromethane/n-hexane (v/v=1:4). m-P4A was obtained as a white crystalline solid in 72%
yield (0.70 g). 1H NMR (300 MHz, CDCl3) δ (ppm): 9.81-9.76 (s, 1 H); 7.63-7.59 (dd, 1 H); 7.54-7.49 (s, 1 H); 7.33-
7.21 (m, 2 H); 7.15-7.07 (m, 9 H), 7.06-6.99 (m, 6 H). 13C NMR (100 MHz, CDCl3) δ (ppm): 192.20, 144.83, 143.10,
143.03, 142.86, 142.43, 139.45, 137.28, 136.12, 133.05, 131.26, 131.23, 131.15, 128.37, 127.90, 127.87, 127.72,
127.22, 126.82, 126.74. FT-IR (KBr) υ (cm-1): 3051, 2716, 2795, 1702, 1586, 1437, 755, 700. EI-MS, m/z: [M]+ 360;
calcd for C27H20O 360. HRMS, m/z: [M]+ 360.1508; calcd for C27H20O 360.1514. Anal. Calc. for C27H20O: C 89.97%,
H 5.59%; found: C 89.93%, H 5.61%.
Synthesis of 4,4'-(2,2-diphenylethene-1,1-diyl)dibenzaldehyde (p-P4A2) P2Br2 (1.00g, 2.97mmol) and (4-
formylphenyl)boronic acid (0.98 g, 6.51 mmol) were dissolved in toluene (30 mL), and then 2 M aqueous K2CO3
solution (8 mL) and Aliquat 336 (5 drops) were added. The mixture was stirred for 40 min under an argon
atmosphere at room temperature. Then the Pd(PPh3)4 catalyst was added and the reaction mixture was stirred at
80 ˚C for 16 h. After cooling to room temperature, the product was concentrated and purified by silica gel column
chromatography with dichloromethane/n-hexane (v/v=2:1). p-P4A2 was obtained as a yellow crystalline solid in
83% yield (1.09 g). 1H NMR (500 MHz, CDCl3) δ (ppm): 9.93-9.90 (s, 2 H); 7.66-7.63 (d, J=8.3 Hz, 4 H); 7.19-7.11 (m,
10 H); 7.04-6.99 (dd, J=7.9, 1.5 Hz, 4 H). 13C NMR (125 MHz, CDCl3) δ (ppm): 191.75, 149.62, 145.08, 142.37,
138.52, 134.59, 131.39, 131.21, 129.37, 128.03, 127.53.. FT-IR (KBr) υ (cm-1): 3058, 2800, 2744, 1694, 1597, 1564,
1208, 1166, 700. EI-MS, m/z: [M]+ 388; calcd for C28H20O2 388. HRMS, m/z: [M]+ 388.1454; calcd for C28H20O2
388.1463. Anal. Calc. for C28H20O2: C 86.57%, H 5.19%; found: C 86.52%, H 5.23%.
3. Figures and Tables
S
N NS
O O
SFPC
a
S
O
P4TA
b
TMPE
c
O O
O O
Fig. S1 Molecular structures of previously reported AIE-ML luminophores.
50 100 150 200
m-P4A
p-P4A2
Wavelength (nm)
End
o 180 oC
136 oC
(a)
0 10 20 30 40
Nor
mal
ized
Inte
nsity
2 (Deg)
p-P4A2-SC
p-P4A2-P
m-P4A-SC
m-P4A-P
(b)

Fig. S2 DSC curves (a) and XRD patterns (b) of m-P4A and p-P4A2. m-P4A-P, powder of m-P4A; m-P4A-SC,
single crystal of m-P4A; p-P4A2-P, powder of p-P4A2; p-P4A2-SC, single crystal of p-P4A2.
Fig. S3 Molecular packing and intermolecular interactions of p-P4A (a), m-P4A (b) and p-P4A2 (c) in their
single crystal structures
Fig. S4 The HOMO (lower images), LUMO (upper images), oscillator strengths (f) and dipolar moments of
the molecules in their single crystal structures. p-P4A-BSC1 and p-P4A-BSC2 are the two conformations of p-
P4A.

Table S1. Computed vertical transitions and their oscillator strengths.
Conformation Oscillator Strength (f) Transition Coefficients
0.3722 HOMO→LUMO 0.70088
0.0020 HOMO-2→LUMO 0.56951
HOMO-2→LUMO+1 0.16973
HOMO-1→LUMO -0.34159
0.1340 HOMO-3→LUMO 0.14718
HOMO-1→LUMO -0.10956
HOMO→LUMO+1 0.66590
0.0233 HOMO-3→LUMO 0.15269
HOMO-2→LUMO 0.32352
HOMO-1→LUMO 0.56620
HOMO→LUMO+1 0.10796
p-P4A-BSC1 a
HOMO→LUMO+2 0.11371
0.0004 HOMO-1→LUMO 0.67912
HOMO-1→LUMO+1 -0.14246
0.3270 HOMO→LUMO 0.69801
0.0939 HOMO-2→LUMO 0.49176
HOMO→LUMO+1 0.48536
0.1160 HOMO-3→LUMO 0.36658
HOMO-2→LUMO 0.42717
p-P4A-BSC2 a
HOMO→LUMO+1 -0.39175
0.0152 HOMO→LUMO 0.69946
0.0007 HOMO-4→LUMO 0.67992
HOMO-4→LUMO+1 0.10950
0.3357 HOMO→LUMO+1 0.70038
0.0157 HOMO-2→LUMO -0.11298
HOMO-1→LUMO 0.61379
HOMO-1→LUMO+1 -0.14060
m-P4A
HOMO-1→LUMO+2 -0.25398
0.3146 HOMO→LUMO 0.68955
HOMO→LUMO+1 -0.13006
0.2413 HOMO→LUMO 0.12768
HOMO→LUMO+1 0.68562
0.0000 HOMO-3→LUMO -0.12430
HOMO-2→LUMO 0.48977
HOMO-2→LUMO+1 0.34096
HOMO-2→LUMO+3 0.14894
HOMO-1→LUMO -0.21991
HOMO-1→LUMO+1 -0.14811
0.0020 HOMO-4→LUMO -0.37880
p-P4A2
HOMO-4→LUMO+1 0.51392

HOMO-3→LUMO 0.12952
HOMO-3→LUMO+1 -0.17444a p-P4A-BSC1 and p-P4A-BSC2 are the two conformations of p-P4A.
350 400 450 500 550 600 6500
100
200
300
400
500
0 20 40 60 80 1000
100
200
300
400
500
PL In
tens
ity (a
.u.)
Water Fraction (%)
PL In
tens
ity (a
.u.)
Wavelength (nm)
0 20 40 60 80 90 95
Water Fraction (%)(a)
300 400 500 600 700 8000.0
0.5
1.0
1.5
PL In
tens
ity (a
.u.)
Wavelength (nm)
0 20 40 60 80 90 95
Water Fraction (%)
(b)
Fig. S5 PL (a) and UV-visible (b) spectra of p-P4A2 in the mixtures of THF/water with different water
contents. The inset of (a) are the changes of peak intensities (upper) of the PL spectra and the fluorescence
images (lower) of p-P4A2 in pure THF and in the mixtures of THF/water with 95% water fraction. The PL
spectra were recorded under the excitation of 365 nm UV light.
300 400 500 6000
25
50
75
0 20 40 60 80 100
0
20
40
60
80
PL In
tens
ity (a
.u.)
Water Fraction (%)
0 20 40 60 80 90 95
Water Fraction (%)
Inte
nsity
(a.u
.)
Wavelength (nm)
(a)
300 400 500 600 700 8000.0
0.5
1.0
1.5
PL In
tens
ity (a
.u.)
Wavelength (nm)
0 20 40 60 80 90 95
Water Fraction (%)
(b)
Fig. S6 PL (a) and UV-visible (b) spectra of m-P4A in the mixtures of THF/water with different water
contents. The inset of (a) are the changes of peak intensities (upper) of the PL spectra and the fluorescence
images (lower) of m-P4A in pure THF and in the mixtures of THF/water with 95% water fraction. The PL
spectra were recorded under the excitation of 365 nm UV light.
Table S2 Effective diameter and polydispersity of the compounds in THF/water mixtures.a
Compound Effective Diameter (nm) Polydispersityp-P4A 326.36 0.161p-P4A2 395.68 0.176m-P4A 339.06 0.179
a In THF/water mixtures with 95% water content.

280 300 320 3400
10
20
30
40
Num
ber P
erce
ntag
e (%
)
Diameter (nm)
p-P4A
(a)
250 300 350 400 450 500 550 6000
10
20
30
40
50(b)
Num
ber P
erce
ntag
e (%
)
Diameter (nm)
p-P4A2
250 300 350 400 4500
10
20
30
40(c)
Num
ber P
erce
ntag
e (%
)
Diameter (nm)
m-P4A
Fig. S7 The particle diameter distributions of the compounds in THF/water mixtures with 95% water
content.
0 10 20 30 40
f
e
d
b
c
Nor
mal
ized
Inte
nsity
2 (Deg)
a
Fig. S8 XRD patterns of the original and ground samples of the compounds. a, Original sample of p-P4A; b, ground sample of p-P4A; c, original sample of m-P4A; d, ground sample of m-P4A; e, original sample of p-P4A2; f, ground sample of p-P4A2.

4. Structural Information
4.04.55.05.56.06.57.07.58.08.59.09.510.010.511.0δ (ppm)
6.01
9.02
2.03
1.98
0.97
Fig. S9 1H NMR spectrum of p-P4A in CDCl3
Instrument:DSQ(Thermo)Ionization Method:EID:\DSQ\DATA-LR\14\090403 9/4/2014 3:46:47 PM P4A
090403 #49 RT: 1.27 AV: 1 NL: 2.73E5T: + c Full ms [45.00-800.00]
50 100 150 200 250 300 350 400 450m/z
0
5
10
15
20
25
30
35
40
45
50
55
60
65
70
75
80
85
90
95
100
Rel
ativ
e A
bund
ance
253
126
149 360239
57 165
69 11328291
95 176 226138 269215 289 315
202 331345
Fig. S10 EI-MS of p-P4A

Instrument:MAT 95XP(Thermo)D:\DATA-HR\15\032401-p-p4a-c1 3/24/2015 3:30:19 PM p-P4A
032401-p-p4a-c1 #22 RT: 0.95 AV: 1 NL: 3.68E4T: + c EI Full ms [ 353.50-364.50]
359.5 359.6 359.7 359.8 359.9 360.0 360.1 360.2 360.3 360.4 360.5 360.6 360.7 360.8m/z
0
5
10
15
20
25
30
35
40
45
50
55
60
65
70
75
80
85
90
95
100
Rel
ativ
e A
bund
ance
360.1511
Fig. S11 HRMS of p-P4A
2.02.53.03.54.04.55.05.56.06.57.07.5δ (ppm)
3.02
6.00
10.9
9
1.98
Fig. S12 1H NMR spectrum of p-P4Ac in CDCl3
0102030405060708090100110120130140150160170180190200δ (ppm)
26.5
0
126.
7612
6.91
127.
7112
7.78
127.
8713
1.26
134.
99
139.
89
149.
02
197.
69
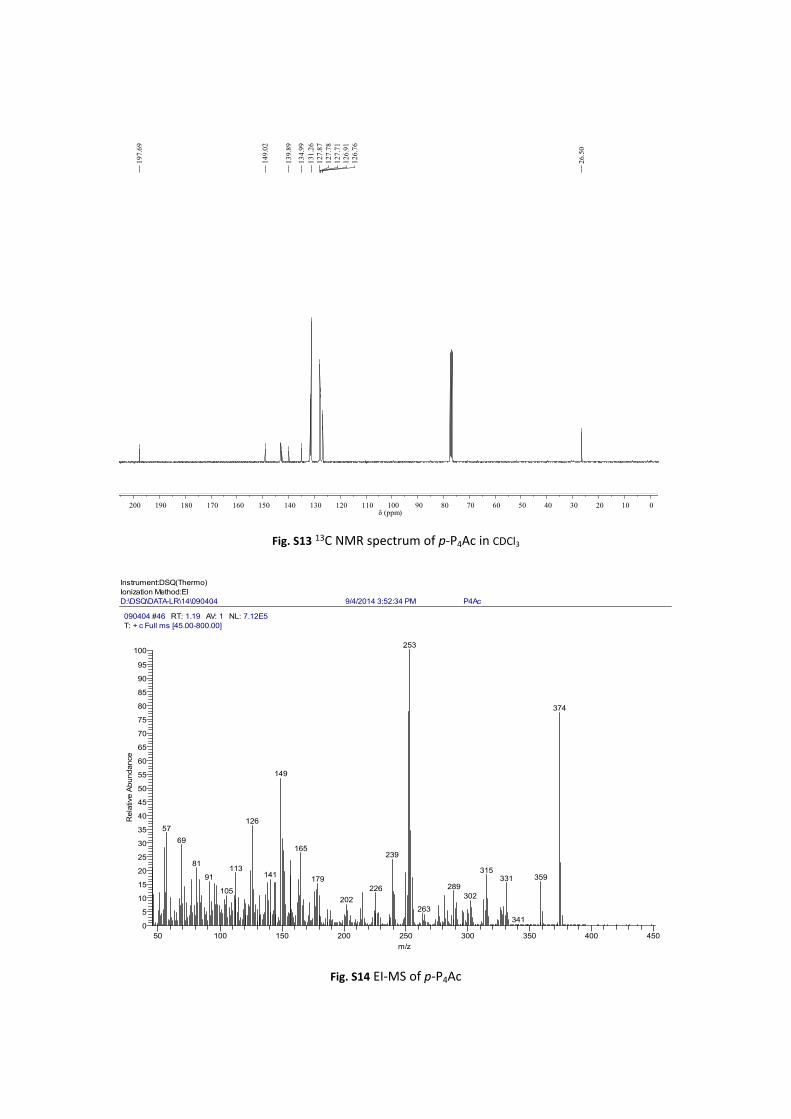
Fig. S13 13C NMR spectrum of p-P4Ac in CDCl3
Instrument:DSQ(Thermo)Ionization Method:EID:\DSQ\DATA-LR\14\090404 9/4/2014 3:52:34 PM P4Ac
090404 #46 RT: 1.19 AV: 1 NL: 7.12E5T: + c Full ms [45.00-800.00]
50 100 150 200 250 300 350 400 450m/z
0
5
10
15
20
25
30
35
40
45
50
55
60
65
70
75
80
85
90
95
100
Rel
ativ
e A
bund
ance
253
374
149
12657
69165
23981
113 31514191 359331179289226105
302202263
341
Fig. S14 EI-MS of p-P4Ac

Instrument:MAT 95XP(Thermo)D:\DATA-HR\15\032405-p4ac-c1 3/24/2015 4:48:43 PM P4Ac
032405-p4ac-c1 #15 RT: 0.56 AV: 1 NL: 3.24E4T: + c EI Full ms [ 372.50-393.70]
373.4 373.5 373.6 373.7 373.8 373.9 374.0 374.1 374.2 374.3 374.4 374.5 374.6 374.7 374.8m/z
0
5
10
15
20
25
30
35
40
45
50
55
60
65
70
75
80
85
90
95
100
Rel
ativ
e A
bund
ance
374.1662
Fig. S15 HRMS of p-P4Ac
4000 3500 3000 2500 2000 1500 1000 500
0
20
40
60
80
100
Tran
smitt
ance
(%)
Wavenumber (cm-1)
3056 3022
1675
1600
14901441
1268
763
699
Fig. S16 FT-IR spectrum of p-P4Ac

4.55.05.56.06.57.07.58.08.59.09.510.010.511.0δ (ppm)
2.01
2.02
0.99
1.06
2.01
3.00
2.00
2.02
2.01
1.00
Fig. S17 1H NMR spectrum of p-FP2A in CDCl3
100105110115120125130135140145150155160165170175180185190195200205δ (ppm)
119.
3611
9.48
124.
8412
5.05
126.
5612
6.64
128.
18
129.
0613
5.31
135.
8013
8.08
140.
6714
0.83
142.
1214
3.31
149.
22
191.
76
Fig. S18 13C NMR spectrum of p-FP2A in CDCl3

Instrument:DSQ(Thermo)Ionization Method:EID:\DSQ\DATA-LR\14\042804 4/28/2014 3:33:34 PM W2A
042804 #82 RT: 2.12 AV: 1 NL: 1.08E8T: + c Full ms [45.00-800.00]
50 100 150 200 250 300 350 400 450m/z
0
5
10
15
20
25
30
35
40
45
50
55
60
65
70
75
80
85
90
95
100R
elat
ive
Abu
ndan
ce358
253
329
163150
313
143 300281179 224125 34326320077 23711210051
Fig. S19 EI-MS of p-FP2A
Instrument:MAT 95XP(Thermo)D:\DATA-HR\15\032404-fp2a-c1 3/24/2015 4:15:01 PM FP2A
032404-fp2a-c1 #18 RT: 0.46 AV: 1 NL: 4.42E4T: + c EI Full ms [ 353.50-364.50]
357.5 357.6 357.7 357.8 357.9 358.0 358.1 358.2 358.3 358.4 358.5 358.6 358.7 358.8 358.9 359.0m/z
0
5
10
15
20
25
30
35
40
45
50
55
60
65
70
75
80
85
90
95
100
Rel
ativ
e A
bund
ance
358.1354
Fig. S20 HRMS of p-FP2A

4000 3500 3000 2500 2000 1500 1000 500
0
20
40
60
80
100Tr
ansm
ittan
ce (%
)
Wavenumber (cm-1)
3052
2841
1700
15981437
737
698
Fig. S21 FT-IR spectrum of p-FP2A
5.86.26.67.07.47.88.28.69.09.49.810.210.611.0f1 (ppm)
6.02
9.01
0.22
1.80
1.02
1.00
0.94
Fig. S22 1H NMR spectrum of m-P4A in CDCl3

0102030405060708090100110120130140150160170180190200210f1 (ppm)
126.
7412
6.82
127.
2212
7.72
127.
8712
7.90
128.
3713
1.15
131.
2313
1.26
133.
0513
6.12
137.
2813
9.45
142.
4314
2.86
143.
0314
3.10
144.
83
192.
20
Fig. S23 13C NMR spectrum of m-P4A in CDCl3
Instrument:DSQ(Thermo)Ionization Method:EID:\DSQ\DATA-LR\14\042402 4/24/2014 5:32:52 PM m-P4A
042402 #57 RT: 1.47 AV: 1 NL: 9.92E5T: + c Full ms [45.00-800.00]
50 100 150 200 250 300 350 400 450m/z
0
5
10
15
20
25
30
35
40
45
50
55
60
65
70
75
80
85
90
95
100
Rel
ativ
e A
bund
ance
360105
182
253
16777
152
27312657
2399169 28197 265 331141 31583
Fig. S24 EI-MS of m-P4A

Instrument:MAT 95XP(Thermo)D:\DATA-HR\15\032402-m-p4a-c1 3/24/2015 3:37:29 PM m-P4A
032402-m-p4a-c1 #22 RT: 0.63 AV: 1 NL: 2.60E4T: + c EI Full ms [ 353.50-364.50]
359.5 359.6 359.7 359.8 359.9 360.0 360.1 360.2 360.3 360.4 360.5 360.6 360.7 360.8 360.9m/z
0
5
10
15
20
25
30
35
40
45
50
55
60
65
70
75
80
85
90
95
100R
elat
ive
Abu
ndan
ce360.1508
Fig. S25 HRMS of m-P4A
4000 3500 3000 2500 2000 1500 1000 500
0
20
40
60
80
100
Tran
smitt
ance
(%)
Wavenumber (cm-1)
3051 2716
2795
1702
1586
1487
700
755
Fig. S26 FT-IR spectrum of m-P4A

4.04.55.05.56.06.57.07.58.08.59.09.510.010.511.0f1 (ppm)
4.01
10.0
5
4.00
2.00
CH2Cl2
Fig. S27 1H NMR spectrum of p-P4A2 in CDCl3
60708090100110120130140150160170180190200210f1 (ppm)
127.
5312
8.03
129.
3713
1.21
131.
9313
4.59
138.
5214
2.37
145.
08
149.
62
191.
75
Fig. S28 13C NMR spectrum of p-P4A2 in CDCl3

Instrument:DSQ(Thermo)Ionization Method:EID:\DSQ\DATA-LR\14\052302 5/23/2014 3:50:14 PM P4A2
052302 #98 RT: 2.52 AV: 1 NL: 9.57E7T: + c Full ms [45.00-800.00]
50 100 150 200 250 300 350 400 450m/z
0
5
10
15
20
25
30
35
40
45
50
55
60
65
70
75
80
85
90
95
100R
elat
ive
Abu
ndan
ce388
253
389
252
254239126 315145 156 390331289176 359282119 22621577 19491
Fig. S29 EI-MS of p-P4A2
Instrument:MAT 95XP(Thermo)D:\DATA-HR\15\032406-p4a2-c1 3/24/2015 4:51:02 PM P4A2
032406-p4a2-c1 #15 RT: 0.37 AV: 1 NL: 9.81E4T: + c EI Full ms [ 379.50-393.70]
387.4 387.5 387.6 387.7 387.8 387.9 388.0 388.1 388.2 388.3 388.4 388.5 388.6 388.7 388.8 388.9m/z
0
5
10
15
20
25
30
35
40
45
50
55
60
65
70
75
80
85
90
95
100
Rel
ativ
e A
bund
ance
388.1454
Fig. S30 HRMS of p-P4A2

4000 3500 3000 2500 2000 1500 1000 500
20
40
60
80
100
Tran
smitt
ance
(%)
Wavenumber (cm-1)
3058
2800 2744
1694
1597
1208
1166
700
1564
Fig. S31 FT-IR spectrum of p-P4A2