Embed Size (px)
Citation preview
Business review KONE’s Extraordinary General Meeting 2013
December 2, 2013
Matti Alahuhta, President & CEO

January–September 2013: Strong growth in a
challenging environment
1–9/2013 1–9/2012 Historical
change Comparable
change
Orders received MEUR 4,677.8 4,174.9 12.0% 13.5%
Order book MEUR 5,642.1 5,283.7 6.8% 12.2%
Sales MEUR 4,899.6 4,419.1 10.9% 12.4%
Operating income (EBIT) MEUR 660.7 571.3 1) 15.6%
Operating income (EBIT) % 13.5 12.9 1)
EBITA MEUR 675.7 597.2 1) 13.2%
EBITA % 13.8 13.5 1)
Cash flow from operations
(before financing
items and taxes)
MEUR 972.2 804.2
Comparative figures for 2012 have been restated according to the revised IAS 19 `Employee Benefits´.
1) Excluding a MEUR 37.3 one-time cost related to the support function development and cost adjustment programs.
2 ©KONE Corporation | December 2, 2013 | EGM 2013
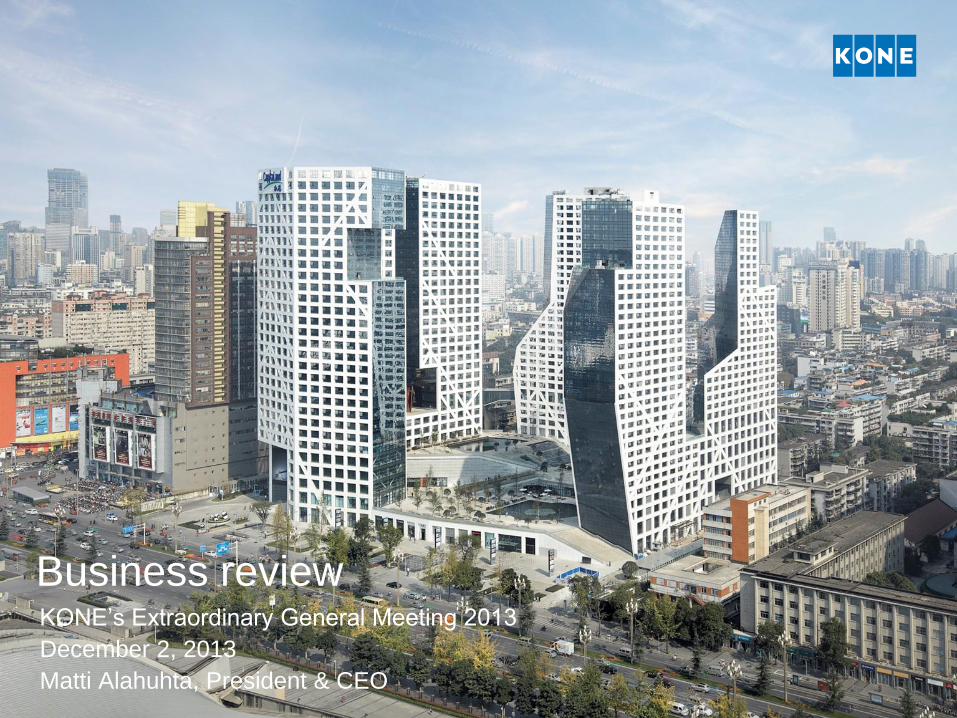
Q3 2013 Orders received: Significant growth in
Asia-Pacific and Americas, Europe impacted by delays
in project awards
MEUR
1,500
2,000
500
1,000
0
2.4%
8.2% 25.4%
Q4 Q3
1,327
Q2
1,638
Q1
1,712
2005 2013 2005 2013 2005 2013
3 ©KONE Corporation | December 2, 2013 | EGM 2013

Q3 2013 Sales: Good growth rates in new
equipment and maintenance
MEUR
1,500
2,000
1,000
500
0
6.5% 14.1%
12.7%
Q4 Q3
1,739
Q2
1,762
Q1
1,399
2005 2013 2005 2013 2005 2013
4 ©KONE Corporation | December 2, 2013 | EGM 2013

Operating income excluding one-time items.
Comparative figures for 2012 have been restated according to the revised IAS 19 `Employee Benefits´.
Q3 2013 Operating income: Strong new equipment
sales growth in Asia and positive development in global
service business key contributors to EBIT growth MEUR
258
243
160
0
20
40
60
80
100
120
140
160
180
200
220
240
260
280
13.7%
15.5%
19.2%
Q4 Q3 Q2 Q1 2005 2013 2005 2013 2005 2013
5 ©KONE Corporation | December 2, 2013 | EGM 2013
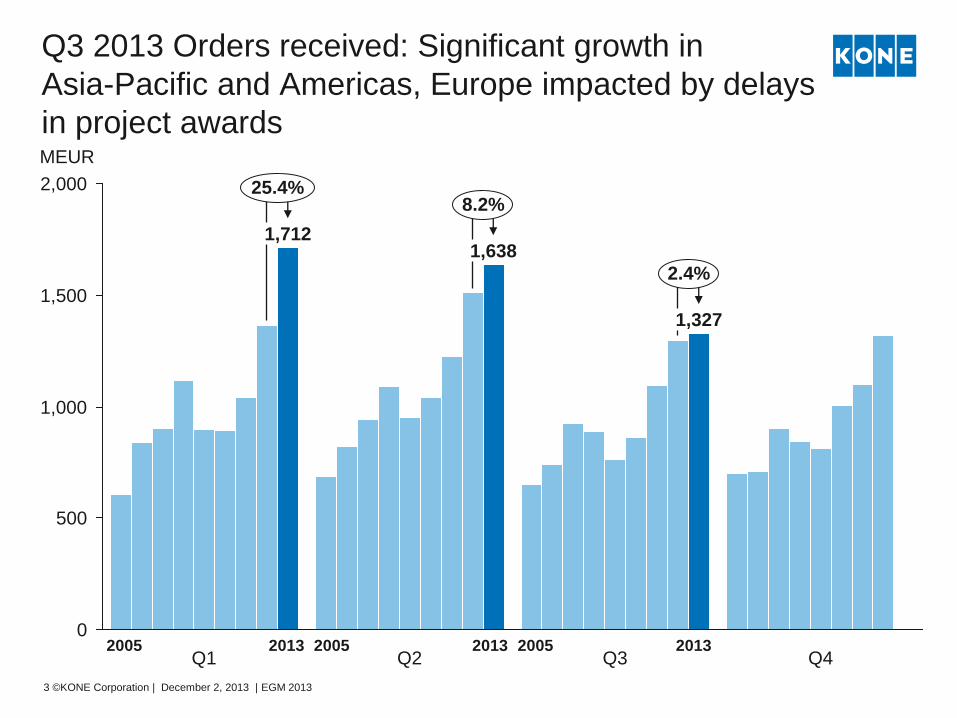
January–September 2013: The share of new
equipment business of total sales grew further
(1‒9/2012 figures in brackets)
EMEA = Europe, Middle East, Africa
53%
(50%)
47%
(50%)
New equipment
Service
16%
(16%)
39%
(35%) 45%
(49%)
Americas
Asia-Pacific
EMEA
Sales by business Sales by market
6 ©KONE Corporation | December 2, 2013 | EGM 2013
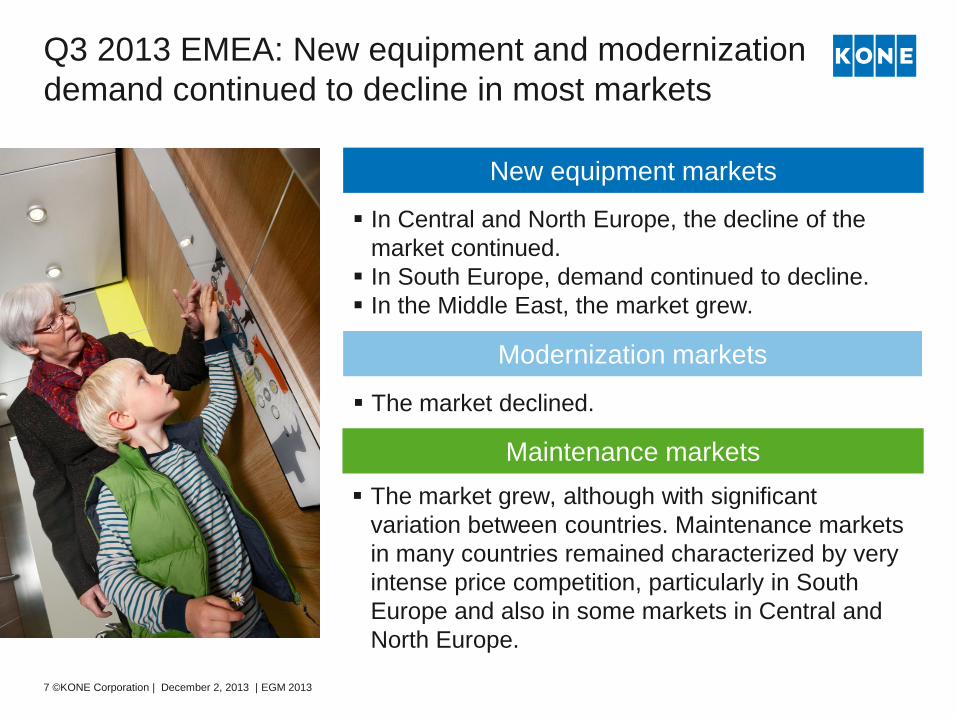
Q3 2013 EMEA: New equipment and modernization
demand continued to decline in most markets
Maintenance markets
New equipment markets
Modernization markets
The market grew, although with significant
variation between countries. Maintenance markets
in many countries remained characterized by very
intense price competition, particularly in South
Europe and also in some markets in Central and
North Europe.
The market declined.
In Central and North Europe, the decline of the
market continued.
In South Europe, demand continued to decline.
In the Middle East, the market grew.
7 ©KONE Corporation | December 2, 2013 | EGM 2013

Q3 2013 North America: Continued growth in new
equipment, modernization and maintenance demand
Maintenance markets
New equipment markets
Modernization markets
The market grew, but price competition remained
intense, particularly in the non-residential
segments.
The market grew.
In the United States, growth continued, driven by
both smaller and larger projects in the residential
and office segments.
In Canada, the market was stable.
In Mexico, demand declined.
8 ©KONE Corporation | December 2, 2013 | EGM 2013

Q3 2013 Asia-Pacific: Growth continued but at a
lower rate than in H1 2013 in line with expectations
In China, demand grew, although the market
growth rate decelerated, as expected, from the
higher level of H1 2013.
In India, market growth continued driven mainly
by the residential segment.
In Australia, demand continued to grow.
In Southeast Asia, markets continued to grow.
The market continued to grow.
Maintenance markets
New equipment markets
Modernization markets
The modernization market in Australia
saw some growth.
9 ©KONE Corporation | December 2, 2013 | EGM 2013

KONE’s estimated market share
globally (in new equipment units)
Asia-Pacific has been the driver for new
equipment market growth in 2007‒2012
12% KONE’s estimated market share
globally (in new equipment units) 18%
New elevators and escalators in 2007:
495,000 units
New elevators and escalators in 2012:
670,000 units
Based on KONE’s estimate.
EMEA = Europe, Middle East, Africa. 10 ©KONE Corporation | December 2, 2013 | EGM 2013
8 %
4 %
3 %
65 %
3 %
17 %
Rest of APAC
China
Japan and Korea
South America
North America
EMEA
10 %
10 %
36 %
7 %
34 %
3 %

KONE’s maintenance base
(in units)
EMEA continues to represent ~50% of the
global E&E maintenance base
~650,000 KONE’s maintenance base
(in units) >900,000
Elevators and escalators in operation
in 2007: ~9 million units
Elevators and escalators in operation
in 2012: >11 million units
11 ©KONE Corporation | December 2, 2013 | EGM 2013
Based on KONE’s estimate.
EMEA = Europe, Middle East, Africa.
Market size for 2007 has been revised from 8.7 million units to ~9 million units. The share of
EMEA has been revised from 58% to 55% and the share of APAC combined from 25% to 28%.
6 %
10 %
21 %
4 %
10 %
49 %
Rest of APAC
China
Japan and Korea
South America
North America
EMEA
6 %
11 %
5 %
11 %
55 %
12 %

Sales by market 2005–2012 (MEUR)
2012
6,277
35%
16%
49%
2011
5,225
27%
18%
55%
2010
4,987
21%
21%
58%
2009
4,744
17%
21%
62%
2008
4,603
16%
19%
65%
2007
4,079
14%
21%
65%
2006
3,601
13%
22%
65%
2005*
3,242
12%
22%
66%
Asia-Pacific Americas EMEA
CAGR,%
*) 2005 figures are pro forma
9.9%
5.3%
5.3%
27.6%
12 ©KONE Corporation | December 2, 2013 | EGM 2013

Sales by business 2005–2012 (MEUR)
6 277
34%
16%
50%
2011
5,225
37%
17%
46%
2010
4,987
37%
17%
46%
2009
4,744
34%
19%
47%
2008
4,603
2012
33%
19%
48%
2007
4,079
36%
19%
45%
2006
3,601
40%
19%
41%
2005*
3,242
41%
19%
40%
Maintenance Modernization New equipment
CAGR,%
9.9%
7.4%
6.9%
13.5%
*) 2005 figures are pro forma 13 ©KONE Corporation | December 2, 2013 | EGM 2013
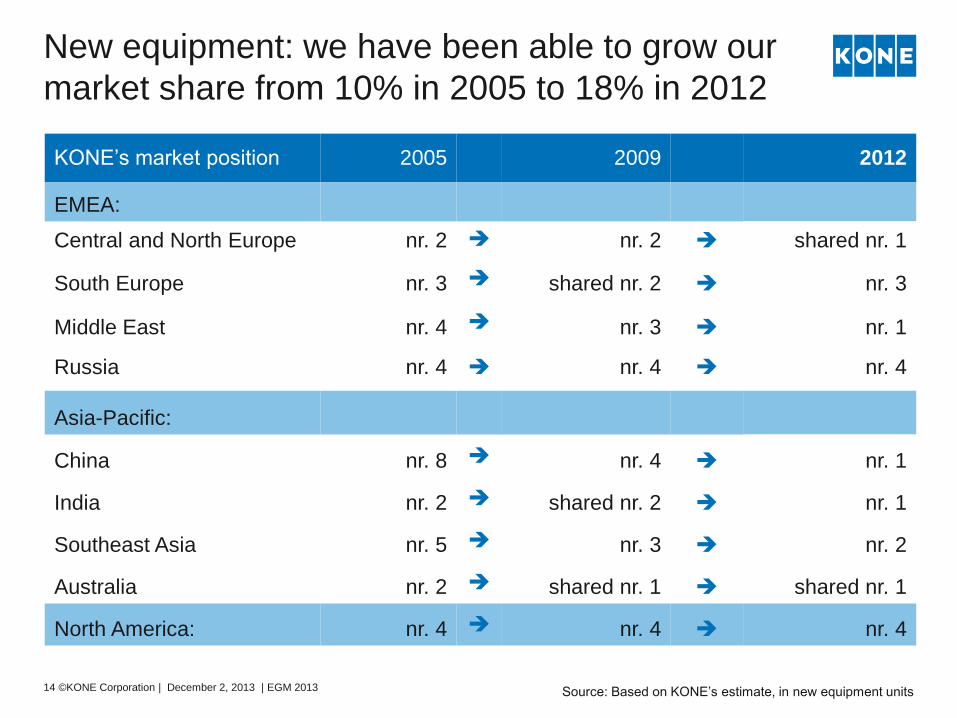
New equipment: we have been able to grow our
market share from 10% in 2005 to 18% in 2012
KONE’s market position 2005 2009 2012
EMEA:
Central and North Europe nr. 2 nr. 2 shared nr. 1
South Europe nr. 3 shared nr. 2 nr. 3
Middle East nr. 4 nr. 3 nr. 1
Russia nr. 4 nr. 4 nr. 4
Asia-Pacific:
China nr. 8 nr. 4 nr. 1
India nr. 2 shared nr. 2 nr. 1
Southeast Asia nr. 5 nr. 3 nr. 2
Australia nr. 2 shared nr. 1 shared nr. 1
North America: nr. 4 nr. 4 nr. 4
Source: Based on KONE’s estimate, in new equipment units 14 ©KONE Corporation | December 2, 2013 | EGM 2013
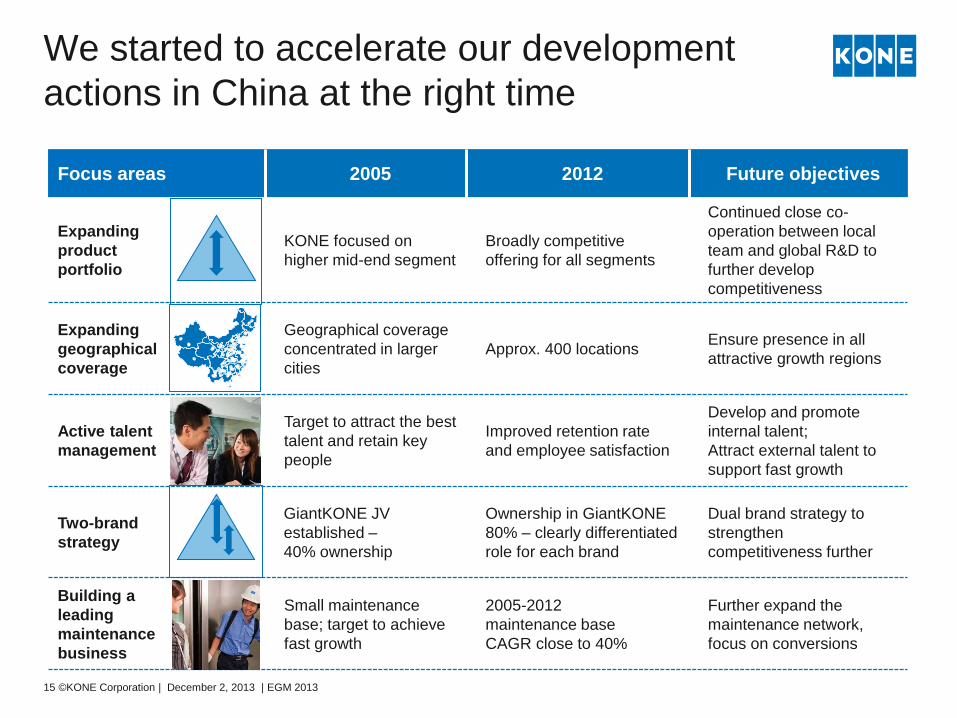
We started to accelerate our development
actions in China at the right time
Focus areas 2005 2012 Future objectives
Expanding
product
portfolio
KONE focused on
higher mid-end segment
Broadly competitive
offering for all segments
Continued close co-
operation between local
team and global R&D to
further develop
competitiveness
Expanding
geographical
coverage
Geographical coverage
concentrated in larger
cities
Approx. 400 locations Ensure presence in all
attractive growth regions
Active talent
management
Target to attract the best
talent and retain key
people
Improved retention rate
and employee satisfaction
Develop and promote
internal talent;
Attract external talent to
support fast growth
Two-brand
strategy
GiantKONE JV
established –
40% ownership
Ownership in GiantKONE
80% – clearly differentiated
role for each brand
Dual brand strategy to
strengthen
competitiveness further
Building a
leading
maintenance
business
Small maintenance
base; target to achieve
fast growth
2005-2012
maintenance base
CAGR close to 40%
Further expand the
maintenance network,
focus on conversions
15 ©KONE Corporation | December 2, 2013 | EGM 2013
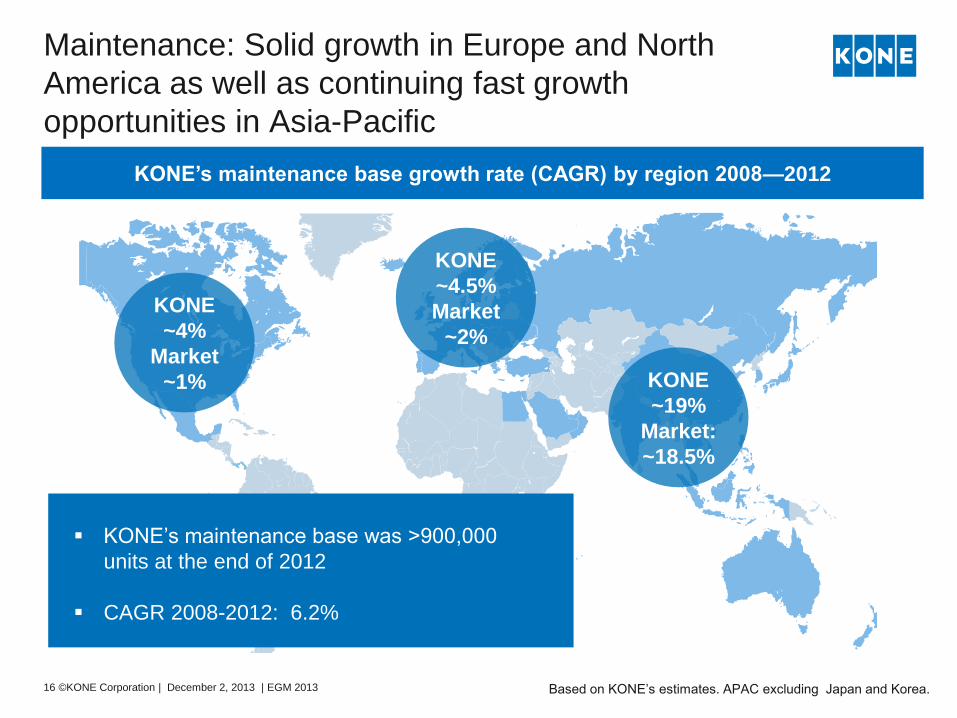
Maintenance: Solid growth in Europe and North
America as well as continuing fast growth
opportunities in Asia-Pacific
KONE’s maintenance base growth rate (CAGR) by region 2008—2012
KONE
~4%
Market
~1%
KONE
~4.5%
Market
~2%
KONE
~19%
Market:
~18.5%
KONE’s maintenance base was >900,000
units at the end of 2012
CAGR 2008-2012: 6.2%
Based on KONE’s estimates. APAC excluding Japan and Korea. 16 ©KONE Corporation | December 2, 2013 | EGM 2013

Modernization: we aim to capture the significant
untapped modernization potential in Europe and
North America
Of which
at least
20 years
old
Over 50%
Total
European
installed
base
5.3M
Of which
at least
20 years
old
0.1M
Total
Chinese
installed
base
2.4M
Of which
at least
20 years
old
Over 50%
Total US
installed
base
1.0M
Comparison of the age of installed E&E base by
region, end of 2012
We are focused on capturing the
opportunity
Increased focus on
developing modernization
sales capabilities and
tools
Developing a more
granular understanding of
growth opportunities
Further improved
competitiveness in the full
replacement segment
with new volume elevator
offering
Europe United States China
17 ©KONE Corporation | December 2, 2013 | EGM 2013

Continued good progress with our Development
Programs – case Innovative Solutions for
People FlowTM
Service Leadership
Innovative Solutions
for People FlowTM
Employee Engagement
Customer Experience
Delivery Chain Excellence
1. Launch of innovative KONE
UltraRopeTM hoisting technology
2. Roll-out of global volume elevator
offering progressed according to
plans
3. Launch of new escalator offering
with further improved energy
efficiency and versatile design
options
In addition, KONE was ranked number
37 in the ranking of most innovative
companies in the world by Forbes
18 ©KONE Corporation | December 2, 2013 | EGM 2013

The market in Asia-Pacific is expected to grow clearly.
The market in China is expected to grow by 10–15 %
in 2013.
The market in Central and North Europe is expected
to decline and the market in South Europe to decline
further from an already weak level.
The market in North America is expected to continue
to grow.
The maintenance market is expected to continue to
develop rather well in most countries.
Maintenance markets
New equipment markets
Modernization markets
The modernization market is expected to be at about
the same level as in 2012 or decline slightly.
Market outlook 2013
19 ©KONE Corporation | December 2, 2013 | EGM 2013
Business outlook 2013
KONE’s net sales is estimated to grow by
11–14% at comparable exchange rates as
compared to 2012.
The operating income (EBIT) is expected to
be in the range of EUR 920–955 million,
assuming that translation exchange rates do
not materially deviate from the situation of
the beginning of September 2013.
Sales
Operating income
20 ©KONE Corporation | December 2, 2013 | EGM 2013

Board of Directors proposes an extra dividend
and a share issue without payment (split)
Extra dividend of EUR 1.30 per B share and EUR 1.295 per A share
The proposed extra dividend would amount to EUR 332.8 million in
total
Number of shares to be increased by issuing new shares to the
shareholders without payment in proportion to their holdings
Ratio of 1 for 1 for both classes of shares
New shares issued will not be entitled to the proposed extra dividend
Proposed extra dividend
Proposed share issue without payment (split)
21 ©KONE Corporation | December 2, 2013 | EGM 2013